kinetics of oxidation on single-crystal pd, pt, and ir files/084_jpc_92_88_5213... · paul j....
TRANSCRIPT
J . Phys. Chem. 1988, 92, 5213-5221 5213
Acknowledgment. This work was Supported by the Department of Energy, Basic Energy Sciences (Grant DE-FG02-84ER13289). C.M.F. and J.T.R. thank R. J. Madix for allowing us the use of his high-resolution electron energy loss spectrometer.
results in the stabilization of ethyl thiolate with respect to C-S bond cleavage. Low-temperature C-S bond cleavage at low ex- posure ultimately results in nonselective decomposition to surface carbon and sulfur. At high coverage, the activation energy for decomposition becomes sufficiently high so that hydrocarbon formation competes effectively with nonselective decomposition. Registry No. Mo, 7439-98-7; C2H5SH, 75-08-1.
Kinetics of CO Oxidation on Single-Crystal Pd, Pt, and I r
Paul J. Berlowitz,+ Charles H. F. Peden,* and D. Wayne Goodman
Sandia National Laboratories, Albuquerque, New Mexico 871 85 (Received: January 12, 1988)
The activity of Pt( loo), Pd( 1 lo), Ir( 1 1 l) , and Ir( 110) single-crystal catalysts for CO oxidation has been studied as a function of temperature and partial pressure of O2 and CO in a high-pressure reactor-ultra-high-vacuum surface analysis apparatus over the temperature range 425-725 K and pressure range 0.1-600 Torr. The specific rates and the partial pressure dependencies determined for the single crystals are in excellent agreement with results obtained previously for high surface area supported catalysts, demonstrating the structure insensitivity of this reaction. The single-crystal catalysts exhibit simple Arrhenius behavior over most of the temperature range studied, and the observed activation energies lie between 22 and 33 kcal/mol, close to the desorption energy of CO from these surfaces. These results are consistent with the generally accepted model in which the surface is primarily covered with CO and the reaction rate is controlled by the desorption of CO. Deviation from Arrhenius behavior below 500 K for Pt is interpreted as a change in the reaction mechanism. Under highly oxidizing conditions surfaces of both Pd and Ir show negative-order dependence on O2 partial pressure, indicating the presence of a strongly bound oxygen species. The oxygen species was similar to surface oxide formed by deliberate oxidation and could be detected as C 0 2 desorbing at high temperatures in postreaction temperature-programmed desorption. Oxide formed by oxidation of the Pd and Ir samples prior to high-pressure reaction was only stable to 475 K on Pd(ll0) in an 11:l 02:C0 mixture and to 500 K on Ir(ll1) in an 8O:l O2:CO mixture. Deliberate oxidation resulted in a rate decrease but did not affect the activation energy significantly, indicating that the oxide served merely as a simple site blocker. Negative-order dependence in O2 pressure was not observed for Pt, which could not be oxidized under reaction conditions.
Introduction The oxidation of CO by O2 over group VI11 metal catalysts
has been the subject of a large body of ultra-high-vacuum (UHV) surface science and high-pressure catalysis work due to its im- portance in pollution control.' Currently, the removal of CO as C 0 2 from automobile exhaust is accomplished by catalytic con- verters which employ a supported Pt, Pd, and Rh catalyst. This has led to numerous recent studies of the kinetics of this reaction on supported metal catalyst^^-^ and transient kinetic studies on polycrystalline foils,*-13 which have sought to identify and quantify the parameters of the elementary mechanistic steps in CO oxi- dation.
The relative simplicity of this reaction makes CO oxidation an ideal model system of a heterogeneous catalytic reaction. Each of the mechanistic steps, adsorption and desorption of the reactants, surface reaction, and desorption of products, has been probed extensively with surface science techniques, as has the interaction between adsorbed 0 atoms and CO molecule^.'^^^ These studies have provided essential information necessary for understanding the elementary processes which occur in C O oxidation.
Recent reviews by Engel and Ertl have summarized most of the chemisorption and low-pressure catalytic findings2* In general, the reaction proceeds through a Langmuir-Hinshelwood mechanism involving adsorbed CO and 0 atoms. Under reaction conditions typical in most high-pressure supported catalyst studies, and most low-pressure (UHV) studies on model catalysts, the surface is almost entirely covered by CO, and the reaction rate is determined by the rate of desorption of CO. As first determined by Langmuir for Pt wire catalysts,29 the observed activation energy is close to the binding energy of adsorbed CO. Oxygen can only adsorb at sites where CO has desorbed, leading to first-order
*Author to whom correspondence should be addressed. 'Present address: Exxon Research and Engineering Co., Linden, NJ
07036.
dependence in oxygen pressure, negative-first-order dependence in CO partial pressure, and zero-order total pressure dependence.
(1) Kummer, J. T. J . Phys. Chem. 1986, 90, 4747. (2) Cant, N. W.; Hicks, P. C.; Lennon, B. S. J . Cuful. 1978, 54, 372. (3) (a) Kiss, J. T.; Gonzalez, R. D. J. Phys. Chem. 1984,84892. (b) Kiss,
J. T.; Gonzalez, R. D. J . Phys. Chem. 1984, 88, 898. (4) Cant, N. W.; Angove, D. E. J . Cutal. 1986, 97, 36. (5) Shishu, R. C.; Kowalczyk, L. S. Platinum Met. Rev. 1974, 18, 58. (6) Voltz, S. E.; Morgan, C. R.; Liederman, D.; Jacob, S. M. Ind. Eng.
(7) Nicholas, D. M.; Shah, Y. T. Ind. Eng. Chem. Prod. Res. Dev. 1976,
(8) Matsushima, T. J . Phys. Chem. 1984, 88, 202. (9) Kawai, M.; Onishi, T.; Tamaru, K. Appl. Surf. Sci. 1981, 8, 361. (10) McCarthy, E.; Zahradnik, J.; Kuczynski, G. C.; Carberry, J. J. J .
Catal. 1975, 39, 29. (11) (a) Matsushima, T.; White, J. M. J . Catal. 1975, 39, 265. (b)
Matsushima, T.; Mussett, C. J.; White, J. M. J . Catal. 1976, 41, 397. (c) White, J. M.; Golchet, A. J . Chem. Phys. 1977, 66, 5744.
(12) (a) Matsushima, T. J . Catal. 1978,55,337. (b) Matsushima, T. Surf: Sci. 1979, 79, 63. (c) Matsushima, T. Surf. Sci. 1979, 87, 665.
(13) Hori, G. K.; Schmidt, L. D. J . Catal. 1975, 38, 335. (14) Taylor, J. L.; Ibbotson, D. E.; Weinberg, W. H. Surf. Sci. 1979, 90,
(15) Hagen, D. I.; Nieuwenhuys, B. E.; Rovida, G.; Somorjai, G. A. Surf.
(16) Kuppers, J.; Plagge, A. J . Vac. Sci. Technol. 1976, 13, 259. (17) (a) Zhdan, P. A,; Boreskov, G. D.; Boronin, A. I.; Schepelin, A. P.;
Withrow, S. P.; Weinberg, W. H. Appl. Surf. Sci. 1979, 3, 145. (b) Zhdan, P. A,; Boreskov, G. K.; Egelhoff, W. F., Jr.; Weinberg, W. H. Surf: Sci. 1976, 61, 377.
(18) Stuve, E. M.; Madix, R. J.; Brundle, C. R. Surf. Sci. 1984, 146, 155. (19) Gland, J. L.; Kollin, E. B. J . Chem. Phys. 1983, 78, 963. (20) Conrad, H.; Ertl, G.; Kuppers, J. Surf: Sci. 1978, 76, 323. (21) Mantell, D. A,; Ryali, S. B.; Haller, G. L. Chem. Phys. Lett. 1983,
(22) Akhter, S.; White, J. M. Surf: Sci. 1986, 171, 527. (23) (a) Engel, T.; Ertl, G. J . Chem. Phys. 1978,69, 1267. (b) Engel, T.
(24) Matolin, V.; Gillet, E.; Gillet, M. Surf. Sci. 1985, 162, 354.
Chem. Prod. Res. Deu. 1973, 12, 294.
15, 35.
37.
Sci. 1976, 57, 632.
102, 37.
J. Chem. Phys. 1978, 69, 373.
0022-3654/88/2092-5213$01.50/0 0 1988 American Chemical Society

5214
These features have allowed many of the reaction parameters determined in UHV to be applied directly to the kinetics at higher pressures.30
Models based on chemisorption and kinetic parameters de- termined in surface science studies have been successful a t pre- dicting most of the observed high-pressure behavior. Recently, Oh et have developed a mathematical model for CO oxidation by O2 or NO on Rh which correctly predicts the absolute rates, activation energy, and partial pressure dependence. Similarly, studies by Schmidt and co-workers of the CO + O2 reaction on Rh( 11 1 ) 3 1 and CO + NO on polycrystalline Pt32 have demon- strated the applicability of steady-state measurements in UHV and relatively high (1 Torr) pressures in determining the reaction mechanisms and kinetic parameters.
Recently, work in this laboratory on the steady-state reaction kinetics at high pressure over R u ( O O O ~ ) ~ ~ and Rh( 11 1) and Rh- (1 00) single crystals34 and field emitter tips35 has been performed. The single crystals exhibited rates and activation energies which were almost identical with measurements over supported metal catalyst^.**^^^^ In addition, discrepancies between UHV and high-pressure measurements of the activity of Ru surfaces were successfully explained by studying the oxidation behavior of the Ru surface. These studies have convincingly demonstrated the applicability and advantages of model single-crystal studies, which combine UHV surface analysis techniques with high-pressure kinetic measurements, in the elucidation of reaction mechanisms over supported catalysts.
The present study examines the oxidation of CO by O2 in a combined high-pressure reaction-UHV surface analysis system. A wide range of temperatures and 02 :C0 ratios are employed, with emphasis on comparisons between previous work on high surface area catalysts and the single crystals in this study. The effects of catalyst oxidation and implications for rate oscillations previously observed on Pt, Pd, and Ir polycrystalline c a t a l y s t ~ ~ ~ , ~ ~ are discussed.
The Journal of Physical Chemistry, Vol. 92, No. 18, 1988 Berlowitz et al.
Experimental Section The apparatus used in these experiments has been described
p r e v i o u ~ l y . ~ ~ Briefly, the system consists of a UHV surface analysis chamber equipped with Auger electron spectroscopy (AES), a quadrupole mass spectrometer for temperature-pro- grammed desorption (TPD), and an ion sputter gun, contiguous to a high-pressure reaction chamber. The single-crystal samples were mounted on the arm of a retractable bellows, allowing the sample to be transferred in vacuo between the two chambers. The Pt(100), Ir(llO), and Pd( l l0) crystals measured 0.92 cm in diameter by 0.1 1 cm thick. The Ir( 11 1) sample was elliptically shaped, measuring 0.75 cm by 0.55 cm by 0.3 mm thick. The samples were heated resistively by two high-purity, 0.5 1-mm tungsten leads spot-welded to the back of the crystal; sample
(25) Matsushima, T.; Asada, H. J . Chem. Phys. 1986, 85, 1658. (26) Palmer, R. L.; Smith, J. N., Jr. J . Chem. Phys. 1974, 60, 1453. (27) Campbell, C. T.; Ertl, G.; Kuipers, H.; Segner, J. J . Chem. Phys.
1980, 73, 5862. (28) (a) Engel, T.; Ertl, G. Adu. Catal. 1979, 28, 1. (b) Engel, T.; Ertl,
G. In The Chemical Physics of Solid Surfaces and Heterogeneous Catalysts; King, D. A,, Woodruff, D. P., Eds.; Elsevier: Holland, 1982; Vol. 4.
(29) Langmuir, I . Trans. Faraday SOC. 1921-22, 17, 621, (30) Oh, S. H.; Fisher, G. B.; Carpenter, J. E.; Goodman, D. W. J . Catal.
(31) Schwartz, S. B.; Schmidt, L. D.; Fisher, G. B. J . Phys. Chem. 1986,
(32) Klein, R. L.; Schwartz, S.; Schmidt, L. D. J . Phys. Chem. 1985.89,
(33) Peden, C. H. F.; Goodman, D. W. J . Phys. Chem. 1986, 90, 1360. (34) (a) Peden, C. H. F.; Goodman, D. W.; Blair, D. S.; Berlowitz, P. J.;
Fisher, G. B.; Oh, S. H. J . Phys. Chem. 1988, 92, 1563. (b) Goodman, D. W.: Peden. C. H. F. J . Phvs. Chem. 1986. 90. 4839.
1986, 100, 360.
00, 6194.
4908.
(35) (a) Kellogg, G. L.3. Catal. 1985, 92, 167. (b) Kellogg, G. L. Surf. Sci. 1986. 171. 359.
(36) Turner, J. E.; Sales, B. C.; Maple, M. B. Surf. Sci. 1981, 103, 54. (37) Turner, J. E.; Sales, B. C . ; Maple, M. B. Surf. Sci. 1981, 109, 591. (38) Goodman, D. W.; Kelley, R. D.; Madey, T. E.; Yates, J. T., Jr. J .
Catal. 1980, 63, 226.
1000
1 0 0
Z
I- I!
0" 0.1 0
0.0 1
0.001 I I I I I I I 1.4 1.6 1.8 2.0 2.2 2.4 2.8
1000/T (K-l) Figure 1. Specific rates of reaction (turnover frequencies) as a function of inverse temperature for single-crystal and supported* catalysts.
temperature was measured by a 0.08-mm chromel-alumel ther- mocouple spot-welded to the sample edge.
AES was used to characterize the cleanliness of the samples. In addition, the cleanliness of the Pt( 100) sample was checked for carbon impurities by O2 adsorption/desorption and for Si and Ca impurities by high-temperature oxidation (1 123 K, 1 X Torr of 02).39 The Pd crystal was cleaned by placing it in the reactor with 8 Torr of CO and 8 Torr of O2 and heating to 600 K for 1-2 min. One to three cycles of this treatment produced a clean surface. Large carbon impurities were cleaned from both Ir samples by oxidation in 1 X Torr of O2 at 1000 K for 5-10 min, followed by a 3-min anneal in vacuo to 1600 K. Small quantities of carbon were removed from the Ir samples by reaction in 8 Torr of O2 and 4 Torr of CO for 2 min at 600-625 K, followed by a brief flash to 1600 K. The Pt sample was cleaned by sputtering at 1100 K in 5 X loT5 Torr of Ar for 30 min (1.0-kV beam energy) to remove Si and Ca impurities; this was followed by heating in 0.1 Torr of O2 at 1100 K for 30 min and then annealing at 1300 K in vacuo. Several cycles of this procedure produced a clean Pt surface which could not be oxidized under UHV conditions at high temperature. No carbon was detectable either in AES or as C 0 2 desorbing from the surface in TPD experiments performed in an O2 ambient (lo-' Torr).
Gas chromatography with flame ionization detection was used to analyze the reaction products. CO and C 0 2 were catalytically converted to methane before analysis. Rates of reaction are expressed as turnover frequencies (TOF), defined as the number of C 0 2 molecules produced per active metal site per second. For Pd and Ir, the entire crystal (front, back, and edge) was counted in the determination of the total number of sites; for Pt, only the front face was included, as t he back and edge of the crystal were not subjected to the sputter cleaning procedure. Research grade CO (99.99%) and O2 (99.995%) were supplied by Matheson. CO was further purified before use by slowly passing it through a molecular sieve trap at 77 K. No metal carbonyls (e.g., Ni(CO),) were detected in any experiment in postreaction AES analysis.
The experimental procedure has been described in detail pre- v i o u ~ l y . ~ ~ " Briefly, after cleaning and characterization by AES, the sample is removed to the reactor, which is charged with reactants. Most experiments were performed with 16 Torr of CO and 8 Torr of 02. The sample is heated to the desired temperature for a specified time, the products are then allowed to mix for 15
(39 ) Mundschau, M.; Vanselow, R. Surf Sr i . 1985, 157, 87

Kinetics of CO Oxidation
Y
2 50
W I- U U z 0 10 I- U 3 5 - a
v
B 0" 0
1 -
0 0 7 * 2 0 0 Y 0 I-
W 1 5 0 I- a
z
I-
1
a
0 1 0 0
a
LL 5 0
z ON
0
0
0
Ir( 1 1 1) - Po2 = 2 0 torr -
- -
-
I I I I 1
I I I
lr SINQLE X T A L RATE Em = 22.0 k c N m o 1
Ea.24 .1 keml/mol (SUPPORTED Ir)
-
/ /
/ /
/ /
P' /
/ A >: I 1
0 1 0 0 2 0 0 300 4 0 0
P A R T I C L E S IZE (i) Figure 2. Effect of particle size on the C 0 2 formation rate on Ir/SiOZ2 and Ir single-crystal catalysts.
TABLE I: Activation Energies catalyst temp, K E., kcal/mol ref
Ir(ll0) Ir(ll1) Ir/Si02 Pd(ll0) Pd(ll0) Pd/Si02 Pt( 100) Pt wire Pt(100) Pt/Si02 Pt/Aerosil Pt/Si02
425-625 425-625 425-475 475-625
400-450 5 00-7 2 5 500-800
<460
<440 <450 273-355 310-322
21.9 22.1 24.6 33.1 26.0 24.6 32.9 31.8 13.0 13.4
12 8-12
this work this work 2 this work this work 2 this work 29 this work 2 40 41
min, and, finally, an aliquot of the product mixture is analyzed by the GC. The reactor is then pumped out, and the sample is returned to the UHV chamber for postreaction analysis.
Results Steady-State Kinetics on Clean Surfaces. The CO, formation
rate as a function of inverse temperature is shown in Figure 1 and compared to rate data obtained on several supported metal cat- alysts., All of the single-crystal data shown are for a 1:2 02:C0 mixture at a total pressure of 24 Torr. At this pressure the reaction rate is zero-order in total pressure. The structure insensitivity of this reaction is evidenced in the match between supported, nonoriented catalysts and the single crystals and in the equal rates observed for Ir( 110) and (1 11) single crystals. However, note that the single-crystal Ir rates are compared to the least dispersed Ir catalyst in ref 2; catalysts with higher dispersion (Figure 2) exhibited substantially lower rates. The observed activation en- ergies are summarized in Table I and compared with those ob- tained by Cant et al., and other^.^^^^,^^ At temperatures below 450 K (the temperature range in which the supported catalyst data were obtained) the agreement between single crystals and high surface area supported catalysts is excellent.
Figures 3 and 4 show the reaction rate dependence on CO partial pressure for Pd and Ir, respectively. In these experiments the oxygen pressure is held constant and the CO pressure allowed to vary. For both metals, to a 0 2 : C 0 ratio of roughly 12: 1 the reaction is first-order in CO partial pressure; below this ratio the reaction becomes negative-first-order in CO partial pressure.
For Pt( 100) the order of the reaction in CO partial pressure changes with temperature (see Figure Sb). In the range where the activation energy is changing (425-490 K, Figure Sa), the
(40) Heyne, H.; Tompkins, F. C. Proc. R. SOC. London, A 1966,292,460. (41) Cant, N. W.; Donaldson, R. A. J . Catal. 1981, 70, 320.
The Journal of Physical Chemistry, Vol. 92, No. 18, 1988 5215
1000 I 1 I 1 I
500 t Y E 100 Y
50
4: U z I- 0. 10
a 5 E P
Pd( l l0 ) Po2 = 5 0 torr, 525 K
o Po2=0 torr, 525 K
0.1 L 1 1 I 1 I t
0.1 0.5 1 5 10 50 100
CO PARTIAL PRESSURE (torr) Figure 3. CO partial pressure dependence at constant oxygen pressure and 525 K on Pd( 110). The maximum rate occurs at an O2:CO ratio of 12:l for both oxygen pressures.

Berlowitz e t al. 5216 The Journal of Physical Chemistry, Vol. 92, No. 18, 1988
1 0 0 0 I I I I 100 1 I I I
~ Pt(100) PO? = 100 Torr
0 P02=40 Torr A PO*= 8 Torr
N
0 CO ORDER = 0 0
0 . 1 -
(a1 I I I 1 0.0 1 0.1
1000 /T ( K - l )
I I I I
1.4 1.6 1.8 2 .0 2 .2 2 .4 0.5 1 5 10 50 100
CO PARTIAL PRESSURE (torr) Figure 5. CO partial pressure dependence as a function of temperature at constant oxygen pressures on Pt(100). (a) The Arrhenius curve for CO oxidation on Pt(100) (reproduced from Figure 1) is shown to illustrate the temperature regimes in which (b) the CO pressure dependence data were obtained.
100 1 50
- P k 10 a a z 5 0 c
Pco =16 torr, 525 K n P C O = 4 t o r r , 525K ~
0.1 5 10 50 100 500 1OC
O2 PARTIAL PRESSURE (torr)
Figure 6. 0, partial pressure dependence on Pd(l l0) at 525 K, and CO partial pressures of 4 and 16 Torr. Increasing the CO pressure shifts the curve but does not change the maximum rate, the reaction order in 0, (1.0 f O.l), or the O2:CO ratio a t which the maximum occurs (roughly 12:1),
1000
500
1 - P 100 ' 50
Z P t E 2 10
8 5 0
1
I , I / I
Id1 11) 3 Pc0=4 torr, 550 K : Pc0=6 ton, 483 K
1 1 I 1 I
5 10 50 100 5001. )
0 2 PARTIAL PRESSURE (tom) Figure 7. 0, partial pressure dependence on I r ( l l 1 ) a t 483 and 550 K. The increase in temperature results in a small change in the 0, reaction order from 1.1 f 0.2 to 0.8 f 0.1 and in the O2:CO ratio at the maximum rate from 16:l to 12:l .
100
50
I 1 1 1 I
Pt( 100) PCO' 16 tar, 650 K
w 10 c a e 5 z E! c U
Z l P ,., 0.5 0 0
- 0 Pco=8 ton, 550K
x Pm= 3 ton, 475 K A &0=6 ton, 500 K
I / I I I
1 5 10 50 100 500 loo0 0, PARTIAL PRESSURE (torr)
Figure 8. O2 partial pressure dependence on Pt(100) a t several pressures and temperatures. In all cases the reaction order is 1.0 f 0.1.
TABLE II: Reaction Orders
reaction order catalysts
I r ( l l 0 ) 5% Ir/SiO, Pd( l l0 ) 5% Pd/SiO, Pt ( 1 00) Pt( 100) 5% Pt/SiO, Pt/fiber glass Pt/monolith Pt wire
in CO' -0.9 f 0.2 -0.8 & 0.1 -1.0 f 0.1 -0.8 f 0.2
-0.9 f 0.2' -0.2 f 0 . 2 d -0.28' -0.5' -1.d
0.0 to -0.6'
in 0,' 0.9 f 0.2 1.0 f 0.3 1.0 f 0.1 0.8 f 0.2 1.0 f 0.1 1.0 f 0.1 0.9 f 0.1 0.9 1 .o 1 .o
ref this work L this work 2 this work this work 2 I 5 29
' For CO:O, mixtures close to stoichiometric. ' For temperatures of 425-500 K. 'For temperatures above 550 K. dFor temperatures be- low 450 K. 'For temperatures of 475-650 K at atmospheric pressure. 'For temperatures of 500-700 K at Torr.
will be addressed in the discussion. Effect of Oxidation on Catalytic Activity. Oxidation and
reduction have been proposed as a possible mechanism for os- cillations in t h e CO oxidation reaction r a t e for Pd, P t , a n d Ir ~ a t a l y s t s . ~ ~ , ~ ' * ~ * As such, oxidation of the single crystals used in
Kinetics of CO Oxidation The Journal of Physical Chemistry, Vol. 92, No. 18, 1988 5217
W I- d
L I I I I J 300 500 700 900 1100
TEMPERATURE (K)
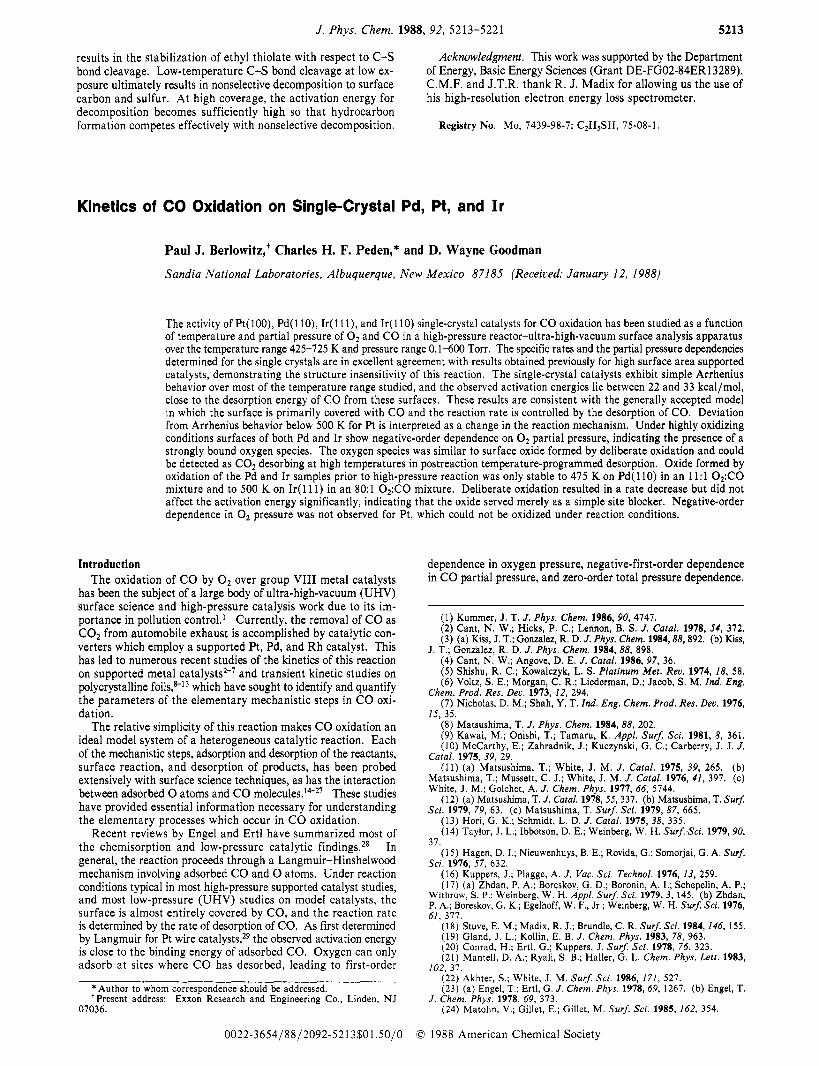
Figure 9. TPD of C02 following reaction of unoxidized and oxidized I r ( l l 1 ) surfaces (see text). No molecular oxygen desorbed from these surfaces.
this study and its effects on the rate of reaction were investigated in several different experiments. The results for Ir and Pd will be discussed first, followed by the studies on Pt.
On Ir and Pd, reactions were performed at high 0,:CO ratios and/or the crystals were preoxidized at high temperatures in O2 in order to form a strongly bound oxygen species (referred to here as “oxide”). In the latter case, the oxide could be detected prior to CO-O2 reaction by AES. Preoxidation of Pd (30-40 min at 1100 K in 1 Torr of O2 or 20 min at 800 K in 600 Torr of 0,) and Ir (20-30 min at 725-800 K in 100 of Torr 0,) resulted in Auger spectra with O(510 eV)/Pd(330 eV) ratios of 0.1-0.15 and O(510 eV)/Ir(l71 eV) ratios of 0.25-0.3, respectively. The oxygen AES signal was measured after flash desorption of all chemisorbed oxygen. Surfaces prepared by this procedure will be referred to as “oxidized”.
Under no conditions was an 0 AES signal detected subsequent to high-pressure reaction. Note that it was necessary to heat the crystal under vacuum prior to Auger analysis in order to eliminate the contribution of adsorbed CO to the oxygen signal. However, significant changes were observed in postreaction TPD spectra of CO and C 0 2 under highly oxidizing conditions which we at- tribute to the presence of a strongly bound oxygen species. Figure 9 displays such C 0 2 TPD spectra for the I r ( 11 1) single crystal. The CO, TPD spectra obtained subsequent to reaction at low (unoxidized surface) and high (oxidized surface) 0,:CO ratios are compared. When reactions were run at low temperatures and high O2:CO ratios, with or without preoxidation, a new CO, desorption feature was observed in the spectra at 765 K. A similar feature was observed at 580 K on Pd( 110) for similar reaction conditions. These features are not detected for C 0 2 adsorption on the clean surfaces of these metals. We assign these peaks to the reaction between the oxide and adsorbed CO remaining subsequent to high-pressure reaction. A mass 28 feature, in the same temperature range as the C02 peak described above, could also be detected under low-temperature, highly oxidizing con- ditions. However, its presence can be accounted for by the cracking of C02 in the ionizer of the mass spectrometer. Finally, a lower temperature mass 28 feature was present in all of the postreaction CO TPD spectra at =410 and 430 K for Ir and Pd, respectively. These peaks could be assigned to the desorption of CO from clean Ir or Pd surface. Further, these features decreased in size but were not eliminated after reaction in oxidizing at-
, mospheres (Le., high 02:C0 ratios) a t low temperature. Reactions rates (TOF‘s) were measured on Pd( 1 10) and Ir( 1 1 1)
as a function of time under conditions in which the oxide has been reported42 to form on wire catalysts (0,:CO = 11:1, Pr = 24 Torr for Pd, 0,:CO = 80:1, PT = 243 Torr for Ir). The reaction rate was found to be invariant with time, and no strongly bound oxide could be detected in the postreaction AES for Pd( 110) a t tem- peratures a t or above 475 K and on Ir( 11 1) a t or above 500 K.
(42) (a) Sales, B. C.; Turner, J. E.; Maple, M. B. Surf. Sci. 1981, 112, 272. (b) Turner, J. E.; Maple, M. B. Surf. Sci. 1984, 147, 647.
10 I I I I I I 4
0“ 0 - i 1 ,,)RATES ON PRE-OXIOIZED SURFACE
i -- ----- 0.1 I 1 1 I I 1 I I
0 100 200 300 400 500 600
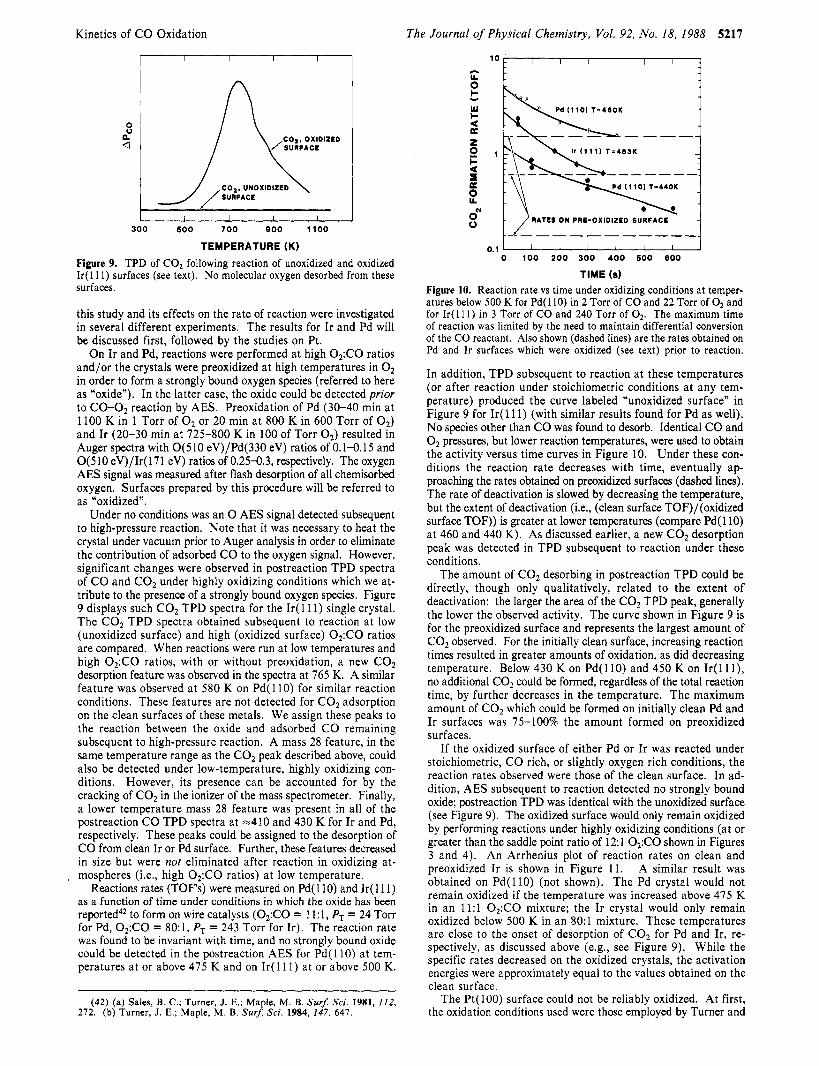
TIME (d Figure 10. Reaction rate vs time under oxidizing conditions at temper- atures below 500 K for Pd(ll0) in 2 Torr of CO and 22 Torr of O2 and for Ir( 1 11) in 3 Torr of CO and 240 Torr of 02. The maximum time of reaction was limited by the need to maintain differential conversion of the CO reactant. Also shown (dashed lines) are the rates obtained on Pd and Ir surfaces which were oxidized (see text) prior to reaction.
In addition, TPD subsequent to reaction at these temperatures (or after reaction under stoichiometric conditions at any tem- perature) produced the curve labeled “unoxidized surface” in Figure 9 for Ir( 11 1) (with similar results found for Pd as well). No species other than CO was found to desorb. Identical CO and O2 pressures, but lower reaction temperatures, were used to obtain the activity versus time curves in Figure 10. Under these con- ditions the reaction rate decreases with time, eventually ap- proaching the rates obtained on preoxidized surfaces (dashed lines). The rate of deactivation is slowed by decreasing the temperature, but the extent of deactivation (Le., (clean surface TOF)/(oxidized surface TOF)) is greater at lower temperatures (compare Pd( 110) at 460 and 440 K). As discussed earlier, a new COS desorption peak was detected in TPD subsequent to reaction under these conditions.
The amount of CO, desorbing in postreaction TPD could be directly, though only qualitatively, related to the extent of deactivation: the larger the area of the CO, TPD peak, generally the lower the observed activity. The curve shown in Figure 9 is for the preoxidized surface and represents the largest amount of C02 observed. For the initially clean surface, increasing reaction times resulted in greater amounts of oxidation, as did decreasing temperature. Below 430 K on Pd( 110) and 450 K on Ir( 11 l ) , no additional C02 could be formed, regardless of the total reaction time, by further decreases in the temperature. The maximum amount of COz which could be formed on initially clean Pd and Ir surfaces was 75-100% the amount formed on preoxidized surfaces.
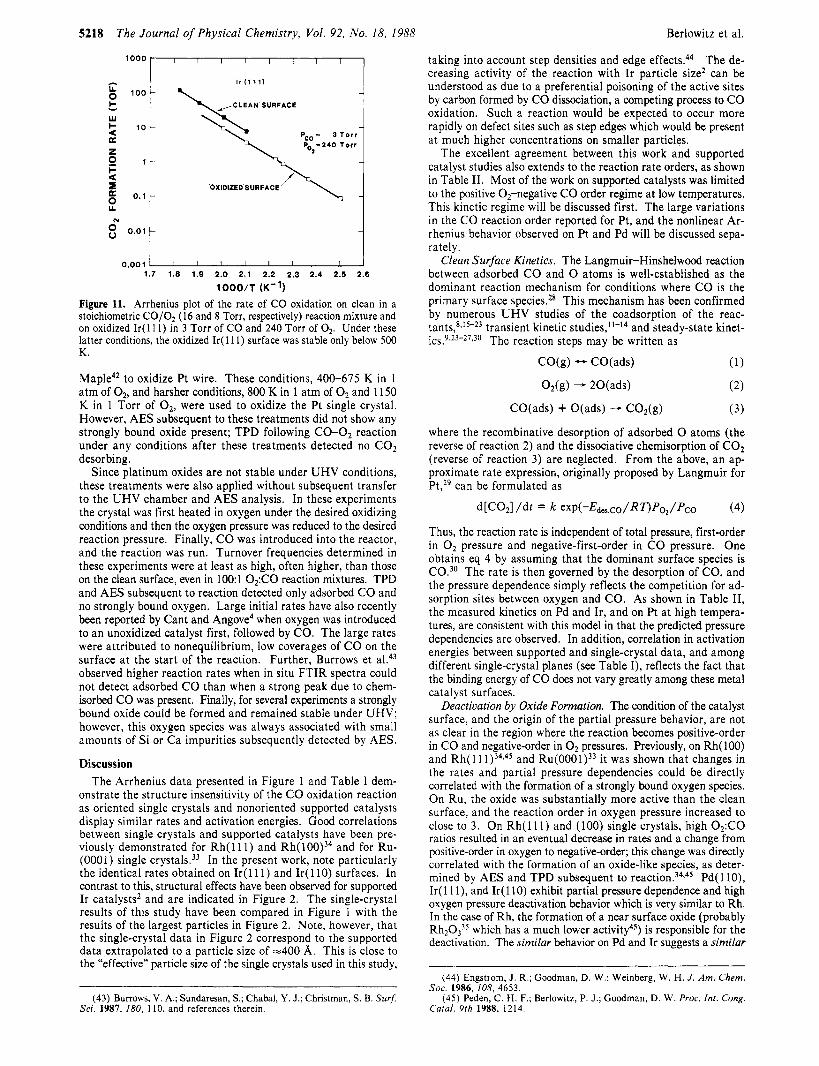
If the oxidized surface of either Pd or Ir was reacted under stoichiometric, CO rich, or slightly oxygen rich conditions, the reaction rates observed were those of the clean surface. In ad- dition, AES subsequent to reaction detected no strongly bound oxide; postreaction TPD was identical with the unoxidized surface (see Figure 9). The oxidized surface would only remain oxidized by performing reactions under highly oxidizing conditions (at or greater than the saddle point ratio of 12:l OsCO shown in Figures 3 and 4). An Arrhenius plot of reaction rates on clean and preoxidized Ir is shown in Figure 11. A similar result was obtained on Pd( l l0) (not shown). The Pd crystal would not remain oxidized if the temperature was increased above 475 K in an 11:l 0,:CO mixture; the Ir crystal would only remain oxidized below 500 K in an 80:l mixture. These temperatures are close to the onset of desorption of CO, for Pd and Ir, re- spectively, as discussed above (e.g., see Figure 9). While the specific rates decreased on the oxidized crystals, the activation energies were approximately equal to the values obtained on the clean surface.
The Pt( 100) surface could not be reliably oxidized. At first, the oxidation conditions used were those employed by Turner and
5218 The Journal of Physical Chemistry, Vol. 92, No. 18, 1988 Berlowitz et al.
taking into account step densities and edge effects.44 The de- creasing activity of the reaction with Ir particle size2 can be understood as due to a preferential poisoning of the active sites by carbon formed by CO dissociation, a competing process to CO oxidation. Such a reaction would be expected to occur more rapidly on defect sites such as step edges which would be present at much higher concentrations on smaller particles.
The excellent agreement between this work and supported catalyst studies also extends to the reaction rate orders, as shown in Table 11. Most of the work on supported catalysts was limited to the positive 02-negative CO order regime at low temperatures. This kinetic regime will be discussed first. The large variations in the CO reaction order reported for Pt, and the nonlinear Ar- rhenius behavior observed on Pt and Pd will be discussed sepa- rately.
Clean Surface Kinetics. The Langmuir-Hinshelwood reaction between adsorbed CO and 0 atoms is well-established as the dominant reaction mechanism for conditions where CO is the primary surface species.28 This mechanism has been confirmed by numerous UHV studies of the coadsorption of the reac- t a n t s , * ~ ’ ~ - ~ ~ transient kinetic and steady-state kinet- i c ~ . ~ . ~ ~ - ~ ~ , ~ ~ The reaction steps may be written as
CO(g) - CO(ads) (1)
loo0 * v / C L E A N SURFACE
W
Pp,= 3 T o r r LE 2
I- 4
0
0. P 8 0.0 N
0.00 t i 1 1 1 1 1 1 1 1 1 1
.7 1.8 1.9 2.0 2.1 2.2 2.3 2.4 2.5 2.6
1000/T (K”) Figure 11. Arrhenius plot of the rate of CO oxidation on clean in a stoichiometric CO/02 (16 and 8 Torr, respectively) reaction mixture and on oxidized I r ( l l 1 ) in 3 Torr of CO and 240 Torr of 02. Under these latter conditions, the oxidized Ir(ll1) surface was stable only below 500 K.
Maple42 to oxidize Pt wire. These conditions, 400-675 K in 1 atm of 02, and harsher conditions, 800 K in 1 atm of O2 and 1 150 K in 1 Torr of 0 2 , were used to oxidize the Pt single crystal. However, AES subsequent to these treatments did not show any strongly bound oxide present; TPD following CO-O2 reaction under any conditions after these treatments detected no C 0 2 desorbing.
Since platinum oxides are not stable under UHV conditions, these treatments were also applied without subsequent transfer to the UHV chamber and AES analysis. In these experiments the crystal was first heated in oxygen under the desired oxidizing conditions and then the oxygen pressure was reduced to the desired reaction pressure. Finally, CO was introduced into the reactor, and the reaction was run. Turnover frequencies determined in these experiments were at least as high, often higher, than those on the clean surface, even in 1OO:l O2:CO reaction mixtures. TPD and AES subsequent to reaction detected only adsorbed CO and no strongly bound oxygen. Large initial rates have also recently been reported by Cant and Angove4 when oxygen was introduced to an unoxidized catalyst first, followed by CO. The large rates were attributed to nonequilibrium, low coverages of CO on the surface at the start of the reaction. Further, Burrows et al.43 observed higher reaction rates when in situ FTIR spectra could not detect adsorbed CO than when a strong peak due to chem- isorbed CO was present. Finally, for several experiments a strongly bound oxide could be formed and remained stable under UHV; however, this oxygen species was always associated with small amounts of Si or Ca impurities subsequently detected by AES.
Discussion The Arrhenius data presented in Figure 1 and Table I dem-
onstrate the structure insensitivity of the CO oxidation reaction as oriented single crystals and nonoriented supported catalysts display similar rates and activation energies. Good correlations between single crystals and supported catalysts have been pre- viously demonstrated for R h ( l l 1 ) and Rh(100)34 and for Ru- (0001) single crystals.33 In the present work, note particularly the identical rates obtained on I r ( l l1 ) and Ir( 110) surfaces. In contrast to this, structural effects have been observed for supported Ir catalysts2 and are indicated in Figure 2. The single-crystal results of this study have been compared in Figure 1 with the results of the largest particles in Figure 2. Note, however, that the single-crystal data in Figure 2 correspond to the supported data extrapolated to a particle size of ~ 4 0 0 A. This is close to the “effective” particle size of the single crystals used in this study,
~ ~~ ~
(43) Burrows, V A ; Sundaresan, S I Chabal, Y J , Christman, S B Surf Sci 1987, 180, 110, and references therein
where the recombinative desorption of adsorbed 0 atoms (the reverse of reaction 2) and the dissociative chemisorption of C 0 2 (reverse of reaction 3) are neglected. From the above, an ap- proximate rate expression, originally proposed by Langmuir for Pt,29 can be formulated as
Thus, the reaction rate is independent of total pressure, first-order in O2 pressure and negative-first-order in CO pressure. One obtains eq 4 by assuming that the dominant surface species is C0.30 The rate is then governed by the desorption of CO, and the pressure dependence simply reflects the competition for ad- sorption sites between oxygen and CO. As shown in Table 11, the measured kinetics on Pd and Ir, and on Pt a t high tempera- tures, are consistent with this model in that the predicted pressure dependencies are observed. In addition, correlation in activation energies between supported and single-crystal data, and among different single-crystal planes (see Table I), reflects the fact that the binding energy of CO does not vary greatly among these metal catalyst surfaces.
Deactivation by Oxide Formation. The condition of the catalyst surface, and the origin of the partial pressure behavior, are not as clear in the region where the reaction becomes positive-order in CO and negative-order in O2 pressures. Previously, on Rh( 100) and Rh( 11 1)34,45 and R u ( O O O ~ ) ~ ~ it was shown that changes in the rates and partial pressure dependencies could be directly correlated with the formation of a strongly bound oxygen species. On Ru, the oxide was substantially more active than the clean surface, and the reaction order in oxygen pressure increased to close to 3. On Rh( 11 1) and (100) single crystals, high O2:CO ratios resulted in an eventual decrease in rates and a change from positive-order in oxygen to negative-order; this change was directly correlated with the formation of an oxide-like species, as deter- mined by AES and TPD subsequent to r e a ~ t i o n . ~ ~ , ~ ~ Pd( 1 lo), Ir( 1 1 l ) , and Ir( 110) exhibit partial pressure dependence and high oxygen pressure deactivation behavior which is very similar to Rh. In the case of Rh, the formation of a near surface. oxide (probably Rh20335 which has a much lower activity45) is responsible for the deactivation. The similar behavior on Pd and lr suggests a similar
(44) Engstrom, J. R.; Goodman, D. W.: Weinberg, W. H. J . Am. Chem.
(45) Peden, C. H. F.; Berlowitz, P. J.; Goodman, D. W. Proc. Int. Cong. SOC. 1986, 108, 4653.
Card. 9th 1988, 1214.
Kinetics of CO Oxidation The Journal of Physical Chemistry, Vol. 92, No. 18. 1988 5219
deactivation mechanism. In particular, similar C 0 2 TPD spectra to that shown in Figure 9 were obtained on Rh subsequent to reaction under oxidizing condition^.^^ However, in contrast to Rh, Auger spectra taken after the temperature flash for TPD did not reveal any residual oxygen on Pd and Ir. The C 0 2 formed during TPD must arise from the reaction between chemisorbed CO and the residual adsorbed oxygen (oxide) responsible for the catalyst deactivation. Note, however, that CO which desorbs as C 0 2 when reacted with the oxide species desorbs at a much higher temperature than CO from the clean surface. Further, C 0 2 desorption from clean surfaces of these metals occurs a t much lower temperature than the feature present in the spectra shown in Figure 9 for Ir and the C 0 2 TPD peak at 580 K obtained on oxidized Pd( 110). This implies that the oxide forms a COX complex upon adsorption of CO under reaction conditions.
As shown in Figure 1 1 , the effect of the oxide species is to reduce the overall rate of reaction, but not to change the activation energy. This suggests that the oxide serves as a simple site blocker on the surface. The presence of chemisorbed CO in postreaction TPD, even on the oxidized surfaces, is good evidence that patches of clean Pd and Ir are still present under these conditions. As with Rh$S the oxide could still function as an active C 0 2 formation site, albeit with a much lower activity and likely by a quite different mechanism.45 However, for Pd and Ir where only a portion of the surface becomes oxidized, the more active rate from the unoxidized surface dominates the overall rate and the kinetics (Figure 1 1 ) .
The extent of oxidation of the single crystals used in our study is ’in good agreement with the extent of oxidation reported for Pd and Ir wire catalysts at similar pressures.42 The amount of oxygen desorbed as COz in postreaction TPD was always less than 0.5 monolayer on Pd and less than 1.0 monolayer on Ir(l1 l ) , even when the surface was preoxidized. For temperatures below 500 K Turner and co-workers report less than 0.4 monolayer of oxygen on Pd and less than 1.1 monolayers on Ir. In the tempera- ture/pressure regime in our study, the results suggest that any strongly bound oxide is only formed in the surface layer, as it was easily reduced in the cool-down period. Deeper oxidation of Pd and Ir reported by Turner at higher temperatures may be partially the result of higher pressures (1 atm vs 25-250 Torr), the presence of greater amounts of impurities, and/or the result of defects and the grain boundaries on the polycrystalline samples.
The differences between Pd or Ir (or Pt, see below) and previous work on Rh may be explained by the ease of oxidation of these metals. The more easily oxidized Rh forms an oxide which resists complete reaction when CO is flashed off the crystal prior to postreaction AES analysis. Unlike Pd or Ir, the oxide on Rh can completely cover and penetrate the surface under these condi- t i o n ~ . ~ ~ In a study by Savchenko and co-workers,46 it was shown that a reconstructive type of oxygen adsorption (Le., the formation of an oxide) would only occur for metals with a heat of adsorption of oxygen above 53 kcal/mol (220 kJ/mol). Pt falls well below this limit; Pd, Rh, and Ir are close to the borderline between types of oxides, while Ru falls well into the oxide range. This evaluation mimics the observed oxidation behavior for these metals.
For Pt(100) the lack of any turnover in the oxygen partial pressure behavior, even at O2:CO ratios as high as 15O:l (Figure 8), indicates that under our conditions no strongly bound, deac- tivating oxygen species is formed. In light of the trend from Ru to Rh to Pd and Ir, this is not surprising. In order to form a similar species on clean Pt, much higher O2 pressure and/or temperatures would be rewired, conditions which are not accessible in our
prising that no oxide was formed on the rigorously cleaned single crystal in this study. In fact, surface oxygen could be detected on our Pt crystal after oxidation but only with concurrent Si and/or Ca impurities.
Reaction Rate Oscillations. The results obtained in attempting to oxidize the catalysts in this study have some implications for the observed oscillatory behavior in the reaction rate over Pt, Pd, and Ir catalysts. Oscillations were first observed on Pt catalysts by Beusch et a1.,@ and early work has been reviewed by Sheintuch and S ~ h m i t z . ~ ~ More recent studies on Pt catalysts by Carberry and c o - w o r k e r ~ , ’ ~ ~ ~ ~ Cutlip and K e n n e ~ , ~ ’ and Turner and co- w o r k e r ~ ~ ~ have proposed several explanations for the multiple steady states and oscillations. Oscillations on Pd and Ir surfaces were first reported by Turner et aL3’
A prominent feature in many models is the proposed oscillation in CO and 0 coverages on the catalyst surface. However, since Pt would not form a strongly bound oxygen species in our study due to the absence of Si (or Ca) impurities, we conclude that over clean Pt( 100) oxidation/reduction is not the oscillatory mechanism. A more plausible mechanism is proposed by Ertl and co-worker~ .~~ These authors concluded that the oscillations were a result of periodic transformations of the surface structure propagating in waves across the surface. The above mechanism proposed by Ertl and c o - w o r k e r ~ ~ ~ has been supported in a study by Yeates et al.,53 who found that oscillations occur only on the clean (1 00) surface and not on the clean (1 11) or (13,1,1) Pt surfaces at low pressures. At atmospheric pressures, no clean crystal exhibited oscillations. Similarly, no experiment in our study, even when performed in the regime previously reported to exhibit oscillation^,^^^^^ showed any variation in rates with reaction time. Oscillations were ob- served by Yeatess3 on dirty Pt surfaces. This implies that oxidation and reduction of an impurity-induced oxide may be the cause of the oscillations at atmospheric pressure observed by Turner and co-workers on Pt. However, such a mechanism conflicts with recent conclusions of Burrows et al.43 in which the segregation of carbon from the bulk is implicated in the oscillations.
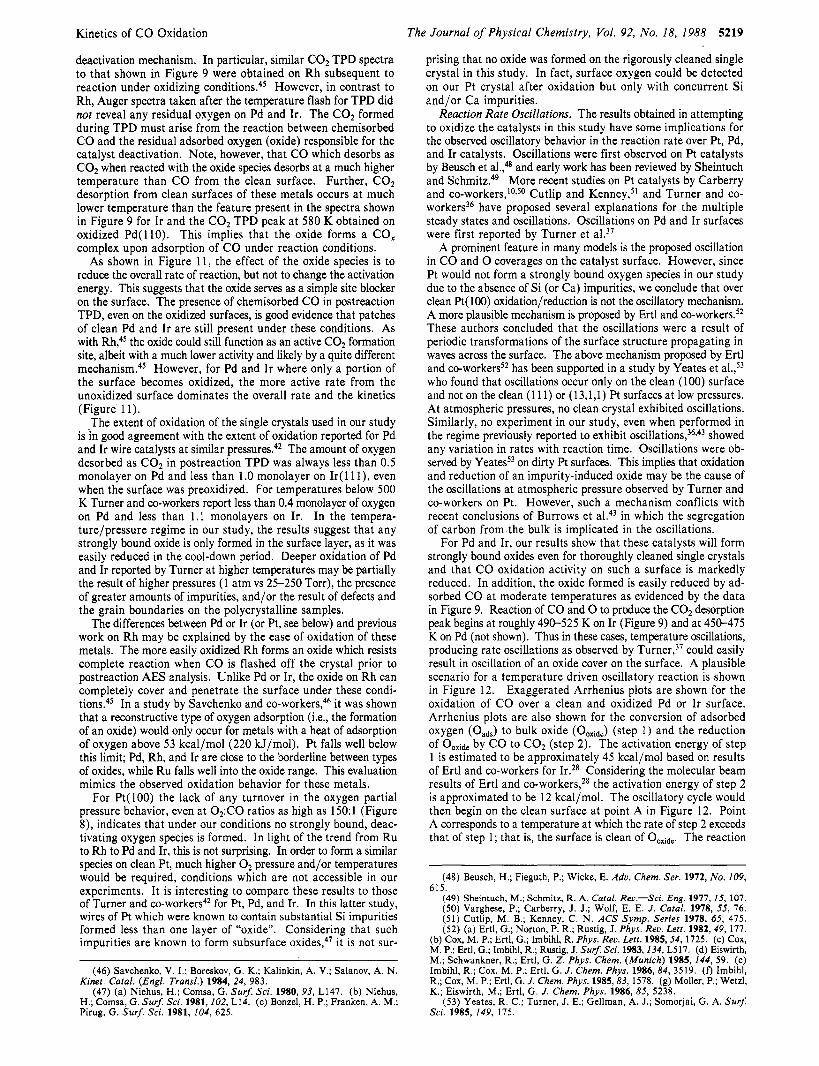
For Pd and Ir, our results show that these catalysts will form strongly bound oxides even for thoroughly cleaned single crystals and that CO oxidation activity on such a surface is markedly reduced. In addition, the oxide formed is easily reduced by ad- sorbed CO at moderate temperatures as evidenced by the data in Figure 9. Reaction of CO and 0 to produce the COz desorption peak begins at roughly 490-525 K on Ir (Figure 9) and at 450-475 K on Pd (not shown). Thus in these cases, temperature oscillations, producing rate oscillations as observed by Turner,37 could easily result in oscillation of an oxide cover on the surface. A plausible scenario for a temperature driven oscillatory reaction is shown in Figure 12. Exaggerated Arrhenius plots are shown for the oxidation of CO over a clean and oxidized Pd or Ir surface. Arrhenius plots are also shown for the conversion of adsorbed oxygen (&) to bulk oxide (Ooxide) (step 1 ) and the reduction of Ooxide by CO to COz (step 2). The activation energy of step 1 is estimated to be approximately 45 kcal/mol based on results of Ertl and co-workers for Ir.28 Considering the molecular beam results of Ertl and co-workers,2s the activation energy of step 2 is approximated to be 12 kcal/mol. The oscillatory cycle would then begin on the clean surface at point A in Figure 12. Point A corresponds to a temperature at which the rate of step 2 exceeds that of step 1; that is, the surface is clean of Ooxlde. The reaction
(48) Beusch, H.; Fieguth, P.; Wicke, E. Adu. Chem. Ser. 1972, No. 109, experiments- It is interesting to compare these results to those of Turner and co-workers4’ for Pt, Pd, and Ir. In this latter study, wires of Pt which were known to contain substantial Si impurities formed less than one layer of “oxide”. Considering that such impurities are known to form subsurface oxides,47 it is not sur-
615. (49) Sheintuch, M.; Schmitz, R. A. Cutul. Reo.-Sci. Eng. 1977, IS, 107. (50) Varghese, P.; Carberry, J. J.; Wolf, E. E. J . Cutal. 1978, 55, 76. (51) Cutlip, M. B.; Kenney, C. N. ACS Symp. Series 1978, 65, 475. (52) (a) Ertl, G.; Norton, P. R.; Rustig, J. Phys. Reu. Lett. 1982, 49, 177.
(b) COX, M. P.; Ertl, G.; Imbihl, R. Phys. Rev. Lett. 1985,54, 1725. (c) Cox, M. P.: Ertl. G.: Imbihl, R.: Rustia, J. Surf. Sci. 1983,134, L517. (d) Eiswirth, M.; Schwankner, R.; Ertl, G. Zy Phys. Chem. (Munich) 1985,144,59. ( e ) Imbihl, R.; Cox, M. P.; Ertl, G. J . Chem. Phys. 1986, 84, 3519. (f) Imbihl, R.; Cox, M. P.; Ertl, G. J. Chem. Phys. 1985,83, 1578. (g) Moller, P.; Wetzl, K.; Eiswirth, M.; Ertl, G. J . Chem. Phys. 1986, 85, 5238.
(53) Yeates, R. C.; Turner, J. E.; Gellman, A. J.; Somorjai, G. A. Surf. Sci. 1985, 149, 175.
(46) Savchenko, V. I.; Boreskov, G. K.; Kalinkin, A. V.; Salanov, A. N. Kinet. Catal. (Engl. Trans!.) 1984, 24, 983.
(47) (a) Niehus, H.; Comsa, G. Surf. Sci. 1980, 93, L147. (b) Niehus, H.; Comsa, G. Surf. Sci. 1981, 202, L14. (c) Bonzel, H. P.; Franken, A. M.; Pirug, G. Surf. Sci. 1981, 104, 625.

5220 The Journal of Physical Chemistry, Vol. 92, No. 18, 1988
- o h - O O X l D E E, -45Kca l / rno l
N
1.8 2.0 2.2 2.4
1000/T (K-’) Figure 12. Exaggerated Arrhenius plots for the various processes possibly important during reaction rate oscillations on Pd and Ir surfaces. Iden- tification of the points designated by capital letters is made in the text
Berlowitz et al.
exothermicity leads to an increase in reaction temperature and rate, and the cycle moves to point B. At this temperature the rate of step 1 exceeds that of step 2 and the catalyst surface becomes oxidized. The C 0 2 rate then falls to that corresponding to point C, the rate of reaction on the oxidized surface. The lower rate of C 0 2 production leads to a drop in the surface temperature, and the cycle procedes to point D. Now the rate of step 2 exceeds that of step 1; therefore the surface oxide, formed at point C, is reduced. The C 0 2 production rate then rises to that corresponding to point A and the cycle repeats.
Low-Temperature Kinetics on Pd and Pt. In general, Pt, Pd, Ir, Rh, and Ru exhibit linear Arrhenius behavior. However, a t temperatures below 490 K, the observed activation energy on Pt(100) decreases continuously from 33 to 13 kcal/mol. This is also the temperature regime where the reaction order in C O is changing rapidly (Figure 5). The value of 33 kcal/mol is con- sistent with the model of CO oxidation described above (33 kcal/mol being very close to the desorption energy of CO from Pt). However, the reaction rate obtained below 500 K cannot be explained by this simple model. The anomalous behavior below 500 K has been observed in several supported catalyst studies. Activation energies from 6.5 to 21 kcal/mol, with CO reaction orders of -0.2 to -0.5,5-7 have been reported for high surface area Pt catalysts. Heyne and T ~ m p k i n s ~ ~ have measured the kinetics of the reaction over Pt films and Aerosil-supported Pt. They find, at temperatures of 273-355 K and atmospheric pressure, an ap- parent activation energy of 8-1 2 kcal/mol, zero-order CO pressure dependence, and first-order O2 pressure dependence. Similarly, in more recent work by Cant and Donaldson4’ on a Pt/Si02- supported catalyst, an activation energy of approximately 12 kcal/mol was observed for the CO oxidation reaction. In addition, the activation energy was found to vary with CO coverage on the surface. These latter result^^^^^' are in excellent agreement with the parameters measured in our study. For example, our data show that the activation energy and kinetic order in CO pressure on Pt( 100) change rapidly in the 500-425 K region. Thus, these changes may account for the large spread in reported values in the earlier work on the supported systems5-’ and are consistent with a change in the reaction mechanism.
Note that a decrease in activation energy is also observed for Pd below 480 K in this study and below approximately 450 K in Cant’s work,2 indicating that a similar effect may occur on Pd catalysts. However, for Pd, no change in the reaction order in CO or O2 is observed in this or previous work in this temperature range. Neither single crystal nor supported catalyst data on Rh, Ru, and Ir, under the experimental conditions studied, show this e f f e ~ t . ~ , ~ ~ , ~ ~
For Pd, the decrease in activation energy can be explained in terms of a variation of the CO binding energy with coverage. As the temperature is decreased, CO may form a more compact layer.
This has been shown to lead to a decrease in the binding energy per CO molecule of several kcal/mol.28 A decrease in the de- sorption energy for CO should decrease the overall activation energy of the reaction according to the simple mechanism pres- ented above. This explanation is also consistent with the invariance of the reaction rate orders, as it does not postulate any change in the reaction mechanism.
A decrease in the CO binding energy is not sufficient to explain the dramatic drop in activation energy on the Pt( 100) surface and the change in the CO reaction order. A possible explanation for this effect has been proposed by Cant et al.* At temperatures near the CO desorption temperature, the lifetime of a CO molecule on the surface increases dramatically, resulting in a surface completely covered by CO. The reaction may then take place between molecular oxygen adsorbed on the CO layer. In this case the reaction would become zero-order in CO pressure and the activation energy would change due to the change in mechanism. The coverage of adsorbed molecular oxygen can be assumed to be small, since the coverage of molecular O2 on clean Pt would be small, and the reaction would remain first-order in oxygen pressure. These are precisely the kinetics we measured at low temperatures on Pt(100) (Figures 5 and 8, Table 11). However, there is no direct evidence to date supporting the involvement of a weakly bond molecular O2 species. Another, and perhaps more plausible, explanation is a restructuring of CO and Oads domains2* at these temperature and pressure conditions, resulting in a dis- tinctly different surface reaction mechanism.
Summary and Conclusions 1. The observed activation energies of 33 kcal/mol for Pd( 1 lo),
22 kcal/mol for Ir( 11 1) and Ir( 1 IO), and 13 kcal/mol for Pt a t temperatures below 450 K are in good agreement with previous results on supported catalysts.
2. For Pd and Ir at a CO:O2 ratio of 1:12 or less, the reaction is approximately first-order in CO pressure and negative-first-order in O2 pressure, in good agreement with supported catalyst data. Similar reaction orders were observed on Pt( 100) at temperatures above 550 K . Such kinetics are consistent with a Langmuir- Hinshelwood reaction between chemisorbed CO molecules and 0 atoms which is rate limited by the desorption of CO to open adsorption sites for O2 on the surface.
3. On Pd and Ir, the reaction became negative-first-order in CO pressure and positive-order in O2 pressure for O2:CO ratios greater than 12. At temperatures below 475 K on Pd(l l0) and 500 K on Ir( 1 1 1) under such oxidizing conditions, a strongly bound oxygen species is formed. It desorbs in postreaction TPD as C 0 2 in a peak at 580 K on Pd and 765 K on Ir, indicating the formation of a COX species during the reaction or in the postreaction cool-down. This species was also formed by preoxidizing these catalysts and running a reaction under oxidizing conditions. Reaction on the oxidized surface under nonoxidizing conditions quickly reduced the oxide. These results indicate that the for- mation of the oxide is responsible for the deactivation of Pd and Ir surfaces during reaction under oxidizing conditions. It is also possible that this oxide species, which begins to desorb as C02 above 475 K on Pd and 500 K on Ir, may be a cause of reaction rate oscillations observed on Pd and Ir wires.
4. Clean Pt(100) could not be oxidized under our reaction conditions. (Any strongly bound oxide species could be directly related to the presence of Si or Ca impurities.) Thus, oxidation and reduction of a clean Pt( 100) surface can be ruled out as a source of reaction rate oscillations.
5. For Pt( 100) the reaction is always positive-first-order in O2 pressure up to an 0,:CO ratio of 150. The reaction order in CO changes from -0.9 i~ 0.2 above 550 K to -0.6 to 0.0 from 500 to 425 K. A change in activation energy from 33.1 to 13 kcal/mol is also observed in this temperature regime. The high-temperature value is in excellent agreement with the 3 1.8 kcal/mol originally reported by L a n g m ~ i r . ~ ’ The low-temperature value is in good agreement with low-temperature results of 8-12:O IL4’ and 13.4 kcal/mol* reported by other investigators for temperatures below 450 K . This data may indicate a change in reaction mechanism
J. Phys. Chem. 1988, 92, 5221-5229 5221
Energy Sciences, Division of Chemical Sciences, under Contract
Registry No. CO, 630-08-0; Pt, 7440-06-4; Pd, 7440-05-3; Ir, 7439-
from the CO desorption controlled Langmuir-Hinshelwood
Acknowledgment. We acknowledge, with pleasure, the support of this work by the US. Department of Energy, Office of Basic
mechanism present at high temperatures. AC04-76DP00789.
88-5.
Synthesis and Charge-Transport Properties of Polymers Derived from the Oxidation of I-Hydro-1’-( 6-(pyrrol-l-yl)hexyl)-4,4’-bipyridinium Bis( hexafluorophosphate) and Demonstration of a pH-Sensitive Microelectrochemical Transistor Derived from the Redox Properties of a Conventional Redox Center
Ching-Fong Shu and Mark S. Wrighton*
Department of Chemistry, Massachusetts Institute of Technology, Cambridge, Massachusetts 02139 (Received: January 21, 1988)
This article describes the synthesis and electrochemical properties of redox polymers, having a polypyrrole backbone and viologen subunits, derived from oxidative electropolymerization of 1-methyl- 1’-(6-(pyrroI-l -yl)hexyl)-4,4’-bipyridinium (P-V-Me2+) and l-hydro-l’-(6-(pyrrol-l-yl)hexyl)-4,4’-bipyridinium (P-V-HZt). Closely spaced (- 1.5 pm) Au microelectrode arrays (-2.5 pm wide X 50 pm long X 0.1 pm high) modified with the polymers can be used to study aspects of the charge-transport behavior of the viologen redox system. Poly(P-V-Me2+) and poly(P-V-HZf) have been used to investigate the characteristics of microelectrochemical transistors based on a viologen redox center and a similar redox center, protonated, monoquaternized bipyridinium, which is pH dependent. The interesting properties from poly(P-V-MeZf) and poly(P-V-HZ+) stem from the behavior of the pendant viologen redox centers. The device based on poly(P-V-MeZ+) has a narrow region (- 200 mV) of gate voltage, VG, where the source-drain current, ID, is nonzero and has a sharp, pH-independent peak in the ZD-VG plot at --OS3 V versus SCE associated with the reversible, one-electron reduction of viologen. This result is consistent with electron self-exchange between redox centers being the mechanism for charge transport. The device based on poly(P-V-H2+) shows a pH-dependent Z, at futed VG, as expected from the electrochemical behavior from reversible protonation of the terminal N of the bipyridinium group of poly(P-V-HZ+). The microelectrochemical transistor based on poly(P-V-Hzt) illustrates the design of chemically sensitive, molecule-based devices using conventional redox materials.
Introduction In this article we report the synthesis and electrochemical
properties of two redox polymers, poly(P-V-MeZ+) and poly(P- V-H2+), derived from oxidative electropolymerization of P-V-MeZ+, I, and P-V-HZf, I1 (eq 1). In recent years the development of
new types of electroactive redox polymers has received considerable attention.’ Polymers with conducting polymers such as poly- porrole or poly(thiophene) as backbones and incorporating elec- troactive redox centers as pendant groups have been proven to be convenient materials for the preparation of polymer-modified electrodes containing a specific redox center.*v3 Use of poly(P-
(1) (a) Murray, R. W. In Electroanalytical Chemistry; Bard, A. J. , Ed.; Marcel Dekker: New York, 1984; Vol. 13, p 191. (b) Wrighton, M. S. Science (Washington, D.C.) 1986, 231, 32.
(2) (a) Bidan, G.; Deronzier, A.; Moutet, J . C. J . Chem. SOC., Chem. Commun. 1984, 1185. (b) Coche, L.; Deronzier, A,; Moutet, J . C. J . Elec- troanal. Chem. 1986, 198, 187. (c) Coche, L.; Moutet, J. C. J . Electroanal. Chem. 1987,224.11 1. (d) Coche, L.; Moutet, J. C. J. Am. Chem. SOC. 1987, 109, 6887. (e) Bidan, G.; Deronzier, A.; Moutet, J . C. Nouu. J. Chim. 1984, 8, 501. (0 Eaves, J . G.; Munro, H. S.; Parker, D. Znorg. Chem. 1987, 26, 644. (g) Haimerl, A,; Merz, A. Angew. Chem., Znt. Ed. Engl. 1986,25, 180. (h) Audebert, P.; Bidan, G.; Lapkowski, M. J . Chem. Soc., Chem. Commun. 1986, 887.
(3) Shu, C. F.; Wrighton, M. S., ACS Symp. Ser., in press.
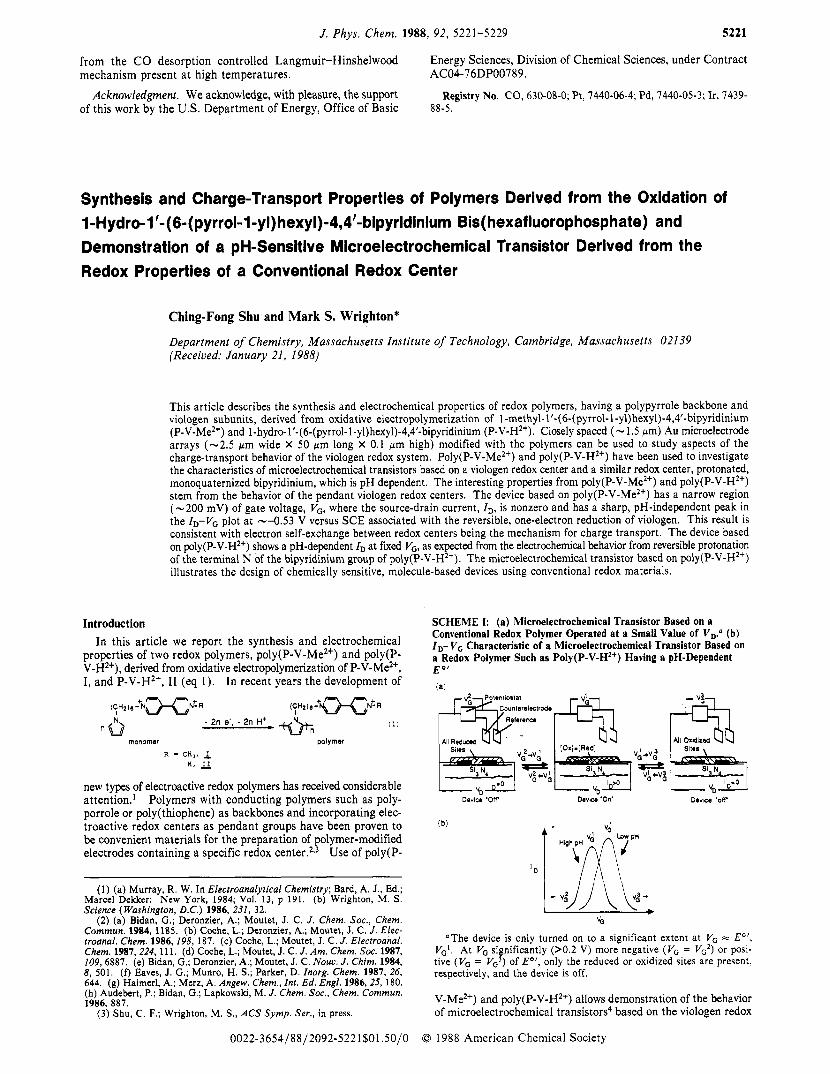
SCHEME I: (a) Microelectrochemical Transistor Based on a Conventional Redox Polymer Operated at a Small Value of VD.. (b) ID- V G Characteristic of a Microelectrochemicak Transistor Based on a Redox Polymer Such as Poly(P-V-H2+) Having a pH-Dependent E O ‘
Dev+i’On’ Dovice ‘OR
“G
“The device is only turned on to a significant extent at VG E O ’ ,
V,’. At VG significantly (>0.2 V) more negative (VG = Vc2) or posi- tive (V, = VG3) of E“, only the reduced or oxidized sites are present, respectively, and the device is off.
V-Me2+) and pOly(P-V-H2+) allows demonstration of the behavior of microelectrochemical transistors4 based on the viologen redox
0022-3654/88/2092-5221$01.50/0 0 1988 American Chemical Society