king s research portal -...
TRANSCRIPT

King’s Research Portal
Document VersionEarly version, also known as pre-print
Link to publication record in King's Research Portal
Citation for published version (APA):Mota, B., Benali, A., & Pereira, J. M. (2014). MODIS 250M burnt area detection algorithm: A case study applied,optimized and evaluated over continental Portugal. In European Geosciences Union : April 29th 2014 (pp.11781)
Citing this paperPlease note that where the full-text provided on King's Research Portal is the Author Accepted Manuscript or Post-Print version this maydiffer from the final Published version. If citing, it is advised that you check and use the publisher's definitive version for pagination,volume/issue, and date of publication details. And where the final published version is provided on the Research Portal, if citing you areagain advised to check the publisher's website for any subsequent corrections.
General rightsCopyright and moral rights for the publications made accessible in the Research Portal are retained by the authors and/or other copyrightowners and it is a condition of accessing publications that users recognize and abide by the legal requirements associated with these rights.
•Users may download and print one copy of any publication from the Research Portal for the purpose of private study or research.•You may not further distribute the material or use it for any profit-making activity or commercial gain•You may freely distribute the URL identifying the publication in the Research Portal
Take down policyIf you believe that this document breaches copyright please contact [email protected] providing details, and we will remove access tothe work immediately and investigate your claim.
Download date: 20. May. 2018

MO
DIS
25
0M
bu
rnt
are
a d
ete
ctio
n a
lgo
rith
m
.
European Geosciences Union – Wildfires Session NH 7.1 - April, 29th 2014 M
OD
IS 2
50
M b
urn
t a
rea
de
tect
ion
alg
ori
thm
.
Bernardo MotaEarth and Environmental Dynamics Research Group,
Department of Geography, King's College London, UK
Akli Benali & Jose Miguel PereiraForest Research Centre, University of Lisbon, Portugal

MO
DIS
25
0M
bu
rnt
are
a d
ete
ctio
n a
lgo
rith
mBackground | Overview | Data | Algorithm | Optimization | Results | Conclusions
I – Background
II – Overview
III – Data
IV – Algorithm
MO
DIS
25
0M
bu
rnt
are
a d
ete
ctio
n a
lgo
rith
m
IV – Algorithm
V – Optimization
VI – Results
VII – Discussion

MO
DIS
25
0M
bu
rnt
are
a d
ete
ctio
n a
lgo
rith
mBackground | Overview | Data | Algorithm | Optimization | Results | Conclusions
•Burned area (BA) analysis is based on detecting the char/ash/scar signals, if
preceded by vegetation, the change highlights a fire event
•Compared with the VISIBLE (0.4-0.7 µm) and the SWIR (2.0-2.5 µm) the NIR
is, unquestionably, the best spectral region to discriminate between burned
areas and other surfaces, such as vegetation and not-too-dark soils. NIR
reflectance can only decrease.
Background
MO
DIS
25
0M
bu
rnt
are
a d
ete
ctio
n a
lgo
rith
m
Visible
NIRSWIR

MO
DIS
25
0M
bu
rnt
are
a d
ete
ctio
n a
lgo
rith
mBackground | Overview | Data | Algorithm | Optimization | Results | Conclusions
Band 2 used for BA detection
•The algorithm presented is
a spin-off of one of
classification algorithms
developed for VGT and
Band
Wavelength
(nm)
Resolution
(m) Primary Use
1 620–670 250Land/Cloud/Aerosols
Boundaries2 841–876 250
3 459–479 500
Land/Cloud/Aerosols
Properties
4 545–565 500
5 1230–1250 500
6 1628–1652 500
7 2105–2155 500
8 405–420 1000
9 438–448 1000
MODIS sensor spectral bands (1-19)
MO
DIS
25
0M
bu
rnt
are
a d
ete
ctio
n a
lgo
rith
m
developed for VGT and
AATSR under the FIRE-CCI
project.
•The algorithm was already
applied to the South
American tropical forest
(EGU 2013 poster)
Ocean Color/
Phytoplankton/
Biogeochemistry
10 483–493 1000
11 526–536 1000
12 546–556 1000
13 662–672 1000
14 673–683 1000
15 743–753 1000
16 862–877 1000
17 890–920 1000
Atmospheric
Water Vapor
18 931–941 1000
19 915–965 1000
... and more 16.

MO
DIS
25
0M
bu
rnt
are
a d
ete
ctio
n a
lgo
rith
m
Aim
Develop a BA detection algorithm for NIR imagery captured by
satellites with high frequency of observation.
Objective
Background | Overview | Data | Algorithm | Optimization | Results | ConclusionsM
OD
IS 2
50
M b
urn
t a
rea
de
tect
ion
alg
ori
thm
Objective
Adjust and optimize the BA algorithm to MODIS 250 m2
imagery for continental Portugal for the period (2001-2013).

MO
DIS
25
0M
bu
rnt
are
a d
ete
ctio
n a
lgo
rith
m
I – Background
II – Overview
III – Data
IV – Algorithm
Background | Overview | Data | Algorithm | Optimization | Results | ConclusionsM
OD
IS 2
50
M b
urn
t a
rea
de
tect
ion
alg
ori
thm
IV – Algorithm
V – Optimization
VI – Results
VII – Discussion

MO
DIS
25
0M
bu
rnt
are
a d
ete
ctio
n a
lgo
rith
mBackground | Overview | Data | Algorithm | Optimization | Results | Conclusions
Overview1. Did a significant and persistent drop in reflectance occur
at a given pixel ?
2. Did it occur in the right time of the year?
Score changes when and how.
Change detection algorithm
Spectral
analysis
MO
DIS
25
0M
bu
rnt
are
a d
ete
ctio
n a
lgo
rith
m
2. Did it occur in the right time of the year?
3. Is it coherent with its surroundings?
Compare with known fire seasonality to
separate other from source of change.
Prob. LUT of Scores vs. Fire seasonality
Look for evidence for similar changes in
the nearby pixels.
MRF segmentation dates & probabilities
Temporal
revision
Spatial
revision

MO
DIS
25
0M
bu
rnt
are
a d
ete
ctio
n a
lgo
rith
mBackground | Overview | Data | Algorithm | Optimization | Results | Conclusions
I – Background
II – Overview
III – Data
IV – Algorithm
MO
DIS
25
0M
bu
rnt
are
a d
ete
ctio
n a
lgo
rith
m
IV – Algorithm
V – Optimization
VI – Results
VII – Discussion

MO
DIS
25
0M
bu
rnt
are
a d
ete
ctio
n a
lgo
rith
mBackground | Overview | Data | Algorithm | Optimization | Results | Conclusions
•MODIS 250 m2 (MOD09DQ) daily NIR band (2) images for tiles
covering continental Portugal (h17v04 and h17v05) for the
period 2001-2013 – input to the algorithm
•MOD09DA cloud mask layer information available from the
500 m2 reflectance daily images (2001-2013) – cloud screening.
Data
MO
DIS
25
0M
bu
rnt
are
a d
ete
ctio
n a
lgo
rith
m
500 m reflectance daily images (2001-2013) – cloud screening.
•Fire Activity Distribution (0.5o) based on adjustments made
with von Mises distributions to active fire counts(Benali et al.
2012) – penalize off-season events.
•Landsat derived BA binary maps at 30 m2 (2001-2009) –
parameter optimization and accuracy assessment.

MO
DIS
25
0M
bu
rnt
are
a d
ete
ctio
n a
lgo
rith
m
I – Background
II – Overview
III – Data
IV – Algorithm
Background | Overview | Data | Algorithm | Optimization | Results | ConclusionsM
OD
IS 2
50
M b
urn
t a
rea
de
tect
ion
alg
ori
thm
IV – Algorithm
V – Optimization
VI – Results
VII – Discussion

MO
DIS
25
0M
bu
rnt
are
a d
ete
ctio
n a
lgo
rith
m
Time-series analysis
High daily variability (~15%)
Background | Overview | Data | Algorithm | Optimization | Results | ConclusionsM
OD
IS 2
50
M b
urn
t a
rea
de
tect
ion
alg
ori
thm
Time-series of the NIR reflectance for a pixel located in the centre of
Portugal over forest for year 2005.
Low density
of obs.
Low density of obs.
Major disturbance

MO
DIS
25
0M
bu
rnt
are
a d
ete
ctio
n a
lgo
rith
m
Time-series analysis - Construct a series of ρρρρNIR minima
High
contamination
Background | Overview | Data | Algorithm | Optimization | Results | ConclusionsM
OD
IS 2
50
M b
urn
t a
rea
de
tect
ion
alg
ori
thm
Determine the upper and lower envelopes of time series. Oscillation
maxima are “noisier”, affected by residual atmospheric contamination.
Lower contamination

MO
DIS
25
0M
bu
rnt
are
a d
ete
ctio
n a
lgo
rith
m
Time-series analysis – Robust filtering
Background | Overview | Data | Algorithm | Optimization | Results | ConclusionsM
OD
IS 2
50
M b
urn
t a
rea
de
tect
ion
alg
ori
thm
•Robust filtering of minima time series, to remove cloud shadow
spikes in ρNIR.
•Determine the absolute minimum refectance of the time-series.
ρNIR minimum
Filtered time series
niiy :1}min{=
MO
DIS
25
0M
bu
rnt
are
a d
ete
ctio
n a
lgo
rith
m
Time-series analysis – Change detection
Background | Overview | Data | Algorithm | Optimization | Results | ConclusionsM
OD
IS 2
50
M b
urn
t a
rea
de
tect
ion
alg
ori
thm
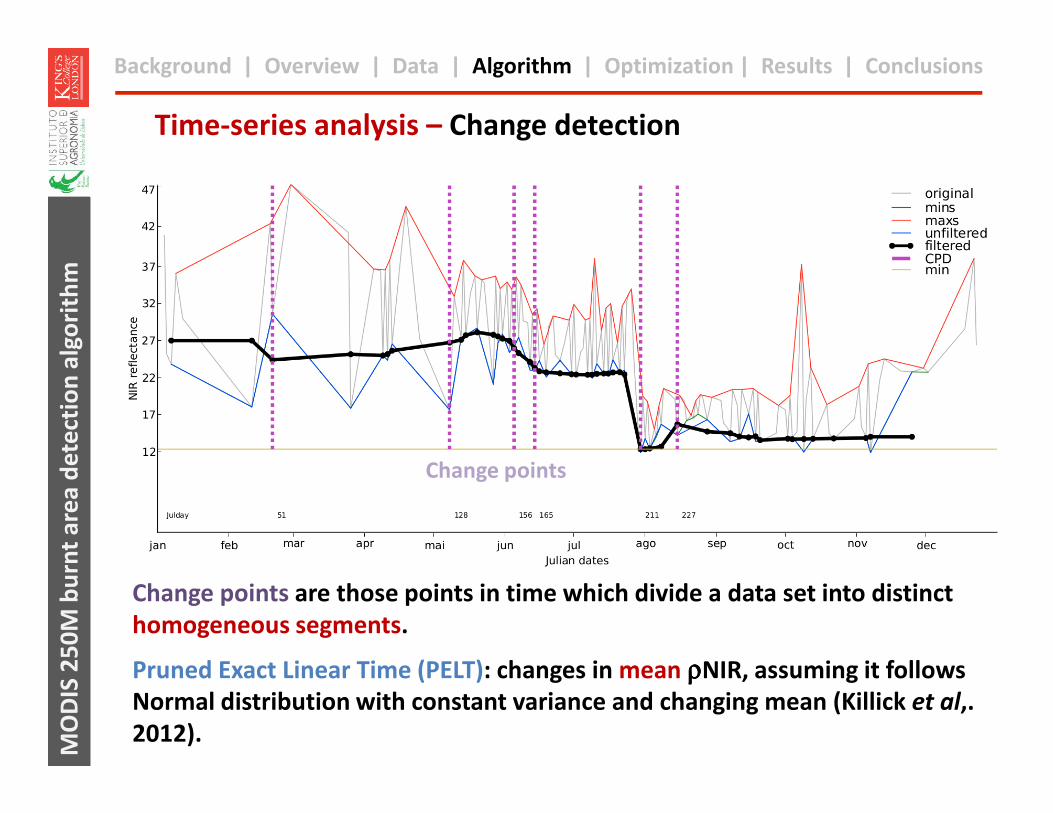
Change points are those points in time which divide a data set into distinct
homogeneous segments.
Pruned Exact Linear Time (PELT): changes in mean ρρρρNIR, assuming it follows
Normal distribution with constant variance and changing mean (Killick et al,.
2012).
Change points

MO
DIS
25
0M
bu
rnt
are
a d
ete
ctio
n a
lgo
rith
m
CP scores represent the “likelihood” of corresponding to a perturbation
event. The score magnitude at a given CP is determined by the ratio
between ρNIR drop and its potential drop.
where
is the mean ρNIR of the post-CP time segment
ρ
KS
SS
i
ii
−
− +1
1+iS
Time-series analysis – Change point scoring
Background | Overview | Data | Algorithm | Optimization | Results | ConclusionsM
OD
IS 2
50
M b
urn
t a
rea
de
tect
ion
alg
ori
thm
is the mean ρNIR of the pre-CP time segment
M is
K is
iS
2.0*8.0 <⇒ MM
niiy :1}min{=
2.016.02.0*8.0 ≥⇒= M
factor to allow better
discrimination post-change
ρNIR = minimum ρ value.
increases the spectral difference between
post-change reflectance and the time
series minimum

MO
DIS
25
0M
bu
rnt
are
a d
ete
ctio
n a
lgo
rith
m
Time-series analysis – Select CP
Background | Overview | Data | Algorithm | Optimization | Results | ConclusionsM
OD
IS 2
50
M b
urn
t a
rea
de
tect
ion
alg
ori
thm
Form all change points that are associated with a decrease select the one
with the highest score. It represents the biggest distrunbance leading to
lower reflectance.

MO
DIS
25
0M
bu
rnt
are
a d
ete
ctio
n a
lgo
rith
m
Scores
Time-series analysis – Outputs
Date
Background | Overview | Data | Algorithm | Optimization | Results | ConclusionsM
OD
IS 2
50
M b
urn
t a
rea
de
tect
ion
alg
ori
thm
NIR pertubations due to vegetation removal may also result from other
causes: harvesting, grazing, windthrow, or defoliation by plant pests and
diseases.
CP score and associated date will serve as imputs to the temporal revison

MO
DIS
25
0M
bu
rnt
are
a d
ete
ctio
n a
lgo
rith
mBackground | Overview | Data | Algorithm | Optimization | Results | Conclusions
Graphic of DOY and CP
P1
Se
aso
na
lity
LUT
Pro
ba
bil
ity
Temporal revision
B
Se
aso
na
lity
Se
aso
na
lity
Seasonal fire distribution example
Centre PTNorth PT
MO
DIS
25
0M
bu
rnt
are
a d
ete
ctio
n a
lgo
rith
m
P2
P3Score
Se
aso
na
lity
The conversion of pertubations into “probabilities” takes into account
the date of the year and the magnitude of the scores.
LUT probability surface is defined assuming 2 types of score vs.
Seasonality relations: Off fire-season (A) and during fire-season (B) and
is generated from 3 parameters (P1, P2, P3). Rate of change is defined by
a logit function (P4, P5).
A
Se
aso
na
lity

MO
DIS
25
0M
bu
rnt
are
a d
ete
ctio
n a
lgo
rith
mBackground | Overview | Data | Algorithm | Optimization | Results | Conclusions
• The last processing step is to classify the pixels taking into
account the spatial and temporal relations between them.
• The solution is one that solves the maximum a posteriori –
Markov random field (MAP-MRF) problem by determining the
max. flow/min. source-sink cut in a graph, where the source is
Spatial revision
MO
DIS
25
0M
bu
rnt
are
a d
ete
ctio
n a
lgo
rith
m
max. flow/min. source-sink cut in a graph, where the source is
the vertex “unburned” and the sink is the vertex “burned”.
•This partition gives the segmentation of the image into
unburned and burned pixels.

MO
DIS
25
0M
bu
rnt
are
a d
ete
ctio
n a
lgo
rith
m
Spatial revision
Vertex are the pixels that have
edges:
1. connecting to “unburned” or
“burned” with length defined by
the burnt probability. Decision to
10 x 10 pixel representation
Background | Overview | Data | Algorithm | Optimization | Results | ConclusionsM
OD
IS 2
50
M b
urn
t a
rea
de
tect
ion
alg
ori
thm
the burnt probability. Decision to
which made by a threshold (Tr).
2. connecting surrounding pixels
with length defined by the day
difference over a maximum
allowed (Dmax).

MO
DIS
25
0M
bu
rnt
are
a d
ete
ctio
n a
lgo
rith
mBackground | Overview | Data | Algorithm | Optimization | Results | Conclusions
I – Background
II – Overview
III – Data
IV – Algorithm
MO
DIS
25
0M
bu
rnt
are
a d
ete
ctio
n a
lgo
rith
m
IV – Algorithm
V – Optimization
VI – Results
VII – Discussion

MO
DIS
25
0M
bu
rnt
are
a d
ete
ctio
n a
lgo
rith
mBackground | Overview | Data | Algorithm | Optimization | Results | Conclusions
Optimization Scheme
Input
Variables
Bootstrap
Resampling
Calibration Data Set Validation Data Set
N = 50
MO
DIS
25
0M
bu
rnt
are
a d
ete
ctio
n a
lgo
rith
m
Calibration Data Set
(70%)
OptimizationSearch for the Parameters set
that Maximize Coen’s Kappa
Validation Data Set
(30%)
Evaluation

MO
DIS
25
0M
bu
rnt
are
a d
ete
ctio
n a
lgo
rith
mBackground | Overview | Data | Algorithm | Optimization | Results | Conclusions
I – Background
II – Overview
III – Data
IV – Algorithm
MO
DIS
25
0M
bu
rnt
are
a d
ete
ctio
n a
lgo
rith
m
IV – Algorithm
V – Optimization
VI – Results
VII – Discussion

MO
DIS
25
0M
bu
rnt
are
a d
ete
ctio
n a
lgo
rith
mBackground | Overview | Data | Algorithm | Optimization | Results | Conclusions
Algorithm Performance
MO
DIS
25
0M
bu
rnt
are
a d
ete
ctio
n a
lgo
rith
m
Initial Empirical Parameters
Optimized Parameters
Optimized Parameters with Spatial Revision

MO
DIS
25
0M
bu
rnt
are
a d
ete
ctio
n a
lgo
rith
mBackground | Overview | Data | Algorithm | Optimization | Results | Conclusions
2001 2002 2003 2004
MO
DIS
25
0M
bu
rnt
are
a d
ete
ctio
n a
lgo
rith
m
2005 2006 2007 2008

MO
DIS
25
0M
bu
rnt
are
a d
ete
ctio
n a
lgo
rith
mBackground | Overview | Data | Algorithm | Optimization | Results | Conclusions
2009 2010 2011 2012
MO
DIS
25
0M
bu
rnt
are
a d
ete
ctio
n a
lgo
rith
m
2013

MO
DIS
25
0M
bu
rnt
are
a d
ete
ctio
n a
lgo
rith
mBackground | Overview | Data | Algorithm | Optimization | Results | Conclusions
I – Background
II – Overview
III – Data
IV – Algorithm
MO
DIS
25
0M
bu
rnt
are
a d
ete
ctio
n a
lgo
rith
m
IV – Algorithm
V – Optimization
VI – Results
VII – Conclusions

MO
DIS
25
0M
bu
rnt
are
a d
ete
ctio
n a
lgo
rith
mBackground | Overview | Data | Algorithm | Optimization | Results | Conclusions
•The flexibility of the algorithm to bad data and atmospheric
contamination.
•Easily adapted to other regions limited only by the
availability and consistency of a time series of observations.
Conclusions
MO
DIS
25
0M
bu
rnt
are
a d
ete
ctio
n a
lgo
rith
m

MO
DIS
25
0M
bu
rnt
are
a d
ete
ctio
n a
lgo
rith
mBackground | Overview | Data | Algorithm | Optimization | Results | Conclusions
•Explore the use of Object based classifications to the
resulted date of the year maps
•Improve the optimization procedure and evaluate the cost
function of the spatial revision
Future work
MO
DIS
25
0M
bu
rnt
are
a d
ete
ctio
n a
lgo
rith
m
•Adjust parameters and apply to Mediterranean regions (not
only in Europe but also in US, Australia, South America and
Australia)

MO
DIS
25
0M
bu
rnt
are
a d
ete
ctio
n a
lgo
rith
mBackground | Overview | Data | Algorithm | Optimization | Results | Conclusions
Benali A., Mota B., Pereira J.M.C., Oom D., Carvalhais N. "Global patterns of vegetation fire
seasonality" In proceeding of European Geophysical Union General Assembly (2013)
Killick R., Paul F., I. A. Eckley I. A. "Optimal detection of changepoints with a linear
computational cost." Journal of the American Statistical Association 107.500 (2012): 1590-
1598.
Mota B., Pereira J.M.C., Campagnolo M., Killick R. "MODIS 250m burned area mapping based
on an algorithm using change" (2013) In proceeding of European Geophysical Union General
References
MO
DIS
25
0M
bu
rnt
are
a d
ete
ctio
n a
lgo
rith
m
on an algorithm using change" (2013) In proceeding of European Geophysical Union General
Assembly (2013)
Thank you