kjtn distributed by - defense technical information … · process leading to separation and the...
TRANSCRIPT
AD-787 427
FRACTURE IN A TENSILE SPECIMEN
Joseph I. BTuhm, et al
Army Materials Research Agency Watertowti, Massachusetts
July 1966
DISTRIBUTED BY:
KJTn National Technical Information Service U. S. DEPARTMENT OF COMMERCE 5285 Port Royal Road, Springfield Va. 22151

AMRA MS 66-06
I ■ s
FRACTURE IN A TENSILE SPECIMEN
/
m
m
cm
m
MONOGRAPH SERIES
n mm i. iLim
Mtf
IMEIT J. M0IIISSEY
JILY till
Repro-furnd by
NATIONAL TECHNICAL INFORMATION SERVICE U S Department of Commerce
Springfield VA 22151
D r t i
W OCX 22 ETC
UUE K5EUÜ F
LfeüJ
M S. ARMY MATERIALS RESEARCH AGENCY
WATEITIWR, HASSACRISETTS 12172
&

FRACTURE IN A TENSILE SPECIMEN
Joseph I. Bluhra
and
Robert J. Morrissey
July 1966
Presented at
International Conference on Fracture
Sendai, Japan September 196S
DILI.
/
FRACTURE IN A TENSILE SPECIMEN
Joseph I. Bluhm'- J and Robert J. Morrissey1- "•
There appears to have been little or no attempt to study the stress or strain conditions under which internal fracture starts and/or propagates in the neck of a tensile specimen. Using a continuous ultrasonic "searching" technique, this "incipient" internal fracturing has been Investigated in a variety of low strength ductile metals. Voids of approximately 0.001 inch in size have been signalled ultrasonically and confirmed metallographically. This paper is centered around the evaluation of crack propagation with emphasis on void formation and coalescence and interpretation in terms of a non-adiabatic shear separation process.
INTRODUCTION
The tensile test is perhaps one of the most studied and utilized of mechanical tests for evaluation of materials. Nevertheless, there are still many facets of materials behavior as exemplified by this test which are still ill understood. Even in the matter of ultimate tensile strength and its associated criteria and strains, soms clarification is required. Beeuwkes,™ for example, has shown that one muse distinguish between incip- ient maximum load and incipient necking - that these are not necessarily the same points on the load-deformation curve - that the strain at maximum load may be appreciably different than the strain at incipient necking.
Certainly the state of stress and strain within the neck is known only to a degree of approximation, as suggested by such investigators as Bridgman, ^ Skudnov and Sokolov, PJ or Davidenkov and Spiridonova. i6-» One of the obvious motivations for these latter studies is the determination of
1. Chief, Applied Mechanics Research Laboratory, U. S. Army Materials Research Agency, Watertown, Massachusetts 02172, U.S.A
2. Mechanical Engineer., U. S. Army Materials Research Agency, Watertown, Massachusetts 02172, U.S.A.
3. Beeuwkes, R., Personal communication, Watertown Arsenal Laboratorien, Watertown, Mass. 1952-1960.
!». Bridgman, P. W., Transaction of American Society for Metals, Vol. 32, 19M*. pp. 553-57»».
5. Skudnov, V. A., »rid Sokolov, L. D., Industrial Laboratory, Vol. 30, No. 9, September 196U, pp. 1388-1390.
6. Davidenkov, N. N., and Spiridonova, N. I., Proceedings of ASTM, Vol. U6, 19«*6, pp. 111*7-115*8.

the stress and/or strain state, for example, in the neck of a specimen so that a more systematic presentation of stress-strain curves can be made in terms of significant effective stresses (or strains) which require the knowl- edge of all the component stresses (strains). This use of the "neck" stress state has indeed served its purpose; it is commonplace to present effective stress-strain data veil into the necking region and, in fact (as ve shall later see), too far into the necking region for valid results. A second important and obvious use tc which these "neck" results can be applied is for the determination of the stress (strain) state, particularly at incipient fracture. It has been suggested L/»8*9»1^ that fracture in smooth ductile specimens initiates generally as minute crack or void formation in the inter- ior of the neck region near the specimen axis. Knowledge of the stress (strain) state within the specimen, therefore, is necessary if one hopes to verify a fracture criterion.
Once cracking, tearing, void formation, or even localized concentration of slip bands has started, then,of course, the idealized neck analysis of the above investigators is invalid and one is left with a condition for which extremely little is known.
Eventually, the cracking and/or tearing proceeds to a point where fur- ther deformation of the specimen takes place principally by a gross shearing process leading to separation and the associated well-known shear lip or "cone" of the cup-cone fracture. We shall speculate in this paper that this ultimate shear separation is, in fact, merely a smooth continuation of the earlier flow and necking process which is considered to have been momentarily interrupted by the initiation and propagation of the interior voids or crack; but that when the conditions for continued tearing, i.e., the hydrostatic tension, diminshed sufficiently, the flow again proceeds but now under a condition which can be closely approximated by a plane strain in lieu of the more complex rotational symmetric state. Furthermore, our results indicate that separation of the specimen is not necessarily adiabatic but behaves so only from the circumstances of the flexibility of the loading system and specimen.
In the usual tensile test, the quantities generally measured are the yield strength, tensile strength, elongation, <wid th< reductior of area. The first two delineate the onset, at least approximately, of distinct phenomena, "yielding", and "necking", or instability. As already implied above, however, there is at least one additional stress level which should be observed and
7. Plateau, J., Henry, G., and Crussard, C, Review de Metallurgie, Vol. 51*, 1957, p. 200.
8. Low, J. R., Jr. Fracture of Solids - Drucker, D. C, and Gilman, J. J., Editors, Interscience Publishers, 1962, p. 197.
9. Puttick, K. E., Philosophical Magazine, Vol. 1», 1959, p. 96*4. Also Vol. 5, I960, pp. 759-762.
10. Rogers, H. C, Fundamental of Deformation Processing, Syracuse Univer- sity Press, 196U. Also Transactions of AIME, Vol. 218, i960, p. U98.
/
—-a

recorded, and that is the point at vhich fracture "first" occurs. Most commonly, this is assumed to he the same as the stress at vhich the specimen breaks into two pieces, but this generally is far from the truth. For an unnotched and reasonably ductile metal, this initial "fracture" occurs near the longitudinal axis of the specimen la the region of the neck - after the neck has formed but before separation. In a conventional test, deformation continues under continued loading until the specimen breaks rapidly and un- controllably into two pieces. The load at vhich this occurs is used to cal- culate the fracture stress. The true local stress at in*cial or incipient fracture generally is considerably different than the stress at rapid separ- ation, particularly in ductile specimens. The final stages of specimen separation take place generally by formation of shear lips as distinct from the more flat internal fracture. A specially-designed rigid device permitted the present investigators to control this entire separation stage in several materials vhich normally failed rapidly and vithout control.
The percentage reduction of area (% R.A.) is a measure commonly made and generally based upon the initial and final diameter. It has become not uncommon currently to recognize the distinction betveen the uniform R.A. and thst associated vith localized necking. In viev of the occurrence of inter- nal fracture, appreciably in advance of final separation, one might indeed inquire into the real significance of an R.A. referred to the post separation areas. This point is discussed in detail in the main text.
In the usual tensile test, the stiffner.s of the specimen and testing machine is very low, and rapid disruption of the specimen results at some point in the test. This condition for rapid ductile fracture vas shown by OrovanLllJ to be governed by the relation
d2W u d2U
dx2 dx2
where
U ■ elastic energy of the specimen
W ■ plastic work required for next contraction luring an increment dx of plastic extension.
This relationship is equivalent to specifying that rapid necking occurs when the slope of the plastic load deformation curve is the same (except for sign) as the gradient of elastic load deformation release lines. At point P of Fig. 1, for instance, a virtual plastic displacement would result in the load dropping more rapidly than the force required for further yielding; so that the condition at P is stable until further extension is enforced. At point Q, the specimen is unstable. Any further extension leads to a situation where the clastic force drops off less sl'«wly than the force required for further yielding; hence, rapid necking proceeds at the expense of the stored elastic energy in the specimen and/or testing machine. This is the so-called elastic-plastic instability which Orowan calls high velocity ductile frac- ture. With a "stiffer" tensile tester, the elastic load release line will tend toward the vertical, and rapid ductile fractures will tend to occur
11. Orowan, E., Journal of Applied Physics, Vol. 26, July 1955, pp. 900-902.

further to the right of point M (i.e., at greater extension). In fact, rapid ductile fracture may be virtually suppressed completely with a suffic- iently rigid machine.
It should be quite apparent by now that in spite of the long history of the "straightforward" and "simple" tensile test, a great deul is still un- known so far as the significance of some of the properties measured there- from. It is hoped that the present study will throw some light on some of the aforementioned considerations.
MATERIALS
Except for a few preliminary testi* conducted on an initial small batch of copper Cu-I, some SAE l43**0 steel, and some SAE 1026 steel, t?»e principal test program was centered about a second batch of commercially-pure copper Cu-II and an SAE 1020 and SAE 8620 steel. The composition and conventional mechanical properties are given in Tables I and II respectively. The fonr. and/or condition of the materials as used are as follows:
Copper I - one length of 1 inch diameter cold drawn rod. SAE 1026 steel - one length of 1 inch diameter cold rolled rod, as
received (annealed). SAE U3U0 steel - one length of 3A inch diameter cold rolled rod,
heat treated to R ■ Ul. c
(Specimens taicen from the above three materials were machined concentric with the bar stock axis).
Copper II - one length of 2 inch diameter cold drawn rod; specimens machined symmetrically (four to a cross-section) on a 1-3/16 inch diameter.
SAE 1020 steel - one length of 2-3A inch diameter rod, as received (annealed); specimens machined symmetrically (six to a cross-section) on a 1-7/8 inch diameter.
SAE 8620 steel Grade CEVME - one length of 2 inch diameter rod; specimens machined symmetrically (four to a cross- section) on a 1-1/U inch diameter as received.
Microphotographs of the Cu-II, SAE 1020, and 8620 in the virgin, i.e., unstrained state, are shown in Fig. 2,L12J ^, and It, respectively.
TESTING PROCEDURE
In order to investigate the initiation and growth of the fracture path including the stage of shear lip formation, it was necessary to develop a reasonably stiff "tensile testing machine". Starting with a design after McClintock, et al,^3^ several major modifications were incorporated; these were principally for the purpose of (a) facilitating continuous loading;
12. The scale and/or magnifications shown in all microstructures apply before reduction for reproduction.
13. McClintock, F., Alpaugh, H., Dougel, S., and Kuebler, M., Massachusetts Institute of Technology, Research Memorandum No. 38, 1962. (unpublished)
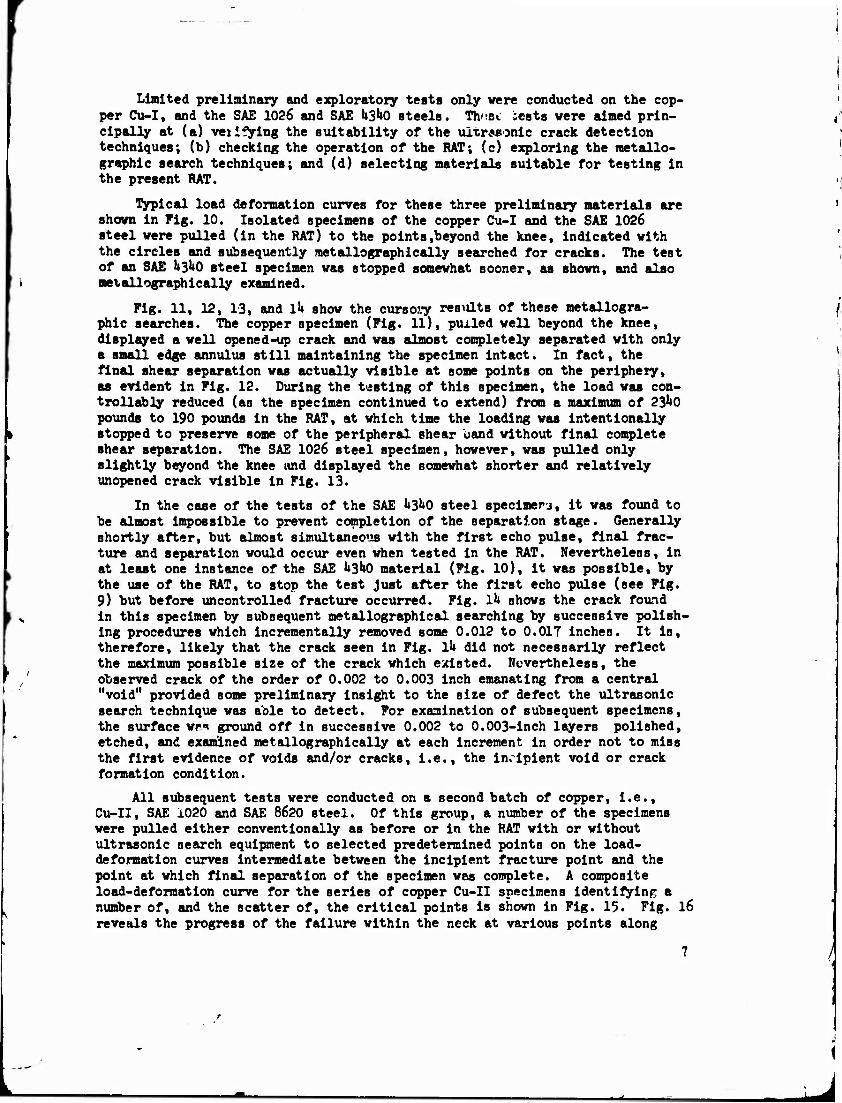
(b) preventing the possibility of transmitting torsion to the specimen; and (c) accommodating an ultrasonic crystal as a crack detecting system.
The Rigid AMRA Tester (RAT) enabled the investigators to maintain com- plete control over crack growth throughout all stages of fracture in smooth tensile specimens of ductile materials and control in the earlier stages of the fracture of more brittle materials. Some further refining is desirable to permit control in high-strength brittle materials of the later stages of crack growth.
A schematic representation of the RAT assembly is shown in Fig. 5 and an exploded view in Fig. 6. Specimens of 0.<?52 inch diameter were consistently used. Other pertinent dimensions of the specimen ere shown in Fig. 7.
The specimen is assembled in the RAT and set up in a tensile testing machine. A load of approximately 100 pounds &*♦] is applied with the tensile tester03 to permit rotation of the collar (via the collar spokes) without rotating the grips of the tensile testing machine. Relative rotation of the collar on the threads engaging it to the collar grip determines the width of the gap between the lower bearing plate and the internal face of the collar.
The extent to which the specimen may elongate, hence, the extent to which plastic deformation including necKing and/or internal fracture may occur after the maximum load is reached, is governed by the width of this gap. Increments of specimen elongation (increments of gap width) are measured by the extent of the rotation of the collar beneath the threcd advance indicator. The collar surface that the indicator is pressed against has radial gradua- tion8 engraved on it at 10 degree intervals which corresponds to 0.002 inchB6J of specimen elongation. F.longation can be controlled in increments of about 0.0005 ineb.D6J provided the applied load of the tensile tester does not exceed the load on the specimen by more than several hundred pounds.
When the RAT is set up in a tensile tester with the 100 pound preload applied, the gap is widened to a sufficient width to allow the specimen to elongate to maximom load» At maximum load, the RAT is bottomed (gap width * 0) and the applitd load of the testing machine is increased several hundred pounds, which goes almost entirely to elastically deform the collar a small amount.
Rotating the collar a small amount (in the direction tending to open the gap) will allow the specimen to elongate slightly and cause a reduction in the hitherto constant applied load of the testing machine. The applied load
lk. This requirement can be simply eliminated by merely torsionally clamping the specimen grips to any convenient fixed reference point.
15. Henceforth, in th» present text, "tensile machine" or "tensile tester" will refer to a typical tensile testing Machine; whereas, RAT will refer to the device which is used in conjunction with a tensile testing machine in order to enhance the effective stiffness of the tensile testing machine.
16. These can be refined readily by changing the thread to a finer pitch.
/
.ta_4

is again increased to several hundred pounds greater than the load on the specimen before the second rotation of the collar. By this procedure, the gap is kept closed and rotation of the collar merely permits a controlled deformation of the specimen to take place.
Repetition of this above incremental elongation procedure allows com- plete control of crack growth throughout all stages of fracture in the more ductile materials and in the earlier stages of fracture of brittle materials. The splined coupling prevents the transmission of torque through a partially fractured specimen as the collar is rotated.
The load on the specimen, which is equal to the applied load of the ten- sile tester only when the gap in the RAT is not zero, is recorded on a strain indicator connected to a load cell in series with the specimen.
In addition to mechanically controlling the deformation of the specimen, a 1/U-inch-diameter, 5 megacycle quartz crystal ultrasonic transducer mounted on the end of the specimen was used to continuously "search" the specimen for signs of the initial internal crack appearance.
Photographs of typical ultrasonic response signals (pulse-echo technique) at various load stages are shown in Fig. 8 and 9 for Copper Cu-I and SAE U3U0 steel, respectively. These figures show two large "pips", the input pulse on the left and ih* back echo on the right. The pip at the left center is a specimen shoulder echo. Pips indicating fracture appear at right center. The multiple "crack pips" (see Fig. 8c) are thought to be due to the irregular reflecting surface of the fracture. A loss in the amplitude of the recorded signal as deformation increased (indicated by the relative height of the back echo "pip") can be noted by comparison of these photographs. This appears to be attributable to both the presence of attenuation resulting from plastic flow and the formation of the fracture.
Metallographic observations were made to verify the ultrasonic techniques and to determine crack profile, the relationship of grain structure, and crack orientation.
Initially, the Metallographie searching procedure consisted of grinding the mounted specimen parallel to its axis and polishing and examining them microscopically at several depths approximately 0.010 inch apart near the axis. This crude technique proved to be inadequate in attempting to verify the earlier stages of fracture where the predominant fractures were consider- ably smaller than 0.010 inch and, in many instances, originated at radial distances relatively remote from the axis. Consequently, specimens were mounted and ground to a distance of approximately 0.U of the radius from the axis and then examined at depth intervals of 0.002 to 0.003 inch. These incre- mental removals of material were accomplished by merely repeating the final steps of the normal polishing procedure.
RESULTS AND DISCUSSION
General
Some six materials, as indicated in Tables I and II, were examined in all. These were tested in simple tension in either a conventional Tinius Olsen 120,000 pound hydraulic unit alone or in conjunction with the Rigid AMRA Tester.
/
Limited preliminary and exploratory tests only were conducted on the cop- per Cu-I, and the SAE 1026 and SAE U3U0 steels. Th^sc vests were aimed prin- cipally at (a) verifying the suitability of the ultrasonic crack detection techniques; (b) checking the operation of the RAT; (c) exploring the reetallo- graphic search techniques; and (d) selecting materials suitable for testing in the present RAT.
Typical load deformation curves for these three preliminary materials are shown in Fig. 10. Isolated specimens of the copper Cu-I and the SAE 1026 steel were pulled (in the RAT) to the points.beyond the knee, indicated with the circles and subsequently metallographically searched for cracks. The test of an SAE U3b0 steel specimen was stopped somewhat sooner, as shown, and also metallographically examined.
Pig. 11, 12, 13, and Ik show the cursory results of these metallogra- phic searches. The copper specimen (Pig. 11), puxled well beyond the knee, displayed a well opened-up crack and was almost completely separated with only a small edge annulus still maintaining the specimen intact. In fact, the final shear separation was actually visible at some points on the periphery, as evident in Pig. 12. During the testing of this specimen, the load was con- trollably reduced (as the specimen continued to extend) from a maximum of 23^0 pounds to 190 pounds in the RAT, at which time the loading was intentionally stopped to preserve some of the peripheral shear oand without final complete shear separation. The SAE 1026 steel specimen, however, was pulled only slightly beyond the knee und displayed the somewhat shorter and relatively unopened crack visible in Pig. 13.
In the case of the tests of the SAE k$k0 steel specimerj, it was found to be almost impossible to prevent completion of the separation stage. Generally shortly after, but almost simultaneous with the first echo pulse, final frac- ture and separation would occur even when tested in the RAT. Nevertheless, in at least one instance of the SAE U3U0 material (Pig. 10), it was possible, by the use of the RAT, to stop the test just after the first echo pulse (see Pig. 9) but before uncontrolled fracture occurred. Pig. lU shows the crack found in this specimen by subsequent metallograph!cal searching by successive polish- ing procedures which incrementally removed some 0.012 to 0.017 inches. It is, therefore, likely that the crack seen in Pig. Ik did not necessarily reflect the maximum possible size of the crack which existed. Nevertheless, the observed crack of the order of 0.002 to 0.003 inch emanating from a central "void" provided some preliminary insight to the size of defect the ultrasonic search technique was able to detect. Por examination of subsequent specimens, the surface WF* ground off in successive 0.002 to 0.003-inch layers polished, etched, and examined metallographically at each increment in order not to miss the first evidence of voids and/or cracks, i.e., the incipient void or crack formation condition.
All subsequent tests were conducted on a second batch of copper, i.e., Cu-II, SAE 1020 and SAE 8620 steel. Of this group, a number of the specimens were pulled either conventionally as before or in the RAT with or without ultrasonic search equipment to selected predetermined points on the load- deformation curves intermediate between the incipient fracture point and the point at which final separation of the specimen was complete. A composite load-deformation curve for the series of copper Cu-II specimens identifying a number of, and the scatter of, the critical points is shown in Pig. 15. Pig. l6 reveals the progress of the failure within the neck at various points along

thi« curve and, finally, Fig. 17 is the corresponding tru? stress-true strain curve. Fig. 18, 19, and 20 relate similarly to the SAE 1020 steel specimens and Fig. 21, 22, and 23 relate to the SAE 8620 steel specimens.
Rather than presenting or plotting the curves for all specimens tested, a typical representative curve is shown for each material and when more than one curve was obtained, then the individual points correspond'ig to critical points for the other specimens of the same material were superposed on the curve. Since curves of duplicate specimens for a given material were essen- tially identical up to the point of detection of incipient fracture, the curve shown represents the typical behavior to this point. The additional notations for individual specimens at incipient fracture and at incipient shear are self- explanatory. The apparent scatter in location of critical points stems from the slightly different total elongation of the different specimens. The final "drop off" in load normally observed and identified in Fig. 15, 18, and 21, with the notation "uncontrolled separation"«corresponds to uncontrolled rapid ductile fracture and is associated with the use of a "soft" testing machine. On the other hand, the "drop off" shown in the solid line was obtained by tho "use of the RAT and corresponds to a slow well-controlled fracture and/or shear separation. This will be discussed more fully later.
Detailed summary data corresponding to the measurements and computation at the following critical points along the load-deformation curve are tabu- lated in Tables III, IV, and V.
a. Initial state, d. Incipient shear, b. Incipient necking, e. Final state. c. Incipient fracture
(void and/or crack formation),
Here a. and e. refer merely to the initial shape and final shape (after separa- tion) of the specimen respectively, and b. refers to the condition at necking.
Detailed discussion of the tests, observations, and data outlined above are given in the following sections, particularly with respect to incipient fracture and incipient shear separation.
Incipient Fracture (Void or Crack Formation)
The point of incipient fracture (void or crack formation) was determined using the ultrasonic search technique described earlier and was taken as the point at which a first echo pulse was observed in the recording oscilloscope. It was expected that this initial cracking would occur within the neck of the specimen. Accordingly, it was possible to anticipate approximately where this echo pulse would appear in the observed trace, thus facilitating its identi- fication provided, of course, the echo was a direct reflection from the crack and not an indirect bounced reflection as one might expect from the surface of a crack inclined to the axis of the specimen. In order to be reasonably cer- tain that the echo pulses were indeed indicative of the presence of a crack, several of the preliminary specimens were X-rayed at various stages of defor- mation beyond the occurrence of the first echo; but because of the limited sensitivity of this method, cracks were "visible" only after an appreciably greater deformation and crack extension than that at which the first echo
8

/ /
jpulse was observed. Nevertheless, X-rays did serve to substantiate the pres- ence of gross cracks at greater deformations. Earlier detection and/or con- firmation was, however, desired; therefore, several specimens were selected in which the testing had been terminated just as an echo pulse had just been observed. These were deformed slightly additionally to accent the crack and then metallographically "searched".
Pig. 2kt 25, 26, 27, <?8, and 29 show the results of subsequent similar surveys on the copper Cu-II, SAE 1020, and SAE 8620 materials respectively deformed to Just before the final knee. It will be observed that rather than having a well-defined single void and/or crack as could be anticipated, there appears to be a small domain in the neck region in which a number of small voids and/or mlcrocracks are concentrated. In no specimen was a large well- defined single crack observed; rather, a domain of multiple tiny cracks or voids was evident. This latter observation is consistent with those of Rogers. P°J In the copper specimen (Fig. 2k and 25), the void formation is highly oriented in the longitudinal direction; whereas, this preferred orienta- tion was not evident in either of the other two materials (Fig. 26 and 27 or Fig. 28 and 29). From other tests of specimens not extended quite so far but rather to only slightly beyond the first ultrasonic echo pulse, it was evident that the void or microcrack domain Initiated approximately at the echo point and expanded under continued deformation. From these examinations, it was further evident that the poist of Incipient fracture, like the true yield strength of a metal, depends upon the sensitivity of the detection system, either ultrasonically or metallographically. Undoubtedly, initial void forma- tion or cracking occurred somewhat sooner than when we were able to detect it. Nevertheless, no further significant effort was made to further define incip- ient fracture beyond the acceptance of a reasonably evident indication from our ultrasonic search system. It was possible to get somewhat earlier detec- tion by increasing the sensitivity of the amplifiers, but this also introduced considerable "noise" and made certain detection somewhat more doubtful. Based, however, upon the overall limited experiences reported, it is estimated that voids and/or cracks of the order of 0.001 inch could be defined with a high degree of certainty and that defects appreciably smaller than this were un- doubtedly being detected.
Occasionally, either no indication oi a crack became evident till very late in the load history, or the critical indication suggested a crack much further from the detection crystal than the neck. This was attributed to the initial development of the void or crack in an oblique orientation as, for example, in a conical surface (the volcano configuration) which could cause the reflecting echo to take a long path back to the crystal thus creating the illusion of a somewhat more distant void or crack.
Nevertheless, for most of the specimens, a sharp indication was observed and was reasonably reproducible from specimen to specimen. Based upon the result of these well-behaved specimens, incipient "fracture" was well defined. At this apparent incipient fracture point in the load deformation curve, measurements were made of the load, the minimum cross-sectional diameter of *.he necked section, and the neck profile radius. Calculations were made using it* Bridgman analysis ^ for the stress distribution in the neck. Fig. 30 shows typical stress results - note the rather shallow drop off in longitudinal stresses from the peak center value as the radial distance increases. The gentle drop off in this stress distribution (approximately 20 percent) undoubt- edly accounts for some of the off-center voids and cracks and for the finite

domain inhabited by these early voids - particularly noticeable in Fig. 2k and 28. The difference in the peak longitudinal stress at the axis and at the edge of the specimen is a measure of the hydrostatic tension. The presence of this hydrostatic field contributes prominently to the minute void or crack formation process leading to shear deformations and subsequent fracture which must, therefore, of necessity, be restricted to short range (microscopic) P7J paths.
Rows 13 to 16 inclusive (Tables HI to V) summarize the state of stress and strain specifically at the center of the necked region for incipient frac- ture. These values may be used to calculate the effective stress P"3 and effective strain,P8J which will be uced later to unify the tensile deformation process. The maximum longitudinal stresses are given in row '3.
Note the comparison below (taken from Table? Ill, IV, and V) of the rela- tive level of ultimate, incipient fracture, and conventional fracture strengths:
Copper II SAE 1020 SAE 8620
Ultimate Strength 1*2,100 60,U00 77.U00
Incipient Fracture 6T.500 101,500 130,000 Strength
Conventional Fracture 73,000 116,500 lUl.UOO Strength
Crack Propagation and Incipient Shear
After incipient fracture, i.e., void/crack formation, continued loading of the specimen appears to have the influence of increasing the density of the voids/cracks and expanding the domain populated by them. Eventually, the load-deformation curve undergoes a marked break or "knee" in the curve, and the load drops steeply relative to the deformation (see rig. 15 and 16, or 18 and 19, or 21 and 22). Metallographic examination of specimens pulled up to t.iis point failed to reveal in any of the specimens examined any signs of a gross (nonmicroscopic) crack and, in fact, showed only regions well popu- lated with microscopic (a) voids, (b) interfacial non-connected cracks at inclusions, or (c) short intercrystalline cracks. As indicated in the previous section, Fig. 2U through 29 sh«v typical appearance of the neck region at or Just prior to the knee in the three principal test materials. These metallo- graphic results further show that though the void/crack populated domain is of appreciable size, as observed above, at the knee of the curve there is no evidence of the development of the gross shear lips. Note the absence of any visible alignment of voids or cracks or shear deformation along the potential shear bands.
17. For ideal flawless materials, a. sufficiently hi»h, mire hvdrost*tic ten- sion would lead to cleavage without prior shear deformation. However, for real materials, inherent defects and natural crystalline anisotropy gives rise, even under pure externally applied hydrostatic tension, to local short range shear fields and the consequent possibility of shear flow and fracture on a localized basis.
18. Defined later.
10
■ <■» 1 * ■ 1 —^———tj>fc

Fig. 31 through 3** inclusive, show the typical microstructure in copper Cu-II and SAE 8620 specimens pulled to a load .just beyond the "knee". Although a number of SAE 1020 specimens were tested, no SAE 1020 specimens were photo- graphed in this position; but the results were essentially identical. In almost every case for each of the materials examinen, a simple crack or network of microcracks was evident-, but it was still not possible to positively identi- fy the onset of the gross shears associated with the ultimate shear lip forma- tion. The void/crack domain size, nevertheless, was appreciably expanded, as is quite evident by comparison of Fig. 28 and 33. However, for specimens pulled further along the load-deformation curve, the operation of lip formation becomes visible and obvious. In fact, for a number of specimens pulled well beyond the knee of the curves, as for the copper Cu-I mentioned earlier (Fig. 10, 11, and 12), the shear lip may be completely developed at some angular posi- tions of the specimen. Fig. 35, 36, and 37 show the corresponding partial shear lip development in specimens of copper Cu-II, SAE 1020, and SAE 8620, respectively. The shear separation is clearly visible on the surface.
More detailed metallographic views of several copper specimens deformed well beyond the "knee" are shoim in Fig. 11 and 38 through 1*5 inclusive. There are revealed in Fig 11 and Fife,-. M and 1*5, a considerable number of holes elongated in the di. action of ths applied load and generally concentrated in the necked region. In the specimen shown in Fig. 11, a surface step formed by radial yielding is i.?ted at the left end of the crack. Two local shear zones form the upper and lower boundaries of the material that yielded radially. Reorientation of the inclusion holes along the shear zone paths can also be observed and is quite evident in Fig. 1*5, where again a surface step is visi- ble. Here, cavity coalescence appears to be concentrated along the shear zones. Final separation can apparently also take place as a tensile failure, as suggested by Puttick PI (see, for example, right side of Fig. 11). Here, we note that where the tearing approaches the right surface, the fracture develops between the two shear flow zones. The process by which the fracture ppreads toward the specimen surfaces appears to be one of coalescence of inclu- sion holes which enlarge with straining. It is Interesting to note that where the fracture approaches the right surface,the high strain bands, visible along the plane of maximum shear stress, are almost coincident with another at the upper left region.
Gross opening of the void/crack network does not appear to occur in the materials examined until the flow field becomes concentrated into the narrow shear band which eventually develops into the shear lip. Only then do the relatively large shear deformations in these bands lead through the deforma- tion compatibility requirements to the growth of the void into gross cracks which microscopically open up. Fig. 13 shows, for example, the crack detail in an SAE 1026 specimen pulled Just beyond the knee; here the cracks have extended, but no significant opening is noticeable nor were there any signs of lip formation. However, tests of the Cu-II, SAE 1020 and SAE 8620 pulled to points well beyond the knee and, in some cases almost to the point of com- plete separation, showed definite microscopic opening of the crack and, in fact, quite visible shear band formation. Fig. 38 through 1+1 and Fig. h2 through 1*5 show the detailed appearance in copper Cu-II specimens of the cracks at (a) an intermediate point between the knee and total separation, and (b)
11
^—» * m i—■——m±

/ /
at almost total separation. Fig. U6 and 1»7, and U8 and 1»9 correspond equiva- lently in the SAE 1020 steel. Fig. 50 and 51 show the unetched details of an SAE 8620 specimen deformed to an intermediate position between the knee and final separation.
The general zig-zag configuration evident in most of these specimens is consistent with the behavior proposed by Rogers.t>°J Rogers has shown that under continued deformation voids form and tend to coalesce to form larger holes. Furthermore, he has suggested that these voids tend to form in sheets at plus or minus 30 to Uo degrees from the longitudinal axis of the specimen, and the subsequent rupture follows one of these alternative paths. The rupture then tends to propagate always back toward the plane of maximum stress in the plane perpendicular to the longitudinal axis; hence, the fracture vacillates amongst these two paths and results in the zig-zag fracture path that one fre- quently observes. The internal zig-zag steps are relatively short because of the high hydrostatic tension; but as the crack propagates toward the free sur- faces, this component diminishes and the last zig is large,forming the so- called shear lip. P9J
From these numerous observations, both macroscopic as well as microscopic, it appears that the knee is associated with the commencement of the gross shear deformation which eventually culminates in the shear lip. As this gross def- ormation proceeds, the "porous" domain at the interior of the neck undergoes a period of gross coalescence or expansion of voids, as a result of the required compatability of deformation of the neck interior and the mate *al playing a part in the shear lip formation.
Assuming then that incipient shear separation is indeed associated with the drop off observed in the load-deformation curve, it is further suggested that this final shear separation is merely a continuation of the earlier flow process which led first to necking and then to incipient cracking or void formation and that this latter process merely interrupted temporarily the flow process. If these are indeed the circumstances under which final shear separ- ation occurs, then it should be possible to construct an effective stress- effective strain curve of the material which should exhibit reasonable contin- uity through the necking and incipient fracture point as well as the incipient shear separation point. The data reflecting the stresses and strain'- at this Incipient shear separation point are given in Tables III to V. The results of the effective stress-effective strain correlation are discussed later.
19. Ideally, if the hydrostatic tension fields persisted as coalescence pro- ceeded, final fracture would, of necessity, be by cleavage and no shear could occur. However, for real materials having defects and crystalline anisotropy, even a pure hydrostatic tension field applied in the center region of the specimen does give rise to local "short range" shear fields with their resultant possibility of shear fracture—but on a localized basis. As the crack or void domain extends toward the free surfaces, the hydrostatic field diminishes until essentially a simple biaxial or uni- axial stress field predominates and gives rise then to a long range shear field and to a final gross shear separation forming the eventual shear lip or "cone" of the typical cup-cone tensile fracture.
12
/
k&JH

It has frequently been suggested that both the "drop in bean" phenomenon, at upper yield, heralding the onset of flow in a tensile specimen, as veil as the final shear separation, are adiabatic processes. Indeed, in the usual testing system employing a relatively flexible loading machine, both these occur with such speed as to justify the assumption of adinbaticity. However, the implication that at least the latter of these phenomenon must, of necessity, be adiabatic does not appear to be substantiated by our tests. Specimens which consistently failed in a rapid uncontrolled and presumably adiabatic manner when tested conventionally in a "soft" testing machine, behaved ideally when tested in our RAT. Not only was rapid uncontrolled fracture with the accompanying obliteration of the related load-deformation curve avoided, but it was possible to repeatedly start and stop the fracturing process and obtain the entire load-deformation history from incipient shear separation +o final _ complete separation. These tests were conducted at speeds which would appear"°J to assure more nearly isothermal conditions than adiabatic. The curves shown in Pig. 15, 18, and 21 show the result of testing in the RAT; when tesied in a convent ;ial tester, the curves dropped abruptly and uncontrollably at the point Identified by the notation "uncontrolled separation". This sometimes happened even in the RAT in view of its limited stiffness. A redesign is under- way to stiffen the tester.
Resume
From ou' studies, it appears that the fracturing process is related to the load-deformation curve in the following r*neral manner:
a. After "necking" and in the environment of a hydrostatic tension field concentrated in the central region of the "neck", tiny microscopic cracks and/ or voids develop at inclusions, crystallographic defects, or grain boundaries._ (particularly triple points), etc., in much the fashion described by Puttick,"J Be ach am, PlJ and Gurland and Plateau. P2JI These continue to nucleate expanding over an internal volume presumably governed by the applied load and the shape of the neck—the larger the ratio of the profile radius R to the cross-section- al radius a, i.e., R/a, the larger the volume of void participation in the failure process—the smaller the R/a, the more confined the volume of void
20. Deformation rates step-wise for a given specimen corresponded to a mini- mum average value of head motion (approximately 1-1/2 Inches gage length) of 0.0001 in/min.
21. Beecham, C. D., Transactions of ASM, Vol. 56, 1963, pp. 318-326.
22. Gutland, J., and Plateau, J., Transactions of ASM, Vol. 56, 1963, pp. UU2-U5U.
13
«t—> ■ m ^mm^^mm^mt^
participation. P3J Under the influence of the hydrostatic tension, short range shear fields predominate and provide the driving force for rupture between voids and/or cracks,
b. Thus, with continued gross extension of the specimen, the void/crack volume expands leaving a matrix weakened by voids/cracks in the center of the neck region and an outer periphery of metal in a substantially unfractured state and in a state of zero or low hydrostatic tension. This xlaal annulus of solid material is, therefore, under a long range shear field and begins to shear in a gross manner in the narrow bands which will delineate the final shear lips. Compatability of deformation then causes gross coalescence of the central voids to form large macroscopically visible internal cracks which grow as the final shear lips are formed. The matrix network ruptures either by localized necking of ligaments, per Kraft.P1^ or by shear, per Edelson et al.[25» 26] This latter gross shear separation is associated with the "knee" of the load-deformation curve.
c. Finally, depending on the relative stiffness of the testing system, the specimens either separate rapidly and approximately adiabaticaHyP^ forming the final shear lips,or the specimens may be controlled so that separ- ation is a slow, essentially isothermal,process. Examination of several speci- mens of the c^per Cu-II and the steels tested in both manners failed to show significant macroscopic differences. The sheax Mps not only were not suppressed in the controlled tests, but were identical in size and appearance to those obtained by conventional test.
It was earlier suggested that the final shear separation might well be a delayed continuation of the earlier flow and necking process and that if this were indeed the case then within the accuracy of calculation one would expect
23. The larger the R/a the more gentle the neck and the less pronounced is the hydrostatic tension influence. Hence, the significant flow stresses would be solely the longitudinal stress which would be essentially uniform and cover a large volumetric domain in which void and/or crack formation could occur. On the other hand, for small R/a, the neck i~ pronounced and localized; the hydrostatic tension component is significant but restrictad to a small volumetric domain within the neck, and void/crack formation would be accordingly restricted.
2b. Krafft, J., presented at ASTM Special Committee on Fracture Testing of High Strength Metals (ASTM-FTHSM), Cleveland, Ohio, 9 September 196U.
25. Edelson, B., Transactions of ASM, Vol. 56, No. 1, March 1963, pp. 82-89.
26. Edelson, B., and Baldwin, W., Transactions of ASM, Vol. 55« No. 1, March 1962, pp. ?30-250.
27» The rapid (adiabatic) separation may occur at a point in the load-deforma- tion curve prior to the normal "knee" - its position is governed by a criteria equivalent to that by Orowan (loc cit).
14
/
-«— - —^-

a smooth effecvive stress-effective strain P8J curve encompassing all the so- called critical points. Accordingly« at the maximum load point, at incipient cracking and at incipient shear separation, the three components of stress and strain were determined (as described below) and then combined to form the effective stresses and effective strains. P*Q Fig. 52 shows the results of such a procedure. Here the effective stress-effective strain curve is plotted. Through the point of incipient necking, the analysis of stresses and strains is straightforward. Between necking and incipient cracking, the stresses are determined using the Brldgman procedure; the strains are determined from the measured diameter of the neck and from the assumption of uniform strain dis- tribution across the neck and incompressibility. At the incipient shear point,
the stresses were based upon (a) the observed axial load and the correspond- ing remaining annular cross-section determined by post-facto examination; (b) the assumption of a plane strain condition which permitted an approximate cal- culation of the hoop stress; and (c) the assumption o,~»0 (since it is zero at outside surface and zero at internal surface of crack or void domain). The strain calculations were based upon the measured diameter, the assumption ej.*e0, and incompressibility of material. The data for and the results of these computations are indicated in Tables III to V and are plotted as indicated in Fig. 52. Much remains to be desired in concluding that the incipient shear sep- aration point lies on the smooth extension of the effective stress-effective strain curve. Yet, considering the ambiguity of the cross-sectioned area invol- ved and the uncertainty as to the stress and strain levels in the unfailed annular which develops into the shear lip, it does not seem too unreasonable to consider the final shear to be a final phase of the flow phenomenon started earlier—temporarily interrupted—and finally culminating in shear under a plane strain configuration. Further verification is continuing.
Table VI summarizes some of the reduction of area data for several of the materials and reveals some interesting results. Consider first the convention- ally determined R.A. - this turns out to be approximately, for the specific specimen used for this calculation, 62 percent for the copper Cu-II and SAE 1020 steel and 59 percent for the SAE 8620 steel. However, at the onset of cracking, the R.A.'s are only *»7, ^5* and U3 percent, respectively. In the crack propagation stage or tearing state, the R.A. increases to 57.8, 58.5« and 56.2 percent, respectively; and the last increment in R.A. occurs during the shear separation phase. Percentagewise, the contribution to the ultimate R.A. is predominantly in the region between incipient necking and incipient fracture, though some 2k to 28 percent of the total R.A. occurs after incipient fracture.
28. Effective stresses and strains as used herein are defined in terms of the principal coordinate as follows (where all strains are natural strains):
a eff 4 ^oro2)* ♦ (0,-03*2 ♦ (ofojl
c ■ & \'(e -£ )2 ♦ (c -r )2 ♦ (c -c )2 eff 3 V 61 €2' Vcl e3' Ve2 V
15
MM
Note further that though these all have approximately the name total R.A. and, in particular, the same R.A. at incipient fracture, the distribution in the stages prior to incipient fracture is considerably different i:. the differ- ent materials; the copper was able to sustain 76 percent of the ultimate P.A. in the necking process though essentially a zero uniform strain. The SAE 1020 and SAE 6620, on the other hand, exhibited only U6 to kB percent of the total percent R.A. in the necking process but did absorb 2k.k to 26.8 percent of the total percent R.A. in the prior uniform (non-necking) deformation. In terms of the material strains, again the copper exhibits a nonuniform strain approxi- mately 50 percent in excess of either the SAE 1020 or SAE 8620 with a corres- ponding loss in the uniform strain.
The point to be emphasized here is that if R.A. is to be a measure of duc- tility, perhaps one should specify separately both the "uniform" R.A. and the necking R.A. - not at separation but at incipient cracking. It is expected that the R.A. at incipient cracking is inderd a characteristic of the material and is size independent in ductile materials; wherecs, the conventionally deter- mined R.A. is size dependent. P9»30.3*]
It is interesting to note that the present results Indicate that the major part of the du formation occurs in the necking process prior to any significant cracking or void formation. This is in contrast to the conclusions of Ourland and Plateau, <-22J who suggest the greatest contribution to deformation to be due to growth of cracks.
CONCLUSIONS
On the basis of the test? of the ductile metals described herein, it is concluded that:
1. Incipient fracture occurs by microscopic void and/or crack formation after neck initiation but before the point normally used for fracture stress determination. The incipient frictur occurs in the region of the neck and is detectable nondestructively by the ultrasonic "search" technique described herein.
2. At loads Intermediate to the ultimate and at incipient shear separa- tion, the density of voids and microscopic cracks grows,and the domain occupied with these expands.
3. The stresses at incipient fracture, calculated using the Bridgman analysis, leads to fracture stresses intermediate between the tensile strength and the conventionally determined fracture strength based upon final rapid fracture in a relatively soft machine.
29. DeSisto, T., Carr, F., and Larson, P., U. S. Army Materials Research Agency Report AMRA TR 6U-05, February 1961».
30. Williams, T., and Hall, H., Armauent Research and Development Est., Fort Holstead, Kent, England, ARDE Report (MX) 1/58, January 1958.
31. Miklowitz, J., Journal of Applied Mechanics, June 1950, pp. 159-168.
16
/
'— - —^——^

U. Gross macroscopic cracks are not evident in the interior of the neck of a tensile specimen until the load-deformation curve has exceeded the final MkneeM.
5. The final knee in the load-deformation curve 5s associated with the initiation« growth, and development of the final shear lip, i.e., with incipient shear-separat ion.
6. The usually observe* rapid final fracture of a ductile specimen is a function of the stiffness cf the testing machine and specimen; by using a "hard" machine, this rapid separation can be suppressed. The fracture appear- ance 4 nevertheless, is relatively unaltered and the shear lip is not suppressed in using a hard machine.
7. The final shear separation, which can be completely controlled, is not, of necessity, an adiabatic process.
8. This final shear separation may very well be a continuation of the earlier flow and necking process under a stress state approaching a plane strain condition.
9. The usually measured R.A. reflects not only the results of a flow pro- cess but also the complication associated with void and/or crack propagation and, ar such, is size dependent. A modified H.A. measure based upon the con- figuration at incipient fracture is believed to be a more meaningful measure of ductility.
ACKNOWLEDGMENT
The writers wish to acknowledge (a) Messrs. ?. McEleney, R. Mclntyre, and C. Berryman for providing the ultrasonic detection "know how"; (b) Messrs. F. Cotter and J. Shippie for their concentrated efforts in the metallographic "searching" task; (c) Mr. M. Menaker for his fine craftsmanship in preparing our RAT and much associated equipment; (d) Messrs. S. Nanfria, J. Reagan, J. Hannon, W. Foster, M. Benicek, and R. Lamothe for preparing the many photo- graphs and drawings; and (e) Mrs. E. O'Toole for preparing the manuscript.
17
ä

Table I. CHEMICAL ANALYSIS OF MATERIALS INVESTIGATED
(Composition - Percent by Weight)
Cu Fe c Mn Si | Ni | Cr Mo N P S
Copper Cu-I (NOT DETERMINED)
SAF. 1026 Steel - - 0.275 0.93 - - - - - 0.016 0.C27
SAE 4340 Steel - - 0.39 0.80 0,32 1.87 0.81 0.28 - 0.010 0.013
Copper Cu-II (URS)
99.94 0.00« - - - - - • • . - -
SAE 1020 Steel - - 0.20 0.46 0.04 0.02 0.05 0.01 0.005 0.015 0.022
SAE 8620 Steel - - 0.21 0.89 0.23 0.70 0.51 0.22 - 0.002 0.009
Table II. TFNSILE PROPERTIES OF MATERIALS INVESTIGATED AT ROOM TEMPERATURE
Material
Yield Strength* Tensile Strengtht
(psi)
Fracture Strengtht
(psi)
Elong- ation**
(*)
Reduction of Area
(%) 0.1% (psi)
0.2* (psi )
Copper Cu-I (c)
SAE 1026 Steel
SAE 4340 Steel
Copper Cu-II (URS)
SAE 1020 Steel (GRS)
SAE 8620 Steel <BRS)
nd
nd
166,600
40,400
36,100
47,800
nd
nd
166,500
41,600
36,500
46,900
45,200
101,000
173,500
42,100
60,400
77,400
73,000
116,500
141,400
18.0
nd
21.9
25.0
39.1
37,5
58.0
43.4
52.5
60.5
62.0
59.3
'A alow bend extenaoaeter »•• used under the h «d to obtain load-elongation curves, therefore yield strengths given are approximate valuea.
'Conventional, baaed upon original area.
^Conventional, based upon the load at incipient shear and the final area.
"Percent Elongation waa »enured over a 0.64-inch gage length using specimen with 0.252-inch diameter.
18
\Wt
Table III, COPPER UP
SI S2 S3 S4 t
.Initial St«te 1 Diaaeter (in) Do 2 Load (lb) P. 2095 2065 2065 2080 21 3 Diaaeter (in) n "a
RA "Incipient Necking
S Tangential Strain (in/in) 4» Do/D« ^ 6 Radial Strain (in/in) 7 Longitudinal Strain (in/in) €.a = e,tf • 2-Cn D0/D.
<4
8 Longitudinal Streaa (kai) (true) °» x CT.ff 43.0 42.4 42.4 42.7 4:
9 Load (lb) P« 10 Diaaeter - Miniaua in Neck (in) D, 11 Profile Radiua of Neck (in) R« 12 Reduction of Area (%) RAe 13 Tangential Strain (in/in) e6V ' -tn D0/De
Incipient 14 Radial Strain (in/in) e,e " 2^ D0/De Fracture 15 Longitudinal Strain (in/in)
16 Tangential Streaa (kai) /At Axia of
€.c ■ °"ffe
17 Radial Streaa (kai) {Necked "re 18 Longitudinal Stt-eaa (kaiÄRegion j ^«e 19 Effective Strain (in/in) €.ff 20 Effectivs Strera (kai) °«ff
21 Load (lb) P. 1460 1450/1425! 1430 1490 1425 22 Diaaeter • Miniaua in Neck (in) D„ .166 #
23 Crack Diaaeter (in)** d. .0641.003 24 Profile Radiua of Neck (in) R. .14 25 Reduction of Area {%) RA. 56.7 5
*f ■ ■ 26 Tangential Strain (in/in) e6>. " -4 D./D. -.416 ..
Incipient Shear
27 Radial Strain (in/in) 28 Longitudinal Strain (in/in)
6r. " €,a " 2IH D„/D,
-.416
.831 -.
29 Tangential Streaa (kai) &0, * 1/2 <7.. 38.6 3 30 Radial Streaa (kai) °ra " 0 0 31 Longitudinal Streaa (kai) °.a " P./t7T/4(D2 -d,
2>] 77.3 7 32 Effective Strain (in/in) £eff .831 #
33 Effective Stress (ksi) CT.ff 66.9 6
34 Diaaeter (in) »f .158 Final State 35 Reduction of Area (%) (apparent)
36 Effective Strain (in/in) (apparent) RA, e.f * lla D0/D,
60.6
.931
Extension
•"■ ~ I».»-»- •«!«■.«.• wv>«a-B • - - -»■_..--<■ «««— ~-0 "'
Aa A prefix iaplie» testing in the Rigid AURA Teste
♦incipient eheer calculations sere baaed upon tnia 1<
fBased upon reaulta of other spaciaeas, loading of tl
"Poet aeparatioa diaaatera d( »ere aaaaared only on
(see sketch). For other speciaeas, the average rslu
/
aaaVl at*

ble III. COPPER - URS SERIES
Specimen Identification*
Avg. S2 S3 S4 A5 S6 A7 | A8 A9 A10 All S12 SI 3 S14
0.252 i 0.001
0.252
2065 2065 2080 2075 2085 2075 2075 .249 2.4
-.012 -.012 .024 42.6
2075 2040 2065 2105 2035 2075 2075 .249 2.4
-.012 -.012 .024 42.6 42.4 42.4 42.7 '.2.6 42.8 42.6 42.6 41.9 42.4 43.2 42.8 42.6
•
>
1635 .179 .23
49.6 -.342 -.342 .683
10.35 10.35 70.0 .683 59.6
1685 .189 .28
43.8 -.288 -.288 .576 8.76 8.76 64.5 .576 55.7
1625 .178 .23
50.2 -.346 -.346 .692 10.3 10.3 69.5 .692 59.2
1700 .186 .25
45.2 -.304 -.304 .608 10.0 10.0 67.0 .608 57.0
1660 .185 .25
46.1 -.310 -.310 .620 9.64 9.64 66.4 .620 56.8
1660 .183 .25
47.0 -.317 -.317 .634 9.81 9.81 67.5 .634 57.7
i
»03
1
►
1450/1425« .166
.14 56.7
-.416 -.416 .831 38.6
0 77.3 .831 66.9
1430 1490 1425/1380* .164
.14 57.6
-.430 -.430 .859 38.5
0 77.0 .859 66.7
1350« .160
.0641.003 .14
59.4 -.454 -.454 .908 40.0
0 80.0 .908 69.3
1435/1335« .163
.14 58.1
-.435 -.435 .870 37.8
0 75.6 .870 65.5
1405 1375/1320« .164
.14 57.6
-.430 -.430 .860 36.9
0 73.8 .860 63.9
1440/1360« .163
.14 58.1
-.436 -.436 .871 38.5
0 77.0 .871 66.7
1335/1280« .161
.13 59.2
-.448 -.448 .896 37.5
0 75.0 .896 65.0
1430
.0651.003
1490«f .167
.16 56.0
-.412 -.412 .824 39.8
0 79.7 .824 69.0
1550«! .173
.17 52.9
-.375 -.375 .751 38.3
0 76.6 .751 66.3
1425 .165 .064 .145 57.6
-.426 -.426 .852 38.4
0 76.9 .852 66.6
1 i
.160 59.4 .908
.156 61.6 .960
.158 60.5 .931
testiag in • etaadard testing aackiaa.
testiag ia the Rigid AURA Taater (RAT).
calationa «era baaad apoa this lead.
of other apeciaeaa, loediag of tkia •peciaen aaa «tupped jaat prior to the knee.
aetera d, «ere aeaaarad oaly oa Speciaeaa SI, S6 aad S12 and represent the disasters of the flat region of the frectare
th.r apeciaeaa, the average »alee «as aaed.
/
19
«ifltei

Table IV. SAE 1020 STEEL
SI S2 A3 A4 A5 S6
'Initial State 1 Disaster (in) D. *
b Incipient Necking
2 Load (lb) 3 Dianeter (in) 4 Reduction of Area (%) 5 Tangential Strain (in/in) 6 Radial Strain (in/in) ? Longitudinal Strain (in/in) 8 Longitudinal Stress (ksi) (true)
P.
c0e ■ "» D./D. £r. * ffla c.a " «aft" 2*i D0/D, ".. -*.ff
2910 2940 2950 2910 2950 2950
70.1 70.8 71.0 70.1 71.0 71.0
'Incipient Fracture
9 Load (lb) 10 Diaaeter - Miniaua in Neck (in) 11 Profile Radiua of Neck (in) 12 Reduction of Area (X) 13 Tangential Strain (in/in) 14 Radial Strain (in/in) 15 Longitudinal Strain (in/in) 16 Tangential Stress (ksi) At Axis or 17 Radial Stress (ksi) [Necked 18 Longitudinal Stress (ksi)Wegion / 19 Effective Strain (in/in) 20 Effective Stress (ksi)
P. Dc «.
e0c - M D„/De
ete - 2*1 D0/De
e.ff <Mf
Incipient Shear
21 Load (lb) 22 Diaaeter - Miniaua in Neck (in) 23 Crack Dianeter (in)'* 24 Profile Radius of Neck (in) 25 Reduction of Ares (%) 26 Tsngential Strain (in/in) 27 Radial Strain (in/in) 28 Longitudinal Strain (in/in) 29 Tsngentisl Stress (ksi) 30 Radial Stress (ksi) 31 Longitudinsl Stress (ksi) 32 Effective Strain (in/in) 33 Effective Stress (ksi)
p.
<». R. RA, «e. ■ -*> D./D. cr. s €»s e„ = 2*. D0/D. o-Ö, = L/2 ".. °t» = ° <*,, P,/l7T/4<D,2.d,2)J
'eil CT,ff
2220 2210
,1001.008
2120/2050» .162
.16 58.7
-.441 -.441
.882 80.4
0 160.8
• 882 139.2
2030* .159
.16 60.1
-.460 -.460
.920 84.6
0 169.3
.920 146.6
2150/1960* .162
.16 58.9
-.443 -.443
.887 77.0
0 154.1
.887 133.4
.1001.001
'Final State 34 Diefseter (in) 35 Redurtion of Ares (%) (apparent) 36 Effective Strain (in/in) (apparent)
RAf
€,, • J-JB D0/D,
.154 62.8 .«f!6
.156 61.8 .959
.155 62.2 .972
r If V •An S prefix 1
An A prefix i
^Incipient »he
/ fBesed upon re
/ +In testing th 1 testing; ■ el
■plies ■ pi ies
ar csi
«lti
is ape igst s
.«•tins i testing i
dilations
of other s
eiaen, the trsis-sgis
a s standard tasting aacsise. I the Rigid AHRA Tester (RAT).
>ere bssed upon this losd.
re nss a delay of one to two aoatbs bete« [ effect Bay have been tbua introduced.
"Post separation disaster» d§ were «assured only on Speciaens S2, Si, ! the fracture (aaa sketch). For other speciaens, the sversge value sat
\s Extension
/

e IV. SAE 1020 STEEL - GRS SERIES
Specimen Identification*
A»g. A4 AS S6 S7 A8 | S9 A10 Sll A12 SI 3 SI 4 S15 Al 6 S17 Al 8
0.252 i 0.001 0.252
2910 2950 2950 3010 29301 3020 0.230 i 0.001
1 3000 3040 3000 2950 3000 3010 3000 2950 3050 2976 0.230 16.7
-.091 -.091
.182 71.6
1— -I -.091 -.091
.182 72.7
h
70.1 71.0 71.0 72.S 70.6 72.2 73.2 72.2 71.0 72.2 72.5 72.2 71.0
m
73.4 249S 2670 2620 2550 7580 2720 2575 272S 2617 .184 .191 .182 .180 .185 .194 .182 .192 .186
.32 .58 .40 .33 .42 .72 .31 .56 .46 46.8 42.5 47.9 49.0 46.1 40.8 47.8 42.0 45.3
-.314 -.277 -.324 -.336 -.307 -.262 -.324 -.271 -.302 -.314 -.277 -.324 -.336 -.307 -.262 -.324 -.271 -.302
.628 .554 .648 .672 .615 .524 .648 .542 .604 11.6 7.08 11.8 11.8 9.55 9.52 12.7 7.35 10.2 11.6 7.08 11.8 11.8 9.55 9.52 12.7 7.35 10.2 99.4 99.0 108.6 105.5 101.0 95.0 106.2 97.6 101. S
1 .628 .554 .648 .672 .615 .524 .648 .542 .604 87.7 91.9 96.8 93.7 91.3 85.5 93.5 90.2 91.3
.0» 2030* 2150/1960* 2200 2250/2100« 2200 2380»+ 2360f+ 2300**+ 2380*1+ 2240/2150* 2250+ 2205M 2275/2160» 2197/2141 .159 .162
.1001.006 .162
.0981.007 .1021.005 .164 .167 .163 .162 .163 .163
.100 .16 .16 .15 .16 .17 .14 .15 .15 .16
60.1 58.9 58,9 57.4 56.0 58.2 58. S 58.2 58.3 i -.460 -.443 -.443 -.429 -.412 -.436 -.443 -.436 -.438
-.460 -.443 -.443 -.429 -.412 -.436 -.443 -.436 -.438 .920 .887 .887 .838 .825 .872 .r 87 .872 .876
I 84.6 77.0 80.4 86.7 84.8 82.6 86.4 83.0 82.9 | 0 0 0 0 0 0 0 0 0
169.3 154.1 160.8 173.4 169.6 165.3 172.9 166.1 165.9 .920 .887 .887 .858 .825 .872 .887 .872 .876
146.6 133.4 139.2 150.2 146.8 143.1 149.7 144.1 143.7
.155 .156 .155 .154 .155 62.2 61.8 62.2 62.8 62.2
• .972 .960 .972 .986 .973
iard ttitii| aacbiea.
id AMRA T..t.r (RAT).
id upon tftja load.
loading of tbia apeciaea «as stopped jeet prior to the knee.
delay of oa< to t»o aoetbe beteeea tbe obaerratioa of the first ultrasonic pip and sebaequeut aay Kara bcaa thus introduced.
eured oaly oa Spceiaeaa S2, S6, S9 aad Sll aad raprcacat tba diaaatara of the flit rsfion of peciaena, tba average value •■■ aaad.
21
_Xl
Table V. SAE 8620 STEEL BRS
SI S2 A3 A4 A5
■Initial State 1 Diameter (in) D. .252
2 Load (lb) P. 3870 3880 3860 3900 3840 3 Diameter (in) D. .23! 4 Reduction of Area (%) RA, 15.9
b. ■ . Incipient 5 Tangential Strain (in/in) Cfl, " "£» D„/D, -.087 Kecking 6 Radial Strain (in/in)
7 Longitudinal Strain (in/in) 8 Longitudinal Stress (ksi) (true)
e,. " e.if ■ 2VD.D. °".n *°.ff
-.087 .174 91.7
9 Load (lb) pc 10 Diameter - Minimum in Neck (in) De 11 Profile Radiua of Neck (in) Be 12 Reduction of Are* {%) RAC
13 Tangential Strain (in/in) e6e ■ -& D./De
'incipient 14 Radial Strain (in/in) 15 Longitudinal Strain (in/in)
re Be etc » 24n D0/De
Fracture 16 Tangential Stress (ksi) At Axis of\ 17 Radial Stress (ksi) fNecked 18 Longitudinal Stress (ksi )\pe(,j0tt / 19 Effective Strain (in/in)
^re °-.e e.ff
20 Effective Stress (ksi) <T.ff
21 Load (lb) P. 2900* 1000« 2670 2730 2>?0* 22 Diameter - Minimum in Neck (in) D. .157 .161 .161 23 Crack Diameter (in)** d. .0921.007 .087 ±.007 .0921.005 . 24 Profile Radius of Neck (in) R. .125 .11 25 Reduction of Area (%) "*• 61.3 59.2 59.1 26 Tangential Strain (in/in) **. ■ "fa D./D. -.474 -.448 -.448
Incipient 27 Radial Strain (in/in) e" " e2« -.474 -.448 -.448 Shear 28 Longitudinal Strain (in/in) CIt - 2ln D./D, .948 .89« .896
29 Tangential Stresa (ksi) °"0, " 1/2 o-.u 111.9 109.4 105.8 30 Radial Stress (ksi) arg ■ 0 0 0 0 31 Longitudinal Stress (ksi) c.» " P./[w/4(D.,-d,I)l 223.9 218.9 211.6 32 Effective Strain (in/in) e.ff .948 .896 .896 33 Effective Stresa (ksi) °.ff 193.8 189.5 187.2
34 Diameter (in) Uf .157 .161 .160 .162 .161 'Final State 35 Reduction of Area (%) (apparent) RAf 61.3 59.2 59.7 58.8 59.1
36 Effective Strain (in/in) (apparent) eif = 2-{n D0/Df .948 .896 .908 .883 .896
Extension
•An S prefix iaplies testing in • stsadsrd testing ■•chine.
An A prefix iaplies testing in the Rigid AMRA Tester (RAT)
♦incipient sheer calculations were based upon this liad.
fBsaed upon results of other specimens, loading of this apt
"Post seperation disasters dg were aeasured only on Specie« the fracture (see sketch). For other speciaens, the sveri
/
■Been
SAE 8620 STEEL - BRS SERIES
Specimen Identification*
Vvg. 2 A3 A4 AS S6 S9 A10 Sll A12 SI 3 SI 4 S15 Al 6 S17 A!8 .252 .251 .252 .252 .252 .252 .252 .252 .252 .252 .252
80 3860 3900 3840 3850 3900 3910 3830 3850 3890 4000 3920 3915 3880 3900 3887 .231 .229 .228 .228 .230 .230 .230 .229 .230 .229 15.9 16.8 18.1 18.1 16.7 16.7 16.7 17.3 16.7 16.9
-.087 -.091 -.100 -.100 -.091 -.091 -.091 -.096 -.091 -.093 -.087 ..091 -.100 -.100 -.091 -.091 -.091 -.096 -.091 -.093
1 .174 .182 .199 .199 .182 .182 .182 .191 .182 .186 91.7 93.4 94.0 94.5 96.4 94.4 94.3 94.2 94.0 94.1
3310 3500 3470 3500 3480 3550 3430 3490 3466 .181 .1925 .190 .186 .1925 .196 .188 .1915 .190
.20 .48 .38 .46 .43 .30 .45 .50 .411 48.3 41.9 43.1 45.5 42.0 39.5 44.3 42.2 43.3
-.331 -.268 -.282 -.305 -.271 -.250 -•■»91 -.274 -.284 -.3*1 -.268 .282 -.305 -.271 -.250 -.291 -.274 -.284 .662 .536 .56* .610 .542 .500 .582 .548 .568
17.45 10.9 13.65 11.8 12.08 16.45 11.67 10.56 13.07 17.45 10.9 13.65 11.8 12.08 16.45 11.67 10.56 13.07
• 140.0 125.5 131.5 134.2 127.5 125.8 130.0 126.0 130.0 .662 .536 .564 .610 .623 .500 .582 .548 .568 ,
122.5 114.6 117.8 122.0 115.4 109.4 118.4 115.5 116.9
00« 2670 273Ö 2900» 2920» 2830/2800t 2865/2780t 3040M 3040M 3050 3080t| 2880 2888/2940 161 .161 .163 .167 .165 .1675 .1675 .171 .164 ±.007 .0874.007 .092*.005 .0901.009 .090 .11 .17 .17 .20 .20 .20 .167 9.2 59.1 58.1 56.1 57.2 55.8 55.8 54.0 57.4 »48 -.448 -.431 -.412 -.423 -.408 -.408 -.388 -.426 448 -.448 -.431 -.412 -.423 -.408 -.408 -.388 -.426 896 .896 .862 .824 .846 .815 .815 .775 .853 9.4 105.8 100.5 90.2 92.6 97.0 97.0 92.8 99.7
0 0 0 0 0 0 0 0 0 h.O 211.6 20i. 1 180.4 185.3 194.1 194.1 185.6 199.4 896 .896 .862 .824 .846 .815 .815 .775 .853
[9.5 187.2 158.9 156.2 160.4 168.1 168.1 160.7 171.4
kl61 .160 .162 .161 .163 .160 F9.2 59.7 58.8 59.1 58.1 59.3 896 .908 .883 .896 .862 .900
•tiag in • standard tatting ■•chin«.
at»ag in the Rigid AURA Teeter (RAT).
atioaa war* baaed upon (his load.
other apacinana, loading of this specimen «as stopped just prior to the knee.
era d( «era ^assured only on Specineaa S2, A4, AS and S6 and represent the diiaetera of the flat region of en). For other specimens, the average value «as aaed.
23
/
ilfi

Table VI. STRAIN DATA
Copper [60.5* RA] SAE 1020 [62% RA] SAE 8620 59.3X RA]
* RA (X RA) (X RA) C| X RA X
(X RA) -0«
(X RA) ei X RA (X RA) (X RA) «1
Init. State
Incip. Neck
Incip. Frac.
Incip. Shear
Final
0.0
2.4
47.0
57.6
60.5
O.ON
...
77.7>
95.2/
100.0/
«.0
75.7
17.6
».6
0.0
0.02
0.63
0.86
0.93
0.0
16.7
45.3
58.3
62.0
O.Oj
26.9*
73. V
94.0/
100.0/
»«.2
20.»
o.O
0.0
0.18
0.60
0.88
0.97
0.0
16.9
43.3
57.4
59.3
0.0v
28. y
73.0^
96.8)
lOO.Of
28.5
•4.5
25.«
J.2
0.0
0.19
0.57
0.85
0.91
25
art

o < o
26
EXTENSION
Fig. I. CRITERION FOR HIGH VELOCITY DUCTILE FRACTURE (AFTER OROWANl ')
U. S. ARMY MATERIALS RESEARCH AGENCY
19-M6-706/AMC-65
/
A tit»

ETCHED COPPER CU H IOOX
FIG. 2 MICRO STRUCTURE VIRGIN STATE
U. S. ARMY MATERIALS RESEARCH AGENCY 19-066-730/AMC-65
27

Mit. i>s5t» • -^' ,• •-■■" :•».-.- 3g *
ETCHED SAE 1020 ,00X
VIRGIN STATE
FIG. 3 MICRO STRUCTURE
U. S. ARMY MATERIALS RESEARCH AfiENCY 19-066-714/AMC-65
28
■■
ETCHED SAE 6620 toox
PK5.4 MICRO STRUCTURE VIRGIN STATE
U. S. ARMY MATERIALS RESEARCH AGENCY .'9-066-715/AMC-6 5
/
29
tm

COLLAR SPOKE■
LOWER _, BEARING PLATE
NEEDLE THRUST BEARING
UPPER BEARING PLATE COLLAR
COLLAR GRIP
THREAD ADVANCE INDICATOR
30
- LOAD CELL
WTROLLED CRACK GROWTH SPECIMEN
COUPLING
-ULTRASONIC CRYSTAL
-CRYSTAL AOAPTER GRIP
Fig. S. SCHEMATIC OF «IBID «MA TESTE« (IAT) U. S. «»Mr l«TERI»LS «SEARCH »GEHCT
l»-06*-704/»HC-«5
Ft», f. EXKMC0 »IB» W «111» MM TESltR fMT) ». J. «rajf «MHili IHHK« *f«icy
1 ♦-«*-» U/MC-II
/
~u
»f
X 1 '—0.2M 01* l
Fig. 7. TENSION SPECIMEN DETAIL cf»-c- »,ffc:
Fig. * Load ■ 0
Fig. B Load - 1760 lb
At the First ultrasonic Indication (Pip) of Internal Crack Inititation
Fig. C Load = 700 lb
Near the Final Stage of Complete Fracture
Fig. 8. TYPICAL ULTRASONIC RESPONSE IN COPPER CU I U. S. ARMY MATERIALS RESEARCH AGENCY
19-066-698/AMC-65
31
«id tm

Fig. A Load ■ 0
Fig. B Load Unknown
Taken Soon After the First ultrasonic Indication (Pip) of Internal Crack Initiation
Fig. C Load unknown
Near the Final Stage of Complete Fracture
Fig. 9. TYPICAL ULTRASONIC RESPONSE IN SAE MW U. S. Army Materials Rese?rch Agency
19-066-697/AMC-6«
32
*b

su «we
O.iM KFOauriW - IKMS
Fig. 10. TYP IC«. LOAD DEFOMMTIM CtMVES
U. S. Um WTHItlS «SEARCH MCKT 19-066-705/«-^-»5
>*•;.-««■! ..' ■ • V^ATö»-»
Spec. DO. C-2
Fig. II. NICROSTRUCTUKE - CWrtR Cu I (IMETCHED) U. 9. tray Nattrials tuurck «gcncy
l»-Ott-»tl/»ltC-»5
J2«
/
33

Ffg. 12. EXTERIOR VIEWS OF RECKED REGION - OOFfER C« I u. s. Army Materials Research Agency
l*-0*t-951/«MC-*S
4
m f
11
i
SEP jp SO '■ " &
!*t&5'
0.020
'If ■."'it'' JL^*lÄ«^^*l&i&lS^
INCHES
Fig. IS. MICROSnMJGTWE - SAE 102« (9RETME0) V. S. «ray Material» Research Agency
l*-066-Ml/*MC-*S
34

Fig. 14. HICROSTRUCTURE - SAE 4340 (UNETCHED) 1000X
U. S. Army Materials Research Agency 19-066-694/AMC-65
35

a MACTMIC
tHflM
X TCtT *TO*M0 Mft«TiN*L(.r
7 uacoaraouce mmmiim—«*T
-COWMTIOML
NOTf- MVMMM «IT To tfUNll lOCMTincs spfcmiHi
O.Of 0.l| QCFOMUTtON <M )
FK5.I5 COMPOSITE LOAD-DEFORMATION CURVE COPPER CUE
U. S. «MT MTUItlt MSMK* UCKY 19-0«-7J«, MC-fc»
NPOMMVIOM- MCMt
FIG. 6 coMCiftTioN or FMLUM PROCESS WITH 10*0 OEFOMMTIC* CUHVC IC. 11
u. s. inn MTEtuu KSEMCD taner 19--0«6-'J8/tMC-6S
36
/

MttT ULTRASONIC
ECHO R£«ION
I .2 S 4 .S • .7 .» .9
TNI* STRAIN (IN/INI
FKS.I7 TRUE STRESS-TRUE STRAIN CURVE COPPER CU JL
U. S. AMT MATERIALS RESEARCH AtERCT l»-064-721/»MC-»5
0 INCIPIENT NECKIN6
0 r»»CTu«t
0 " SHE««
X TEST STOPPED INTENTIONALLY
9 UIKO» T»OL LEO SEHMTlON-KST
A " " -CONVENTIONAL
NOTE - NUNSEAS NEIT TO StuSOLS
- IDENTIFIES IFCCIKM
- ^ » ^b—■ * 1
i»-3 ir
13 —"
9 ">
<0 II /IS/ 1
a, IS is, IM
t
t 18- y IS
z* .3 IT
1 1 ..'H1 i i i 01 03
DEFORMATION (IN!
FIG. 18 COMPOSITE LOAD-DEFORMATION CURVE SAE 1020
U. S. ARMY MATERIALS RESEARCH AtENCY 19-066-737/HHC-65
/
37
mid
FIG r» CORRELATION OF FAILURE PROCESS WITH LOAD DEFORMATION CURVE
{STEEL SAE »201
B. $. »Bff WTEIUU tESUKI MEKY i»-OM-r»/«c-«s
1»
■00
to
-JO^ FUST ULI MS» ac • 0 jj*" ECHO «BON
TO srccmCN _ •*»-« • V
1" « 1»
«0
1 1 1 1 1 I L L ■ .3 .4 .5 .«
TUI (TKAIH (IN/INI
FK5.20 TRUE STRESS-TRUE STRAIN CURVE SAE K80
38
/
U. S. AMY MATERIALS tESEAftCN ASFJCY t»-066-T!8/»MC-65
mlam. wm
O mCl'fCMT MICKiMfi
O FRACTURE
O SHEAR
X TEST (TO'MD INTENT1ONALI.T
▼ UNCONTROLLED lERERATlON-RA T
A -CONVENTION*!.
NOTE- NUHMM NEXT TO SVMMLS IDENTIFIES SPECIMENS
0 2 0.3 DCFONMATION (IN)
FIG. 21 COMPOSITE LOAD-DEFORMATION CURVE SAE 8620
U. S. »«MY M»T£«I»LS «ESEMCH »8E»CY
I9-066-736/«"C-65
/NCCr.ltlG / (Titil. 71,000 Ml (CONVKNTIOMl.)
MPanUTKHI- MCHCS
FIG 22 CORRELATION OF FAILURE PROCESS WIThLOAO DEFORMATION CURVE
(STEEL SAE 8620)
II. S. A«KY MTEIULS «ESEMCH «OENCV
19-066-7»0/lKC-6S
39
130 ■
ICO
y\ to W rtWT ULTMSONC
ECHO DEMON
wo
to
i
3*o SKCMEN
I ■US - £
u •0
90
40
i i 1 ■ 1 1 soe .i .t S .4 S .6 r .• 19-C66-720/*MC-65 TRUC «TRAM (M./W.)
FIG. 23 TRUE STRESS-TRUE STRAIN CURVE SAE 8620
UNETCHEO 1»-M«-T1?/«K-M
I two. uw-i*
FI6.24 MICRO 8
40 MM.
/
.»*'„.i i'szm «*■",■ .•:■"•■ !."•»■ ' '*« *«;'" i
»«•«-m'«»-*» ; m ■:$g* >:;;'■■ 900 x ■• ETCHEO
.flat?! MW-j FK. 25 MICRO STRUCTURE COPPER II SPEC. URS-14
soox
1»-0M-T26/»HC-«J
UNETCHEO SPeC. MS-IS
UlWCH-4
FI6.26 MICRO STRUCTURE
esx
SAE 1020 41

• ' V" ».••'«■• • *v '• • - • '• ; •• ■ '•Ht,
■•! . i . | : » .4 • : • . :'■'■ / l h: • \ •»• '*• :! ■ v ■. •, •;.-■■■ ■: '. h
i • <• .; ' . ••• ; -?.-.,.>; i
:: • *- .v: \ •• :. • • •;..• rJ -«N • \ . • . > * *• I » • ■'.•■ ••*• ir*. 'jv
v: Uv . • X ' -
UNETCHED IOOX
t» t * ( ' l * • 4 VV-. ? •cs" Mj
V .U
v ■'*■%•, • •'' • '&. '"4
-4 • • • itk
SPEC. 6RS-I3 500X UNETCHEO
UIINCHJ
FI6. 27 MICRO STRUCTURE SAE 1020
ü. S. ARMY MATERIALS RESEARCH AGENCY 19-066-7UU/AMC-65
42
fei«
• » .
UNETCHEO SPEC. BRS-12 25X
kl INCH-^1
FIG. 28 MICRO STRUCTURE SAE 8620
U. S. ARMY MATERIALS RESEARCH AGENCY
19-066-T28/AMC-65
43
< .
UNETCHEO lOOX ETCHED lOOX
UNETCHEO
FIG. 29
500X ETCHED
UlINCH-j
MICRO STRUCTURE SAE 8620 SPEC BRS-12
44
U. S. ARMY MATERIALS RESEARCH AGENCY
19-0&6-742/AMC-65
*h tm
COPPER 3E
SPECIMEN URS - 14
o/R - 0.37
to
i N
65 -
0.020 0040 0.060 0.080 0.100
r (IN.)
Fig. 30. LONGITUDINAL STRESS DISTRIBUTION AT INCIPIENT FRACTURE U. S. ARMY MATERIALS RESEARCH AGENCY
19-066-707/AMC-65
45
fl*

j^sis
•.."•
Slfe^
UNETCHEO
FIG. 31
SPEC. ÜRS-II 25X
k» INCH J
MICRO STRUCTURE COPPER CU JE
46
U. 3. ARMY MATERIALS RESEARCH AGENCY
19-066-729/AMC-65

ETCHED
FIG. 32
SPEC URS-M 500X
kl INCH-*)
MICRO STRUCTURE COPPER CU E
Ü. 8. ARMY MATERIALS RESEARCH AGENCY
19-066-725/AMC-65
47
«id

• •'■ .,• ♦ f . * • «■. *
. *•. • ...
* •
# # ,«%
UNETCHEO SPEC. BRS-9 MX
LuNCH-|
FIG. 33 MICRO STRUCTURE SAE 8620
U. S. ARMY MATERIALS RESEARCH A6ENCY 19-066-719/AMC-65
48

■•; yv ~ -> - .;„ iiSO \ :. ... "^ i »I IIAi i I A • • ft-
s *■*. * ■
UNETCHED
«ft i
4 •• • •
,t *
i
11 IOOX ETCHED IOOX
UNETCHED
FIG. 34
J 4* Al-
t' * V. •
500X 500X UNETCHED
Ul INCH«!
MICRO STRUCTURE SAE 8620 SPEC, BRS-9
U. S. ARMY MATERIALS RESEARCH AGENCY
19-G66-7U5/AMC-65
49
1 ■ ■ «U tm

Fig. 35. EXTERIOR VIEWS OF NECKED REGION - COPPER CM II U. S. «nay Materials Research Agency
l«-0»6-S15/«MC-65 <ti
Fig. 36. EXTERIOR VIEWS OF NECKED REGION - SAE 1020 U. S. »r ly Materials Research Agency
19-0 66-5'.6/AMC-65
50
*ii m

Fig. 37. EXTERIOR VIEWS OF NECKED REGION - SAE 8620 u. s. tray Materials »«search »gency
l«-0«6-517/»MC-*5
19-046-722/AMC-65
UNETCHEO 25X
FIG. 38 MICRO
SPEC. URS-9
UuNCH-*]
STRUCTURE COPPER CU H
51
*U

ETCHED RIGHT CRACK TIP |00X LUNCH*)
FIG. 39 MICRO STRUCTURE COPPER CU E SPEC, URS-9
U. S. ARMY MATERIALS RESEARCH AGENCY 19-066-723/AMC-65
52
tm

&*>,vVv *•'" ■•■A- A
l»-066-7U3/*HC-65
FIG. 40
LEFT CRACK TIP
UIINCH-*!
UNETCHED 800X
MICRO STRUCTURE COPPER CU I SPEC URS-9
K$I
I'*''
■£■ ■ ■% r1 »■ **.>■*■■ ■
17-tW-IM/UK-tS
FIG. 41
lfifcv«sft! ,*i.V ■•*-.-4»V« *V
UNETCHEO RIGHT CRACK TIP 500X
UllNCM-J
MICRO STRUCTURE COPPER CU H SPEC, URS-9
53

54
19-066-71S/«HC-65
UNETCHED SPEC. URS-7 25X
UI INCH 4
FIG. 42 MICRO STRUCTURE COPPER CU H
■•■ " >" o .' '1 ■..».'. 1 , •£' .•■<" ft,;'Jt
wm f$1 I! «'ia
j* M i"ji'
RIGHT CRACK TIP IOOX
19-066-7»l/»MC-65
ETCHED LEFT CRACK T«» IOOX
h I INCH-
FIG. 43 MICRO STRUCTURE COPPER CUE SPEC URS-7

I I'M ft 'imi
ETCHED LEFT CRACK TIP 500X
L-IINCH-J
FIG. 44 MICRO STRUCTURE COPPER CUE SPEC, URS-7
U. S. ARMY MATERIALS RESEARCH AGENCY 19-066-72U/AMC-65
55

ETCHED
FIG. 45
RIGHT CRACK TIP 500X
kllNCH-»|
MICRO STRUCTURE COPPER CU H SPEC, URS-7
U. S. ARMY MATERIALS RESEARCH AOENCY 19-066-713/AMC-65
56
1 111 «I

..••* . üv?- -'^M VA*" ■
* • . • -
. /
•* i
• » »
■4 S:*--AÜ&
•4
m
UNETCHEO SPEC. 6RS-I2 25x
kl INCH-J
FIG. 46 MICRO STRUCTURE SAE 1020
U. S. ARMY MATERIALS RESEARCH AflERCY 19-066-711/AHC-65
57
« -« — m
LBFT ttMK T» RMNT CRACK TIP IOOX
UNETCHED RIGHT CRACK TIP 500 X ETCHED RIGHT CRACK TIP «00 X
LllNCH-4
FIG. 47 MICRO STRUCTURE SAE 1020 SPEC, GRS-12
U. S. ARMY MATERIALS RESEARCH AGENCY 19-066-731/AMC-65
58

UNETCHEO SPEC GRS-IO
I INCH A
25X
FIG. 48 MICRO STRUCTURE SAE 1020
U. S. ARMY MATERIALS RESEARCH AGENCY 19-066-712/AMC-65
59
m

1 ETCHED LEFT CRACK TIP «COX RIGHT CRACK tXBt
FIG. 49 ETCHED LEFT CRACK TIP 500X
MICRO STRUCTURE SAE 1020 |*UMCH*| SPEC, GRS-IO
60
U. S. ARMY MATERIALS RESEARCH AQEHCY 19-066-733/AMC-65
•
UNETCHEO SPEC BRS-13 25X
LlINCH-H
FI6. 50 MICRO STRUCTURE SAE 8620
U. S. ARMY MATERIALS RESEARCH AGENCY 19-066-710/AMC-65
61

UNETCHED 500X
LEFT CRACK TIP
UNETCHED RIGHT CRACK TIP
FIG. 51
k-l INCH *J
MICRO STRUCTURE SAE 8620
500X
SPEC. BRS-13
62
U. S. ARMY MATERIALS RESEARCH AGEHCY 19-066-717/AMC-65
jge^m

/ ?
O INCIPIENT NECKIN6 & INCIPIENT FRACTURE g INCIPIENT SHEARIN6
INITIAL STATE
0.60 0.75 1.00 0 0.25
19-066-703/AMC-65
EFFECTIVE STRAIN (IN/IN)
Fig. 52. EFFECTIVE STRESS-STRAIN CURVES U. S. ARMY MATERIALS RESEARCH AGENCY
/
63
kid» fl*