kkc.pat scheme of india. 7.02.2014ppt.ppt sche… · · 2014-02-25indiaindia-implementation of...
TRANSCRIPT
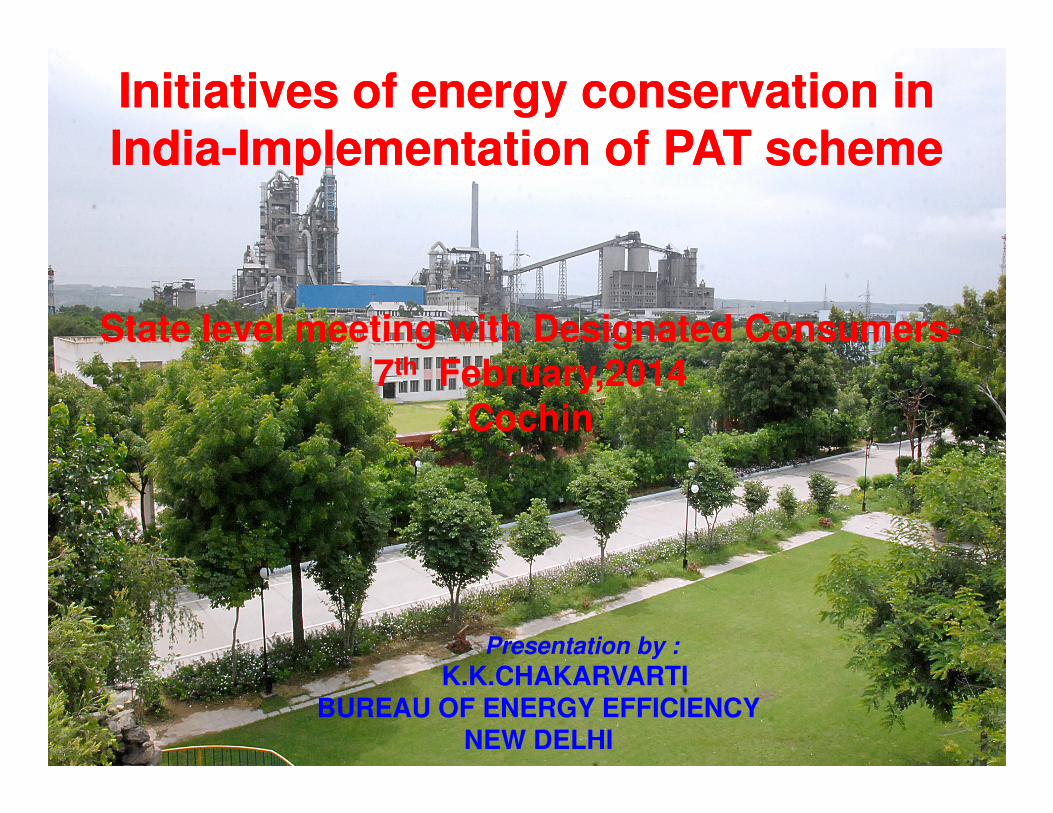
Initiatives of energy conservation in Initiatives of energy conservation in IndiaIndia--Implementation of PAT schemeImplementation of PAT scheme
State level meeting with Designated Consumers-
7th February,2014
Cochin
Presentation by :
K.K.CHAKARVARTIBUREAU OF ENERGY EFFICIENCY
NEW DELHI
Cochin

Legislative and Institutional Framework Framework
2

INTRODUCTION
� India's rapid economic growth has made it one of the fastest
growing markets in the world.
� That has been translated into the expansion in its total
energy use for the past five decades.
� Presently India is fourth in the World in terms of its primary
energy consumption (523 million toe(2010-11), with 585energy consumption (523 million toe(2010-11), with 585
kgoe per capita against world average of 1012 kgoe) .
� But fossil fuel reserves are limited. Proven 34,000 million
ton Coal reserves may last 80-140 years, whereas 760
million ton of Oil reserves may last around 23 years .
3

INTRODUCTION
� Import dependence on oil is expected to increase from
76.0 % to 80% , natural gas from 19% to 28.4% and coal
from 19.8% to 22.1% during the period 2010-17 .
� This underscores the need for moderating the growth of
energy demand by achieving higher levels of energy
efficiency while also increasing domestic supplies of energyefficiency while also increasing domestic supplies of energy
as much as possible.
� Increased energy efficiency is the only way to contain
energy demand without jeopardizing growth and it therefore
receives high priority in India. The Indian Parliament passed
the Energy Conservation Act in 2001 to institutionalize
energy efficiency improvement mechanisms
4

THE INDIAN ENERGY CONSERVATION ACT
� The five major provisions of EC Act relate to:
� Designated Consumers (mainly energy intensive industries andbuildings) to comply with the specific energy consumption norms forthe manufactured products and services and establishment ofenergy management system,
� Standards and Labeling of energy consuming appliances, gadgetsand equipment to ensure promotion of energy efficiency of the newstocks entering the marketstocks entering the market
� Energy Conservation Building Code ensuring that newcommercial buildings constructed in the country have less electricityconsumption
� Creation of Institutional Set up (Bureau of Energy Efficiency at theFederal level and State Designated Agencies at the State level) foreffective coordination of the energy conservation efforts in thecountry and
� Establishment of Energy Conservation Fund at Centre and Statesto provide necessary financial support for energy efficiencyinitiatives in the country. 5

National Mission for Enhanced Energy Efficiency
(NMEEE)(NMEEE)
6

NMEEE – Four New Initiatives
• Perform Achieve and Trade (PAT) :
– Market based mechanism for energy intensive large industriesand facilities
– Enhance cost effectiveness of improvements in energy efficiency
– Certification of energy savings which could be traded
• Market Transformation for Energy Efficiency (MTEE):
– Shift to energy efficient appliances in designated sectors– Shift to energy efficient appliances in designated sectors
– Innovative measures to make products affordable
• Energy Efficiency Financing Platform (EEFP):
– Finance Demand Side Management Programme
– Capture future savings
• Framework for Energy Efficient Economic Development(FEEED):
– Developing fiscal instruments to promote energy efficiency

Framework for Energy Efficient Economic
Development (FEEED)
Fiscal instruments to facilitate energy efficiency projects implementation have been developed :
� PRGFEE :Debt guarantee to Financial Institutions for ESCO (Energy Service Companies) investments (up to Rs. 3.00 Crore or 50% of loan, whichever is less)
� VCFEE :Equity investments in ESCO projects (up to Rs.2.00 Crore or 15% of equity, whichever is less)
� Public Procurement :Public procurement of energy efficient appliances in the Public sector has been initiated. This is expected to save 250 MW of Power. Initially the appliances which have been considered for public procurement include Split air conditioners (usage more than 1000 hrs/year), ceiling
fans & water heaters (all 5 Stars) and frost free refrigerators ( 4 Stars)
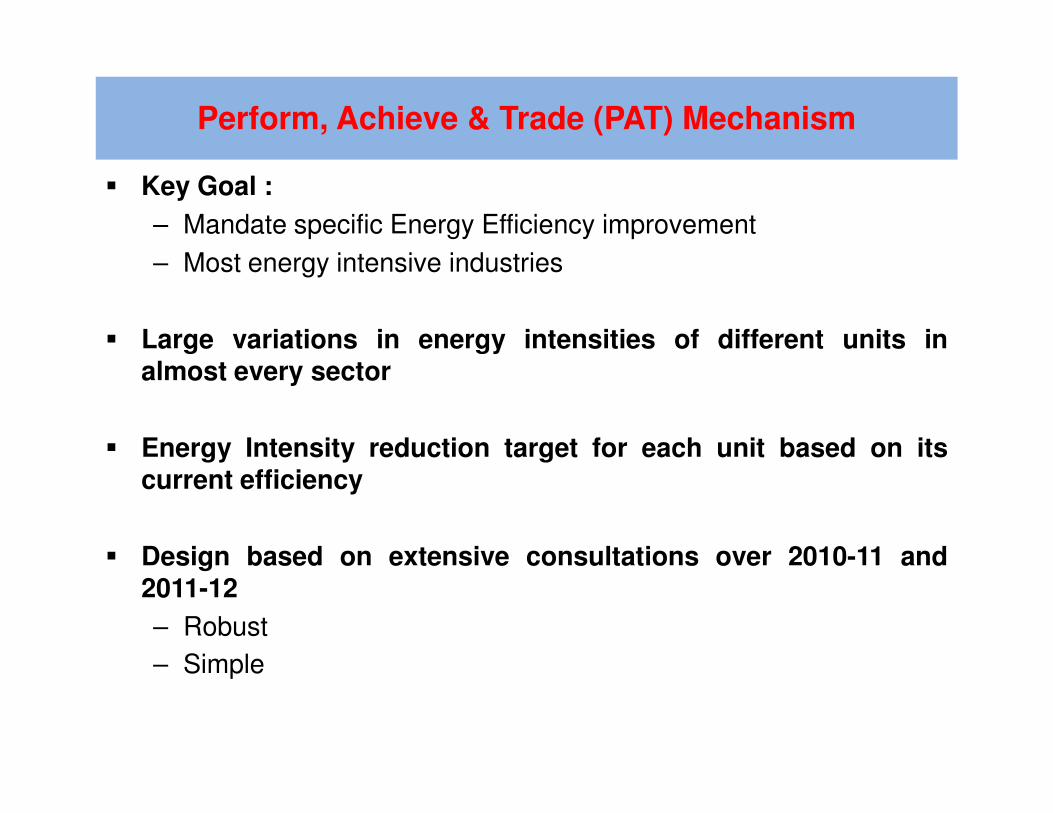
Perform, Achieve & Trade (PAT) Mechanism
� Key Goal :
– Mandate specific Energy Efficiency improvement
– Most energy intensive industries
� Large variations in energy intensities of different units inalmost every sector
� Energy Intensity reduction target for each unit based on itscurrent efficiency
� Design based on extensive consultations over 2010-11 and2011-12
– Robust
– Simple
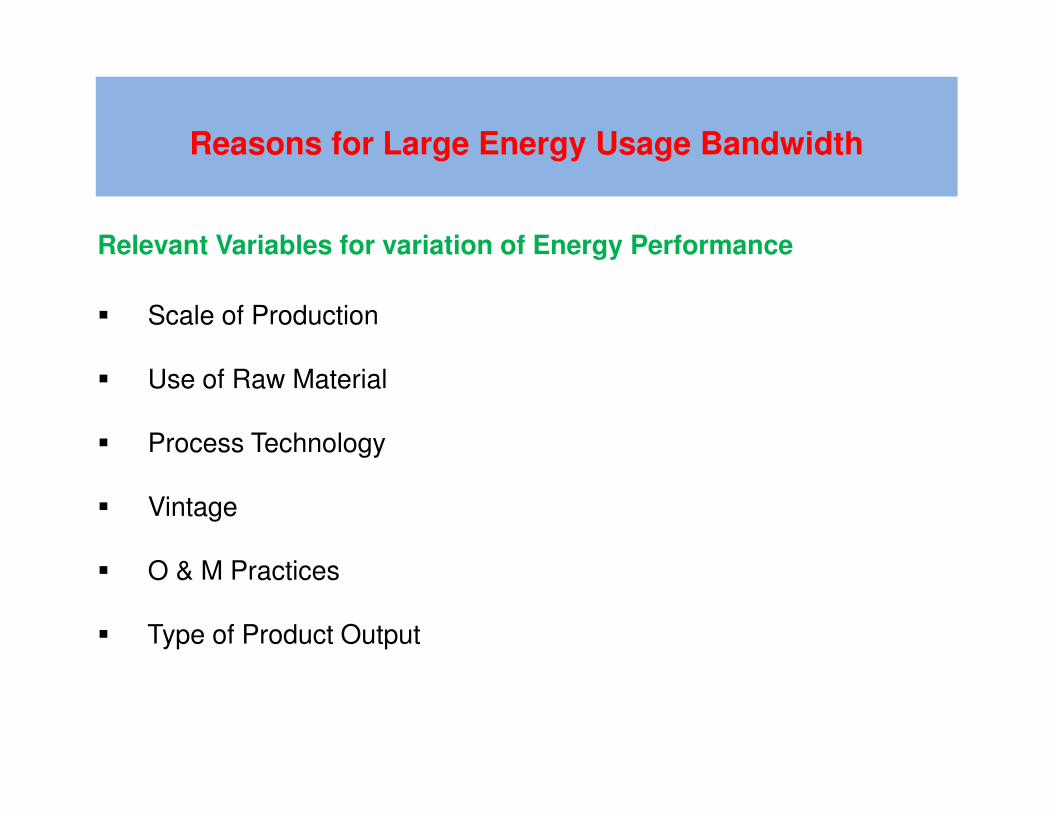
Relevant Variables for variation of Energy Performance
� Scale of Production
� Use of Raw Material
Reasons for Large Energy Usage Bandwidth
� Process Technology
� Vintage
� O & M Practices
� Type of Product Output

Number of Designated Consumers (DCs) as notifiedunder Indian Energy Conservation Act
Industry Sector Annual Energy Consumption Norm to
be DC (toe)
No. of Identified DCs
Aluminum 7500 10
Cement 30000 85Cement 30000 85
Chlor-Alkali 12000 22
Fertilizer 30000 29
Pulp & Paper 30000 31
Thermal Power 30000 144
Iron & Steel 30000 67
Textiles 3000 90

Designated Consumers- Kerala State
Sl No Designated Consumer
Net Heat Rate
(Kcal/KWh)-
Baseline
Net Product Output
(Million Units)-
Baseline
Net Heat Rate
(Kcal/KWh)-Target
1
Brahmapuram Diesel Power Plant
(BDPP)
Kochi
2115 175 2074
2BSES Kerala Power Project
Kochi1969 590 1965
3Kasargod Power Corporation Ltd
(KPCL)2265 69 2166
4Kozhikode Diesel Power Project
(KDPP)2150 350 2115
5
Rajiv Gandhi Combined Cycle
Project (NTPC)
Kayankulam
1994 2016 1988

Designated Consumers- Kerala State
Sl no Designated Consumer
Specific Energy
Consumption
(TOE/ton of
product)-Baseline
Product Output
(Ton)
Specific Energy
Consumption
(TOE/ton of
product)- Target
6Travancore Cochin Chemicals Ltd
Kochi0.299 50,430 0.282
7Hindustan Newsprint Ltd
0.660 1,08,221 0.6237Hindustan Newsprint Ltd
Kottayam0.660 1,08,221 0.623
8FACT (Ammonia)
Udyogamandal0.985 1,37,004 0.970
9Malabar Cements Limited,
Palakkad0.0971 12,10,539.37 0.0918
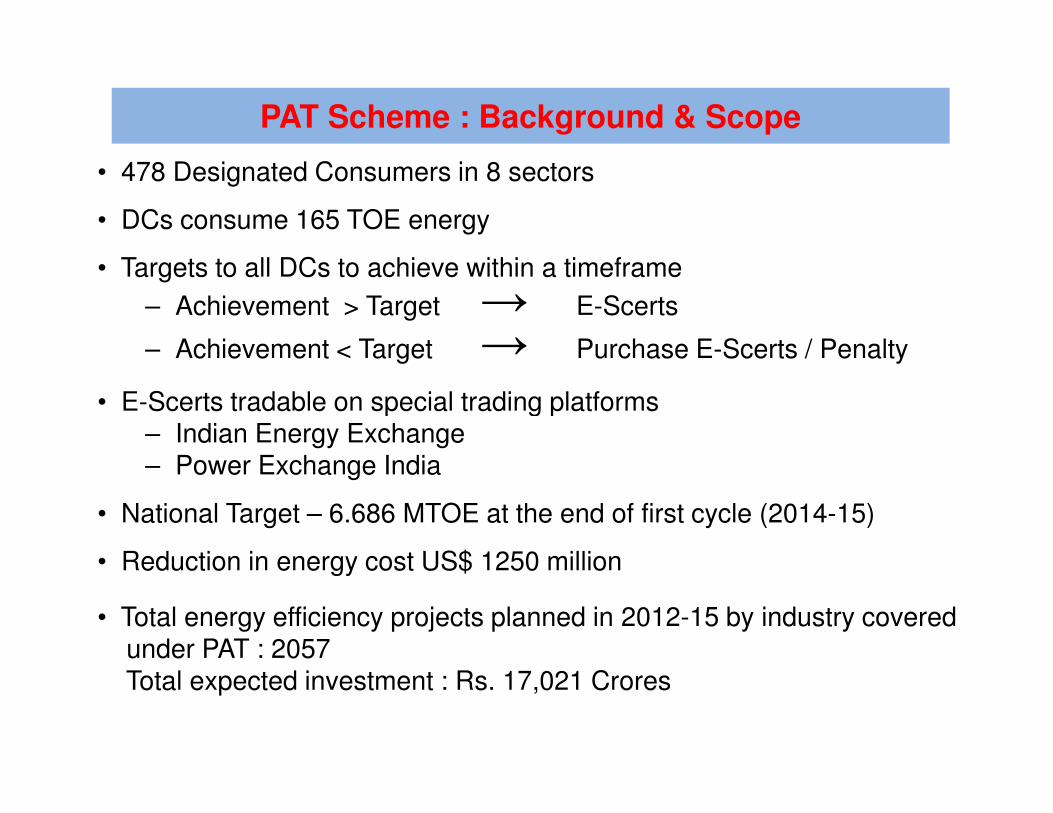
PAT Scheme : Background & Scope
• 478 Designated Consumers in 8 sectors
• DCs consume 165 TOE energy
• Targets to all DCs to achieve within a timeframe
– Achievement > Target → E-Scerts
– Achievement < Target → Purchase E-Scerts / Penalty
• E-Scerts tradable on special trading platforms• E-Scerts tradable on special trading platforms– Indian Energy Exchange– Power Exchange India
• National Target – 6.686 MTOE at the end of first cycle (2014-15)
• Reduction in energy cost US$ 1250 million
• Total energy efficiency projects planned in 2012-15 by industry covered under PAT : 2057Total expected investment : Rs. 17,021 Crores

National Target of Energy Saving among all Sectors
S.NO. Sector
No. of
Identified
DCs
Annual
Energy
Consumption
(Million toe)
Share
Consumption
(%)
Apportioned
Energy
Reduction For
PAT Cycle-1
(Million toe)
1Power
(Thermal) 144 104.56 63.38% 3.211
22 Iron & Steel 67 25.32 15.35% 1.486
3 Cement 85 15.01 9.10% 0.815
4 Aluminium 10 7.71 4.67% 0.456
5 Fertilizer 29 8.20 4.97% 0.478
6 Paper & Pulp 31 2.09 1.27% 0.119
7 Textile 90 1.20 0.73% 0.066
8 Chlor- Alkali 22 0.88 0.53% 0.054
Total 478 164.97 100.00% 6.686
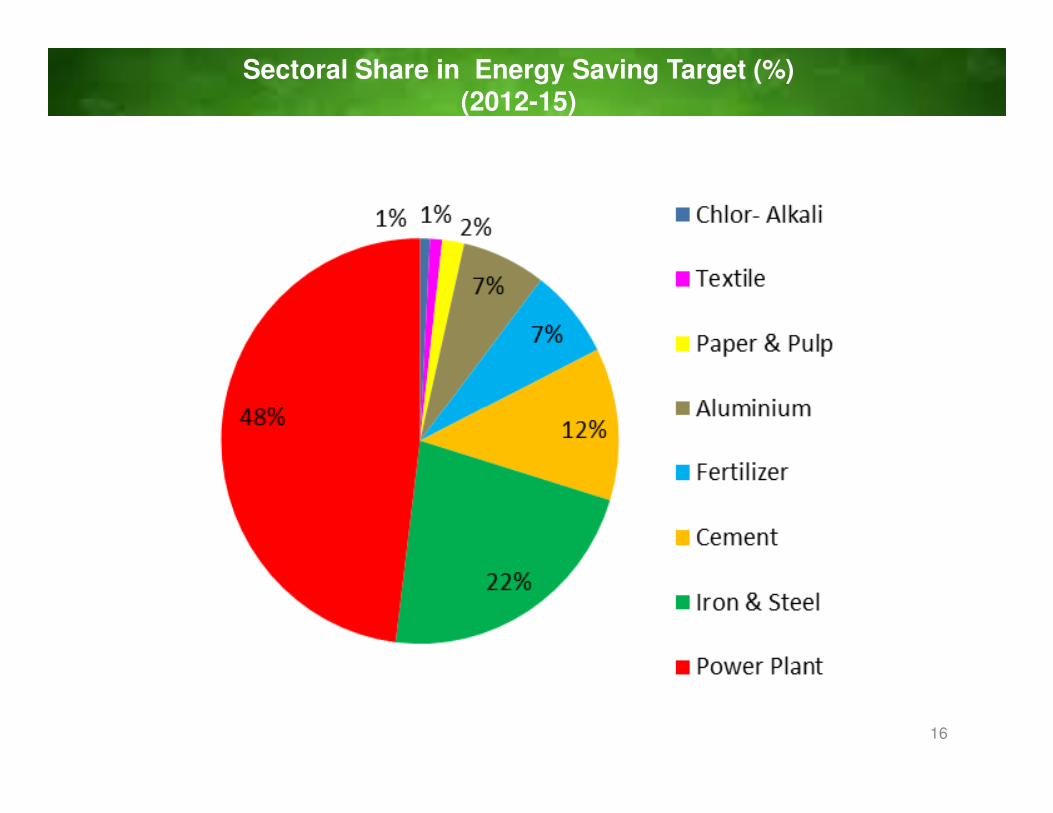
Sectoral Share in Energy Saving Target (%)(2012-15)
16

Target Setting and
Energy SavingsEnergy Savings
17
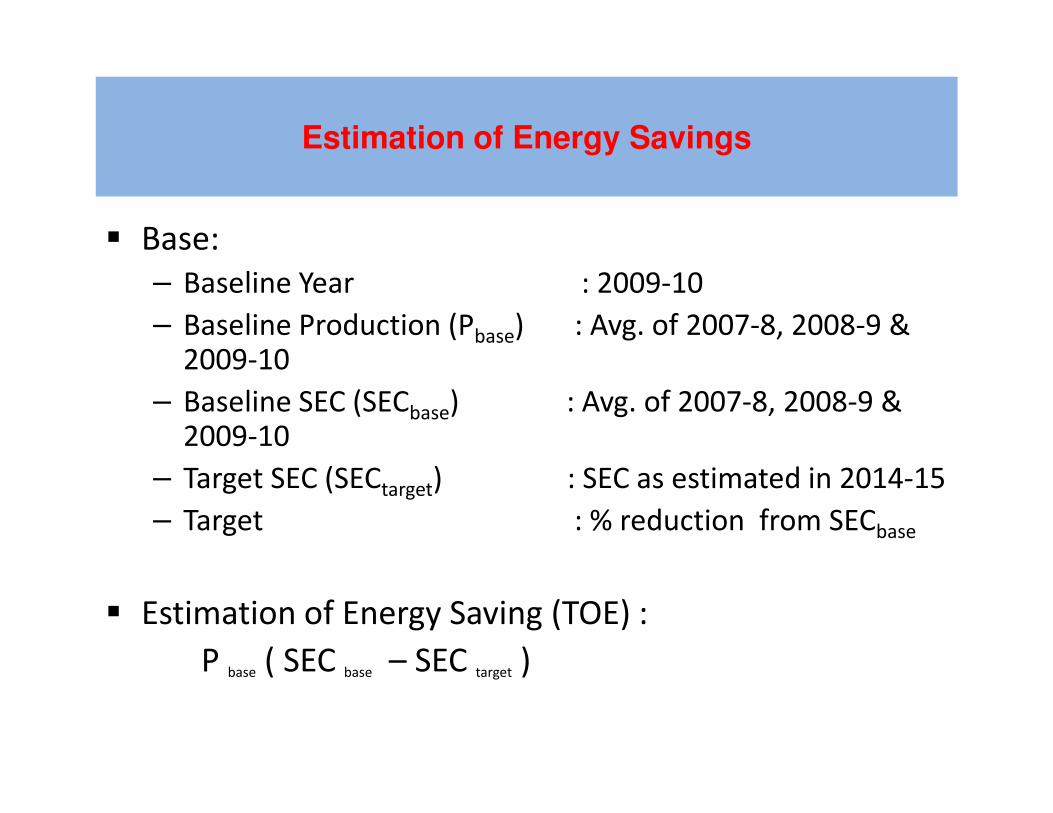
Estimation of Energy Savings
� Base:
– Baseline Year : 2009-10
– Baseline Production (Pbase) : Avg. of 2007-8, 2008-9 & 2009-10
– Baseline SEC (SECbase) : Avg. of 2007-8, 2008-9 & – Baseline SEC (SECbase) : Avg. of 2007-8, 2008-9 & 2009-10
– Target SEC (SECtarget) : SEC as estimated in 2014-15
– Target : % reduction from SECbase
� Estimation of Energy Saving (TOE) :
P base ( SEC base – SEC target )

Target, Compliance,
ESCerts & Penalty- ExampleESCerts & Penalty- Example
19

SavingTarget
Baseline SEC
Achieved SEC
Compliance
Issued Escerts Penalty
Concept of Target, Compliance, ESCerts & Penalty
Target SEC
Scenario 1 Scenario 2
Compliance
Purchase Escerts

EXAMPLE
• Specific Energy Consumption (SEC) in Baseline year:
10 TOE/unit of production
• Baseline Production: 10000 units
• Target: 4% reduction in SEC
• SEC in the target year: 9.6 TOE/unit production
• For ESCerts or Penalty:
– Reduction requirement: 4000 TOE
– Scenario 1 (Achieved SEC = 9.4): +2000 TOE(ESCerts)
– Scenario 2 (Achieved SEC = 9.8): -2000 TOE (Penalty)
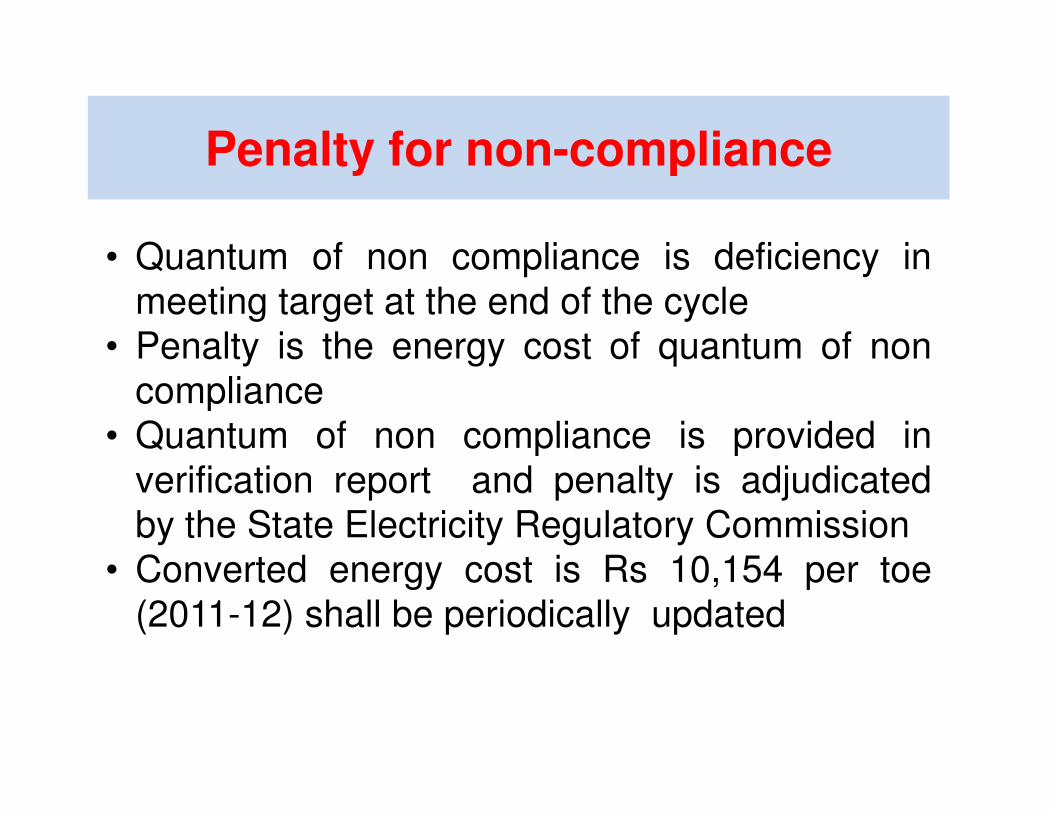
Penalty for non-compliance
• Quantum of non compliance is deficiency inmeeting target at the end of the cycle
• Penalty is the energy cost of quantum of noncompliancecompliance
• Quantum of non compliance is provided inverification report and penalty is adjudicatedby the State Electricity Regulatory Commission
• Converted energy cost is Rs 10,154 per toe(2011-12) shall be periodically updated

Recommendation for issue of energy savings
certificates
• The Bureau on satisfying itself about thecorrectness of verification report, and check-verification report, wherever sought by it, send itsrecommendation to the Central Government, basedon the claim raised by the designated consumer inForm ‘A’, within ten working days from the last dateof submission of said Form ‘A’ by the concernedstate designated agency, for issuance of energysavings certificates.

Normalization Factors
24
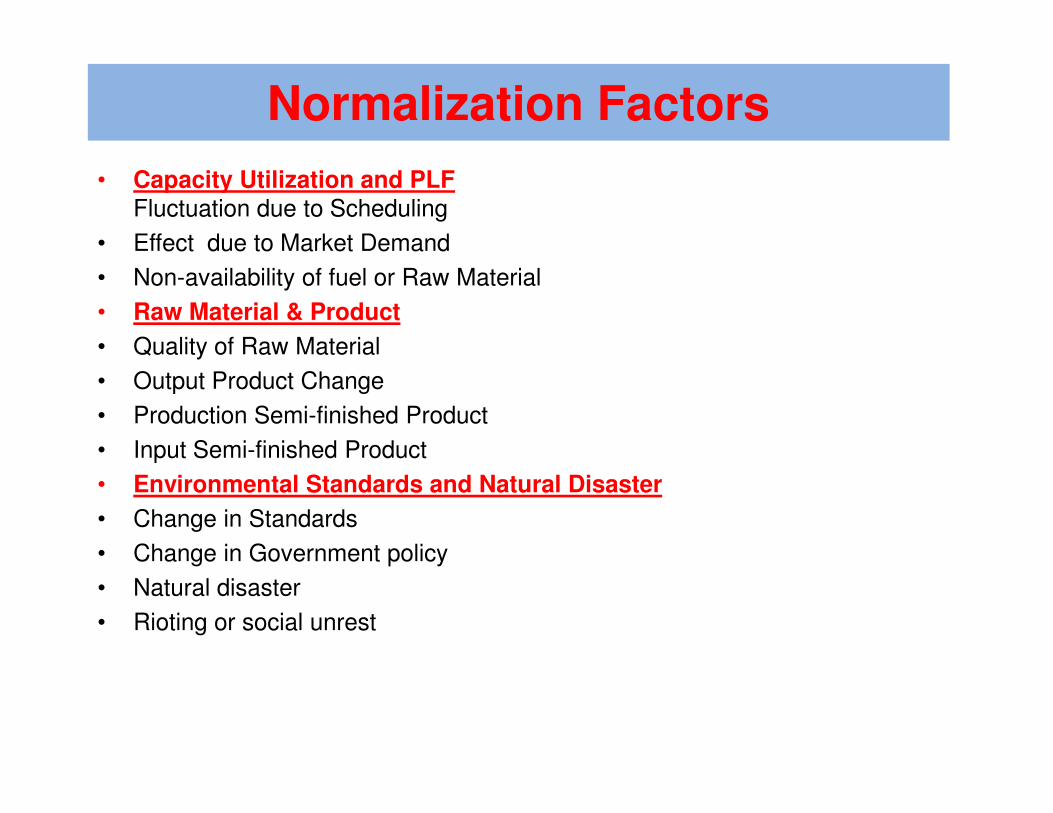
Normalization Factors
• Capacity Utilization and PLF
Fluctuation due to Scheduling
• Effect due to Market Demand
• Non-availability of fuel or Raw Material
• Raw Material & Product
• Quality of Raw Material
• Output Product Change
• Production Semi-finished Product• Production Semi-finished Product
• Input Semi-finished Product
• Environmental Standards and Natural Disaster
• Change in Standards
• Change in Government policy
• Natural disaster
• Rioting or social unrest

PAT for Cement Sector
26
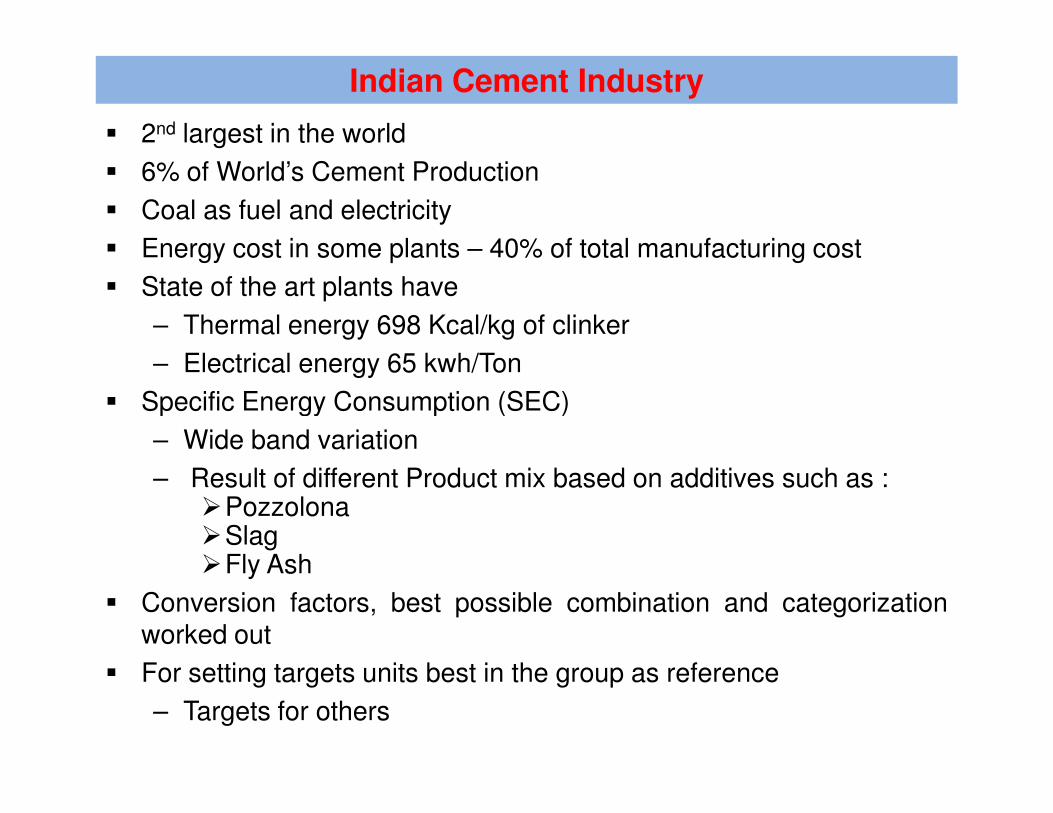
Indian Cement Industry
� 2nd largest in the world
� 6% of World’s Cement Production
� Coal as fuel and electricity
� Energy cost in some plants – 40% of total manufacturing cost
� State of the art plants have
– Thermal energy 698 Kcal/kg of clinker
– Electrical energy 65 kwh/Ton
� Specific Energy Consumption (SEC)� Specific Energy Consumption (SEC)
– Wide band variation
– Result of different Product mix based on additives such as :�Pozzolona�Slag�Fly Ash
� Conversion factors, best possible combination and categorizationworked out
� For setting targets units best in the group as reference
– Targets for others
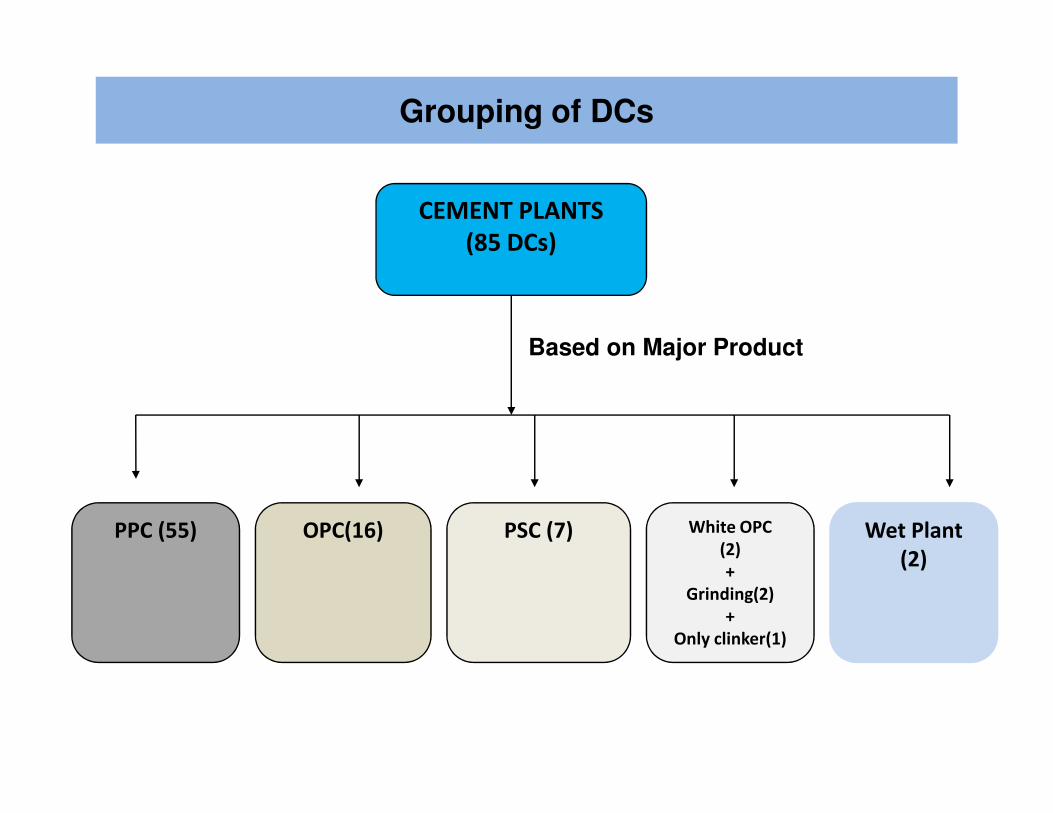
Grouping of DCs
CEMENT PLANTS
(85 DCs)
Based on Major Product
PPC (55) OPC(16) PSC (7) White OPC
(2)
+
Grinding(2)
+
Only clinker(1)
Wet Plant
(2)

Coal (Indian)
(1,03,339 Tons/yr ,GCV 3438 kcal/kg)
Coal1 (Imported)
(6246 Tons/yr, GCV 5454 kcal/kg)
Furnace Oil
(669 Tons/yr, GCV 10000 kcal/kg)
HSD
(570 Tons/yr , GCV 8600 kcal/litre)
Grid Electricity (53.08 Lakh KWh)
CPP(Heat Rate
3135 kcal/kWh)
GRID (Exported)(19.35 LAKH kWh/YR)
Example - Input & Output For A Typical Cement Plant
DG SET(Heat Rate
2212 kcal/kWh) 2.09 Lakh kWh
3148 lakh KWh
Colony, (5.1 Lakh kWh)
Crushing and
Mining
(Exported)(25.12 LAKH kWh/YR)
Pet Coke
(3316 Tons/yr, GCV 8400 kcal/kg)
Crushed Limestone
Iron Ore, Bauxite,Gypsum
Clinker (0.06 Lakh Tons/yr)
Coal2 (Imported)
124746 Tons/yr, GCV 6192 kcal/kg)
PPC (14.92LAKHTONNE/YR)
PSC /OTHER(2.30 LAKH TONNE/YR)
OPC(0.08 LAKH TONNE/YR)
Clinkerization
(Raw Material
Processing &
Pyro-processing)
Grinding
(VRM and
RP &BM)
Flyash, Slag, Etc
Colony, (5.1 Lakh kWh)
Note: All values presented in the above diagram are average of annual energy consumption of 2007-08, 2008-09, 2009-10
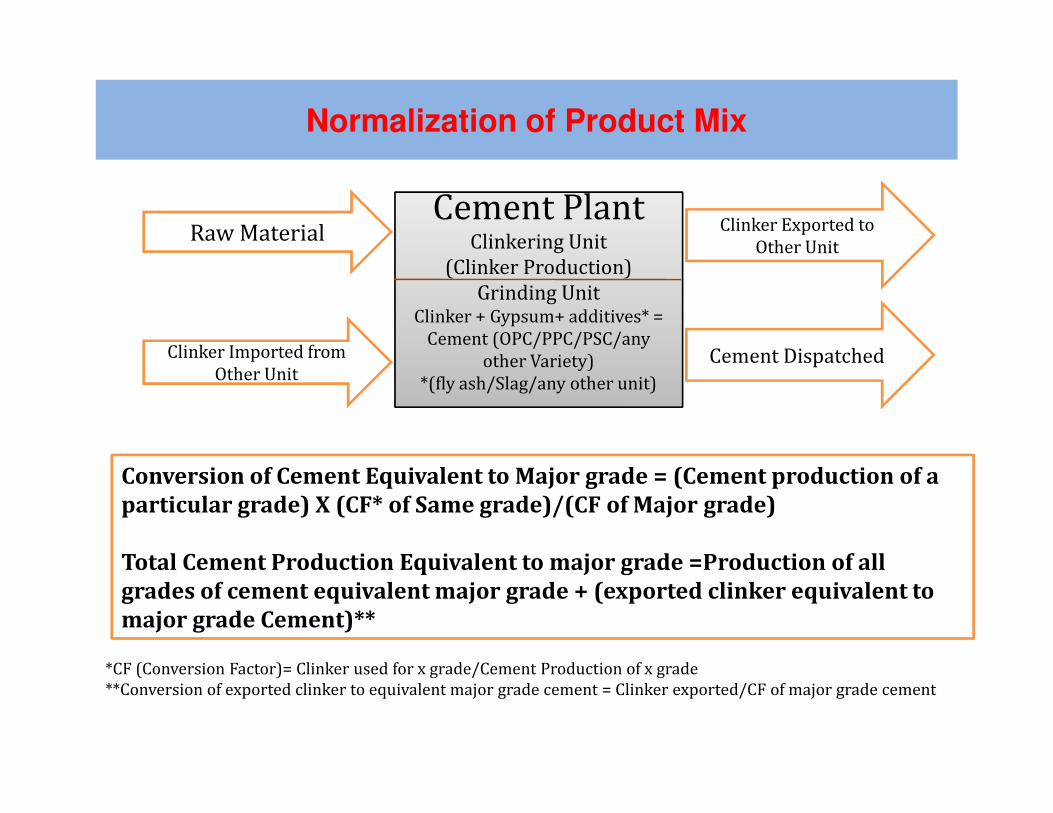
Normalization of Product Mix
Raw MaterialCement PlantCement Plant
Clinkering Unit
(Clinker Production)
Grinding UnitClinker + Gypsum+ additives* =
Cement (OPC/PPC/PSC/any
other Variety)
*(fly ash/Slag/any other unit)
Clinker Imported from
Other Unit
Clinker Exported to
Other Unit
Cement Dispatched
*CF (Conversion Factor)= Clinker used for x grade/Cement Production of x grade
**Conversion of exported clinker to equivalent major grade cement = Clinker exported/CF of major grade cement
Conversion of Cement Equivalent to Major grade = (Cement production of a
particular grade) X (CF* of Same grade)/(CF of Major grade)
Total Cement Production Equivalent to major grade =Production of all
grades of cement equivalent major grade + (exported clinker equivalent to
major grade Cement)**
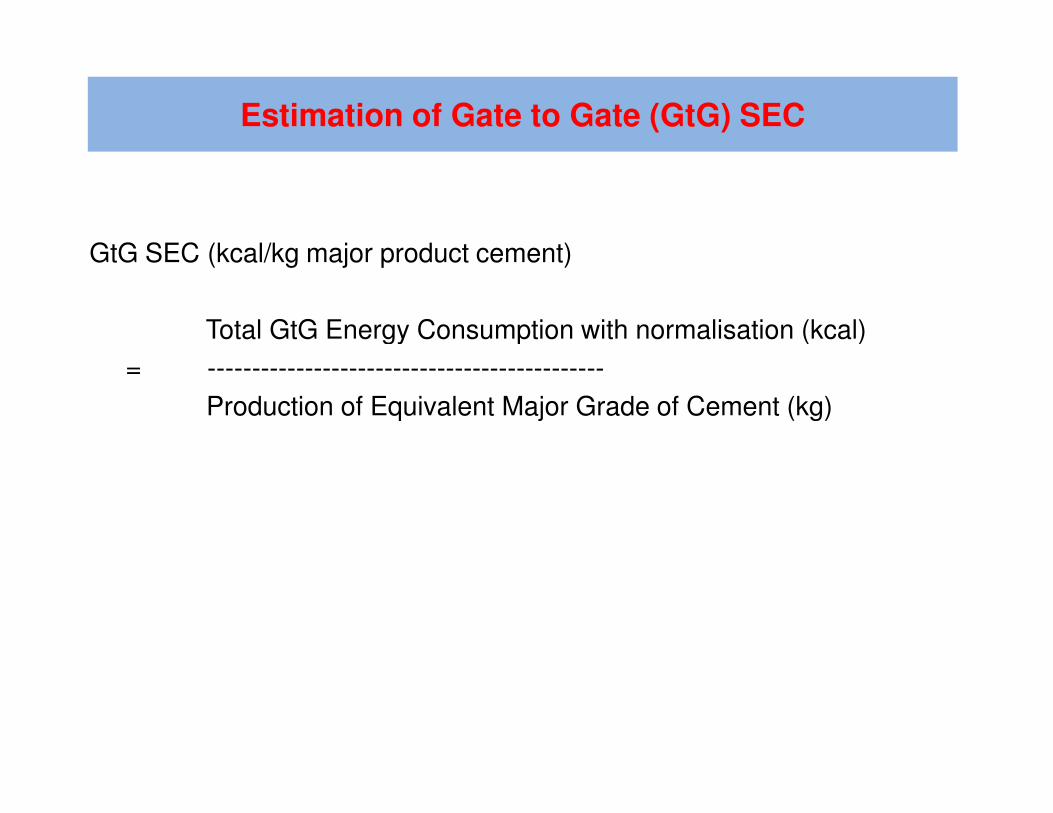
Estimation of Gate to Gate (GtG) SEC
GtG SEC (kcal/kg major product cement)
Total GtG Energy Consumption with normalisation (kcal)
= ---------------------------------------------
Production of Equivalent Major Grade of Cement (kg)Production of Equivalent Major Grade of Cement (kg)

Cement Sector
32
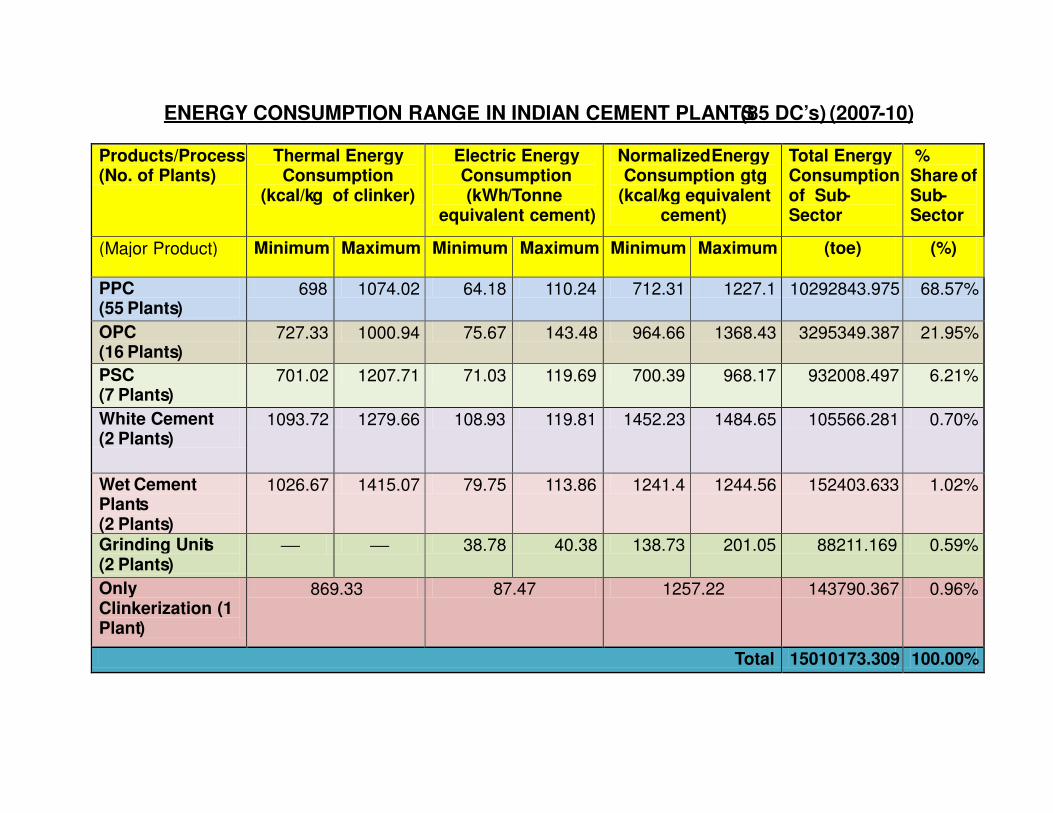
ENERGY CONSUMPTION RANGE IN INDIAN CEMENT PLANTS(85 DC’s) (2007-10)
Products/Process (No. of Plants)
Thermal Energy Consumption
(kcal/kg of clinker)
Electric Energy Consumption (kWh/Tonne
equivalent cement)
NormalizedEnergy Consumption gtg
(kcal/kg equivalent cement)
Total Energy Consumption of Sub-Sector
% Share of Sub-Sector
(Major Product) Minimum Maximum Minimum Maximum Minimum Maximum (toe) (%)
PPC (55 Plants)
698 1074.02 64.18 110.24 712.31 1227.1 10292843.975 68.57%
OPC (16 Plants)
727.33 1000.94 75.67 143.48 964.66 1368.43 3295349.387 21.95%
PSC (7 Plants)
701.02 1207.71 71.03 119.69 700.39 968.17 932008.497 6.21%
White Cement (2 Plants)
1093.72 1279.66 108.93 119.81 1452.23 1484.65 105566.281 0.70%
Wet Cement Plants(2 Plants)
1026.67 1415.07 79.75 113.86 1241.4 1244.56 152403.633 1.02%
Grinding Units(2 Plants)
38.78 40.38 138.73 201.05 88211.169 0.59%
Only Clinkerization (1Plant)
869.33 87.47 1257.22 143790.367 0.96%
Total 15010173.309 100.00%

Thermal Power Plant
2014Thermal Power Plant
Normalisation
Perform Achieve Trade2014
2014

Thermal Power Plant - PAT Cycle I
Total No of DCs -144
Threshold Limit:
30,000 tons of oil equivalent
Thermal Power Plants
[DC :144 Nos]
– 30,000 tons of oil equivalent
(TOE) per annum
Total Target Set
– 3.1 MTOE Coal/Lignite
[97] Gas [40]Diesel [7]

Target Setting in TPPs
Net Design Heat Rate
= Gross Design Heat Rate
1- APC% operative
Net Operative Heat Rate
= Gross Operative Heat Rate
1- APC% operative
Heat Rate Deviation (%)
= (Operating Heat Rate – Design Heat Rate) x 100
Design Heat Rate
Heat Rate Deviation
= (Operating Heat Rate – Design Heat Rate)
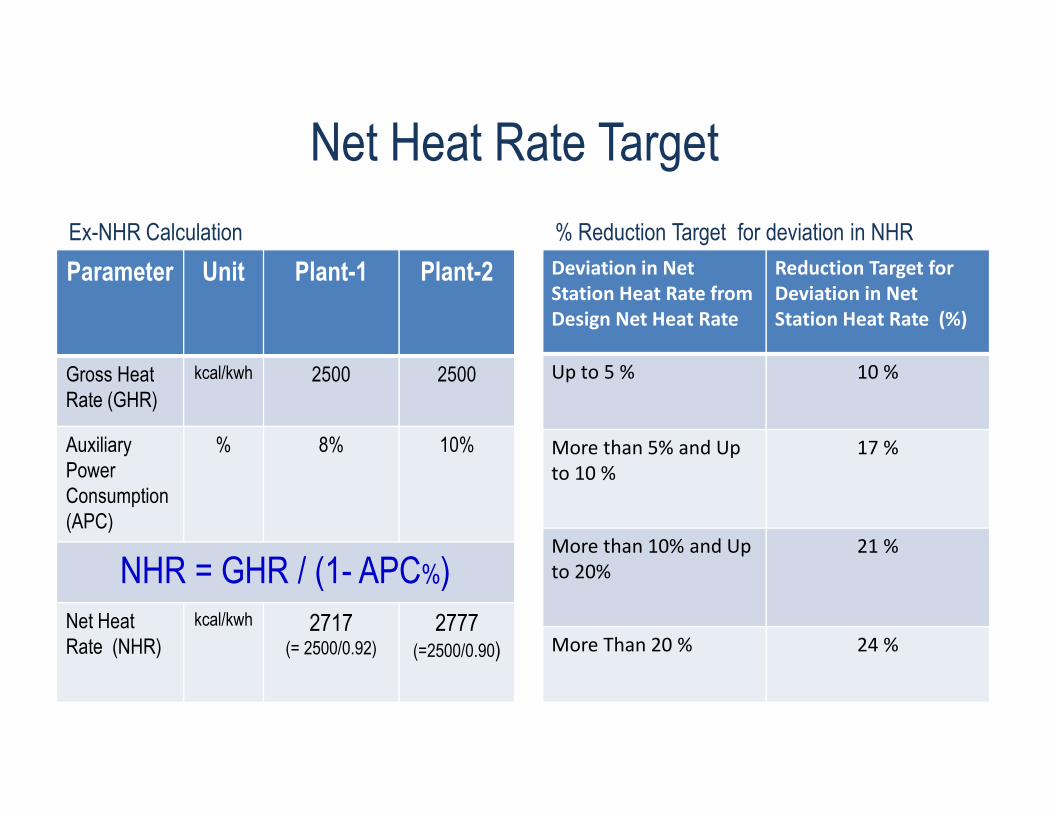
Parameter Unit Plant-1 Plant-2
Gross Heat
Rate (GHR)
kcal/kwh 2500 2500
Net Heat Rate Target
Deviation in Net
Station Heat Rate from
Design Net Heat Rate
Reduction Target for
Deviation in Net
Station Heat Rate (%)
Up to 5 % 10 %
Ex-NHR Calculation % Reduction Target for deviation in NHR
Rate (GHR)
Auxiliary
Power
Consumption
(APC)
% 8% 10%
NHR = GHR / (1- APC%)
Net Heat
Rate (NHR)
kcal/kwh 2717(= 2500/0.92)
2777(=2500/0.90)
More than 5% and Up
to 10 %
17 %
More than 10% and Up
to 20%
21 %
More Than 20 % 24 %
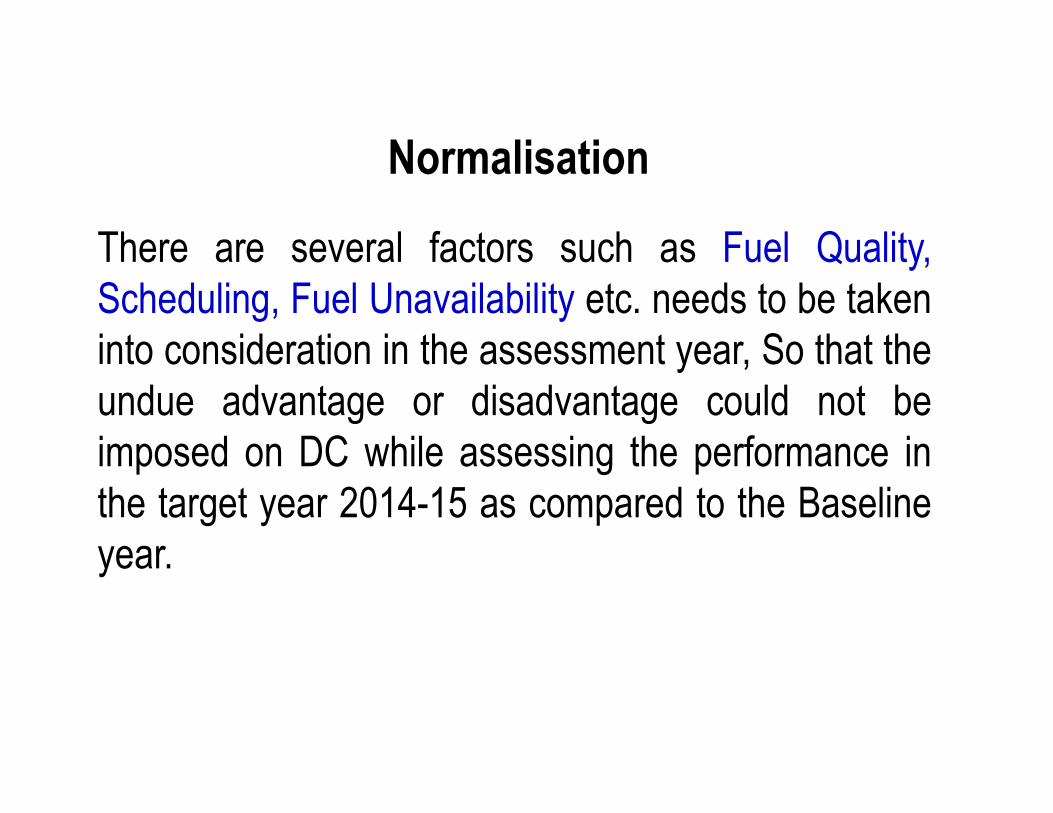
Normalisation
There are several factors such as Fuel Quality,
Scheduling, Fuel Unavailability etc. needs to be taken
into consideration in the assessment year, So that the
undue advantage or disadvantage could not beundue advantage or disadvantage could not be
imposed on DC while assessing the performance in
the target year 2014-15 as compared to the Baseline
year.

Normalisation FactorsBroad Categorization
• Fuel Quality [With Fuel linkage]
• Scheduling/ Backing Down
• Fuel Availability
APC linked with Unit Loading Factor• APC linked with Unit Loading Factor
• Environmental Concern
• Natural Disaster & Unforeseen Circumstances
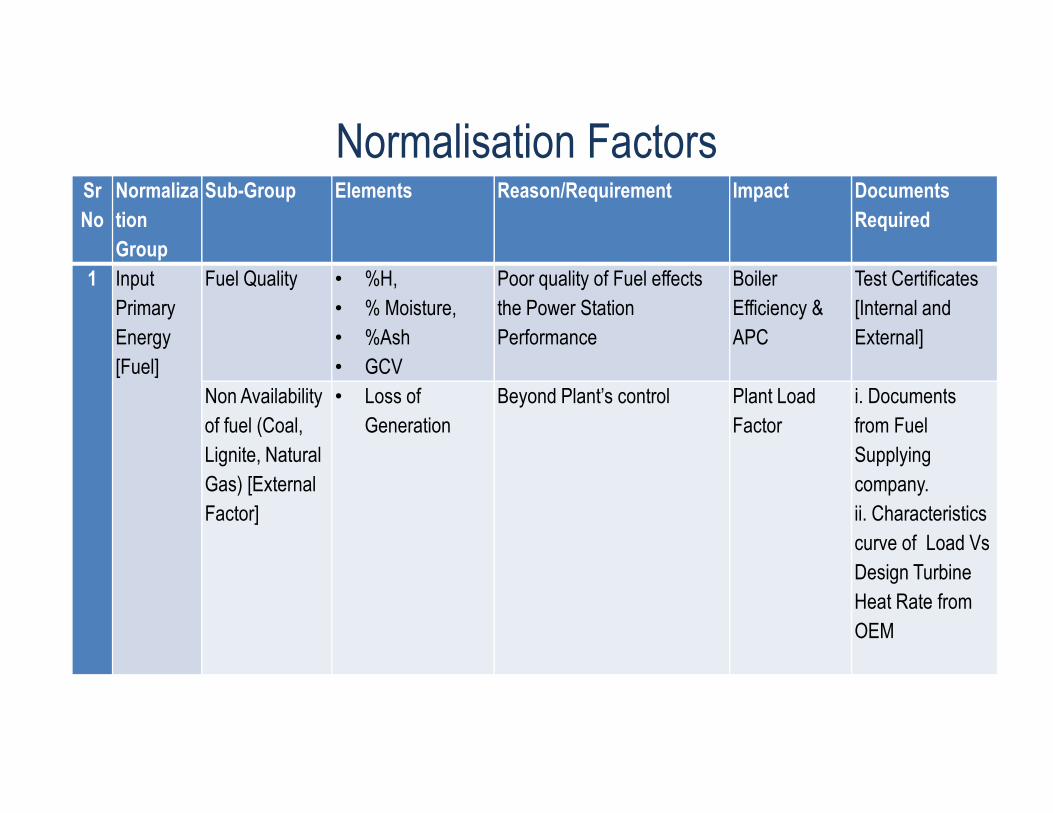
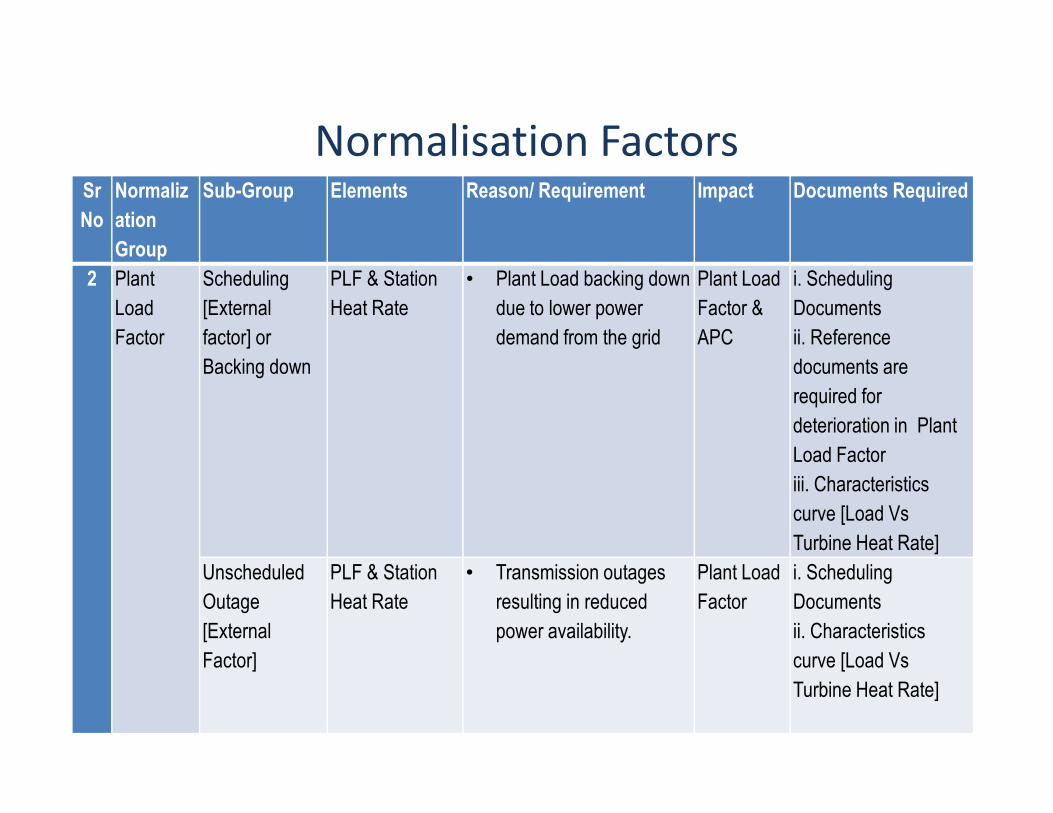
Normalisation FactorsSr
No
Normaliza
tion
Group
Sub-Group Elements Reason/Requirement Impact Documents
Required
1 Input
Primary
Energy
[Fuel]
Fuel Quality • %H,
• % Moisture,
• %Ash
• GCV
Poor quality of Fuel effects
the Power Station
Performance
Boiler
Efficiency &
APC
Test Certificates
[Internal and
External]
Non Availability • Loss of Beyond Plant’s control Plant Load i. Documents Non Availability
of fuel (Coal,
Lignite, Natural
Gas) [External
Factor]
• Loss of
Generation
Beyond Plant’s control Plant Load
Factor
i. Documents
from Fuel
Supplying
company.
ii. Characteristics
curve of Load Vs
Design Turbine
Heat Rate from
OEM
Normalisation FactorsSr
No
Normaliz
ation
Group
Sub-Group Elements Reason/ Requirement Impact Documents Required
2 Plant
Load
Factor
Scheduling
[External
factor] or
Backing down
PLF & Station
Heat Rate
• Plant Load backing down
due to lower power
demand from the grid
Plant Load
Factor &
APC
i. Scheduling
Documents
ii. Reference
documents are
required for required for
deterioration in Plant
Load Factor
iii. Characteristics
curve [Load Vs
Turbine Heat Rate]
Unscheduled
Outage
[External
Factor]
PLF & Station
Heat Rate
• Transmission outages
resulting in reduced
power availability.
Plant Load
Factor
i. Scheduling
Documents
ii. Characteristics
curve [Load Vs
Turbine Heat Rate]
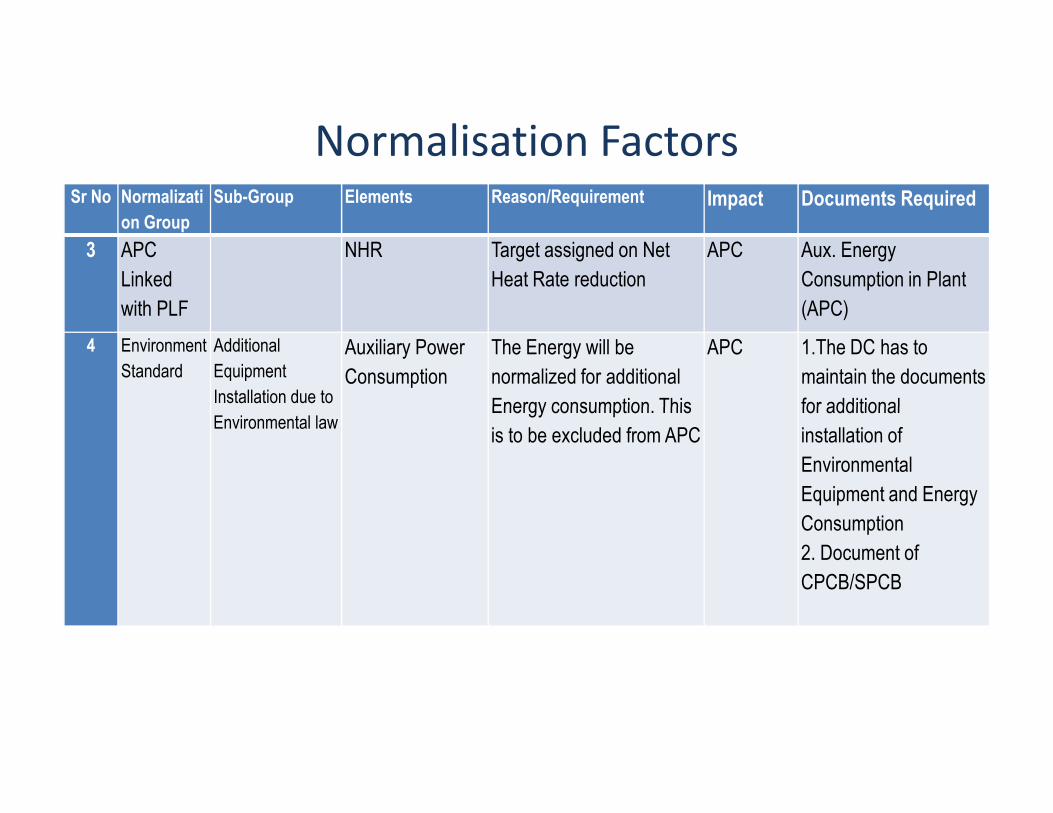
Sr No Normalizati
on Group
Sub-Group Elements Reason/Requirement Impact Documents Required
3 APC
Linked
with PLF
NHR Target assigned on Net
Heat Rate reduction
APC Aux. Energy
Consumption in Plant
(APC)
4 Environment
Standard
Additional
Equipment
Installation due to
Auxiliary Power
Consumption
The Energy will be
normalized for additional
Energy consumption. This
APC 1.The DC has to
maintain the documents
for additional
Normalisation Factors
Installation due to
Environmental lawEnergy consumption. This
is to be excluded from APC
for additional
installation of
Environmental
Equipment and Energy
Consumption
2. Document of
CPCB/SPCB
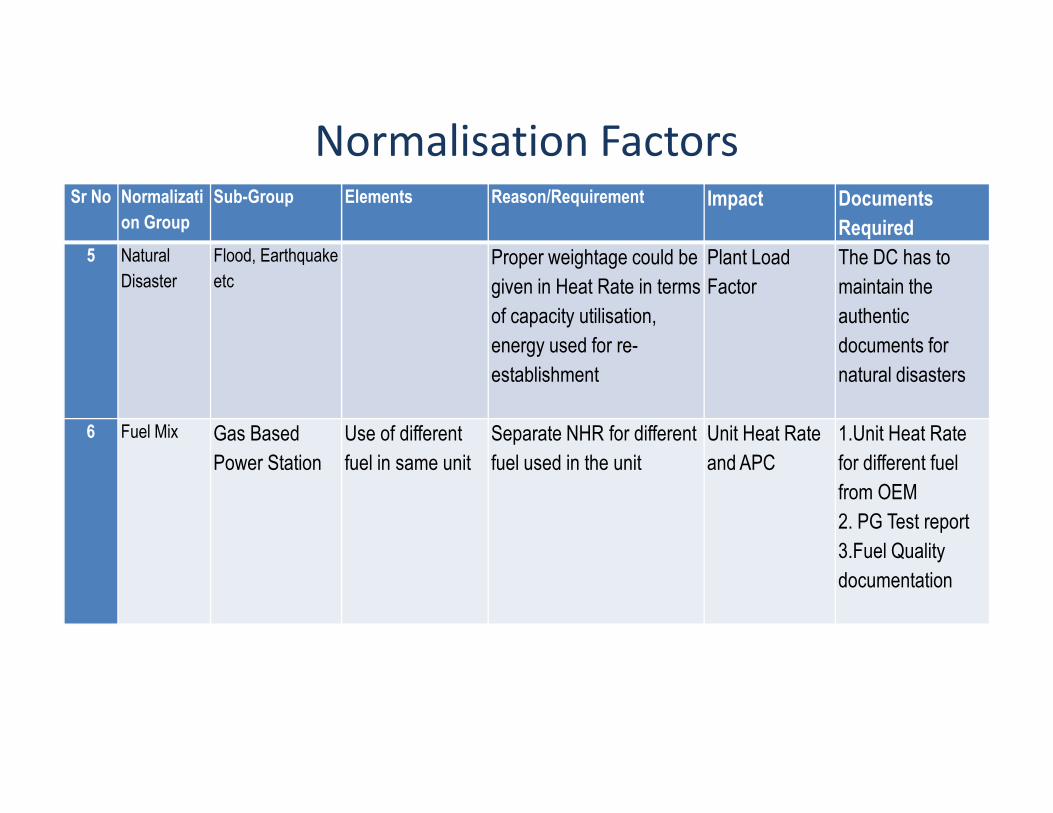
Sr No Normalizati
on Group
Sub-Group Elements Reason/Requirement Impact Documents
Required
5 Natural
Disaster
Flood, Earthquake
etc
Proper weightage could be
given in Heat Rate in terms
of capacity utilisation,
energy used for re-
establishment
Plant Load
Factor
The DC has to
maintain the
authentic
documents for
natural disasters
Normalisation Factors
6 Fuel Mix Gas Based
Power Station
Use of different
fuel in same unit
Separate NHR for different
fuel used in the unit
Unit Heat Rate
and APC
1.Unit Heat Rate
for different fuel
from OEM
2. PG Test report
3.Fuel Quality
documentation

Loss of Plant Load FactorLoss of Plant Load Factor
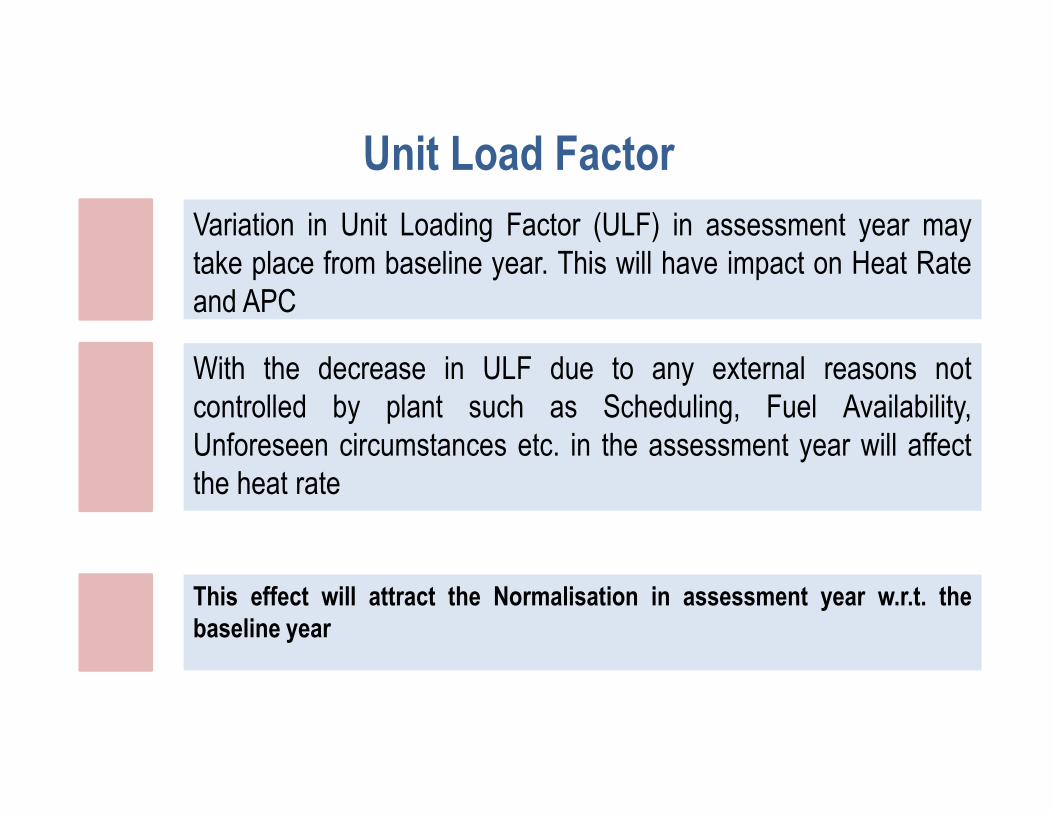
Unit Load Factor
Variation in Unit Loading Factor (ULF) in assessment year may
take place from baseline year. This will have impact on Heat Rate
and APC
With the decrease in ULF due to any external reasons not
controlled by plant such as Scheduling, Fuel Availability,controlled by plant such as Scheduling, Fuel Availability,
Unforeseen circumstances etc. in the assessment year will affect
the heat rate
This effect will attract the Normalisation in assessment year w.r.t. the
baseline year

Method of Normalization
Operating Heat Rate
Target Heat Rate Reduction
Normalised Target Heat Rate Reduction
Target Heat RateNormalised Target Heat Rate Normalised
HR Reduction
Design Heat Rate
Normalised Design Heat Rate NormalisedHR Reduction

Normalisation Factors for decrease in ULF
� Non availability of fuel and schedule
Station operating at part load condition following factors to beconsidered:-
1. Design Heat Rate
2. Operating Heat Rate
� Fuel Mix for Gas Power Station� Fuel Mix for Gas Power Station
� Natural Disaster like Earth Quake, Flood etc
� External Factor: Labor Strike, Change in Government policy, Rioting or Social unrest
If a plant shuts down (reserve shutdown)due to above reasons, the energy consumed during shutdown/restart will not be considered for calculation [Proper documents to be provided]

Characteristics Curve (Load Vs Turbine Heat Rate)
Coal Based Thermal Power Plant Actual Curve
y = 0.001x2 - 2.054x + 2523.
R² = 0.999
2040
2060
2080
2100
2120
2140
Turbine Heat Rate BHEL 500 MW
Heat Rate
(kcal/kWh)
Ra
te k
cal/
kwh
Excel topology of actual curve
1940
1960
1980
2000
2020
2040
200 300 400 500 600
MW
He
at
Ra
te k
cal/
kwh
� The polynomial equation of the characteristics curve with accuracy R2=0.9991, will calculate
the heat rate on any load
� The Plant has to submit the documents related to weighted PLF w.r.t. no of hrs (Running
time in which the plant desires the Normalisation in loss of PLF influenced by external
factor)

Turbine Efficiency Vs PLF Normalisation Example for Unit I of Plant A
y = 0.017x2 - 6.597x + 2684.
R² = 0.997
2250
2300
2350
k
c
a
Load (MW) Vs Turbine Heat Rate (kcal/kWh)
210 MW Characteristics Curve Excel topology 210 MW Characteristics Curve
2000
2050
2100
2150
2200
0 50 100 150 200 250
a
l
/
k
W
h
Load (MW)
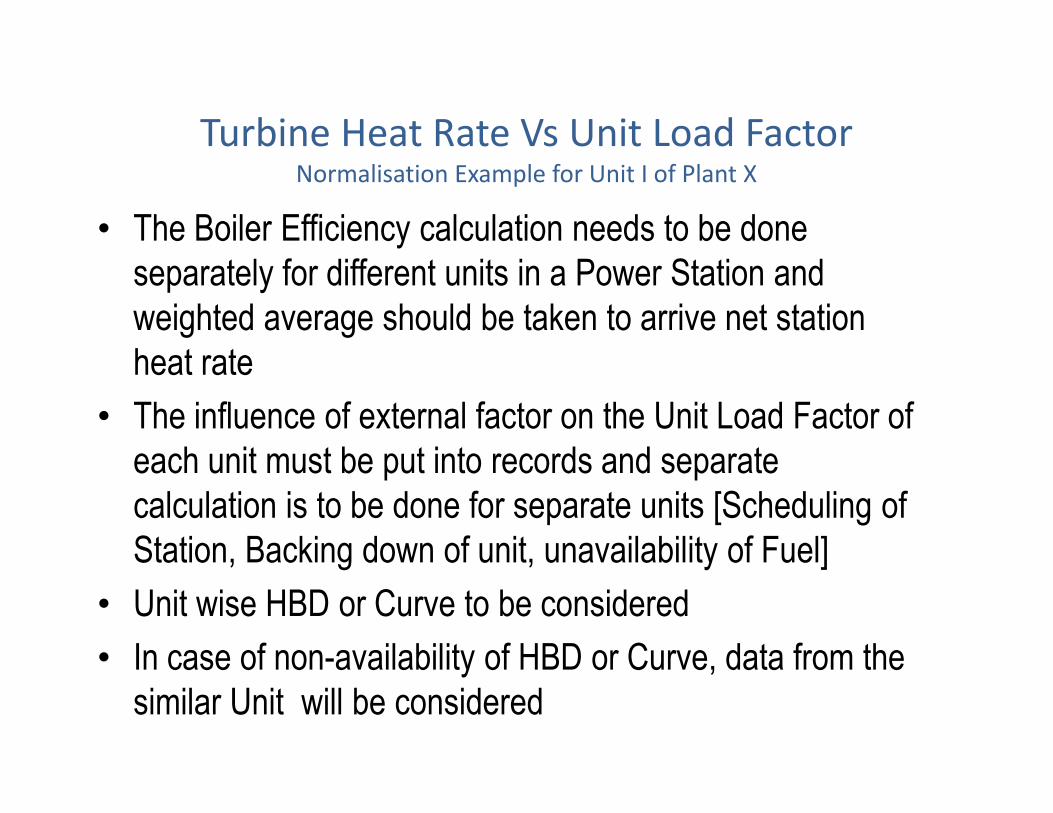
Turbine Heat Rate Vs Unit Load FactorNormalisation Example for Unit I of Plant X
• The Boiler Efficiency calculation needs to be done
separately for different units in a Power Station and
weighted average should be taken to arrive net station
heat rate
• The influence of external factor on the Unit Load Factor of • The influence of external factor on the Unit Load Factor of
each unit must be put into records and separate
calculation is to be done for separate units [Scheduling of
Station, Backing down of unit, unavailability of Fuel]
• Unit wise HBD or Curve to be considered
• In case of non-availability of HBD or Curve, data from the
similar Unit will be considered
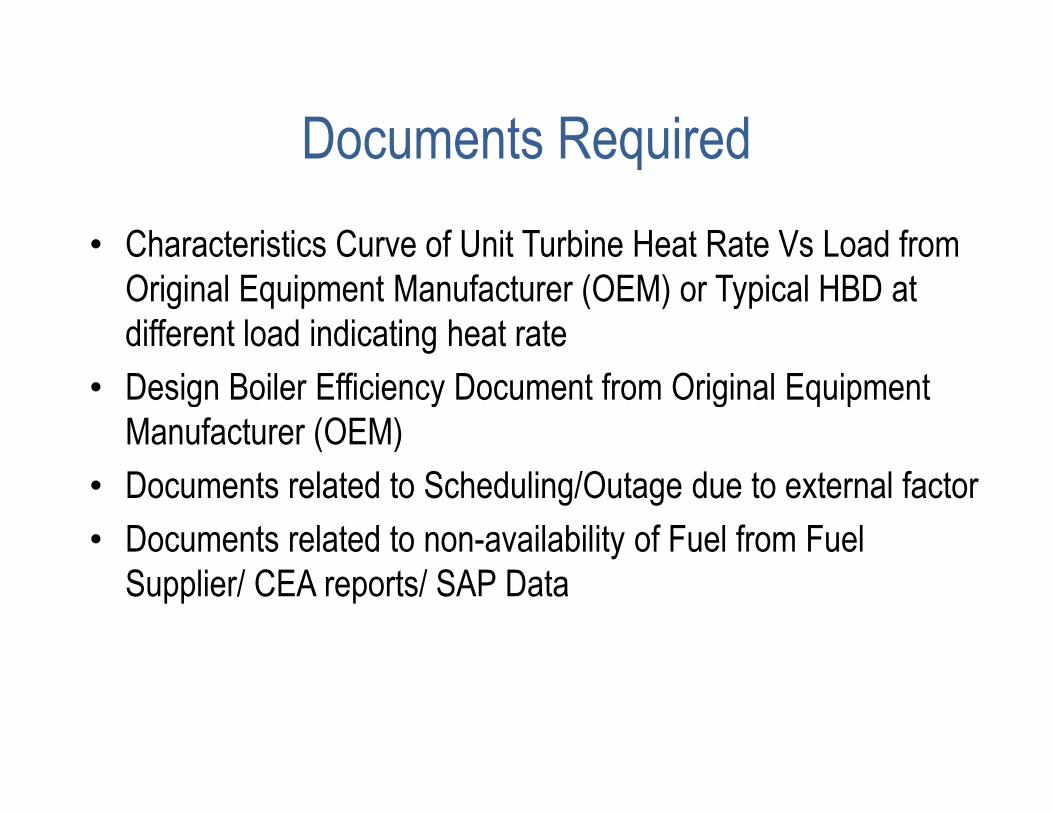
Documents Required
• Characteristics Curve of Unit Turbine Heat Rate Vs Load from
Original Equipment Manufacturer (OEM) or Typical HBD at
different load indicating heat rate
• Design Boiler Efficiency Document from Original Equipment • Design Boiler Efficiency Document from Original Equipment
Manufacturer (OEM)
• Documents related to Scheduling/Outage due to external factor
• Documents related to non-availability of Fuel from Fuel
Supplier/ CEA reports/ SAP Data

APC Linked with PLFAPC Linked with PLF
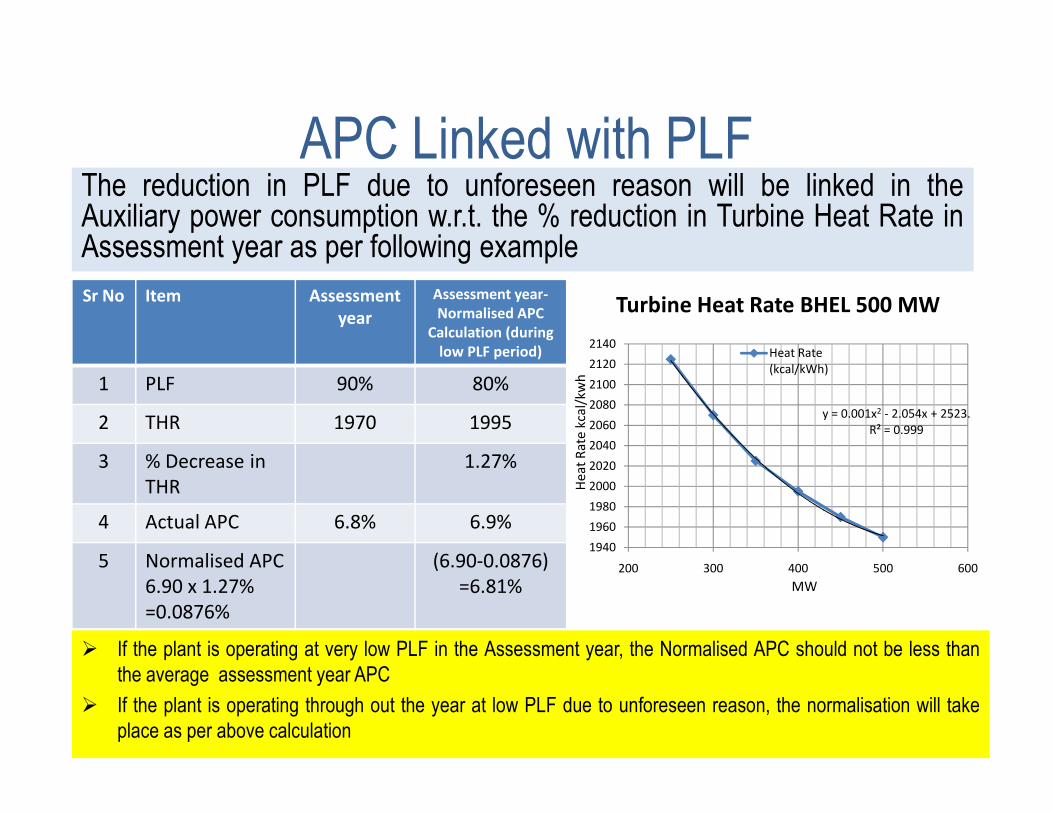
APC Linked with PLFThe reduction in PLF due to unforeseen reason will be linked in theAuxiliary power consumption w.r.t. the % reduction in Turbine Heat Rate inAssessment year as per following example
Sr No Item Assessment
year
Assessment year-
Normalised APC
Calculation (during
low PLF period)
1 PLF 90% 80%
y = 0.001x2 - 2.054x + 2523.2080
2100
2120
2140
Turbine Heat Rate BHEL 500 MW
Heat Rate
(kcal/kWh)
Ra
te k
cal/
kwh
2 THR 1970 1995
3 % Decrease in
THR
1.27%
4 Actual APC 6.8% 6.9%
5 Normalised APC
6.90 x 1.27%
=0.0876%
(6.90-0.0876)
=6.81%
y = 0.001x2 - 2.054x + 2523.
R² = 0.999
1940
1960
1980
2000
2020
2040
2060
2080
200 300 400 500 600
MWH
ea
tR
ate
kca
l/kw
h
� If the plant is operating at very low PLF in the Assessment year, the Normalised APC should not be less than
the average assessment year APC
� If the plant is operating through out the year at low PLF due to unforeseen reason, the normalisation will take
place as per above calculation

APC Linked with ULF
• DCs to provide curve for APC Vs Unit Load based on the dataavailable with them on quarterly basis
• APC should not include the Colony/ Construction power
• The data will be randomly verified
Gas Power StationGas Power Station

Gas based Power station
� The design heat rate for Gas based Power station adjusted to
site ambient conditions/PG test value will be taken for
calculation
� It covers all the deviation factors related to the environmental � It covers all the deviation factors related to the environmental
condition
�Due to some unforeseen reasons, if plant is operating in Open
Cycle, separate documents should be maintained by the Plant
for baseline as well as for assessment year

Normalisation Factors
Environmental Concern�Environmental Factors
� Increase in auxiliary power consumption due to change in environmental condition may be considered during target year
�Additional Energy due to Partial loading required for execution for environmental upgrade necessitated by Environmental lawenvironmental upgrade necessitated by Environmental law
Documents Required
1.The DC has to maintain the documents for additional installation of
Environmental Equipment
2. Document of CPCB/SPCB

Status of PAT in Pulp and Paper Sector

Structure of Indian Paper Industry
� The Indian paper industry has highly fragmented structure consisting
of small, medium and large sized paper mills having the capacities
ranging from 10 to 1150 tons per day.
� The industry employs wood, agro residues and recycled/waste paper
as the major raw material for manufacturing different varieties ofas the major raw material for manufacturing different varieties of
paper, paper board & newsprint
� the share in production of paper from recycled/waste paper, agro
residues and wood based raw materials is 47%, 22% and 31%
respectively
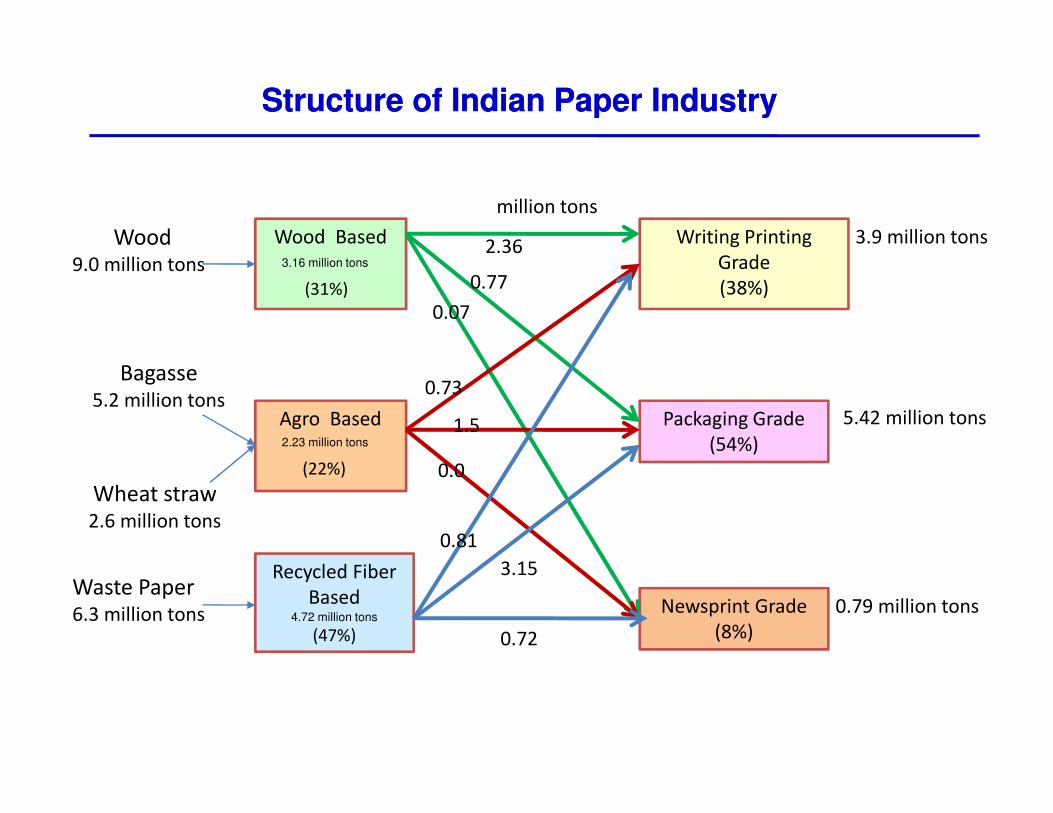
Structure of Indian Paper IndustryStructure of Indian Paper Industry
Wood Based
Agro Based
Wood9.0 million tons
Bagasse 5.2 million tons
Writing Printing
Grade
(38%)
Packaging Grade
3.9 million tons
5.42 million tons
2.36
0.77
million tons
0.07
0.73
3.16 million tons
(31%)
Agro Based
Recycled Fiber
Based 4.72 million tons
(47%)
5.2 million tons
Wheat straw 2.6 million tons
Waste Paper6.3 million tons
Packaging Grade
(54%)
Newsprint Grade
(8%)
5.42 million tons
0.79 million tons
1.5
0.0
0.81
3.15
0.72
2.23 million tons
(22%)

Number of Mills 759
Installed capacity, million tons 12.7
Operational capacity, million tons 11.4*
Capacity utilization, % ~ 90
Production of Paper, Paperboard & Newsprint, million tons/annum 10.11
Per Capita Consumption (kg) 9.3
Annual Turnover, Rs. Crores 30,000
Status of Indian Paper IndustryStatus of Indian Paper Industry
Annual Turnover, Rs. Crores 30,000
Contribution to Exchequer, Rs. Crores 3000
Employment Direct, million people 0.37
Indirect Employment, million people 1.2
Indian share in world’s production, % 2.6
Future production in 2025, million tonns 22
* 1.3 million tons capacity closed due to various reasons

Projected Demand & Supply of Paper, Paper Board & Projected Demand & Supply of Paper, Paper Board & Newsprint in India by 2025 (million tons)Newsprint in India by 2025 (million tons)
14.84
21.94
7.47
11.15
16.10
23.51
10.00
15.00
20.00
25.00
Mil
lio
n t
on
s
Estimated
6.80
10.117.47
0.991.85
3.37
5.66
0.380.61
1.29 2.32
0.00
5.00
10.00
Production Consumption Import Export
Mil
lio
n t
on
s

Industry Group Particulars Global Consumption
Levels
Current Industry Consumption
Wood based mills
Raw material, t/ t paper** 1.8 - 2.0 2.2 - 2.4
Power, kWh/t paper 1000 - 1100 1400-1500
Steam, t/ t paper 7 - 9 12 – 13
Water, m3/ t paper below 50 Upto 100
Agro Based mills
Raw material, t/ t paper NA 2.6 – 2.8
Power, kWh/t paper NA 1200 – 1400
Steam*, t/ t paper NA • 12- 14 (CR)
• 8-10 (NCR)
Water, m3/ t paper NA Upto 120
RCF based mills producing unbleached
Raw material, t/ t paper 1.1 1.1- 1.2
Power, kWh/t paper 500 450 – 550
Status of Energy Consumption in Pulp & Paper Industry
RCF based mills producing unbleached
grades
Power, kWh/t paper 500 450 – 550
Steam, t/ t paper 2.5 4 – 5
Water, m3/ t paper 5.0 – 7.5 Upto 30
RCF based mills producing bleached
grades
Raw material, t/ t paper 1.2 - 1.25 1.2 - 1.4
Power, kWh/t paper 600 - 650 680 – 800
Steam, t/ t paper 4.0 - 4.5 6.0 – 7.0
Water, m3/ t paper 10 -15 Upto 50
Source: Industry & Associations dataNA – industry data not available*Agro based mills are classified on the basis of conventional (CR) and non-conventional (NCR) chemical recovery methods.**Raw material is accounted for in Bone Dry weight.

Status of Designated Consumer of Indian Paper Sector (DCs) under
PATThreshold limit for
becoming a DC
30000 metric tons of oil equivalent
(MTOE) per annum
Total number of 31Total number of
identified DCs
31
Estimated Energy
Consumption
2.14Million TOE (MTOE) [1.27% of
total consumption]

Apportionment of National Target of Energy Saving among all Manufacturing Sectors
S.No. Sector No. of
Identified
DC’s
Reported
Energy
Consumption
Share of
Consumption
Apportioned
Energy
Reduction
(MTOE) (%) (MTOE)
1 Iron and Steel 80 28.00 46.66 % 1.647
2 Cement 65 11.87 19.78 % 0.698
3 Fertilizers 28 7.86 13.10 % 0.4623 Fertilizers 28 7.86 13.10 % 0.462
4 Aluminium 10 7.73 12.88 % 0.455
5 Paper and Pulp 31 2.09 3.48 % 0.123
6 Textile 85 1.62 2.70 % 0.095
7 Chlor- Alkali 18 0.84 1.40 % 0.049
8 Power Available in the Gazette
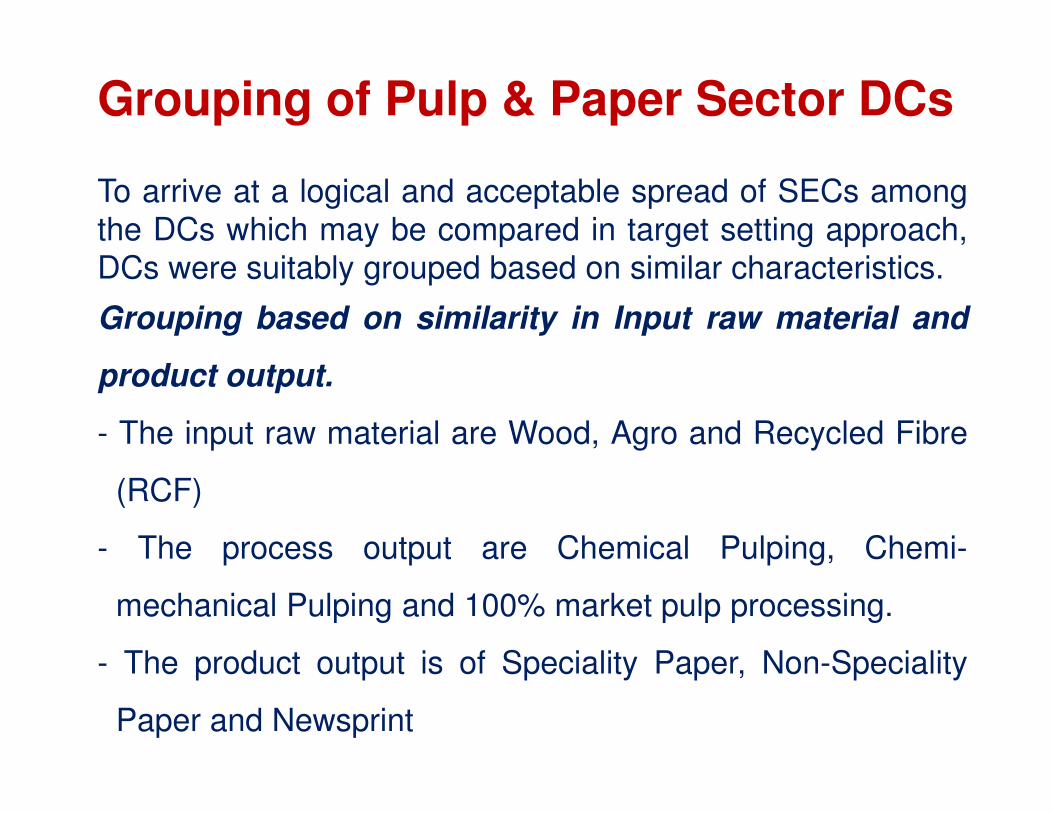
Grouping of Pulp & Paper Sector DCs
To arrive at a logical and acceptable spread of SECs amongthe DCs which may be compared in target setting approach,DCs were suitably grouped based on similar characteristics.
Grouping based on similarity in Input raw material and
product output.
- The input raw material are Wood, Agro and Recycled Fibre
(RCF)
- The process output are Chemical Pulping, Chemi-
mechanical Pulping and 100% market pulp processing.
- The product output is of Speciality Paper, Non-Speciality
Paper and Newsprint

PULP AND PAPER SECTOR
(31 DCs )
WOOD
(20 DCs)
AGRO
(6 DCs)
RCF
(5 DC)
Grouping of DCs
Chemical
(18 DCs)
Chemi-
Mechanical
(1 DCs)
100% Market Pulp
(1 DCs)
Speciality Paper
(1 DCs)Non- Speciality Paper
(17 DCs)
Chemi-
Mechanical
(3 DCs)
Chemical
(2 DCs)
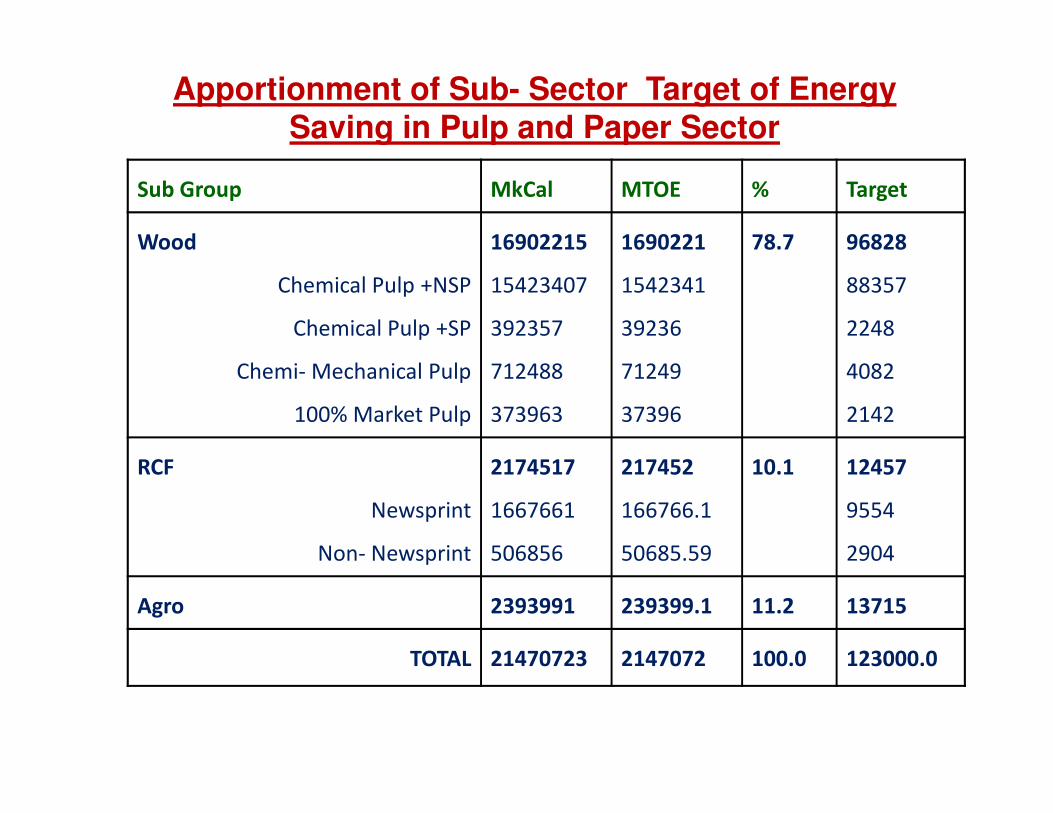
Apportionment of Sub- Sector Target of Energy Saving in Pulp and Paper Sector
Sub Group MkCal MTOE % Target
Wood
Chemical Pulp +NSP
Chemical Pulp +SP
Chemi- Mechanical Pulp
100% Market Pulp
16902215
15423407
392357
712488
373963
1690221
1542341
39236
71249
37396
78.7 96828
88357
2248
4082
2142100% Market Pulp 373963 37396 2142
RCF
Newsprint
Non- Newsprint
2174517
1667661
506856
217452
166766.1
50685.59
10.1 12457
9554
2904
Agro 2393991 239399.1 11.2 13715
TOTAL 21470723 2147072 100.0 123000.0
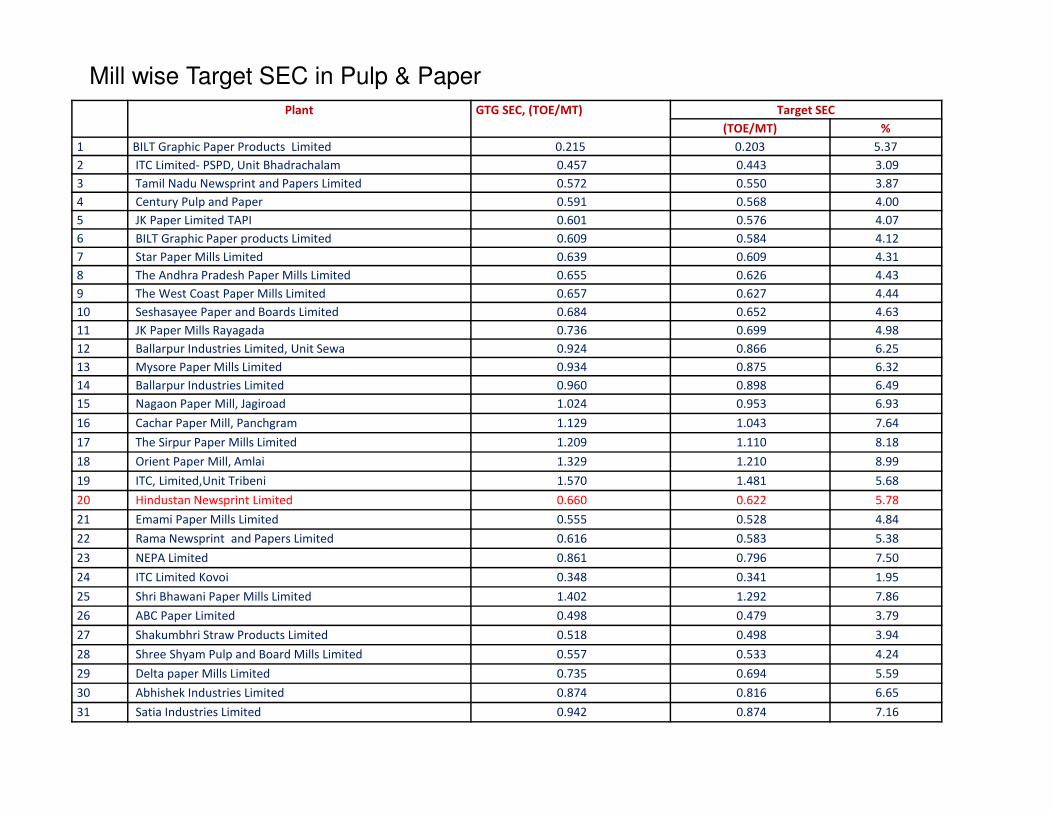
Plant GTG SEC, (TOE/MT) Target SEC
(TOE/MT) %
1 BILT Graphic Paper Products Limited 0.215 0.203 5.37
2 ITC Limited- PSPD, Unit Bhadrachalam 0.457 0.443 3.09
3 Tamil Nadu Newsprint and Papers Limited 0.572 0.550 3.87
4 Century Pulp and Paper 0.591 0.568 4.00
5 JK Paper Limited TAPI 0.601 0.576 4.07
6 BILT Graphic Paper products Limited 0.609 0.584 4.12
7 Star Paper Mills Limited 0.639 0.609 4.31
8 The Andhra Pradesh Paper Mills Limited 0.655 0.626 4.43
9 The West Coast Paper Mills Limited 0.657 0.627 4.44
10 Seshasayee Paper and Boards Limited 0.684 0.652 4.63
11 JK Paper Mills Rayagada 0.736 0.699 4.98
12 Ballarpur Industries Limited, Unit Sewa 0.924 0.866 6.25
13 Mysore Paper Mills Limited 0.934 0.875 6.32
14 Ballarpur Industries Limited 0.960 0.898 6.49
15 Nagaon Paper Mill, Jagiroad 1.024 0.953 6.93
Mill wise Target SEC in Pulp & Paper
15 Nagaon Paper Mill, Jagiroad 1.024 0.953 6.93
16 Cachar Paper Mill, Panchgram 1.129 1.043 7.64
17 The Sirpur Paper Mills Limited 1.209 1.110 8.18
18 Orient Paper Mill, Amlai 1.329 1.210 8.99
19 ITC, Limited,Unit Tribeni 1.570 1.481 5.68
20 Hindustan Newsprint Limited 0.660 0.622 5.78
21 Emami Paper Mills Limited 0.555 0.528 4.84
22 Rama Newsprint and Papers Limited 0.616 0.583 5.38
23 NEPA Limited 0.861 0.796 7.50
24 ITC Limited Kovoi 0.348 0.341 1.95
25 Shri Bhawani Paper Mills Limited 1.402 1.292 7.86
26 ABC Paper Limited 0.498 0.479 3.79
27 Shakumbhri Straw Products Limited 0.518 0.498 3.94
28 Shree Shyam Pulp and Board Mills Limited 0.557 0.533 4.24
29 Delta paper Mills Limited 0.735 0.694 5.59
30 Abhishek Industries Limited 0.874 0.816 6.65
31 Satia Industries Limited 0.942 0.874 7.16

Suggestions to Achieve the PAT Targets
• Prepare a Roadmap for achieving the targets by stream lining the
organizational EMS.
– Setup effective monitoring system in the organization
– Form a dedicated Execution Team
– Assess Energy Performance at Process Level
– Estimate Potential for improvement
– Set goals – Determine Roles & Resources
– Implement Action Plan – Phase wise
– Evaluate progress
– Measure results and review action plan
• Explore possibility of ESCO route to implement EE projects
• Provide details of raw materials (purchased pulp), products (salable pulp,
grades of papers and gsm variation) and energy inputs (quality of coal etc) to
DENA during baseline energy audits.
• Identify in-house generated fuels (black liquor, chipper dust, ETP sludge etc.)
for subtraction from SEC calculation of GTG concept.
• Mills should carryout internal exercise to evaluate their industry specific • Mills should carryout internal exercise to evaluate their industry specific
“Normalization Factors” by collection of data on different grades produced,
gsm variation annually and its impact on steam and power consumption.
Any correlation between the product variation and energy consumption may
be useful to normalise the SEC calculation for a mill.

Conclusions
72

CONCLUSIONSCONCLUSIONS
• Energy Savings Potential :
Introduction of Perform, Achieve and Trade (PAT)Scheme for Energy Intensive Industries
– improves energy efficiency
– facilitates cost effectiveness by certifying energysaving that could be traded due to its market basedmechanismmechanism
• Benefits : At the end of first phase of PAT Cycle
(2012- 2015)
– Energy saving potential of 6.686 million toe for 478Designated Consumers
– Reduction in India’s CO2 emissions
• 24 million tons per year in 2014-15
CONCLUSIONS (contd…)CONCLUSIONS (contd…)
� Faster Adoption of Low Carbon Technology:PAT is one of the most promising initiatives to achieve the above goal
� Implementation of Best Available � Implementation of Best Available Practices and Technologies in the identified sectors
� Economically viable projects
� Innovative Model

75