kleinhenz
DESCRIPTION
North State Building Industry Association Robert A. Kleinhenz, Ph.D. Deputy Chief Economist California Association of REALTORS® November 4, 2010 US and California Economy Local/Regional Housing Market California Housing Forecast California Housing Market www.car.org Market Data Speeches Speeches & Presentations US and California Economic ConditionsTRANSCRIPT

Economic and Market
Outlook 2010-11
North State Building Industry AssociationNovember 4, 2010
Robert A. Kleinhenz, Ph.D.
Deputy Chief Economist
California Association of REALTORS®

Overview
US and California Economy
California Housing Market
Local/Regional Housing Market
California Housing Forecast
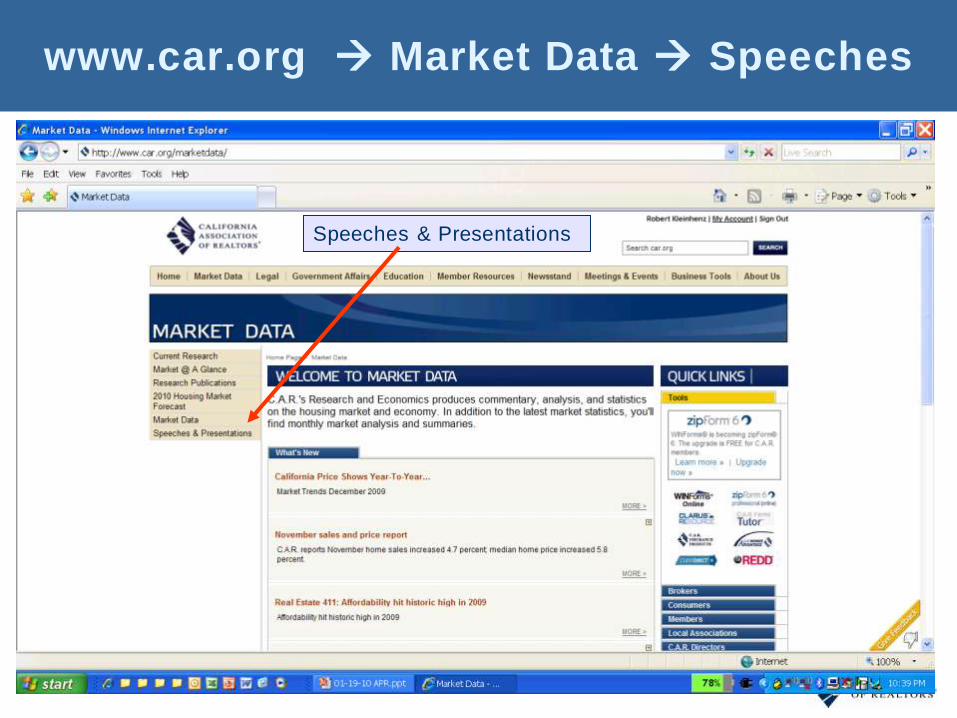
www.car.org Market Data Speeches
Speeches & Presentations

US and California
Economic Conditions

U.S. Economic Outlook
2004 2005 2006 2007 2008 2009 2010f 2011f
US GDP 3.6% 3.1% 2.7% 1.9% 0.0% -2.6% 2.7% 2.4%
Nonfarm Job
Growth1.1% 1.7% 1.8% 1.1% -0.4% -4.3% -0.5% 1.0%
Unemployment 5.5% 5.1% 4.6% 4.6% 5.8% 9.3% 9.7% 9.6%
CPI 2.7% 3.4% 3.2% 2.8% 3.8% -0.3% 1.5% 1.3%
Real Disposable
Income, %
Change
3.4% 1.3% 4.0% 2.2% 0.5% 0.9% 1.2% 1.1%
SOURCE: California Association of REALTORS®
Forecast Date: October 1, 2010

California Economic Outlook
2004 2005 2006 2007 2008 2009 2010f 2011f
Nonfarm Job
Growth1.0% 1.8% 1.7% 0.8% -1.3% -6.0% -1.0% 1.6%
Unemployment
Rate6.2% 5.4% 4.9% 5.4% 7.2% 11.4% 12.3% 11.4%
Population
Growth1.4% 1.2% 1.1% 1.1% 1.2% 1.1% 1.0% 1.0%
Real Disposable
Income, %
Change
3.6% 1.3% 3.4% 1.5% 0.1% -2.2% 0.6% 1.9%
SOURCE: California Association of REALTORS®
Forecast Date: October 1, 2010

-750000
-550000
-350000
-150000
50000
250000
450000
Ja
n-0
8
Fe
b-0
8
Ma
r-0
8
Ap
r-0
8
Ma
y-0
8
Ju
n-0
8
Ju
l-0
8
Au
g-
Se
p-0
8
Oc
t-0
8
No
v-0
8
De
c-0
8
Ja
n-0
9
Fe
b-0
9
Ma
r-0
9
Ap
r-0
9
Ma
y-0
9
Ju
n-0
9
Ju
l-0
9
Au
g-
Se
p-0
9
Oc
t-0
9
No
v-0
9
De
c-0
9
Ja
n-1
0
Fe
b-1
0
Ma
r-1
0
Ap
r-1
0
Ma
y-1
0
Ju
n-1
0
Ju
l-1
0
Au
g-
Se
p-1
0
U.S. Non-farm Job Growth
SOURCE: US Dept of Labor, Bureau of Labor Statistics
Month-to-Month Changes

California Employment Trends by Industry
Industry 2000 2005 2010 YTD2005 to
2010
Mining and Logging 26,500 23,600 26,400 2,800
Construction 733,400 905,300 567,200 (338,100)
Manufacturing 1,852,700 1,502,600 1,250,800 (251,800)
Trade, Transportation & Utilities 2,727,900 2,822,100 2,572,000 (250,100)
Information 576,700 473,600 444,600 (29,000)
Financial Activities 806,900 927,200 776,900 (150,300)
Professional & Business Services 2,221,800 2,159,800 2,059,900 (99,900)
Educational & Health Services 1,401,000 1,586,500 1,725,300 138,800
Leisure & Hospitality 1,335,600 1,475,200 1,509,900 34,700
Other Services 487,700 505,500 479,600 (25,900)
Government 2,318,100 2,420,200 2,354,100 (66,100)
TOTAL 14,488,300 14,801,600 13,766,700 (1,034,900)
SOURCE: California Association of REALTORS®

Economic Snapshot
Recession over, slow recovery expected
Government support in first half of 2010
Private sector economy must accelerate
thereafter
Business, Global Trade, Consumers
Labor market: mixed signals, job growth in late
’10
Inflation: in check through 2011
Monetary policy: no rate hikes until 2011

California Housing Market

Sales of Existing Detached Homes and Pacific West Consumer Confidence
California, September 2010 Sales: 466,580 Units, -12.2% YTY, -8.8% YTD
0
100,000
200,000
300,000
400,000
500,000
600,000
700,000
Ja
n-0
0A
pr-
00
Ju
l-0
0O
ct-
00
Ja
n-0
1A
pr-
01
Ju
l-0
1O
ct-
01
Ja
n-0
2A
pr-
02
Ju
l-0
2O
ct-
02
Ja
n-0
3A
pr-
03
Ju
l-0
3O
ct-
03
Ja
n-0
4A
pr-
04
Ju
l-0
4O
ct-
04
Ja
n-0
5A
pr-
05
Ju
l-0
5O
ct-
05
Ja
n-0
6A
pr-
06
Ju
l-0
6O
ct-
06
Ja
n-0
7A
pr-
07
Ju
l-0
7O
ct-
07
Ja
n-0
8A
pr-
08
Ju
l-0
8O
ct-
08
Ja
n-0
9A
pr-
09
Ju
l-0
9O
ct-
09
Ja
n-1
0A
pr-
10
Ju
l-1
0
0
20
40
60
80
100
120
140
160
Sales Consumer Confidence INDEXUNITS
SOURCE: California Association of REALTORS®; The Conference Board
*Sales are seasonally adjusted and annualized

0
20
40
60
80
100
120
140
20
00
.01
20
01
.01
20
02
.01
20
03
.01
20
04
.01
20
05
.01
20
06
.01
20
07
.01
20
08
.01
20
09
.01
20
10
.01
CA US
CA Sales Back to Pre-Peak Levels by mid
‘08California Vs. U.S. 2000-Present
SOURCE: California Association of REALTORS®
Seasonally Adjusted Sales Index (Jan 2004=100)

Existing Home Sales vs Building Permits
EXISTING HOMES
SOURCE: California Association of REALTORS®, CIRB
0
100,000
200,000
300,000
400,000
500,000
600,000
700,000
19
88
19
89
19
90
19
91
19
92
19
93
19
94
19
95
19
96
19
97
19
98
19
99
20
00
20
01
20
02
20
03
20
04
20
05
20
06
20
07
20
08
20
09
0
20,000
40,000
60,000
80,000
100,000
120,000
140,000
160,000
180,000
Sales of Existing Detached Homes Single Family Permits
California Sales of Existing Homes and Median Price
SF PERMITS

P: May-07
$594,530
T: Feb-09
$245,230
-59% from
peak
$0
$100,000
$200,000
$300,000
$400,000
$500,000
$600,000
$700,000
Ja
n-0
1
Ju
l-0
1
Ja
n-0
2
Ju
l-0
2
Ja
n-0
3
Ju
l-0
3
Ja
n-0
4
Ju
l-0
4
Ja
n-0
5
Ju
l-0
5
Ja
n-0
6
Ju
l-0
6
Ja
n-0
7
Ju
l-0
7
Ja
n-0
8
Ju
l-0
8
Ja
n-0
9
Ju
l-0
9
Ja
n-1
0
Ju
l-1
0
Median Price of Existing Detached HomesCalifornia, September 2010: $309,900, Up 4.5% YTY
SOURCE: California Association of REALTORS®

Trough vs. Current Price – Sep 2010
RegionTrough
Month
Trough
Price
Sept-10
Median
% Chg From
Trough
Monterey Region Feb-09 $241,130 $343,000 42.2%
San Francisco Bay Area Feb-09 $399,040 $563,480 41.2%
Santa Clara Feb-09 $445,000 $620,000 39.3%
CALIFORNIA Feb-09 $245,230 $309,900 26.4%
Ventura Feb-09 $359,630 $453,290 26.0%
Riverside/San Bernardino Apr-09 $156,840 $191,080 21.8%
Orange County Jan-09 $423,100 $510,530 20.7%
San Diego Mar-09 $326,830 $388,850 19.0%
Los Angeles Mar-09 $295,100 $349,040 18.3%
High Desert May-09 $106,210 $124,960 17.7%
Northern Wine Country Feb-09 $310,950 $358,040 15.1%
Palm Springs/Lower Desert Apr-09 $150,140 $169,320 12.8%
Sacramento Apr-09 $167,340 $181,780 8.6%
San Luis Obispo Apr-09 $338,160 $354,880 4.9%
Northern California May-10 $243,200 $245,190 0.8%
SOURCE: California Association of REALTORS®

Unsold Inventory IndexCalifornia, September 2010: 6.2 Months
0
2
4
6
8
10
12
14
16
18
20
Ja
n-8
8
Ja
n-8
9
Ja
n-9
0
Ja
n-9
1
Ja
n-9
2
Ja
n-9
3
Ja
n-9
4
Ja
n-9
5
Ja
n-9
6
Ja
n-9
7
Ja
n-9
8
Ja
n-9
9
Ja
n-0
0
Ja
n-0
1
Ja
n-0
2
Ja
n-0
3
Ja
n-0
4
Ja
n-0
5
Ja
n-0
6
Ja
n-0
7
Ja
n-0
8
Ja
n-0
9
Ja
n-1
0
SOURCE: CALIFORNIA ASSOCIATION OF REALTORS®
MONTHS

Price Range (Thousand) Sep-10 Aug-10 Sep-09
$1,000K+ 11.6 11.3 11.8
$750-1000K 7.0 7.1 6.9
$500-750K 6.4 6.4 4.4
$300-500K 5.4 5.4 3.7
$0-300K 4.2 4.0 2.8
Unsold Inventory Index (Months)
SOURCE: CALIFORNIA ASSOCIATION OF REALTORS®

County/Region Aug-09 Aug-10
San Diego 39.1% 26.9%
Orange 41.4% 36.4%
San Luis Obispo 38.7% 40.7%
Los Angeles 56.2% 47.4%
Sacramento 66.4% 62.8%
Riverside/San Bernardino 79.5% 66.0%
Kern 72.9% 63.4%
Distressed Sales to Total Sales Ratio
SOURCE: California Association of REALTORS®

19% 16%
30%22%
36%43%
38%
20%27%
25%10%
20%8%
27%
0%
20%
40%
60%
80%S
an
Die
go
Ora
ng
e
San
Lu
is
Ob
isp
o
Lo
s A
ng
ele
s
Sacra
men
to
Kern
Riv
ers
ide/S
an
Bern
ard
ino
REO/Bank Owned Short Sales
Distressed Sales Breakdown(Aug 2010)

Price Differential by Type of SaleREO, Short-Sale, Regular
SOURCE: C.A.R.
Median Price
$0
$50,000
$100,000
$150,000
$200,000
$250,000
$300,000
$350,000
$400,000
$450,000
Jan-10 Feb-10 Mar-10 Apr-10 May-10 Jun-10 Jul-10 Aug-10
Conventional Short Sale Bank Owned All Types
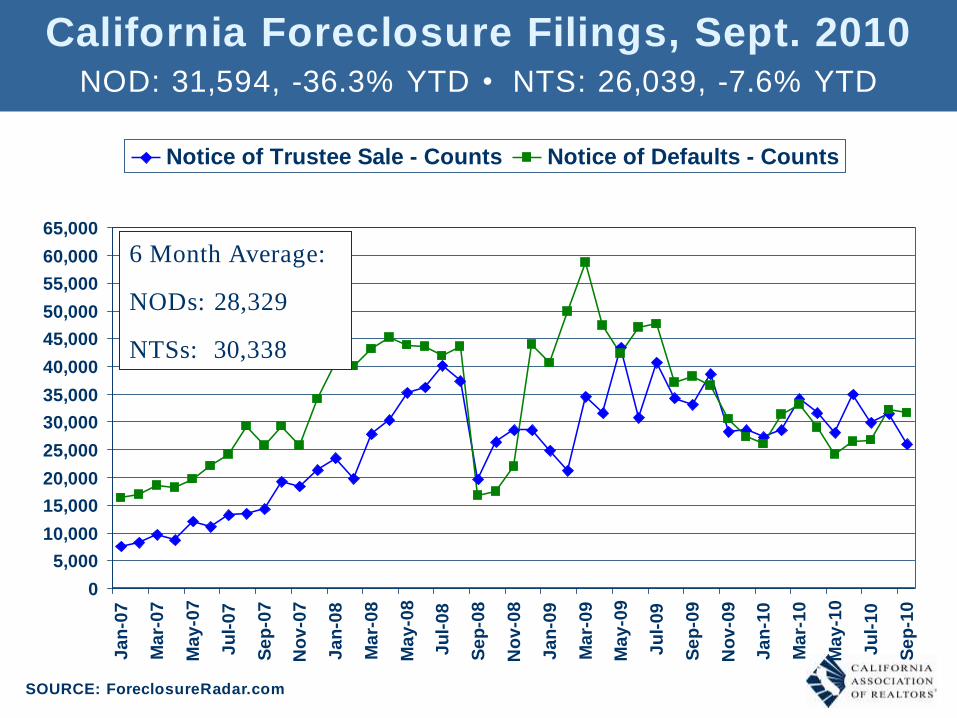
California Foreclosure Filings, Sept. 2010NOD: 31,594, -36.3% YTD • NTS: 26,039, -7.6% YTD
0
5,000
10,000
15,000
20,000
25,000
30,000
35,000
40,000
45,000
50,000
55,000
60,000
65,000
Ja
n-0
7
Ma
r-0
7
Ma
y-0
7
Ju
l-0
7
Se
p-0
7
No
v-0
7
Ja
n-0
8
Ma
r-0
8
Ma
y-0
8
Ju
l-0
8
Se
p-0
8
No
v-0
8
Ja
n-0
9
Ma
r-0
9
Ma
y-0
9
Ju
l-0
9
Se
p-0
9
No
v-0
9
Ja
n-1
0
Ma
r-1
0
Ma
y-1
0
Ju
l-1
0
Se
p-1
0
Notice of Trustee Sale - Counts Notice of Defaults - Counts
SOURCE: ForeclosureRadar.com
6 Month Average:
NODs: 28,329
NTSs: 30,338

California Foreclosure Outcomes, Sept.
2010REO: -7.1% YTD • 3rd Party: +67.7% YTD • Cancel: +111.8% YTD
0
5,000
10,000
15,000
20,000
25,000
30,000
Ja
n-0
7F
eb
-07
Ma
r-0
7A
pr-
07
Ma
y-0
7J
un
-07
Ju
l-0
7A
ug
-07
Se
p-0
7O
ct-
07
No
v-0
7D
ec
-07
Ja
n-0
8F
eb
-08
Ma
r-0
8A
pr-
08
Ma
y-0
8J
un
-08
Ju
l-0
8A
ug
-08
Se
p-0
8O
ct-
08
No
v-0
8D
ec
-08
Ja
n-0
9F
eb
-09
Ma
r-0
9A
pr-
09
Ma
y-0
9J
un
-09
Ju
l-0
9A
ug
-09
Se
p-0
9O
ct-
09
No
v-0
9D
ec
-09
Ja
n-1
0F
eb
-10
Ma
r-1
0A
pr-
10
Ma
y-1
0J
un
-10
Ju
l-1
0A
ug
-10
Se
p-1
0
REOs Sold to 3rd Party Cancellations
SOURCE: ForeclosureRadar.com
6 Month Average:
REO: 13,319
3rd Party: 3,520
Cancelled: 18,072
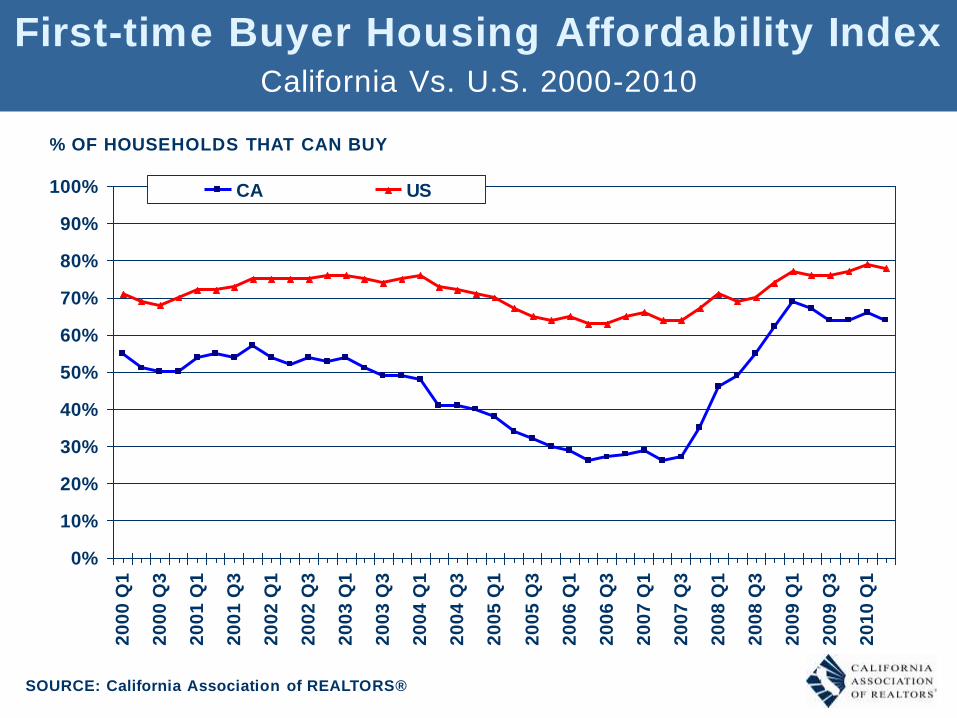
First-time Buyer Housing Affordability IndexCalifornia Vs. U.S. 2000-2010
0%
10%
20%
30%
40%
50%
60%
70%
80%
90%
100%
20
00
Q1
20
00
Q3
20
01
Q1
20
01
Q3
20
02
Q1
20
02
Q3
20
03
Q1
20
03
Q3
20
04
Q1
20
04
Q3
20
05
Q1
20
05
Q3
20
06
Q1
20
06
Q3
20
07
Q1
20
07
Q3
20
08
Q1
20
08
Q3
20
09
Q1
20
09
Q3
20
10
Q1
CA US
% OF HOUSEHOLDS THAT CAN BUY
SOURCE: California Association of REALTORS®

SOURCE: Federal Home Loan Mortgage Corporation
Mortgage Rates
0%
1%
2%
3%
4%
5%
6%
7%
8%
9%
10%
Ja
n-9
1
Ja
n-9
2
Ja
n-9
3
Ja
n-9
4
Ja
n-9
5
Ja
n-9
6
Ja
n-9
7
Ja
n-9
8
Ja
n-9
9
Ja
n-0
0
Ja
n-0
1
Ja
n-0
2
Ja
n-0
3
Ja
n-0
4
Ja
n-0
5
Ja
n-0
6
Ja
n-0
7
Ja
n-0
8
Ja
n-0
9
Ja
n-1
0
FRM
ARM
FederalFunds

Median Price to Median HH Income RatioCalifornia
4
10
4.5
5
0
1
2
3
4
5
6
7
8
9
10
11
19
89
19
90
19
91
19
92
19
93
19
94
19
95
19
96
19
97
19
98
19
99
20
00
20
01
20
02
20
03
20
04
20
05
20
06
20
07
20
08
20
09
20
10
SOURCE: California Association of REALTORS®
Average Over Years Shown: 6:1
Ratio

Market Snapshot
Has Market Hit Bottom?
State sales hit bottom in late ’07
State median price hit bottom in early ’09
Some parts of state still looking for bottom but are close
Inventory Marginally Higher but Lean
More MLS inventory at higher price ranges
Distressed properties at steady pace, more short sales
Looking Ahead
This Year: Sales down 10%, Price up 11%
Next Year: Sales up 2%, Price up 2%
Supply: More discretionary sellers
Historic Opportunity for Qualified Buyers

Sacramento Regional
Housing Market

Sales of Existing Detached HomesSacramento County, 2009: 19,983 Units, Up 3.5% YTY
UNITS
SOURCE: CALIFORNIA ASSOCIATION OF REALTORS®
0
5,000
10,000
15,000
20,000
25,0001
98
9
19
90
19
91
19
92
19
93
19
94
19
95
19
96
19
97
19
98
19
99
20
00
20
01
20
02
20
03
20
04
20
05
20
06
20
07
20
08
20
09

Sales of Existing Detached HomesPlacer County, 2009: 4,112 Units, Up 1.0% YTY
UNITS
SOURCE: CALIFORNIA ASSOCIATION OF REALTORS®
0
1,000
2,000
3,000
4,000
5,000
6,000
19
89
19
90
19
91
19
92
19
93
19
94
19
95
19
96
19
97
19
98
19
99
20
00
20
01
20
02
20
03
20
04
20
05
20
06
20
07
20
08
20
09

Sales of Existing Detached Homes and Pacific West Consumer Confidence
Sacramento County, Sept. 2010: 1,430 Units, Down 13.3% YTD, Down 12.3% YTY
INDEXUNITS
0
200
400
600
800
1000
1200
1400
1600
1800
2000
2200
2400
2600
Ja
n-9
1J
ul-
91
Ja
n-9
2J
ul-
92
Ja
n-9
3J
ul-
93
Ja
n-9
4J
ul-
94
Ja
n-9
5J
ul-
95
Ja
n-9
6J
ul-
96
Ja
n-9
7J
ul-
97
Ja
n-9
8J
ul-
98
Ja
n-9
9J
ul-
99
Ja
n-0
0J
ul-
00
Ja
n-0
1J
ul-
01
Ja
n-0
2J
ul-
02
Ja
n-0
3J
ul-
03
Ja
n-0
4J
ul-
04
Ja
n-0
5J
ul-
05
Ja
n-0
6J
ul-
06
Ja
n-0
7J
ul-
07
Ja
n-0
8J
ul-
08
Ja
n-0
9J
ul-
09
Ja
n-1
0J
ul-
10
0
20
40
60
80
100
120
140
160
Sales Consumer Confidence
SOURCE: CALIFORNIA ASSOCIATION OF REALTORS®; The Conference Board

Sales of Existing Detached Homes and Pacific West Consumer Confidence
Placer County, Sept. 2010: 408 Units, Up 15.2% YTD, Up 4.9% YTY
INDEXUNITS
0
200
400
600
800
Ja
n-9
1J
ul-
91
Ja
n-9
2J
ul-
92
Ja
n-9
3J
ul-
93
Ja
n-9
4J
ul-
94
Ja
n-9
5J
ul-
95
Ja
n-9
6J
ul-
96
Ja
n-9
7J
ul-
97
Ja
n-9
8J
ul-
98
Ja
n-9
9J
ul-
99
Ja
n-0
0J
ul-
00
Ja
n-0
1J
ul-
01
Ja
n-0
2J
ul-
02
Ja
n-0
3J
ul-
03
Ja
n-0
4J
ul-
04
Ja
n-0
5J
ul-
05
Ja
n-0
6J
ul-
06
Ja
n-0
7J
ul-
07
Ja
n-0
8J
ul-
08
Ja
n-0
9J
ul-
09
Ja
n-1
0J
ul-
10
0
20
40
60
80
100
120
140
160
Sales Consumer Confidence
SOURCE: CALIFORNIA ASSOCIATION OF REALTORS®; The Conference Board

Annual Median PriceSacramento County, 2009: $180,543, Down 16.7% YTY
SOURCE: CALIFORNIA ASSOCIATION OF REALTORS®
$-
$50,000
$100,000
$150,000
$200,000
$250,000
$300,000
$350,000
$400,000
19
89
19
90
19
91
19
92
19
93
19
94
19
95
19
96
19
97
19
98
19
99
20
00
20
01
20
02
20
03
20
04
20
05
20
06
20
07
20
08
20
09

Median Price of Existing Detached Homes
$0
$50,000
$100,000
$150,000
$200,000
$250,000
$300,000
$350,000
$400,000
$450,000J
an
-89
Ju
l-8
9J
an
-90
Ju
l-9
0J
an
-91
Ju
l-9
1J
an
-92
Ju
l-9
2J
an
-93
Ju
l-9
3J
an
-94
Ju
l-9
4J
an
-95
Ju
l-9
5J
an
-96
Ju
l-9
6J
an
-97
Ju
l-9
7J
an
-98
Ju
l-9
8J
an
-99
Ju
l-9
9J
an
-00
Ju
l-0
0J
an
-01
Ju
l-0
1J
an
-02
Ju
l-0
2J
an
-03
Ju
l-0
3J
an
-04
Ju
l-0
4J
an
-05
Ju
l-0
5J
an
-06
Ju
l-0
6J
an
-07
Ju
l-0
7J
an
-08
Ju
l-0
8J
an
-09
Ju
l-0
9J
an
-10
Ju
l-1
0
Sacramento County, Sept. 2010: $181,780, Down 1.3% YTY
SOURCE: CALIFORNIA ASSOCIATION OF REALTORS®

Annual Median PricePlacer County, 2009: $296,478, Down 15.1% YTY
SOURCE: CALIFORNIA ASSOCIATION OF REALTORS®
$-
$100,000
$200,000
$300,000
$400,000
$500,000
$600,000
19
89
19
91
19
93
19
95
19
97
19
99
20
01
20
03
20
05
20
07
20
09

Median Price of Existing Detached HomesPlacer County, Sept. 2010: $281,820, Down 4.8% YTY
$100,000
$150,000
$200,000
$250,000
$300,000
$350,000
$400,000
$450,000
$500,000
$550,000
Ja
n-8
9J
ul-
89
Ja
n-9
0J
ul-
90
Ja
n-9
1J
ul-
91
Ja
n-9
2J
ul-
92
Ja
n-9
3J
ul-
93
Ja
n-9
4J
ul-
94
Ja
n-9
5J
ul-
95
Ja
n-9
6J
ul-
96
Ja
n-9
7J
ul-
97
Ja
n-9
8J
ul-
98
Ja
n-9
9J
ul-
99
Ja
n-0
0J
ul-
00
Ja
n-0
1J
ul-
01
Ja
n-0
2J
ul-
02
Ja
n-0
3J
ul-
03
Ja
n-0
4J
ul-
04
Ja
n-0
5J
ul-
05
Ja
n-0
6J
ul-
06
Ja
n-0
7J
ul-
07
Ja
n-0
8J
ul-
08
Ja
n-0
9J
ul-
09
Ja
n-1
0J
ul-
10
SOURCE: CALIFORNIA ASSOCIATION OF REALTORS®

Unsold Inventory IndexSacramento County, August 2010: 3.4 Months
MONTHS
0.0
2.0
4.0
6.0
8.0
10.0
12.0
14.0
16.0
18.0
Ja
n-9
3
Ju
l-9
3
Ja
n-9
4
Ju
l-9
4
Ja
n-9
5
Ju
l-9
5
Ja
n-9
6
Ju
l-9
6
Ja
n-9
7
Ju
l-9
7
Ja
n-9
8
Ju
l-9
8
Ja
n-9
9
Ju
l-9
9
Ja
n-0
0
Ju
l-0
0
Ja
n-0
1J
ul-
01
Ja
n-0
2
Ju
l-0
2
Ja
n-0
3
Ju
l-0
3
Ja
n-0
4
Ju
l-0
4
Ja
n-0
5
Ju
l-0
5
Ja
n-0
6
Ju
l-0
6
Ja
n-0
7
Ju
l-0
7
Ja
n-0
8
Ju
l-0
8
Ja
n-0
9
Ju
l-0
9
Ja
n-1
0
Ju
l-1
0
SOURCE: CALIFORNIA ASSOCIATION OF REALTORS®

Market Cycle – Sacramento County
Sales MonthMonthly
Sales
Percentage
Change
Peak Aug-04 2,328
Trough Sep-07 706 -69.7%
Current Sep-10 1,430 102.5%
SOURCE: California Association of REALTORS®

Market Cycle – Sacramento County
Median Price MonthMonthly
Price
Percentage
Change
Peak Aug-05 $394,450
Trough Apr-09 $167,340 -57.6%
Current Sep-10 $181,780 8.6%
SOURCE: California Association of REALTORS®

Market Cycle – Placer County
Sales MonthMonthly
Sales
Percentage
Change
Peak Aug-04 557
Trough Jan-08 200 -64.1%
Current Sep-10 429 114.5%
SOURCE: California Association of REALTORS®

Market Cycle – Placer County
Median Price MonthMonthly
Price
Percentage
Change
Peak Aug-05 $528,000
Trough Dec-09 $277,140 -47.5%
Current Sep-10 $281,820 1.7%
SOURCE: California Association of REALTORS®

First-time Buyer Housing Affordability IndexSacramento County, 2nd Quarter 2010: 80%
SOURCE: CALIFORNIA ASSOCIATION OF REALTORS®
0%
10%
20%
30%
40%
50%
60%
70%
80%
90%
100%Q
1/0
3Q
2/0
3Q
3/0
3Q
4/0
3Q
1/0
4Q
2/0
4Q
3/0
4Q
4/0
4Q
1/0
5Q
2/0
5Q
3/0
5Q
4/0
5Q
1/0
6Q
2/0
6Q
3/0
6Q
4/0
6Q
1/0
7Q
2/0
7Q
3/0
7Q
4/0
7Q
1/0
8Q
2/0
8Q
3/0
8Q
4/0
8Q
1/0
9Q
2/0
9Q
3/0
9Q
4/0
9Q
1/1
0Q
2/1
0
% OF HOUSEHOLDS THAT CAN BUY

Sources of Population GrowthSacramento County (1981-2008)
THOUSANDS
-10
-5
0
5
10
15
20
25
30
35
40
1981
1982
1983
1984
1985
1986
1987
1988
1989
1990
1991
1992
1993
1994
1995
1996
1997
1998
1999
2000
2001
2002
2003
2004
2005
2006
2007
2008
2009
Natural Increase
Net Migration
SOURCE: CA Department of Finance

Sources of Population GrowthPlacer County (1981-2009)
THOUSANDS
0
2
4
6
8
10
12
14
1981
1982
1983
1984
1985
1986
1987
1988
1989
1990
1991
1992
1993
1994
1995
1996
1997
1998
1999
2000
2001
2002
2003
2004
2005
2006
2007
2008
2009
Natural Increase
Net Migration
SOURCE: CA Department of Finance

Where are new Sacramento County
households coming from?
• Placer (3,207)
• Yolo (2,017)
• San Joaquin (1,387)
• El Dorado (1,291)
• Solano (1,110)
• Los Angeles (1,044)
• Total incoming for 2008: 27,700
• Total outgoing for 2008: 28,228
Source: NAR Relocation Report 2008 – IRS Data; Item 187-06067

Where are new Placer County
households coming from?
• Sacramento (4,437)
• Nevada (426)
• Santa Clara (366)
• El Dorado (318)
• Los Angeles (293)
• Total incoming for 2008: 11,269
• Total outgoing for 2008: 9,051
Source: NAR Relocation Report 2008 – IRS Data; Item 187-06061

Housing Market
Forecast

California Housing Market Outlook
2003 2004 2005 2006 2007 2008 2009 2010f 2011f
SFH Resales
(000s)601.8 624.7 625.0 477.5 346.9 439.8 546.5 492.0 502.0
% Change 5.1% 3.8% 0.03% -23.6% -27.3% 26.8% 24.3% -10.0% 2.0%
Median
Price
($000s)
$371.5 $450.8 $522.7 $556.4 $560.3 $346.4 $275.0 $306.5 $312.5
% Change 17.5% 21.3% 16.0% 6.5% 0.7% -38.2% -20.6% 11.5% 2.0%
30-Yr FRM 5.8% 5.8% 5.9% 6.4% 6.3% 6.0% 5.1% 4.7% 5.1%
1-Yr ARM 3.8% 3.9% 4.5% 5.5% 5.6% 5.2% 4.7% 3.9% 4.1%
Source: CALIFORNIA ASSOCIATION OF REALTORS®
Forecast Date: October 1, 2010The End - - Thank You

Appendix
Rental Market Sacramento
MSA
Distressed Property-Sac,
Placer
Permits – Sac, Placer

Vacancy Rates for Class A&B ApartmentsSacramento MSA, 2010 Q2: 6.9%
SOURCE: CALIFORNIA ASSOCIATION OF REALTORS®; REALFACTS
0%
1%
2%
3%
4%
5%
6%
7%
8%
9%
19
90
19
92
19
94
Q4
/95
Q4
/96
Q3
/97
Q1
/98
Q3
/98
Q1
/99
Q3
/99
Q1
/00
Q3
/00
Q1
/01
Q3
/01
Q1
/02
Q3
/02
Q1
/03
Q3
/03
Q1
/04
Q3
/04
Q1
/05
Q3
/05
Q1
/06
Q3
/06
Q1
/07
Q3
/07
Q1
/08
Q3
/08
Q1
/09
Q3
/09
Q1
/10
VACANCY RATE

Asking Rents for Class A&B ApartmentsSacramento MSA, 2010 Q2: $928, Down 2.2% YTY
$0
$200
$400
$600
$800
$1,000
Q3
/97
Q2
/98
Q1
/99
Q4
/99
Q3
/00
Q2
/01
Q1
/02
Q4
/02
Q3
/03
Q2
/04
Q1
/05
Q4
/05
Q3
/06
Q2
/07
Q1
/08
Q4
/08
Q3
/09
Q2
/10
SOURCE: CALIFORNIA ASSOCIATION OF REALTORS®;
REALFACTS

Foreclosure Filings – Sacramento County
SOURCE: ForeclosureRadar.com

Foreclosure Filings – Placer County
SOURCE: ForeclosureRadar.com

Foreclosure Outcomes – Sacramento
County
SOURCE: ForeclosureRadar.com

Foreclosure Outcomes – Placer County
SOURCE: ForeclosureRadar.com

Foreclosure Inventories-Sacramento County
SOURCE: ForeclosureRadar.com

Placer County – Foreclosure Inventories
SOURCE: ForeclosureRadar.com

New Housing PermitsSacramento County, August 2010: 65 Units, Up 28.0% YTD
0
500
1000
1500
2000
2500
Ja
n-8
8J
ul-
88
Ja
n-8
9J
ul-
89
Ja
n-9
0J
ul-
90
Ja
n-9
1J
ul-
91
Ja
n-9
2J
ul-
92
Ja
n-9
3J
ul-
93
Ja
n-9
4J
ul-
94
Ja
n-9
5J
ul-
95
Ja
n-9
6J
ul-
96
Ja
n-9
7J
ul-
97
Ja
n-9
8J
ul-
98
Ja
n-9
9J
ul-
99
Ja
n-0
0J
ul-
00
Ja
n-0
1J
ul-
01
Ja
n-0
2J
ul-
02
Ja
n-0
3J
ul-
03
Ja
n-0
4J
ul-
04
Ja
n-0
5J
ul-
05
Ja
n-0
6J
ul-
06
Ja
n-0
7J
ul-
07
Ja
n-0
8J
ul-
08
Ja
n-0
9J
ul-
09
Ja
n-1
0J
ul-
10
Single Family Multi-Family
SOURCE: Construction Industry Research Board

New Housing PermitsPlacer County, August 2010: 84 Units, Down 19.6% YTD
0
200
400
600
800
1000
1200
Ja
n-8
8J
ul-
88
Ja
n-8
9J
ul-
89
Ja
n-9
0J
ul-
90
Ja
n-9
1J
ul-
91
Ja
n-9
2J
ul-
92
Ja
n-9
3J
ul-
93
Ja
n-9
4J
ul-
94
Ja
n-9
5J
ul-
95
Ja
n-9
6J
ul-
96
Ja
n-9
7J
ul-
97
Ja
n-9
8J
ul-
98
Ja
n-9
9J
ul-
99
Ja
n-0
0J
ul-
00
Ja
n-0
1J
ul-
01
Ja
n-0
2J
ul-
02
Ja
n-0
3J
ul-
03
Ja
n-0
4J
ul-
04
Ja
n-0
5J
ul-
05
Ja
n-0
6J
ul-
06
Ja
n-0
7J
ul-
07
Ja
n-0
8J
ul-
08
Ja
n-0
9J
ul-
09
Ja
n-1
0J
ul-
10
Single Family Multi-Family
SOURCE: Construction Industry Research Board