klibs n.a. galvão and jose e. p. santos college of · pdf fileepidemiology of pregnancy...
TRANSCRIPT
Epidemiology of Pregnancy
Losses and Practical Strategies
for Prevention
Klibs N.A. Galvão and Jose E. P. Santos
College of Veterinary Medicine
University of Florida
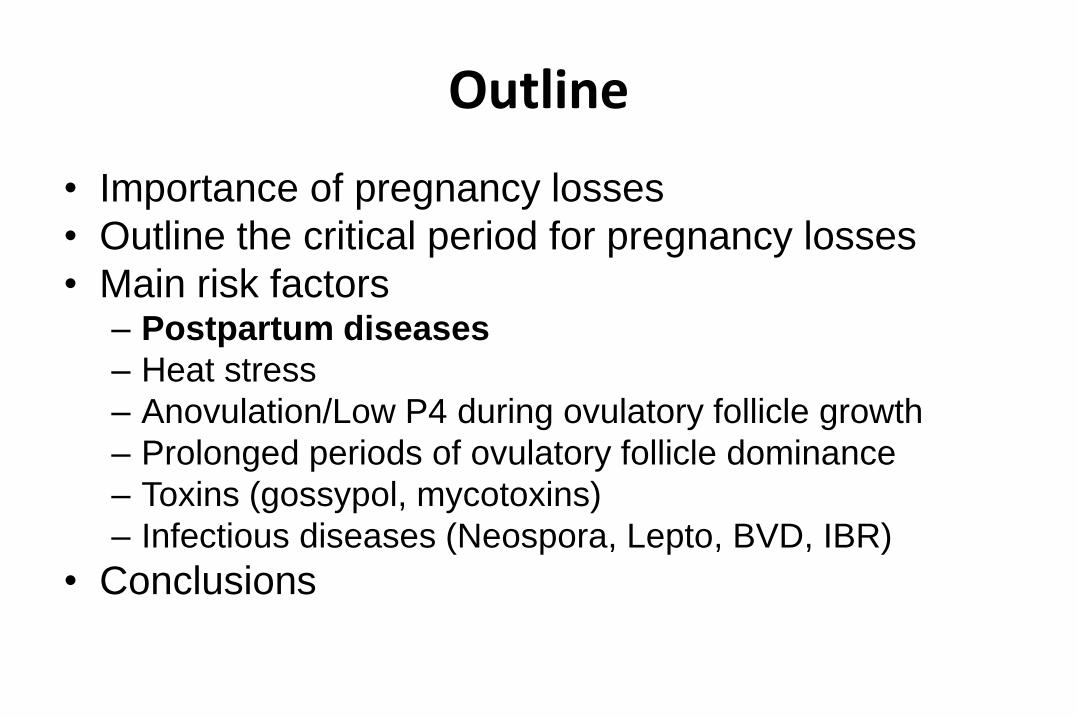
Outline
• Importance of pregnancy losses
• Outline the critical period for pregnancy losses
• Main risk factors – Postpartum diseases
– Heat stress
– Anovulation/Low P4 during ovulatory follicle growth
– Prolonged periods of ovulatory follicle dominance
– Toxins (gossypol, mycotoxins)
– Infectious diseases (Neospora, Lepto, BVD, IBR)
• Conclusions
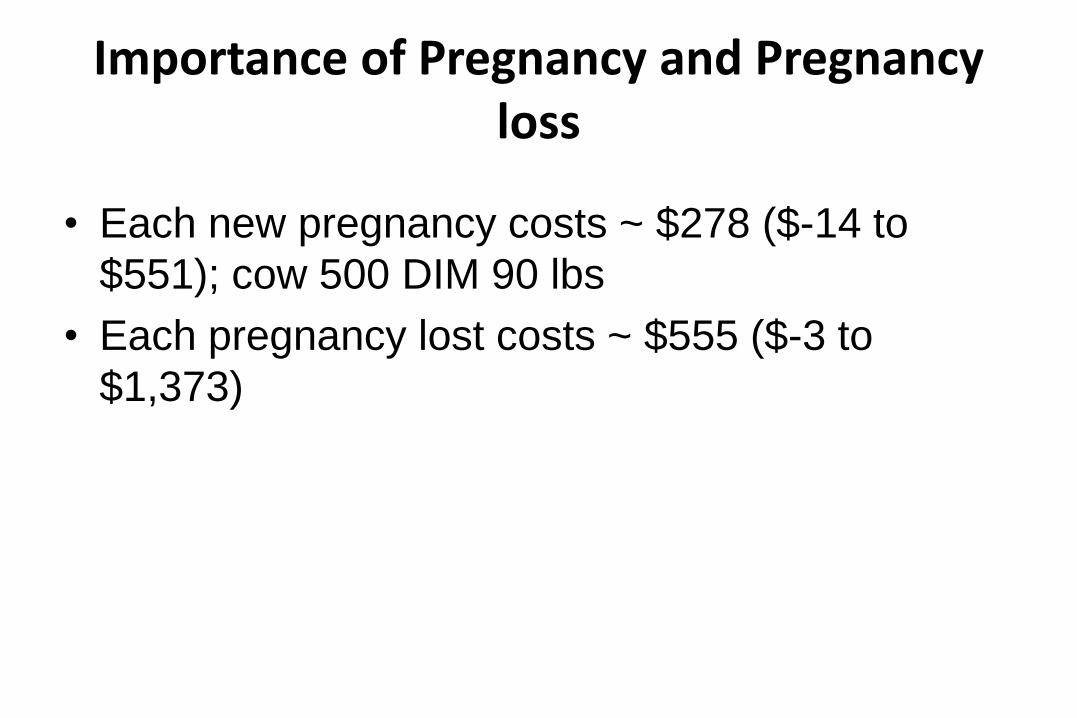
Importance of Pregnancy and Pregnancy loss
• Each new pregnancy costs ~ $278 ($-14 to
$551); cow 500 DIM 90 lbs
• Each pregnancy lost costs ~ $555 ($-3 to
$1,373)

Reproductive Failure
AI d5-7 d17-24 d 38-42 d 260
Fertilization
Failure
Early Embryonic
Loss
Late Embryonic
Loss Fetal
Loss
Adapted from Santos et al., 2004; ARS
• Fertilization failure
• Pregnancy loss

Fertilization and Viable Embryos
Santos et al., 2004; ARS
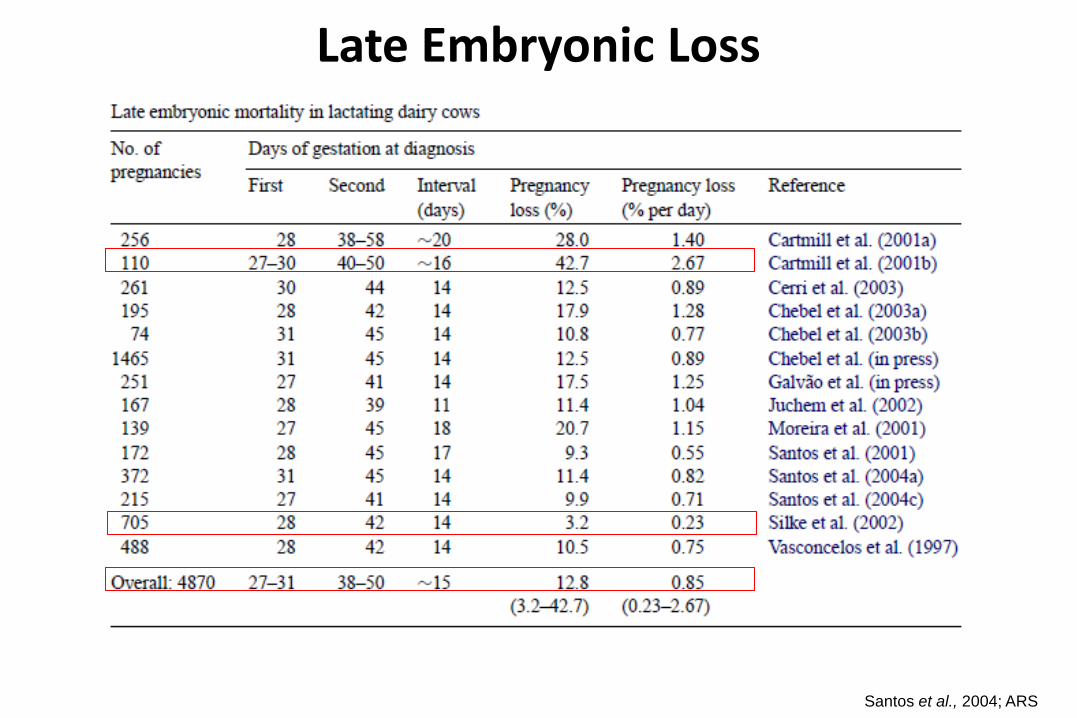
Late Embryonic Loss
Santos et al., 2004; ARS
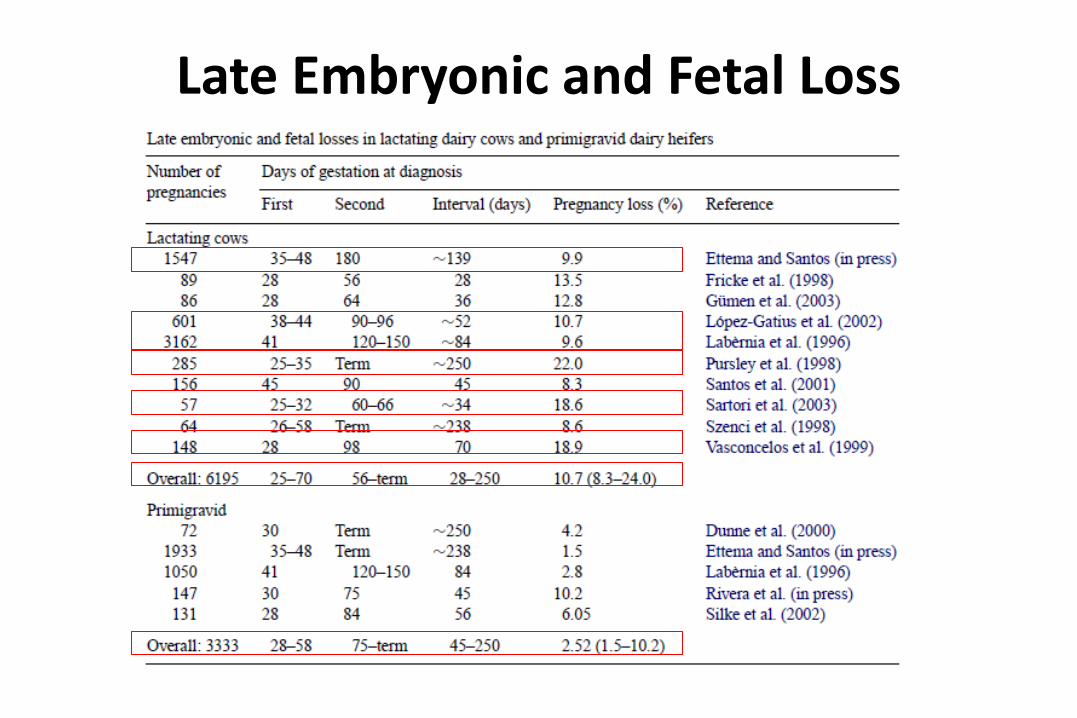
Late Embryonic and Fetal Loss

Fertilization ~ 76%
Viable embryos ~50%
CR ~30%
2 d
34%; 7%/d
CR ~40%
CR ~35%
CR ~32%
CR ~28%
6 d
28 d
90 d
42 d
180 d
Term
Day
0 d Oocytes 100%
20%; 0.9%/d
13%; 0.9%/d
9%; 0.2%/d
6%; 0.07%/d
7%; 0.07%/d 63%
61%
58%
54%
47%
34%
Per Period Cumulative
Pregnancy Loss
Adapted from Santos et al., 2004; ARS

Summary • Lactating dairy cows
– Fertilization rate = ~ 76% (55% heat stress, ~ 80% cool weather)
– Viable embryos = ~50% of oocytes (18% heat stress, ~60% cool weather)
– Late embryonic loss = ~13% (43% heat stress)
– Fetal losses = ~ 10%
– Greatest risk in the first 42 d of gestation (0.9%/d) With early pregnancy diagnosis (~30 d), confirmation is critical
• Heifers – Fertilization rate ≥ 90%
– Late embryonic and fetal mortality < 5.0%

Incidence in the first 60 days postpartum, %
0 10 20 30 40 50 60
Digestive
Pneumonia
Lameness
Ketosis
Mastitis
Fever
C. endometritis
Metrits
Calving problem
Healthy
Incidence of infectious diseases in the first 60 d postpartum
• 5,719 cows from 7 dairies in the US
(Santos et al., 2010. Soc Reprod Fertil Suppl.)

Health status CR, % Adjusted OR (95% CI) P
Healthy 51.4 1.00
1 case of disease 43.3 0.79 (0.69 – 0.91) 0.001
> 1 case of disease 34.7 0.57 (0.48 – 0.69) < 0.001
Type of health problem
Calving problem 40.3 0.75 (0.63 – 0.88) < 0.001
Metritis 37.8 0.66 (0.56 – 0.78) < 0.001
Clinical endometritis 38.7 0.62 (0.52 – 0.74) < 0.001
Fever postpartum 39.8 0.60 (0.48 – 0.65) < 0.001
Mastitis 39.4 0.84 (0.64 – 1.10) 0.20
Clinical ketosis 28.8 0.50 (0.36 – 0.68) < 0.001
Lameness 33.3 0.57 (0.41 – 0.78) < 0.001
Pneumonia 32.4 0.63 (0.32 – 1.27) 0.20
Digestive problem 36.7 0.78 (0.46 – 1.34) 0.38
Disease and Pregnancy 35d
(Santos et al., 2010. Soc Reprod Fertil Suppl.)
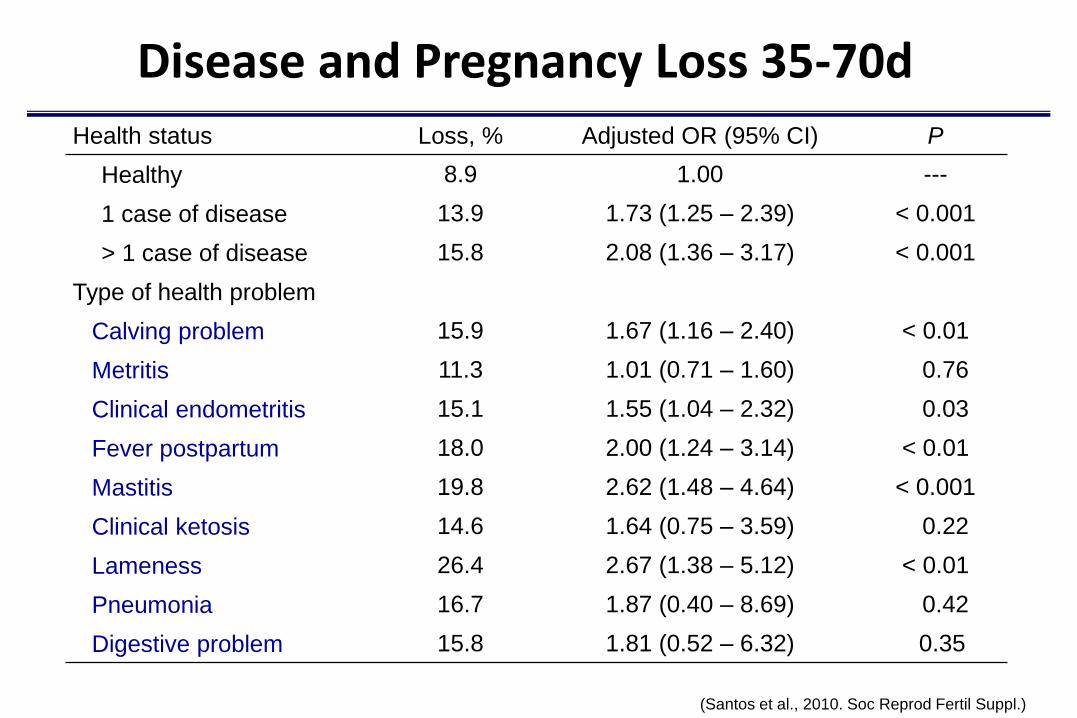
Health status Loss, % Adjusted OR (95% CI) P
Healthy 8.9 1.00 ---
1 case of disease 13.9 1.73 (1.25 – 2.39) < 0.001
> 1 case of disease 15.8 2.08 (1.36 – 3.17) < 0.001
Type of health problem
Calving problem 15.9 1.67 (1.16 – 2.40) < 0.01
Metritis 11.3 1.01 (0.71 – 1.60) 0.76
Clinical endometritis 15.1 1.55 (1.04 – 2.32) 0.03
Fever postpartum 18.0 2.00 (1.24 – 3.14) < 0.01
Mastitis 19.8 2.62 (1.48 – 4.64) < 0.001
Clinical ketosis 14.6 1.64 (0.75 – 3.59) 0.22
Lameness 26.4 2.67 (1.38 – 5.12) < 0.01
Pneumonia 16.7 1.87 (0.40 – 8.69) 0.42
Digestive problem 15.8 1.81 (0.52 – 6.32) 0.35
Disease and Pregnancy Loss 35-70d
(Santos et al., 2010. Soc Reprod Fertil Suppl.)
4.3
2.5
3.2
15.5
35.4
20.0
14.7
5.7
8.2
0 5 10 15 20 25 30 35 40
Digestive problem
Pneumonia
Lameness
Mastitis
Ketosis
Lipidose
Clinical endometritis
Metritis
Calving problem
Incidence until First Insemination (%)N = 957 cows
NEFA > 0.7 mEq/L
Subclinical ketosis
Ribeiro et al., 2013; JDS
Incidence of infectious diseases in the first 60 d postpartum
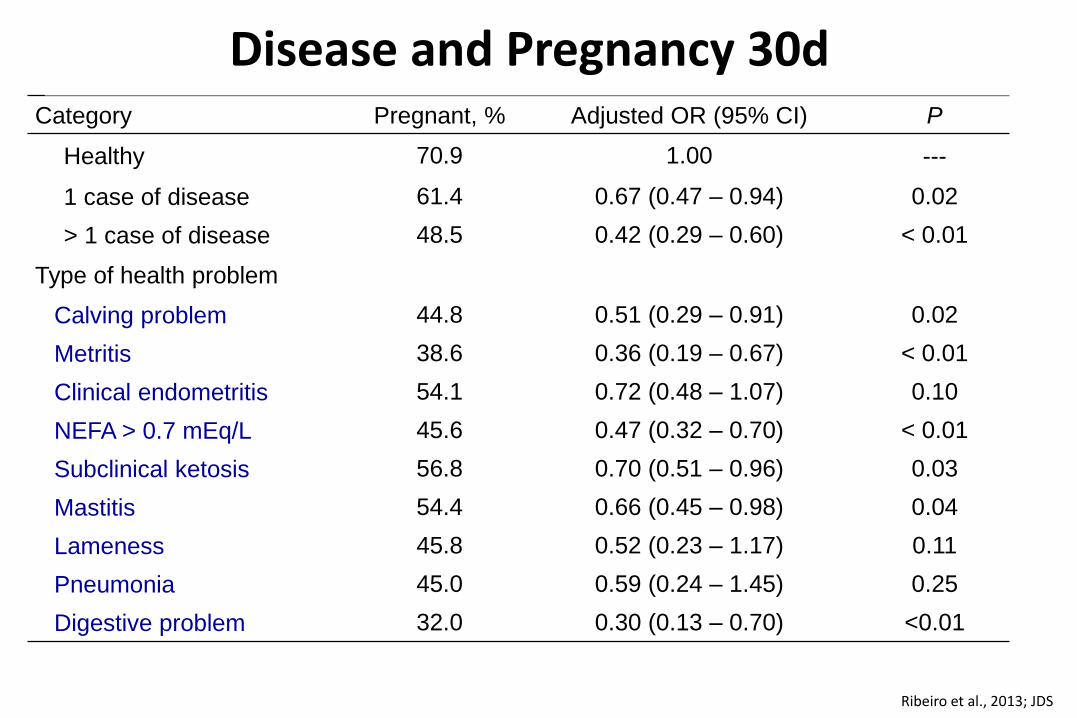
Category Pregnant, % Adjusted OR (95% CI) P
Healthy 70.9 1.00 ---
1 case of disease 61.4 0.67 (0.47 – 0.94) 0.02
> 1 case of disease 48.5 0.42 (0.29 – 0.60) < 0.01
Type of health problem
Calving problem 44.8 0.51 (0.29 – 0.91) 0.02
Metritis 38.6 0.36 (0.19 – 0.67) < 0.01
Clinical endometritis 54.1 0.72 (0.48 – 1.07) 0.10
NEFA > 0.7 mEq/L 45.6 0.47 (0.32 – 0.70) < 0.01
Subclinical ketosis 56.8 0.70 (0.51 – 0.96) 0.03
Mastitis 54.4 0.66 (0.45 – 0.98) 0.04
Lameness 45.8 0.52 (0.23 – 1.17) 0.11
Pneumonia 45.0 0.59 (0.24 – 1.45) 0.25
Digestive problem 32.0 0.30 (0.13 – 0.70) <0.01
Disease and Pregnancy 30d
Ribeiro et al., 2013; JDS
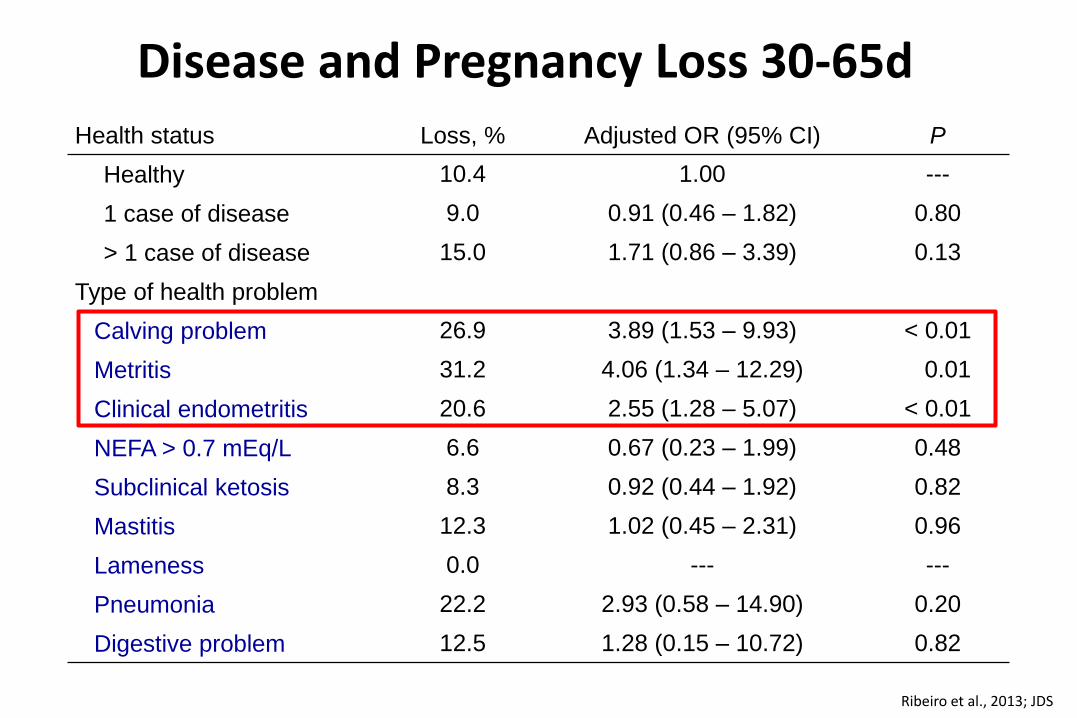
Health status Loss, % Adjusted OR (95% CI) P
Healthy 10.4 1.00 ---
1 case of disease 9.0 0.91 (0.46 – 1.82) 0.80
> 1 case of disease 15.0 1.71 (0.86 – 3.39) 0.13
Type of health problem
Calving problem 26.9 3.89 (1.53 – 9.93) < 0.01
Metritis 31.2 4.06 (1.34 – 12.29) 0.01
Clinical endometritis 20.6 2.55 (1.28 – 5.07) < 0.01
NEFA > 0.7 mEq/L 6.6 0.67 (0.23 – 1.99) 0.48
Subclinical ketosis 8.3 0.92 (0.44 – 1.92) 0.82
Mastitis 12.3 1.02 (0.45 – 2.31) 0.96
Lameness 0.0 --- ---
Pneumonia 22.2 2.93 (0.58 – 14.90) 0.20
Digestive problem 12.5 1.28 (0.15 – 10.72) 0.82
Disease and Pregnancy Loss 30-65d
Ribeiro et al., 2013; JDS

Endometritis and Pregnancy Loss
0
5
10
15
20
25
30
35P
reg
nan
cy l
oss 3
2-6
0d
, %
Healthy
CE
CE+SCE
Lima et al., 2013; JDS
a, A
b, B
B
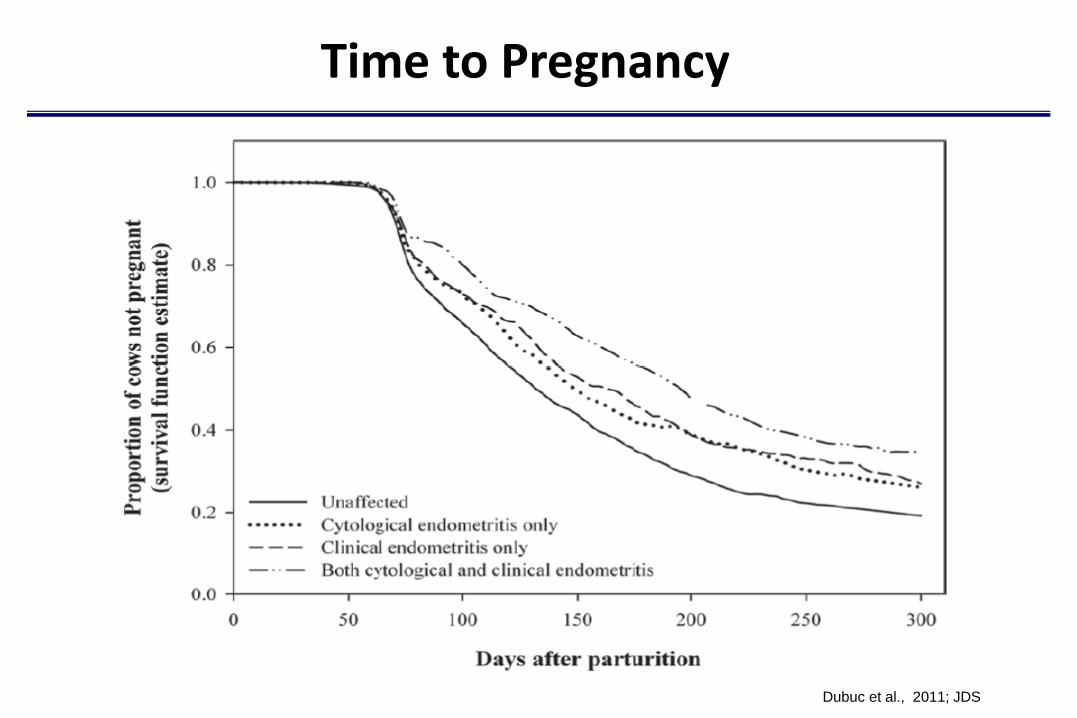
Dubuc et al., 2011; JDS
Time to Pregnancy
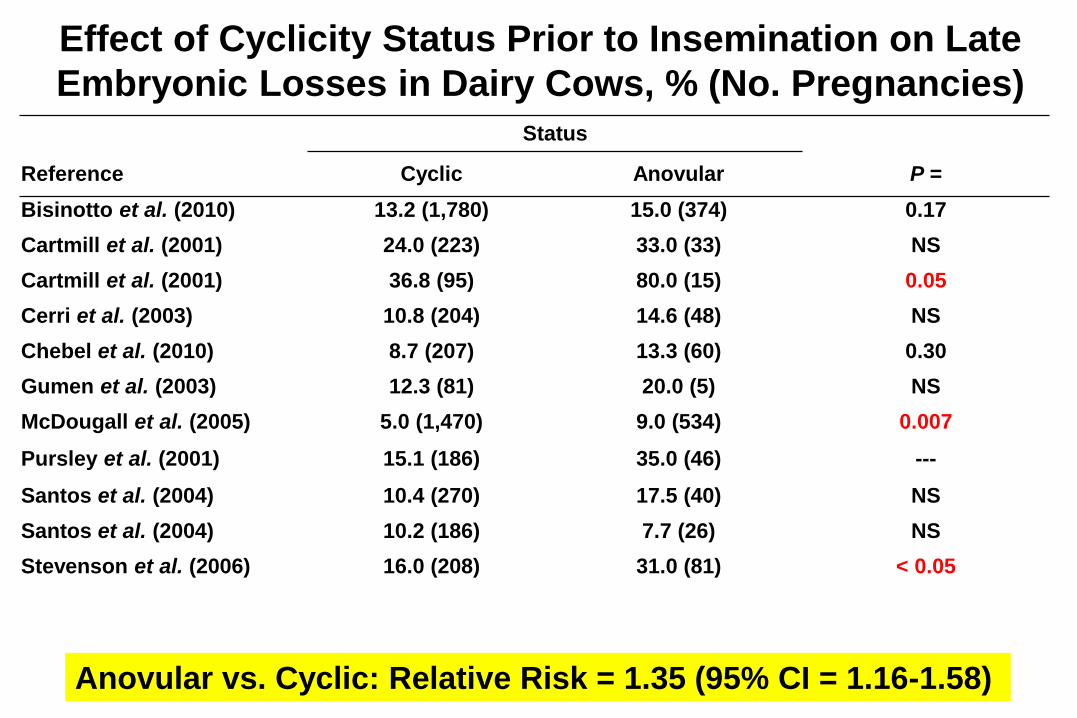
Effect of Cyclicity Status Prior to Insemination on Late
Embryonic Losses in Dairy Cows, % (No. Pregnancies)
Status
Reference Cyclic Anovular P =
Bisinotto et al. (2010) 13.2 (1,780) 15.0 (374) 0.17
Cartmill et al. (2001) 24.0 (223) 33.0 (33) NS
Cartmill et al. (2001) 36.8 (95) 80.0 (15) 0.05
Cerri et al. (2003) 10.8 (204) 14.6 (48) NS
Chebel et al. (2010) 8.7 (207) 13.3 (60) 0.30
Gumen et al. (2003) 12.3 (81) 20.0 (5) NS
McDougall et al. (2005) 5.0 (1,470) 9.0 (534) 0.007
Pursley et al. (2001) 15.1 (186) 35.0 (46) ---
Santos et al. (2004) 10.4 (270) 17.5 (40) NS
Santos et al. (2004) 10.2 (186) 7.7 (26) NS
Stevenson et al. (2006) 16.0 (208) 31.0 (81) < 0.05
Overall 11.3 (4,910) 15.3 (1,262) < 0.001
Anovular vs. Cyclic: Relative Risk = 1.35 (95% CI = 1.16-1.58)

Proportion of Cows Classified as Cyclic (o) and Anestrus (▲)
Remaining Pregnant
Pro
po
rtio
n r
emai
nin
g p
regn
ant
McDougall et al. N. Zeal. Vet. J. (2005)
N = 2,004 cows 10 dairy herds
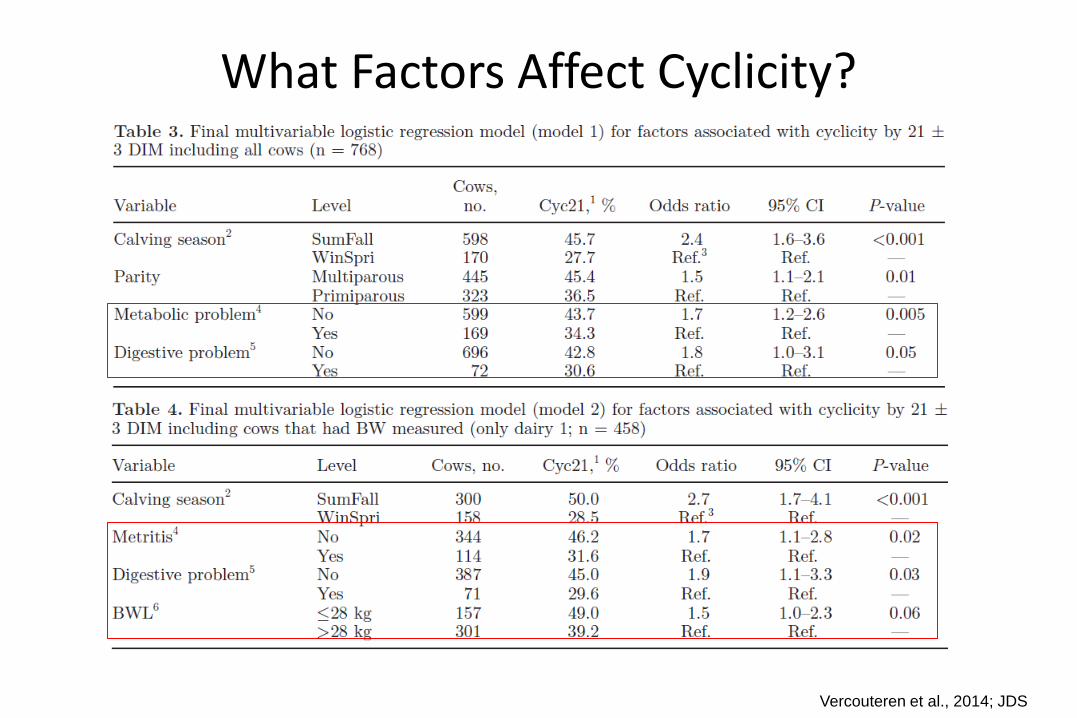
What Factors Affect Cyclicity?
Vercouteren et al., 2014; JDS

Combined effect of Anovulation and CTE
Vieira-Neto et al., 2014; JDS

Summary
• There is no good disease!!!
23

24
What leads to disease?
• Disease is multifactorial
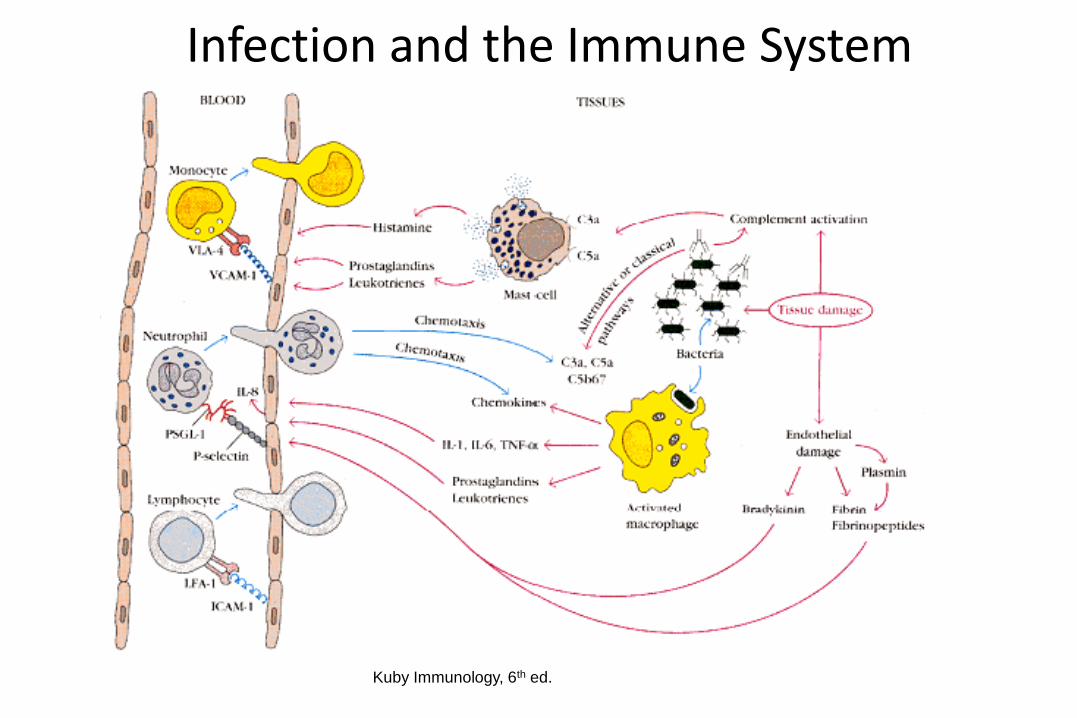
Infection and the Immune System
Kuby Immunology, 6th ed.

Vazquez-Añon et al., 1994; JDS
Metabolic State Peripartum

NEB in Early Lactation
Courtesy of Dr. WR Butler
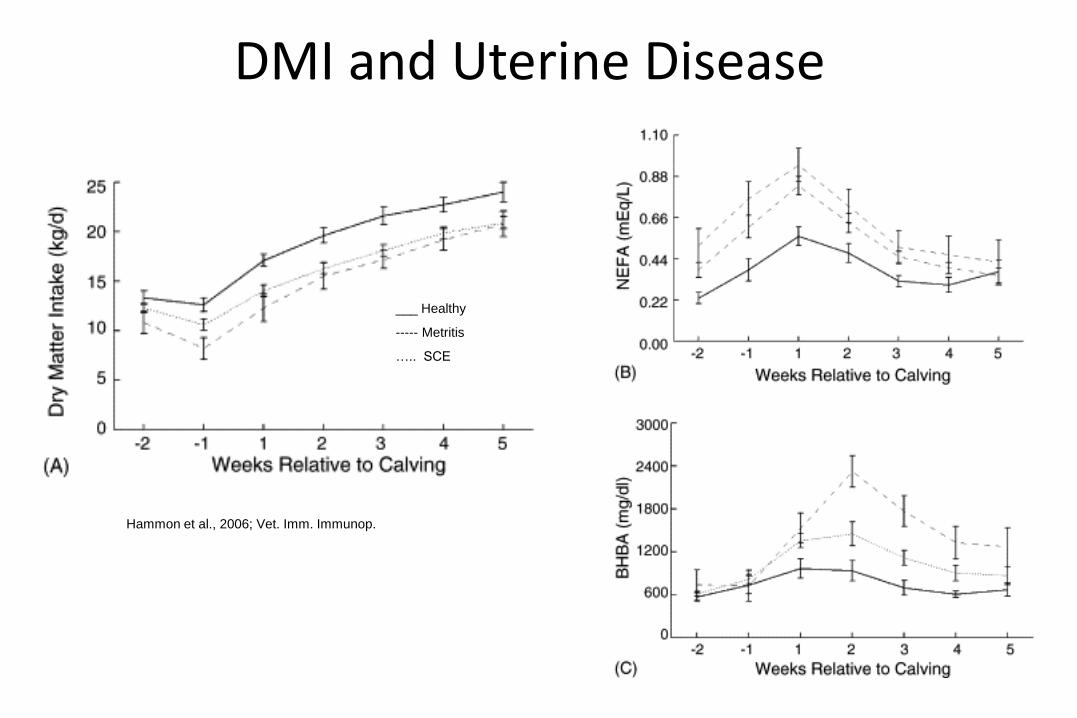
Hammon et al., 2006; Vet. Imm. Immunop.
DMI and Uterine Disease
___ Healthy
----- Metritis
….. SCE

Hammon et al., 2006; Vet. Imm. Immunopath.
NEFA and Immune Function
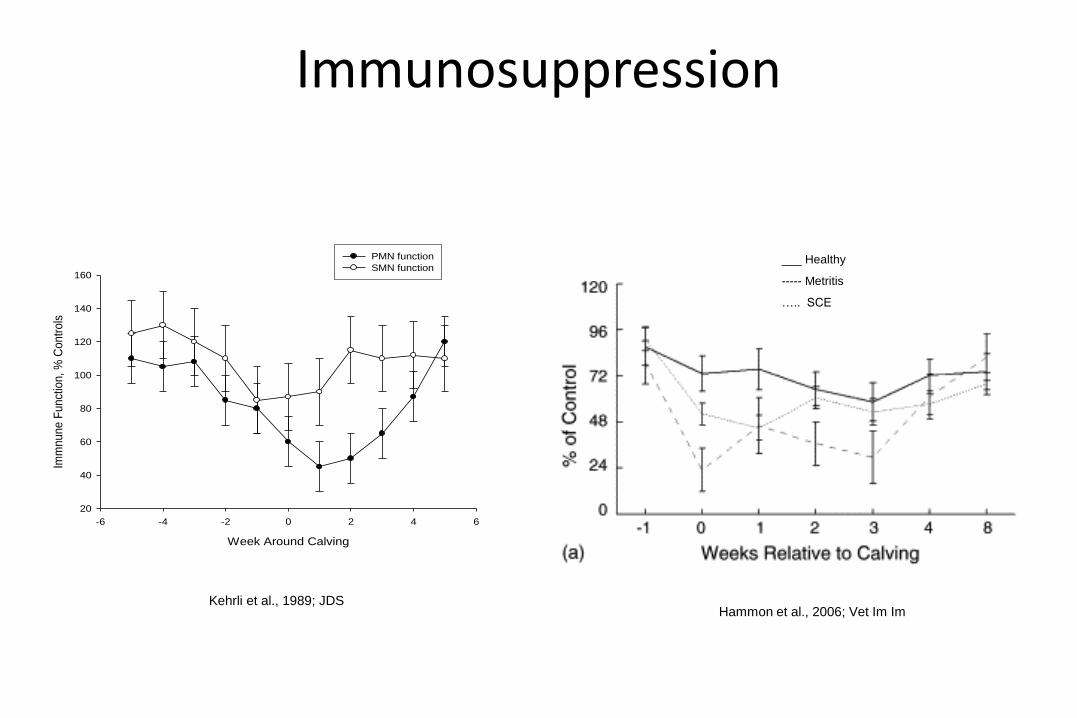
Immunosuppression
Kehrli et al., 1989; JDS
Week Around Calving
-6 -4 -2 0 2 4 6
Imm
nune F
unct
ion,
% C
ontr
ols
20
40
60
80
100
120
140
160
PMN function
SMN function
Hammon et al., 2006; Vet Im Im
___ Healthy
----- Metritis
….. SCE

NEFA & BHBA & Immune Function
Ster et al., 2012; JDS

BHBA and Immune Function
Grinberg et al., 2008; Infec. Immun.
Papayannopoulos et al.
2010. J. Cell Biol.

DMI and Uterine Disease
Huzzey et al., 2007; JDS
• Each kg decrease in DMI the last
week prepartum increased the odds
of severe metritis by 187% (OR =
2.87; P = 0.02)
• Each 10 min decrease in feeding
time during the last week prepartum
increased the odds of severe
metritis by 72% (OR = 1.72; P =
0.02)
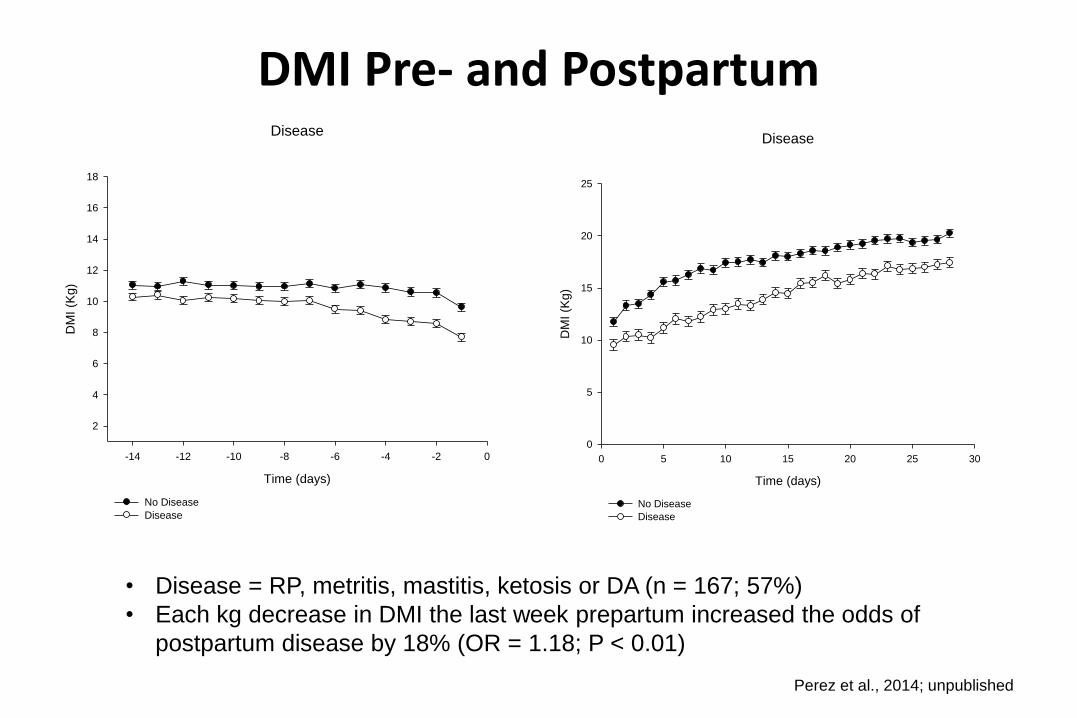
DMI Pre- and Postpartum
Perez et al., 2014; unpublished
• Disease = RP, metritis, mastitis, ketosis or DA (n = 167; 57%)
• Each kg decrease in DMI the last week prepartum increased the odds of
postpartum disease by 18% (OR = 1.18; P < 0.01)
Disease
Time (days)
-14 -12 -10 -8 -6 -4 -2 0
DM
I (K
g)
2
4
6
8
10
12
14
16
18
No Disease
Disease
Disease
Time (days)
0 5 10 15 20 25 30
DM
I (K
g)
0
5
10
15
20
25
No Disease
Disease

Calcium during transition
Kimura et al., 2006; JDS

Nunez and Demaurex, Journal of Leukocyte Biology, 2010
Calcium Activates Leukocytes
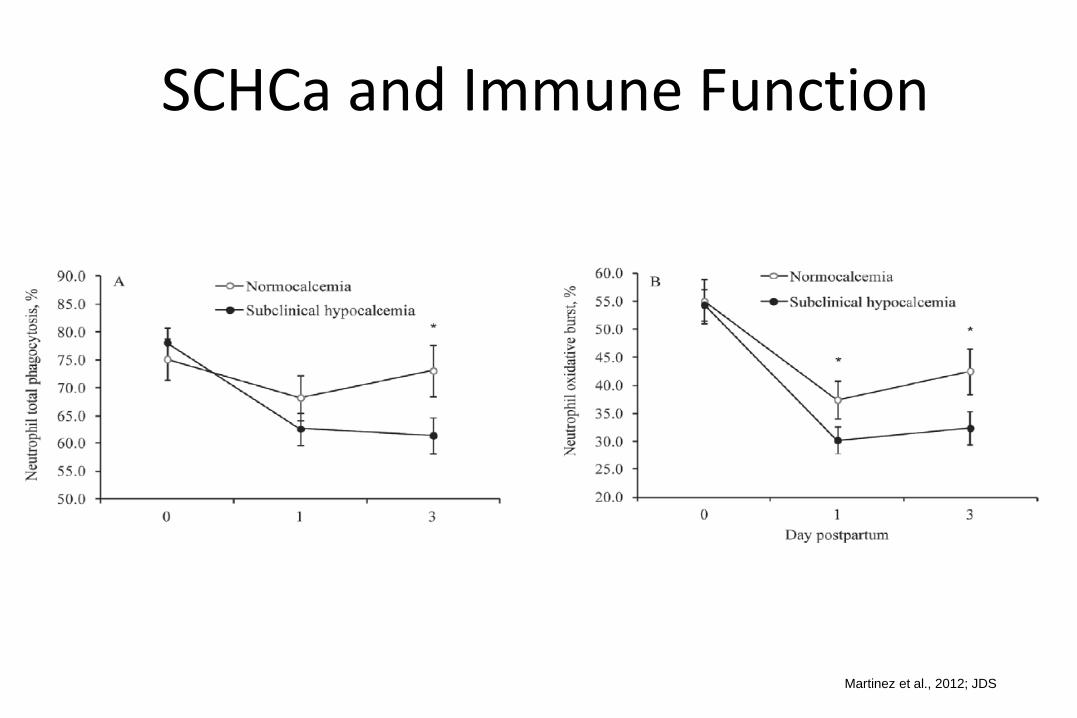
SCHCa and Immune Function
Martinez et al., 2012; JDS
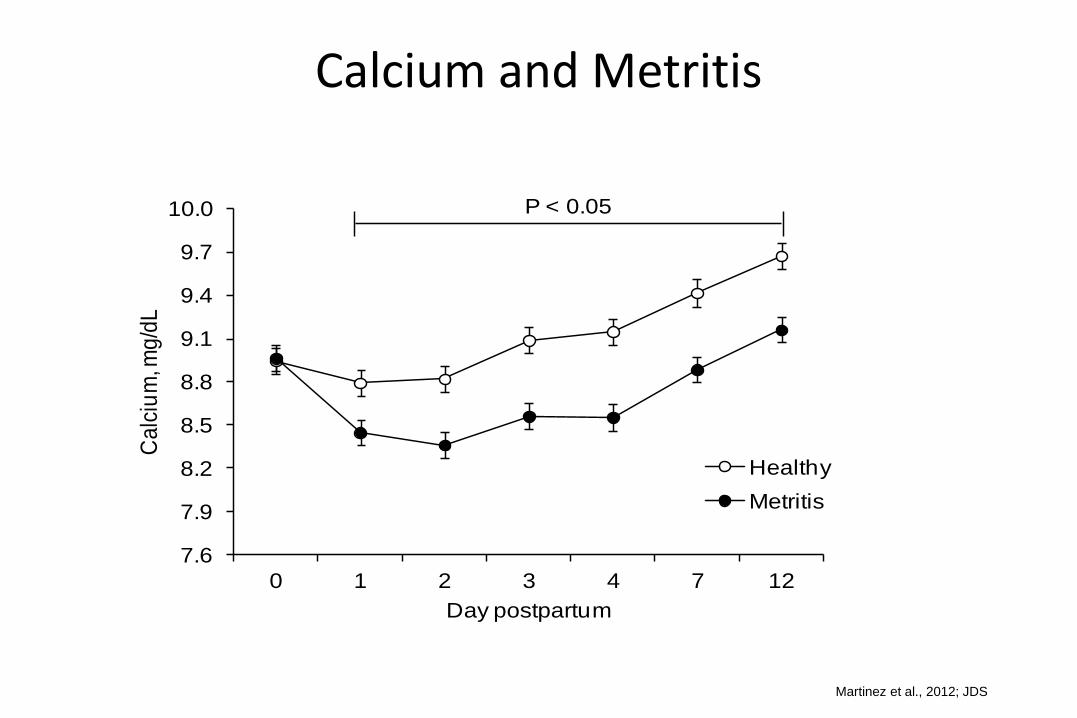
Calcium and Metritis
7.6
7.9
8.2
8.5
8.8
9.1
9.4
9.7
10.0
0 1 2 3 4 7 12
Ca
lciu
m, m
g/d
L
Day postpartum
Healthy
Metritis
P < 0.05
Martinez et al., 2012; JDS

Metritis and Immune Function
20.0
25.0
30.0
35.0
40.0
45.0
50.0
55.0
60.0
0 1 3
Oxi
da
tive
bu
rst,
% n
eu
tro
ph
ils
Day postpartum
Healthy
Metritis
*
*
Martinez et al., 2012; JDS
50.0
55.0
60.0
65.0
70.0
75.0
80.0
85.0
0 1 3
Ph
ag
ocy
tosi
s, %
ne
utr
op
hils
Day postpartum
Healthy
Metritis
*

Serum Ca,2 mg/dL > 8.59 ≤ 8.59 > 8.59 ≤ 8.59
Metritis,3,*,
% (n/n) 14.3 (4/28) 40.7 (11/27) 20.0 (2/10) 77.8 (35/45)
Puerperal metritis,4,*
% (n/n) 0.0 (0/28) 29.6 (8/27) 10.0 (1/10) 53.5 (24/45)
Low High
Risk group1
Incidence of Metritis according to Risk Group and Calcium Status
* Effect of subclinical hypocalcemia (P < 0.05).
¶ Effect of metritis risk (P < 0.05). 1 Risk group: Low= normal calving; High= cows diagnosed with dystocia, twin, stillbirth, or retained fetal membranes. 2 Serum Ca concentration in the first 3 d postpartum. 3 Cows with watery fetid vaginal discharge within the first 12 DIM regardless of rectal temperature. 4 Cows with watery fetid vaginal discharge within the first 12 DIM concurrent with rectal temperature ≥ 39.5 oC.
Martinez et al., 2012; JDS

1.51.00.50.0-0.5-1.0-1.5-2.0-2.5
0.6
0.5
0.4
0.3
0.2
0.1
0.0
Change in serum Ca in the first 3 d postpartum
Pro
babi
lity
of m
etrit
is, %
(mg/dL)
Effect of change in serum calcium: P < 0.05
AOR = 0.38 (95% CI = 0.16 to 0.90); 62% decrease in incidence for each 1 mg/dL increase in Ca
Drop in Ca
Increase in Ca
Probability of Metritis Relative to the Change in Serum Calcium
Martinez et al., 2012; JDS

Population Attributable Risk due to Subclinical Hypocalcemia
Puerperal Metritis
Incidence of puerp. metritis in
the study population Incidence of puerp. metritis
in normocalcemic cows
= 30.0 – 2.5
30.0 = 91.7% PAR =
Incidence of puerperal metritis in the study population
Metritis
Incidence of metritis in
the study population Incidence of metritis
in normocalcemic cows
= 47.3 – 15.8
47.3 = 66.6% PAR =
Incidence of metritis in the study population
Martinez et al., 2012; JDS

Road to disaster
• Characterized by:
– High stress/calving/heat
– Decrease in DMI
– Low glucose
– High fat mobilization
– Sub. ketosis (~40%)
– Sub. hypocalcemia (25-45%)
– Immunosuppression

Summary
• Immunosuppression peripartum is a major contributor to high incidence of disease.
• Strategies to maintain DMI and Ca status should help reduce the incidence of disease
– Focus on cow comfort and access to feedbunk pre- and postpartum
– Well managed acidogenic diets reduce the incidence of clinical hypocalcemia < 5% but SCH still a challenge.
45

Cow Comfort

Can we do anything else to help?
47

Flunixin Meglumine to Prevent Disease
FM treatment for 1-3 days post-calving:
• Increased risk of retained placenta 2.5X (Waelchli et al., 1999; Vet. Rec.; Duffield, et al., 2009; JDS Abstr.)
• Increased risk of metritis 1.5X (Duffield, et al., 2009; JDS Abstr.)
• Increased body temperature (Shwartz et al., 2009; JDS)
• Decreased DMI, milk yield and EB (Shwartz et al., 2009; JDS) in the first week
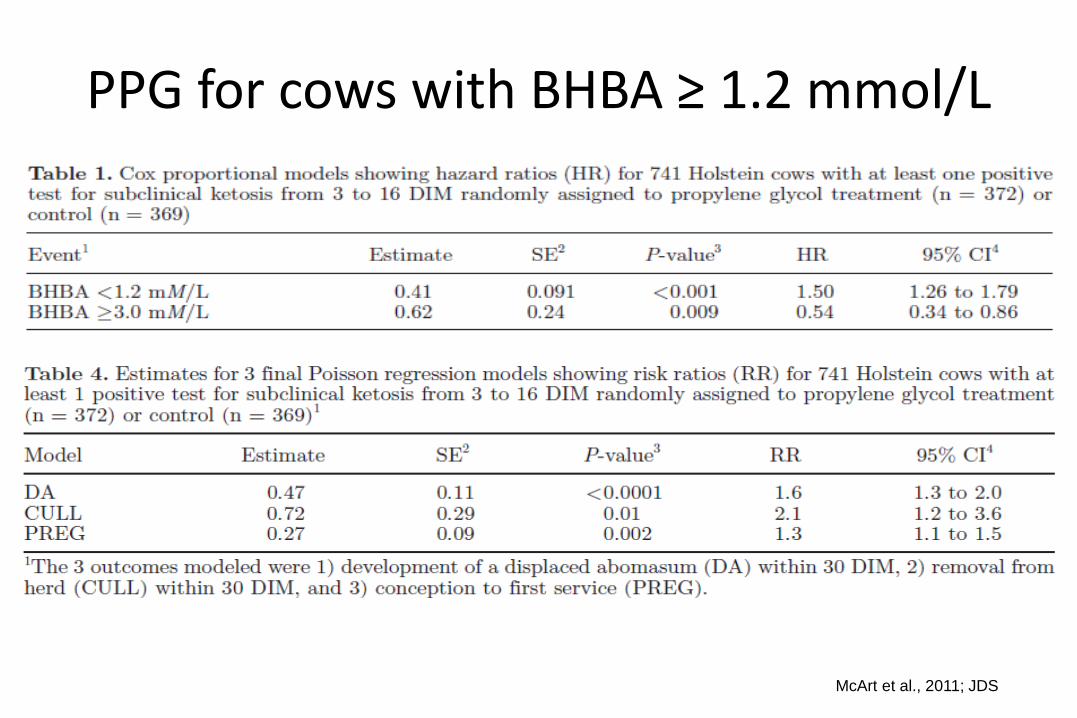
PPG for cows with BHBA ≥ 1.2 mmol/L
McArt et al., 2011; JDS

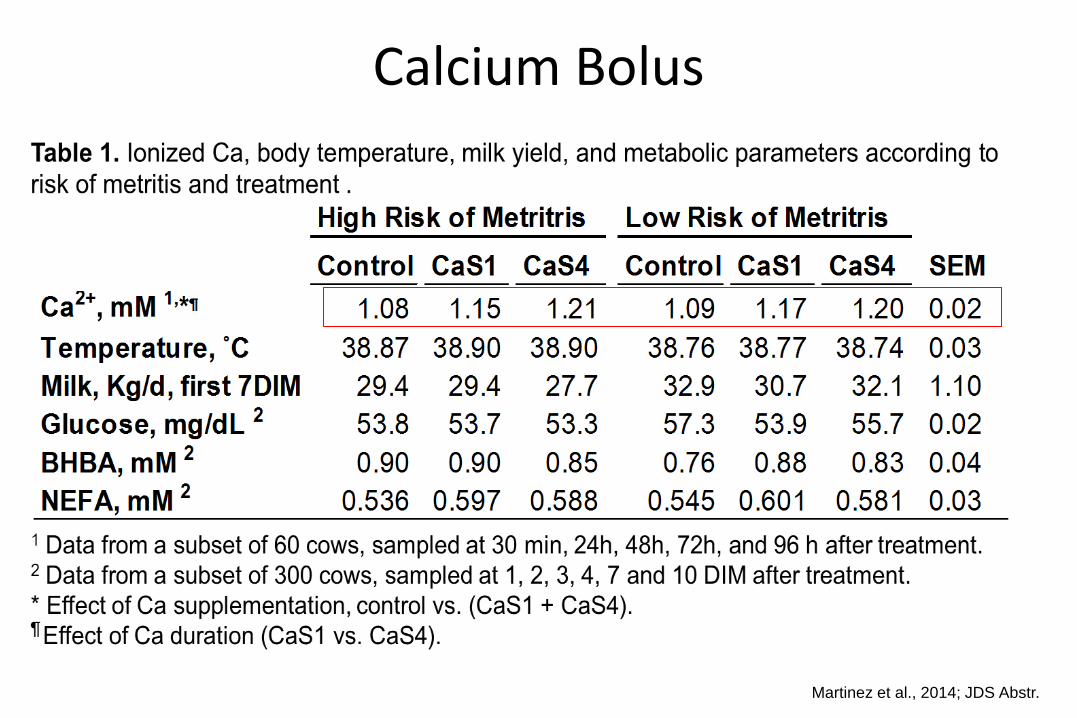
Calcium bolus - CaCl2 + CaSO4 TRT: P = 0.005
Hour: P < 0.001
TRT*Hour: P = 0.005
Linear effect of Ca dose: P < 0.001
7.50
8.00
8.50
9.00
9.50
10.00
10.50
11.00
Cov0 0.5 1 3 6 12 14 24 48
Cal
cium
(mg
/dL)
Hour relative to dosing
0
1
2
3
Martinez et al., 2014; JDS Abstr
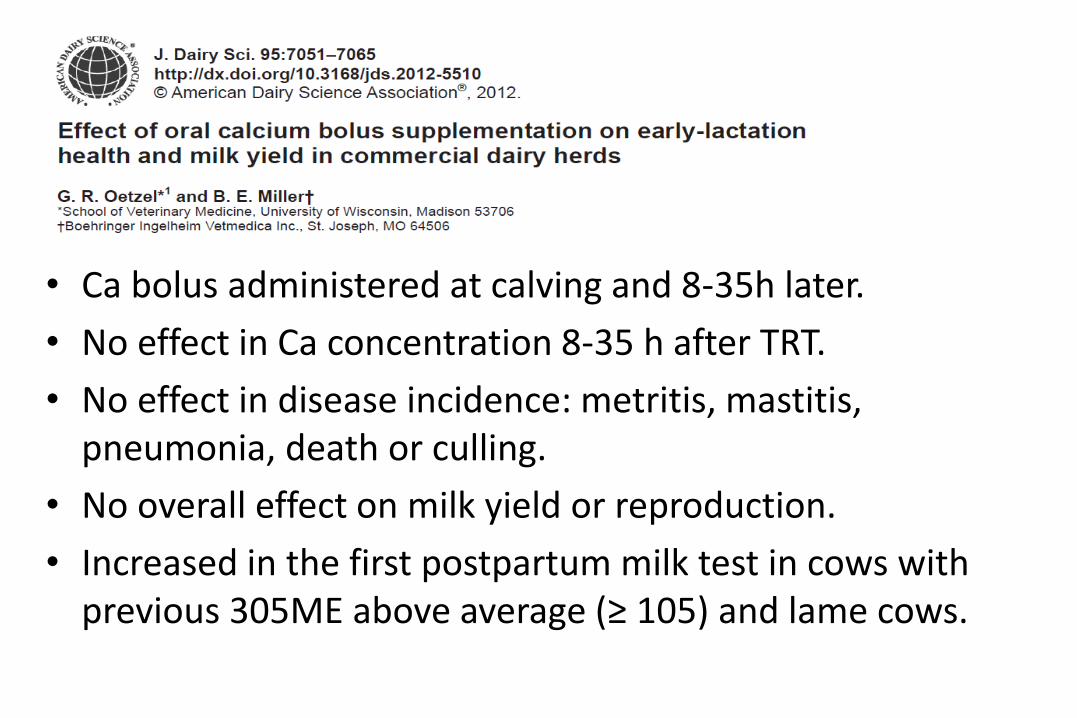
• Ca bolus administered at calving and 8-35h later.
• No effect in Ca concentration 8-35 h after TRT.
• No effect in disease incidence: metritis, mastitis, pneumonia, death or culling.
• No overall effect on milk yield or reproduction.
• Increased in the first postpartum milk test in cows with previous 305ME above average (≥ 105) and lame cows.

Calcium Bolus
Martinez et al., 2014; JDS Abstr.
Calcium Bolus
Martinez et al., 2014; JDS Abstr.

Calcium Bolus
Martinez et al., 2014; JDS Abstr.
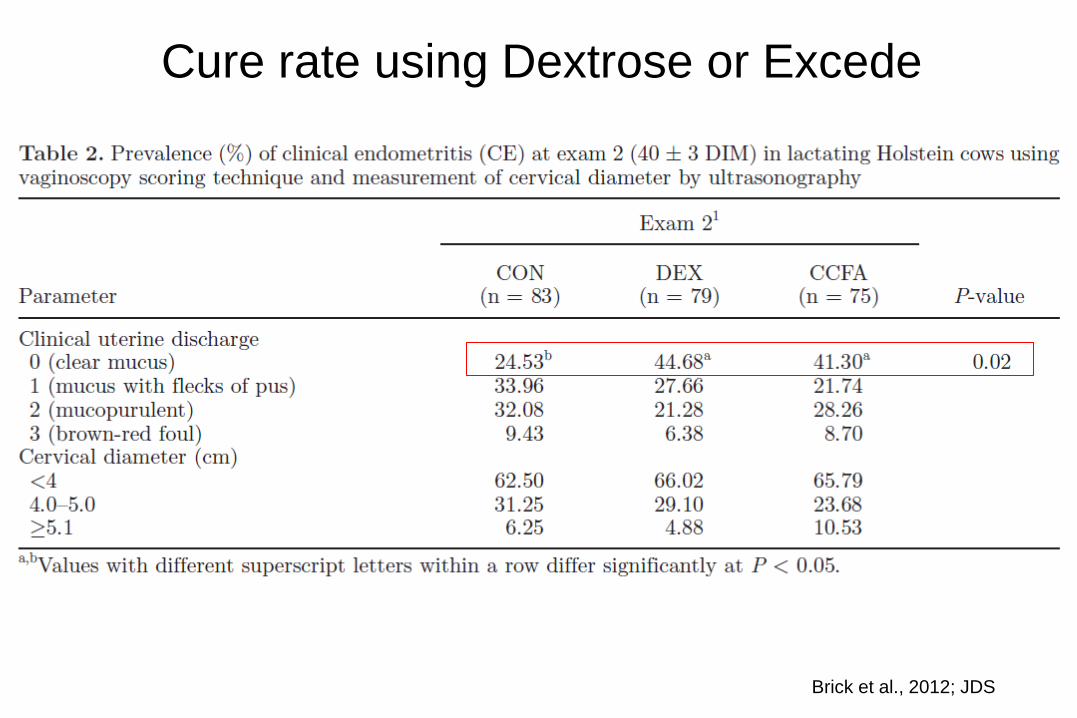
Cure rate using Dextrose or Excede
Brick et al., 2012; JDS

Pregnancy per AI for First Services
Brick et al., 2012; JDS
NoCE: 112 d
Dex: 128 d
CCFA: 146 d
Con: 147 d
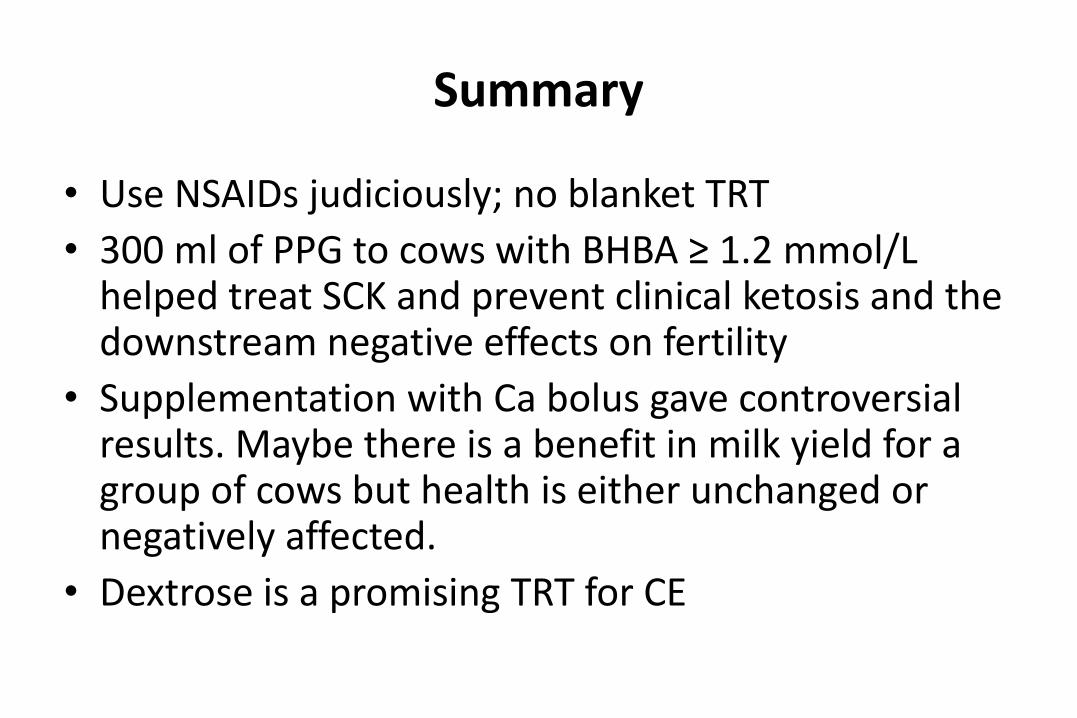
Summary
• Use NSAIDs judiciously; no blanket TRT
• 300 ml of PPG to cows with BHBA ≥ 1.2 mmol/L helped treat SCK and prevent clinical ketosis and the downstream negative effects on fertility
• Supplementation with Ca bolus gave controversial results. Maybe there is a benefit in milk yield for a group of cows but health is either unchanged or negatively affected.
• Dextrose is a promising TRT for CE

Conclusion
• Initiation of lactation leads to decreases in concentrations of plasma glucose, glycogen and calcium, and leads to increases in NEFA and BHBA.
• NEFA, BHBA, and low calcium directly affect immune function.
• Immunosuppression during periods of NEB predisposes cows to postpartum diseases.
• Postpartum diseases affect pregnancy and PL.
• There is no magic bullet.

Questions???