klrd1, fosl2 and lilrb3 as potential biomarkers for
TRANSCRIPT

Zhang et al. BMC Cardiovasc Disord (2021) 21:344 https://doi.org/10.1186/s12872-021-01997-5
RESEARCH ARTICLE
KLRD1, FOSL2 and LILRB3 as potential biomarkers for plaques progression in acute myocardial infarction and stable coronary artery diseaseQiang Zhang1,3,4†, Yue Zheng1,2,3,4,5†, Meng Ning1,3,4† and Tong Li1,3,4,5,6*
Abstract
Background: Myocardial infarction (MI) contributes to high mortality and morbidity and can also accelerate ath-erosclerosis, thus inducing recurrent event due to status changing of coronary artery walls or plaques. The research aimed to investigate the differentially expressed genes (DEGs), which may be potential therapeutic targets for plaques progression in stable coronary artery disease (CAD) and ST-elevated MI (STEMI).
Methods: Two human datasets (GSE56885 and GSE59867) were analyzed by GEO2R and enrichment analysis was applied through Gene Ontology (GO) and Kyoto Encyclopedia of Genes and Genomes (KEGG) pathway analysis. To explore the seed genes, the protein–protein interaction (PPI) network was constructed and seed genes, as well as top30 ranking neighbours were screened out. To validate these findings, one human dataset GSE120521 was ana-lyzed. Linear regression analysis and ROC curve were also performed to determine which seed genes above men-tioned could be independent factors for plaques progression. Mice MI model and ELISA of seed genes were applied and ROC curve was also performed for in vivo validation.
Results: 169 DEGs and 573 DEGs were screened out in GSE56885 and GSE59867, respectively. Utilizing GO and KEGG analysis, these DEGs mainly enriched in immune system response and cytokines interaction. PPI network analysis was carried out and 19 seed genes were screened out. To validate these findings, GSE120521 was analyzed and three genes were demonstrated to be targets for plaques progression and stable CAD progression, including KLRD1, FOSL2 and LILRB3. KLRD1 and LILRB3 were demonstrated to be high-expressed at 1d after MI compared to SHAM group and FOSL2 expression was low-expressed at 1d and 1w. To investigate the diagnostic abilities of seed genes, ROC analysis was applied and the AUCs of KLRD1, FOSL2 and LILRB3, were 0.771, 0.938 and 0.972, respectively.
Conclusion: This study provided the screened seed genes, KLRD1, FOSL2 and LILRB3, as credible molecular biomark-ers for plaques status changing in CAD progression and MI recurrence. Other seed genes, such as FOS, SOCS3 and MCL1, may also be potential targets for treatment due to their special clinical value in cardiovascular diseases.
Keywords: GEO, WebGestalt, PPI, STEMI, Stable CAD
© The Author(s) 2021. Open Access This article is licensed under a Creative Commons Attribution 4.0 International License, which permits use, sharing, adaptation, distribution and reproduction in any medium or format, as long as you give appropriate credit to the original author(s) and the source, provide a link to the Creative Commons licence, and indicate if changes were made. The images or other third party material in this article are included in the article’s Creative Commons licence, unless indicated otherwise in a credit line to the material. If material is not included in the article’s Creative Commons licence and your intended use is not permitted by statutory regulation or exceeds the permitted use, you will need to obtain permission directly from the copyright holder. To view a copy of this licence, visit http:// creat iveco mmons. org/ licen ses/ by/4. 0/. The Creative Commons Public Domain Dedication waiver (http:// creat iveco mmons. org/ publi cdoma in/ zero/1. 0/) applies to the data made available in this article, unless otherwise stated in a credit line to the data.
IntroductionCardiovascular diseases are associated with considerable mortality and morbidity. Nowadays acute myocardial infarction (MI) still contributes to the leading mortality in human being [1]. Besides, MI mortality went up by 5.6
Open Access
*Correspondence: [email protected]†Qiang Zhang, Yue Zheng and Meng Ning contributed equally as First Author1 Cardiology, The Third Central Clinical College of Tianjin Medical University, No. 83, Jintang Road, Hedong District, Tianjin 300170, ChinaFull list of author information is available at the end of the article
Page 2 of 12Zhang et al. BMC Cardiovasc Disord (2021) 21:344
times in the last three decades [2]. Previous reports have shown that aged patients with coronary artery disease (CAD) had poorer outcomes, such as higher all‐cause mortality and recurrent event [3, 4]. Early diagnosis of CAD can decrease mortality [5]. So, a deeper under-standing of CAD progression may help the diagnosis and treatment, thus saving patients’ lives.
Previous researches reported that MI promoted pro-genitor cells and haematopoietic stem liberation from bone marrow niches at 1d after MI. The progenitors then seeded the spleen and monocyte production increased, which promoted atherogenesis and therefore contrib-uted to MI progression [6, 7]. Persistent impairment of endothelial vasomotor function was correlated to athero-genesis and plaques progression in ST-elevated myo-cardial infarction (STEMI) patients’ coronary arteries [8]. Besides, plaque erosion was more frequent in stable CAD, than that in STEMI [9]. So, the biomarkers about patients’ plaques may be novel therapeutic targets for CAD progression and MI recurrence.
In recent years, the potential genes associated with STEMI and stable CAD have been obtained through microarray analysis applied in patients’ peripheral blood and the mice myocardium [10–12]. For example, through the integrated bioinformatics analysis of GEO datasets, Daqiu Chen et al. [11] found 4 hub genes may play a criti-cal role in STEMI development. However, the bioinfor-matics analysis is rarely used in cardiovascular diseases [13], especially in CAD progression and MI recurrence.
In this study, two human datasets were used to inves-tigate the DEGs. Next, using WebGestalt, GO and KEGG analysis and protein–protein interaction (PPI) network were performed. The seed genes were received for CAD progression and MI recurrence. To validate the seed genes screened in PPI network, one human dataset GSE120521 was analyzed. The linear regression analyses were used to determine which seed genes were inde-pendent factors for plaques progression and stable CAD progression. Receiver operating characteristic (ROC) was also applied to evaluate the area under the curve (AUC) value and predictive abilities of these selected genes.
MethodsMicroarray dataUsing the keywords “stable CAD” or “myocardial infarc-tion”, we found two GEO datasets, including GSE56885 contributed by Kapoor et al. and GSE59867 contrib-uted by Maciejak et al. (Table S1). The former was RNA sequencing of human peripheral blood samples in stable CAD patients compared to healthy subjects. The latter was RNA sequencing of human peripheral blood sam-ples in STEMI patients compared to stable CAD. The stable CAD patients were defined as having the disease
more than 3 months prior to enrollment and using any combination of cardiac-related medications, for instance, ACEIs, β-blocks and statins. All the patients were angio-graphically proven.
Screening for DEGsTo screen out DEGs, the series matrix files were ana-lyzed by applying GEO2R as previously reported [14]. A log2FC > 1 and an adjusted P-value < 0.05 were applied as the cut-off criteria in GSE56885, while a log2FC > 0.38 and an adjusted P-value < 0.05 were used in GSE59867.
Enrichment analysisKEGG [15] and GO [16] analysis were performed using Over-Representation Analysis or Gene Set Enrich-ment Analysis methods in WEB-based Gene Set Analy-sis Toolkit (WebGestalt) as previously reported [17]. A FDR < 0.05 was significant. Redundancy reduction was applied through a weighted set cover.
PPI networkTo identify the interaction of DEGs, PPI network was built using the Network Topology-based Analysis (NTA, Network Retrieval & Prioritization method) [17]. A FDR < 0.05 was significant.
Validation of the screened genes in GSE120521To validate the seed genes screened in NTA, one human dataset about the difference between stable and unstable plaques, GSE120521 contributed by Mahmound et al. (Table S1), was analyzed. Plaques were dissected into sta-ble and unstable regions based on macroscopic appear-ance. Unstable regions were characterised as the visible zone of plaque rupture, and the surrounding abnormal tissue, including obvious calcification and intra-plaque haemorrhage. Stable regions were macroscopically nor-mal adjacent areas.
MI model constructionAdult experimental C57Bl/6J male mice (6 mice per group, n = 24) were purchased from Charles River (Bei-jing, China). Mice were maintained in a specific patho-gen-free environment with free access to food and water and a 12/12 light–dark cycle. Protocols were approved by Institute of Radiation Medicine, the Chinese Academy of Medical Science, which conform to the Guide for the Care and Use of Laboratory Animals published by the US National Institutes of Health.
MI were induced in adult young (10–11 weeks). Briefly, heart was manually exposed from the 4th intercostal space through inhalation of isoflurane (1.5–2%, MSS-3, England) and the left coronary artery was located, sutured and ligated at a site about 3 mm
Page 3 of 12Zhang et al. BMC Cardiovasc Disord (2021) 21:344
from its origin, which induced roughly 50% ischemia of the left ventricular in mice. Infarction was consid-ered successful following the visual appearance of pale discoloration and a ST elevation on electrocardiogram. Sham-operated animals underwent the same proce-dure of MI model without any coronary artery ligation. To reduce mice pain in animal experiments, the ani-mals were euthanized by cervical dislocation after iso-flurane anesthesia (5%, MSS-3, England) to collect left ventricular samples to do ELISA analysis.
Enzyme‑linked immunosorbent assayFor further validations, left ventricular samples in bor-der zone and infarcted area were incubated with pri-mary antibodies overnight at 4 °C and then incubated with secondary antibodies for 1 h at room tempera-ture. Primary antibodies against KLRD1 (LS-C34586-250, 1:30,000, LSBio) and FOSL2 (LS-C801443-100, 1:40,000, LSBio) and LILRB3 (LS-C317999-50, 1:40,000, LSBio), were used.
Statistical analysisAll data are presented as the mean ± SD. Shapiro–Wilk normality test and Weltch t’ test (2 groups) were performed using SPSS 23.0. The linear regression was applied using the forward method to investigate which seed genes could be independent factors for plaques progression and stable CAD progression. ROC was used to evaluate AUC and predictive abilities. A P < 0.05 was considered statistically significant.
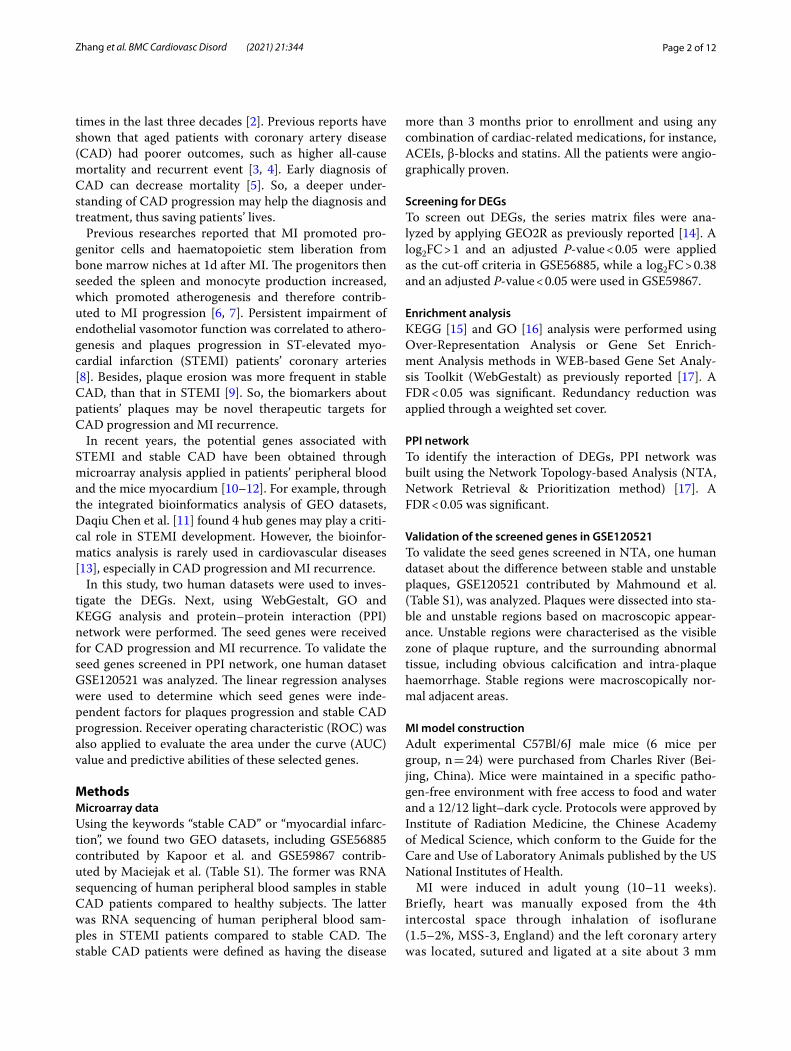
ResultsIdentification of DEGs in GSE56885 and GSE59867Two datasets, including GSE56885 and GSE59867, were utilized for analysis. Using GEO2R, 163 DEGs were obtained from GSE56885, including 98 down- and 65 up-regulated genes, while 573 DEGs were obtained from GSE59867, including 284 down- and 289 up-regulated genes (Fig. 1).
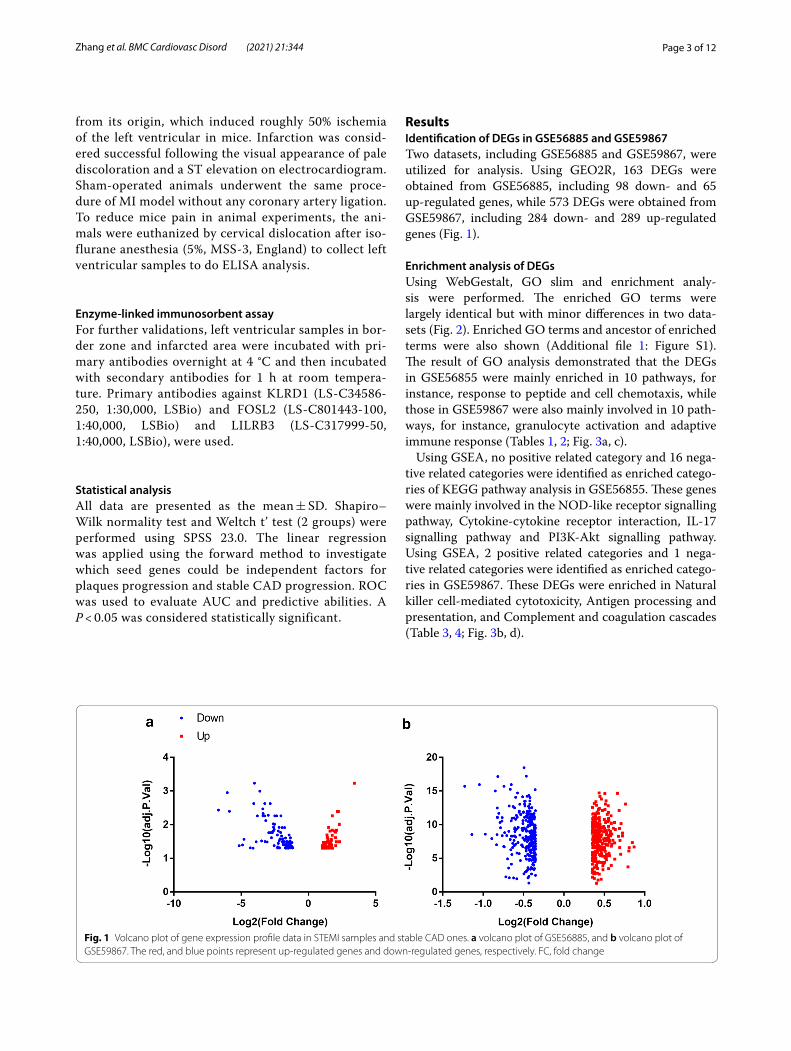
Enrichment analysis of DEGsUsing WebGestalt, GO slim and enrichment analy-sis were performed. The enriched GO terms were largely identical but with minor differences in two data-sets (Fig. 2). Enriched GO terms and ancestor of enriched terms were also shown (Additional file 1: Figure S1). The result of GO analysis demonstrated that the DEGs in GSE56855 were mainly enriched in 10 pathways, for instance, response to peptide and cell chemotaxis, while those in GSE59867 were also mainly involved in 10 path-ways, for instance, granulocyte activation and adaptive immune response (Tables 1, 2; Fig. 3a, c).
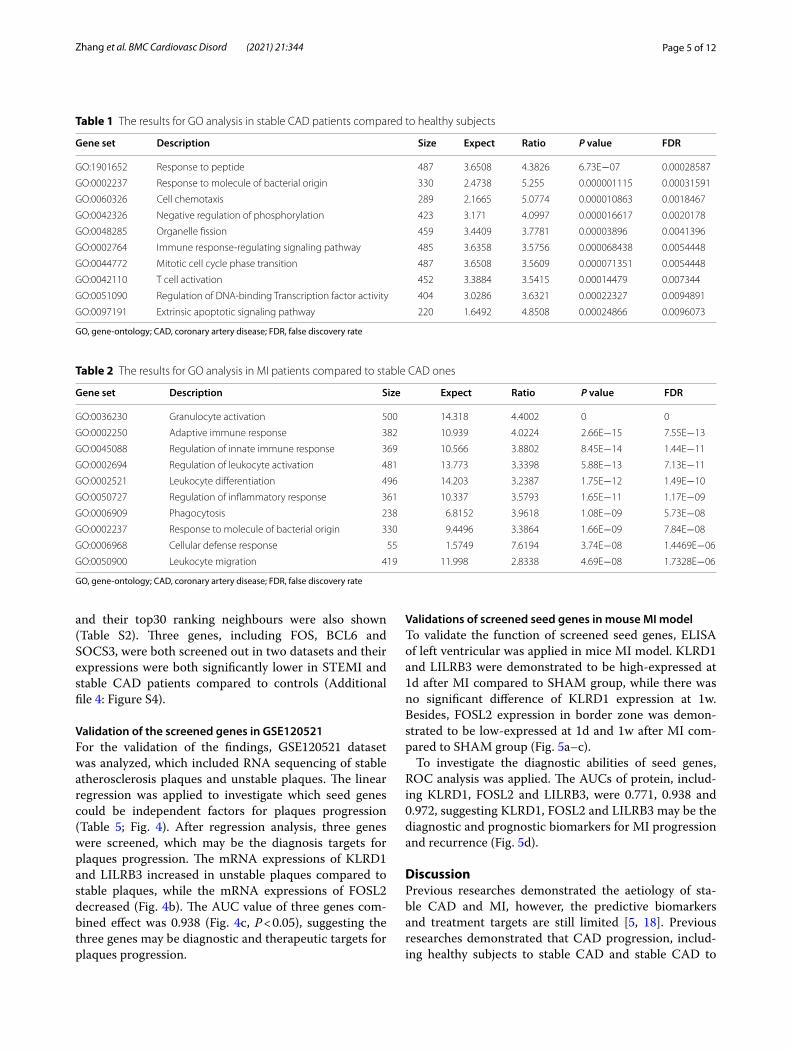
Using GSEA, no positive related category and 16 nega-tive related categories were identified as enriched catego-ries of KEGG pathway analysis in GSE56855. These genes were mainly involved in the NOD-like receptor signalling pathway, Cytokine-cytokine receptor interaction, IL-17 signalling pathway and PI3K-Akt signalling pathway. Using GSEA, 2 positive related categories and 1 nega-tive related categories were identified as enriched catego-ries in GSE59867. These DEGs were enriched in Natural killer cell-mediated cytotoxicity, Antigen processing and presentation, and Complement and coagulation cascades (Table 3, 4; Fig. 3b, d).
Fig. 1 Volcano plot of gene expression profile data in STEMI samples and stable CAD ones. a volcano plot of GSE56885, and b volcano plot of GSE59867. The red, and blue points represent up-regulated genes and down-regulated genes, respectively. FC, fold change

Page 4 of 12Zhang et al. BMC Cardiovasc Disord (2021) 21:344
Detection of the key genes in STEMI and stable CADA PPI BioGRID network was created through NTA to detect the seed genes in STEMI and stable CAD. Nine hub genes were screened out in GSE56855 (Additional
file 2: Figure S2), such as FOSL2, BCL6, JUNB, and FOS, while 10 hub genes were screened out in GSE59867 (Additional file 3: Figure S3), for instance, FOS, TRIM25, SOCS3, KLRD1 and LILRB3. Besides the seed genes
Fig. 2 The results of GO enrichment analysis in STEMI samples and stable CAD ones. The results of GO enrichment analysis of GSE56885 (a), and GSE59867 (b) were shown, including biological process (red), cellular component (blue), and molecular function (green)
Page 5 of 12Zhang et al. BMC Cardiovasc Disord (2021) 21:344
and their top30 ranking neighbours were also shown (Table S2). Three genes, including FOS, BCL6 and SOCS3, were both screened out in two datasets and their expressions were both significantly lower in STEMI and stable CAD patients compared to controls (Additional file 4: Figure S4).
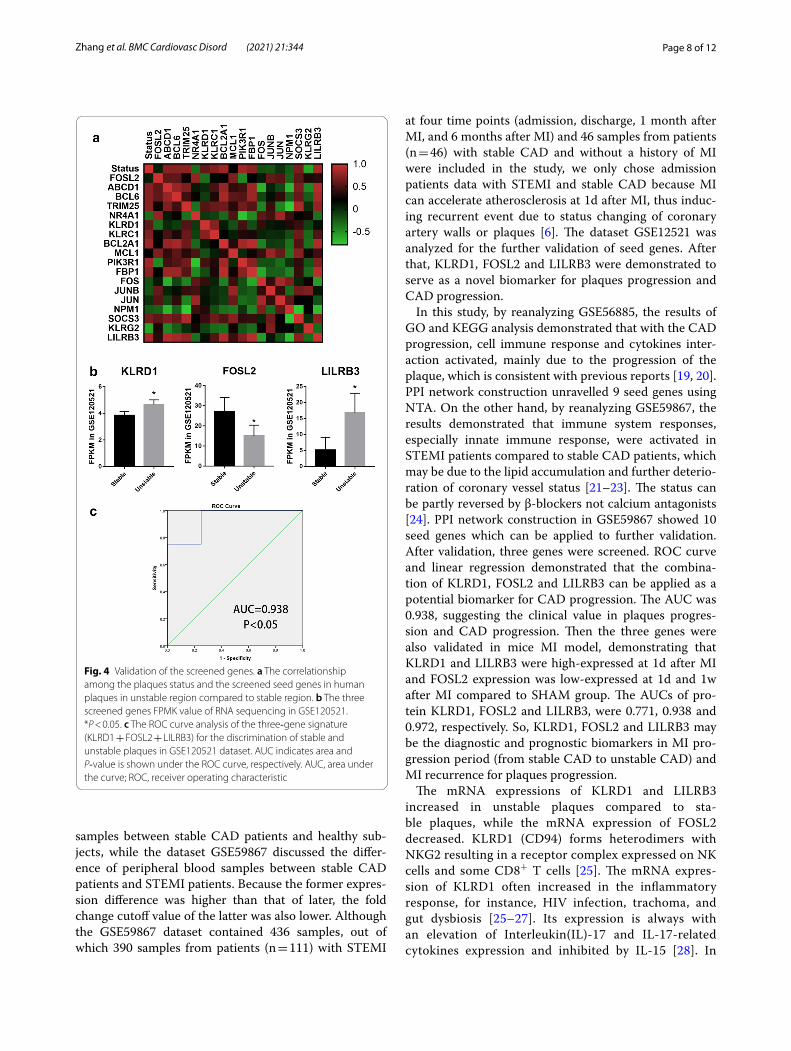
Validation of the screened genes in GSE120521For the validation of the findings, GSE120521 dataset was analyzed, which included RNA sequencing of stable atherosclerosis plaques and unstable plaques. The linear regression was applied to investigate which seed genes could be independent factors for plaques progression (Table 5; Fig. 4). After regression analysis, three genes were screened, which may be the diagnosis targets for plaques progression. The mRNA expressions of KLRD1 and LILRB3 increased in unstable plaques compared to stable plaques, while the mRNA expressions of FOSL2 decreased (Fig. 4b). The AUC value of three genes com-bined effect was 0.938 (Fig. 4c, P < 0.05), suggesting the three genes may be diagnostic and therapeutic targets for plaques progression.
Validations of screened seed genes in mouse MI modelTo validate the function of screened seed genes, ELISA of left ventricular was applied in mice MI model. KLRD1 and LILRB3 were demonstrated to be high-expressed at 1d after MI compared to SHAM group, while there was no significant difference of KLRD1 expression at 1w. Besides, FOSL2 expression in border zone was demon-strated to be low-expressed at 1d and 1w after MI com-pared to SHAM group (Fig. 5a–c).
To investigate the diagnostic abilities of seed genes, ROC analysis was applied. The AUCs of protein, includ-ing KLRD1, FOSL2 and LILRB3, were 0.771, 0.938 and 0.972, suggesting KLRD1, FOSL2 and LILRB3 may be the diagnostic and prognostic biomarkers for MI progression and recurrence (Fig. 5d).
DiscussionPrevious researches demonstrated the aetiology of sta-ble CAD and MI, however, the predictive biomarkers and treatment targets are still limited [5, 18]. Previous researches demonstrated that CAD progression, includ-ing healthy subjects to stable CAD and stable CAD to
Table 1 The results for GO analysis in stable CAD patients compared to healthy subjects
GO, gene-ontology; CAD, coronary artery disease; FDR, false discovery rate
Gene set Description Size Expect Ratio P value FDR
GO:1901652 Response to peptide 487 3.6508 4.3826 6.73E−07 0.00028587
GO:0002237 Response to molecule of bacterial origin 330 2.4738 5.255 0.000001115 0.00031591
GO:0060326 Cell chemotaxis 289 2.1665 5.0774 0.000010863 0.0018467
GO:0042326 Negative regulation of phosphorylation 423 3.171 4.0997 0.000016617 0.0020178
GO:0048285 Organelle fission 459 3.4409 3.7781 0.00003896 0.0041396
GO:0002764 Immune response-regulating signaling pathway 485 3.6358 3.5756 0.000068438 0.0054448
GO:0044772 Mitotic cell cycle phase transition 487 3.6508 3.5609 0.000071351 0.0054448
GO:0042110 T cell activation 452 3.3884 3.5415 0.00014479 0.007344
GO:0051090 Regulation of DNA-binding Transcription factor activity 404 3.0286 3.6321 0.00022327 0.0094891
GO:0097191 Extrinsic apoptotic signaling pathway 220 1.6492 4.8508 0.00024866 0.0096073
Table 2 The results for GO analysis in MI patients compared to stable CAD ones
GO, gene-ontology; CAD, coronary artery disease; FDR, false discovery rate
Gene set Description Size Expect Ratio P value FDR
GO:0036230 Granulocyte activation 500 14.318 4.4002 0 0
GO:0002250 Adaptive immune response 382 10.939 4.0224 2.66E−15 7.55E−13
GO:0045088 Regulation of innate immune response 369 10.566 3.8802 8.45E−14 1.44E−11
GO:0002694 Regulation of leukocyte activation 481 13.773 3.3398 5.88E−13 7.13E−11
GO:0002521 Leukocyte differentiation 496 14.203 3.2387 1.75E−12 1.49E−10
GO:0050727 Regulation of inflammatory response 361 10.337 3.5793 1.65E−11 1.17E−09
GO:0006909 Phagocytosis 238 6.8152 3.9618 1.08E−09 5.73E−08
GO:0002237 Response to molecule of bacterial origin 330 9.4496 3.3864 1.66E−09 7.84E−08
GO:0006968 Cellular defense response 55 1.5749 7.6194 3.74E−08 1.4469E−06
GO:0050900 Leukocyte migration 419 11.998 2.8338 4.69E−08 1.7328E−06

Page 6 of 12Zhang et al. BMC Cardiovasc Disord (2021) 21:344
Fig. 3 Volcano plot of enriched pathways in STEMI samples and stable CAD ones. a The volcano plot of GO enrichment analysis of GSE56885 using ORA method. b The volcano plot of KEGG enrichment analysis of GSE56885 using GESA method. c The volcano plot of GO enrichment analysis of GSE59867 using ORA method. d The volcano plot of KEGG enrichment analysis of GSE59867 using GESA method
Page 7 of 12Zhang et al. BMC Cardiovasc Disord (2021) 21:344
STEMI, can induce plaques progression and plaques progression can, in turn, deteriorate CAD progression
[6–8]. In the current study, the datasets GSE56885 and GSE59867 were used to screen new potential biomarkers for unstable plaques and CAD progression. The dataset GSE56885 discussed the difference of peripheral blood
Table 3 The results for KEGG analysis in stable CAD patients compared to healthy subjects
KEGG, Kyoto encyclopedia of genes and genomes; CAD, coronary artery disease; FDR, false discovery rate
Gene set Description Size Leading edge number
ES NES P value FDR
hsa04621 NOD-like receptor signaling pathway 8 6 − 0.77061 − 2.0947 0.0014245 0.0039551
hsa04060 Cytokine-cytokine receptor interaction 7 4 − 0.77594 − 1.9948 0.001462 0.0050427
hsa05132 Salmonella infection 5 4 − 0.87092 − 2.0026 0 0.0051911
hsa04657 IL-17 signaling pathway 7 6 − 0.8278 − 2.1093 0 0.0051911
hsa04010 MAPK signaling pathway 7 6 − 0.7715 − 1.9341 0.0014451 0.006427
hsa04151 PI3K-Akt signaling pathway 7 5 − 0.71874 − 1.855 0.005571 0.0084046
hsa05167 Kaposi sarcoma-associated herpesvirus infection 7 4 − 0.72723 − 1.8713 0.0028011 0.0085282
hsa04064 NF-kappa B signaling pathway 8 6 − 0.79671 − 2.1169 0.0013966 0.008899
hsa04668 TNF signaling pathway 9 8 − 0.67798 − 1.8731 0.002751 0.0097465
hsa05163 Human cytomegalovirus infection 5 3 − 0.77931 − 1.7897 0.004644 0.017353
hsa04620 Toll-like receptor signaling pathway 5 3 − 0.74322 − 1.7044 0.01682 0.028378
hsa05142 Chagas disease (American trypanosomiasis) 5 3 − 0.74322 − 1.7044 0.01682 0.028378
hsa05200 Pathways in cancer 7 6 − 0.6674 − 1.7301 0.011561 0.029528
hsa04932 Non-alcoholic fatty liver disease (NAFLD) 5 4 − 0.74563 − 1.7086 0.006006 0.032059
hsa04625 C-type lectin receptor signaling pathway 5 3 − 0.74881 − 1.7165 0.010753 0.032259
hsa04380 Osteoclast differentiation 7 7 − 0.65041 − 1.6467 0.016129 0.04088
Table 4 The results for KEGG analysis in MI patients compared to stable CAD ones
KEGG, Kyoto encyclopedia of genes and genomes; CAD, coronary artery disease; FDR, false discovery rate
Gene set Description Size Leading edge number
ES NES P value FDR
hsa04650 Natural killer cell mediated cytotoxicity 10 6 0.69503 2.5146 0 0
hsa04612 Antigen processing and presentation 6 4 0.77405 2.2306 0.0020747 0.0081146
hsa04610 Complement and coagulation cascades 12 11 -0.59536 -2.2285 0 0.020906
Table 5 The linear regression of seed genes in GSE120521
CI, confidence interval
Model Unstandardized coefficients
Standardized coefficients
P value 95.0% CI Collinearity statistics
B Std. error β Lower bound Upper bound Tolerance VIF
1 (Constant) 0.903 0.221 0.007 0.361 1.445
LILRB3 0.054 0.017 0.798 0.018 0.013 0.095 1 1
2 (Constant) − 0.958 0.474 0.1 − 2.177 0.262
LILRB3 0.057 0.009 0.834 0.001 0.034 0.08 0.995 1.005
KLRD1 0.444 0.11 0.529 0.01 0.162 0.726 0.995 1.005
3 (Constant) − 2.158 0.33 0.003 − 3.076 − 1.24
LILRB3 0.077 0.006 1.124 0 0.061 0.093 0.459 2.18
KLRD1 0.406 0.049 0.484 0.001 0.27 0.542 0.968 1.033
FOSL2 0.003 0.001 0.4 0.009 0.001 0.005 0.449 2.228
Page 8 of 12Zhang et al. BMC Cardiovasc Disord (2021) 21:344
samples between stable CAD patients and healthy sub-jects, while the dataset GSE59867 discussed the differ-ence of peripheral blood samples between stable CAD patients and STEMI patients. Because the former expres-sion difference was higher than that of later, the fold change cutoff value of the latter was also lower. Although the GSE59867 dataset contained 436 samples, out of which 390 samples from patients (n = 111) with STEMI
at four time points (admission, discharge, 1 month after MI, and 6 months after MI) and 46 samples from patients (n = 46) with stable CAD and without a history of MI were included in the study, we only chose admission patients data with STEMI and stable CAD because MI can accelerate atherosclerosis at 1d after MI, thus induc-ing recurrent event due to status changing of coronary artery walls or plaques [6]. The dataset GSE12521 was analyzed for the further validation of seed genes. After that, KLRD1, FOSL2 and LILRB3 were demonstrated to serve as a novel biomarker for plaques progression and CAD progression.
In this study, by reanalyzing GSE56885, the results of GO and KEGG analysis demonstrated that with the CAD progression, cell immune response and cytokines inter-action activated, mainly due to the progression of the plaque, which is consistent with previous reports [19, 20]. PPI network construction unravelled 9 seed genes using NTA. On the other hand, by reanalyzing GSE59867, the results demonstrated that immune system responses, especially innate immune response, were activated in STEMI patients compared to stable CAD patients, which may be due to the lipid accumulation and further deterio-ration of coronary vessel status [21–23]. The status can be partly reversed by β-blockers not calcium antagonists [24]. PPI network construction in GSE59867 showed 10 seed genes which can be applied to further validation. After validation, three genes were screened. ROC curve and linear regression demonstrated that the combina-tion of KLRD1, FOSL2 and LILRB3 can be applied as a potential biomarker for CAD progression. The AUC was 0.938, suggesting the clinical value in plaques progres-sion and CAD progression. Then the three genes were also validated in mice MI model, demonstrating that KLRD1 and LILRB3 were high-expressed at 1d after MI and FOSL2 expression was low-expressed at 1d and 1w after MI compared to SHAM group. The AUCs of pro-tein KLRD1, FOSL2 and LILRB3, were 0.771, 0.938 and 0.972, respectively. So, KLRD1, FOSL2 and LILRB3 may be the diagnostic and prognostic biomarkers in MI pro-gression period (from stable CAD to unstable CAD) and MI recurrence for plaques progression.
The mRNA expressions of KLRD1 and LILRB3 increased in unstable plaques compared to sta-ble plaques, while the mRNA expression of FOSL2 decreased. KLRD1 (CD94) forms heterodimers with NKG2 resulting in a receptor complex expressed on NK cells and some CD8+ T cells [25]. The mRNA expres-sion of KLRD1 often increased in the inflammatory response, for instance, HIV infection, trachoma, and gut dysbiosis [25–27]. Its expression is always with an elevation of Interleukin(IL)-17 and IL-17-related cytokines expression and inhibited by IL-15 [28]. In
Fig. 4 Validation of the screened genes. a The correlationship among the plaques status and the screened seed genes in human plaques in unstable region compared to stable region. b The three screened genes FPMK value of RNA sequencing in GSE120521. *P < 0.05. c The ROC curve analysis of the three‐gene signature (KLRD1 + FOSL2 + LILRB3) for the discrimination of stable and unstable plaques in GSE120521 dataset. AUC indicates area and P‐value is shown under the ROC curve, respectively. AUC, area under the curve; ROC, receiver operating characteristic

Page 9 of 12Zhang et al. BMC Cardiovasc Disord (2021) 21:344
this study, the mRNA expressions of KLRD1 raised in STEMI patients compared to stable CAD patients and also increased in unstable plaques compared to stable plaques. Leukocyte immunoglobulin-like receptors (LILRBs), associated with MHC class I and microglobu-lin, activated the JAK/STAT signalling pathway [29] and regulated the suppressive function and fate of MDSCs [30]. In addition, LILRA3 can also induce Takayasu’s arteritis (P < 1 × 10⁻⁵) [31, 32]. In this study, LILRB3 may also play a critical role in the status changing of coronary artery wall and plaques in atherogenesis and CAD progression. Fos-like antigen 2 (FOSL2), as an AP-1 transcription factor, can promote the progeni-tor to cardiomyocyte transition [33] and FOSL2 over-expression reversed the miR-155 effects on promoting
the persistence of exhausted T cells [34]. FOSL2 was also observed to interact with lipid-metabolism-related gene and Fatty acid elongase 4, thus regulating lipid metabolism [35]. In our study, FOSL2 expres-sion declined in unstable plaques compared to stable plaques, which may be due to the lipid metabolic dis-turbance and response to cell-mediated immunity.
Other seed genes, such as FOS, SOCS3 and MCL1, should also be mentioned due to their special clinical value in cardiovascular diseases. MI can result in the expression change of early response gene FOS, which might be correlated to the neural activity disorders induced by MI [36, 37]. In this study, FOS was both the seed gene in GSE56885 and GSE59867. In other words, FOS is a key biomarker about neural activity
Fig. 5 Validations of screened genes. a–c The protein expression levels of left ventricle at 1d and 1w after MI utilizing ELISA, including KLRD1 (a), FOSL2 (b) and LILRB3 (c). d The ROC curve analysis of the three genes in mice MI model. AUC, area under the curve; ROC, receiver operating characteristic. *P < 0.05; ***P < 0.001; NS, not significant
Page 10 of 12Zhang et al. BMC Cardiovasc Disord (2021) 21:344
for CAD progression and MI occurrence. The suppres-sor of cytokine signalling 3 (SOCS3), a negative-feed-back regulator of the JAK/STAT signaling [38], was enriched as a seed gene in STEMI patients and as a top30 ranking neighbour in stable CAD patients, which may be associated with platelet activity and inflam-mation. Platelet-induced SOCS3 expression regulated macrophage reprogramming in plaque by increasing IL-6, IL-1β, TNF-αexpression and declined phagocytic capacity that cannot resolve inflammation and main-tain plaque growth. A second cohort also indicated that SOCS1: SOCS3 ratio was associated with inflam-mation and platelet activity [39]. Therefore, SOCS3 may be a potential diagnosis and treatment target for myocardial injury under stress [40]. In addition, mye-loid cell leukaemia sequence 1 (MCL1) is critical for mitochondrial function and autophagy in the heart [41]. In this study, MCL1 was enriched in stable CAD and its expression also elevated in STEMI patients with recurrent events compared to those without recurrent events. Rac1 impeded apoptosis through AKT2/MCL1 and increased cell proliferation through JNK/c-JUN/Cyclin-D1 in myocardial hypoxia [42]. MCL1 can also inhibit the mitochondrial apoptosis and maintain cell viability, however, this process was impeded by FBW7. FBW7 can participate in ROS-induced myocardial injury by degrading MCL1 [43]. Therefore, MCL1 may serve as a biomarker of myocardial cell injury in CAD progression.
There are some limitations which should be men-tioned. Firstly, only three seed genes were validated for plaques progression. There may be some false nega-tives because of the enrichment methods and vali-dation methods. More researches are still needed to proceed with integrated bioinformatic analysis about plaques progression. Secondly, we aimed to investi-gate the potential targets to status changing of plaques and coronary wall to treat CAD progression and MI recurrence. So, we can only discuss a few significant seed genes and their neighbours in this paper. Maybe we can discuss others later. Lastly, the sample sizes of dataset GSE56885 and GSE120521 were not too large, however, after the calculation of sample sizes, they still met the further enrichment analysis and other statisti-cal methods.
ConclusionsIn conclusion, our study provided bioinformatics analy-sis of STEMI and stable CAD patients compared to their controls, respectively. The screened seed genes, KLRD1, FOSL2 and LILRB3, have been validated as credible molec-ular biomarkers for plaques progression and CAD deterio-ration. Other seed genes, such as FOS, SOCS3 and MCL1,
may also be potential targets for treatment due to their spe-cial clinical value. To verify the current findings, it is also necessary to perform more experiments.
AbbreviationsMI: Myocardial infarction; DEGs: Differentially expressed genes; CAD: Coronary artery disease; STEMI: ST-elevated myocardial infarction; GO: Gene ontol-ogy; KEGG: Kyoto encyclopedia of genes and genomes; PPI: Protein-protein interaction; ROC: Receiver operating characteristic; AUC : Area under the curve; WebGestalt: WEB-based gene set analysis toolkit; NTA: Network topology-based analysis; LILRBs: Leukocyte immunoglobulin-like receptors; FOSL2: Fos-like antigen 2; SOCS3: Suppressor of cytokine signaling 3; MCL1: Myeloid cell leukemia sequence 1.
Supplementary InformationThe online version contains supplementary material available at https:// doi. org/ 10. 1186/ s12872- 021- 01997-5.
Additional file 1. Enriched GO terms and ancestor of enriched terms in STEMI samples and stable CAD ones. (A) Enriched GO terms and ancestor of enriched terms in GSE56885. (B) Enriched GO terms and ancestor of enriched terms in GSE59867
Additional file 2. The PPI network graph of screened seed genes and top ranking neighbours in GSE56885, demonstrated 9 genes were screened through NTA
Additional file 3. The PPI network graph of screened seed genes and top ranking neighbours in GSE59867, demonstrated 10 genes were screened through NTA
Additional file 4. The Log2(FC) value of three screened key genes, FOS, BGL6 and SOCS3
AcknowledgementsNot applicable.
Authors’ contributionsQZ, YZ and TL conceived the ideas and analyzed the data. MN and YZ con-structed MI mice model and did ELISA analysis. YZ wrote this paper. All authors read and approved the final manuscript.
FundingThis work was financially supported by Tianjin science & technology commis-sion (19JCYBJC26000).
Availability of data and materialsMicroarray data were used from Gene Expression Omnibus (GEO), including GSE56885, GSE59867 and GSE120521. The datasets generated during the cur-rent study are available from the corresponding author on reasonable request.
Declarations
Ethics approval and consent to participateProtocols were approved by Institute of Radiation Medicine, the Chinese Academy of Medical Science, which conform to the Guide for the Care and Use of Laboratory Animals published by the US National Institutes of Health.
Consent to publishNot applicable.
Competing interestsOn behalf of all authors, the corresponding author states that there is no conflict of interest. The manuscript does not contain clinical studies or patient data.

Page 11 of 12Zhang et al. BMC Cardiovasc Disord (2021) 21:344
Author details1 Cardiology, The Third Central Clinical College of Tianjin Medical University, No. 83, Jintang Road, Hedong District, Tianjin 300170, China. 2 School of Medicine, Nankai University, Tianjin 300071, China. 3 Cardiology, Nankai University Affili-ated Third Center Hospital, Tianjin 300170, China. 4 Cardiology, The Third Cen-tral Hospital of Tianjin, 83 Jintang Road, Hedong District, Tianjin 300170, China. 5 Tianjin Key Laboratory of Extracorporeal Life Support for Critical Diseases, Tianjin, China. 6 Institute of Hepatobiliary Disease, Tianjin, China.
Received: 25 February 2020 Accepted: 9 April 2021
References 1. Naghavi M, Abajobir AA, Abbafati C, et al. Global, regional, and national
age-sex specific mortality for 264 causes of death, 1980–2016: a sys-tematic analysis for the Global Burden of Disease Study 2016. Lancet. 2017;390:1151–210. https:// doi. org/ 10. 1016/ S0140- 6736(17) 32152-9.
2. Chang J, Liu X, Sun Y. Mortality due to acutemyocardial infarction in China from 1987 to 2014: secular trends and ageperiod-cohort effects. Int J Cardiol. 2017;227:229–38. https:// doi. org/ 10. 1016/j. ijcard. 2016. 11. 130.
3. Rodondi N, Marques-Vidal P, Butler J, et al. Markers of atherosclerosis and inflammation for prediction of coronary heart disease in older adults. Am J Epidemiol. 2010;171:540–9. https:// doi. org/ 10. 1093/ aje/ kwp428.
4. Roger VL, Go AS, Lloyd-Jones DM, et al. Executive summary: Heart disease and stroke statistics-2012 update: a report from the American Heart Association. Circulation. 2012;125:188–97. https:// doi. org/ 10. 1161/ CIR. 0b013 e3182 456d46.
5. Cai Y, Yang Y, Chen X, et al. Circulating ‘lncrna OTTHUMT00000387022’ from monocytes as a novel biomarker for coronary artery disease. Cardio-vasc Res. 2016;112:714–24. https:// doi. org/ 10. 1093/ cvr/ cvw022.
6. Dutta P, Courties G, Wei Y, et al. Myocardial infarction accelerates athero-sclerosis. Nature. 2012;487:325–9. https:// doi. org/ 10. 1038/ natur e11260.
7. Marino A, Zhang Yi, Rubinelli L, et al. Pressure overload leads to coronary plaque formation, progression, and myocardial events in ApoE–/– mice. JCI Insight. 2019;4(9):e128220. https:// doi. org/ 10. 1172/ jci. insig ht. 128220.
8. Horikoshi T, Obata J-e, Nakamura T, et al. Persistent dysfunction of coronary endothelial vasomotor responses is related to atheroma plaque progression in the infarct-related coronary artery of AMI survivors. J Ath-eroscler Thromb. 2019;26(12):1062–74. https:// doi. org/ 10. 5551/ jat. 48249.
9. Yamamoto E, Yonetsu T, Kakuta T, et al. Clinical and laboratory predic-tors for plaque erosion in patients with acute coronary syndromes. J Am Heart Assoc. 2019;8(21):e012322. https:// doi. org/ 10. 1161/ JAHA. 119. 012322.
10. Zhang T, Zhao L, Cao X. Bioinformatics analysis of time series gene expression in left ventricle (LV) with acute myocardial infarction (AMI). Gene. 2014;543(2):259–67. https:// doi. org/ 10. 1016/j. gene. 2014. 04. 002.
11. Chen D-Q, Kong X-S, Shen X-B, et al. Identification of differentially expressed genes and signaling pathways in acute myocardial infarc-tion based on integrated bioinformatics analysis. Cardiovasc Ther. 2019;2019:8490707. https:// doi. org/ 10. 1155/ 2019/ 84907 07.
12. Gao Y, Qi G, Guo L, et al. Bioinformatics analyses of differentially expressed genes associated with acute myocardial infarction. Cardiovasc Ther. 2016;349(2):67–75. https:// doi. org/ 10. 1111/ 1755- 5922. 12171.
13. Mo X-G, Liu W, Yang Y, et al. NCF2, MYO1F, S1PR4, and FCN1 as potential noninvasive diagnostic biomarkers in patients with obstructive coronary artery: a weighted gene co-expression network analysis. J Cell Biochem. 2019;120(10):18219–35. https:// doi. org/ 10. 1002/ jcb. 29128.
14. Yang D, He Y, Bo Wu, et al. Integrated bioinformatics analysis for the screening of hub genes and therapeutic drugs in ovarian cancer. J Ovar-ian Res. 2020;13:10. https:// doi. org/ 10. 1186/ s13048- 020- 0613-2.
15. Kanehisa M, Goto S. KEGG: Kyoto encyclopedia of genes and genomes. Nucleic Acids Res. 2000;28:27–30. https:// doi. org/ 10. 1093/ nar/ 28.1. 27.
16. Hulsegge I, Kommadath A, Smits MA. Globaltest and GOEAST: two dif-ferent approaches for gene ontology analysis. BMC Proc. 2009;3(Suppl 4):S10. https:// doi. org/ 10. 1186/ 1753- 6561-3- S4- S10.
17. Cai G, Yang X, Chen T, et al. Integrated bioinformatics analysis of poten-tial pathway biomarkers using abnormal proteins in clubfoot. PeerJ. 2020;8:e8422. https:// doi. org/ 10. 7717/ peerj. 8422.
18. Yang Y, Cai Y, Wu G, et al. Plasma long non-coding rna, coromarker, a novel biomarker for diagnosis of coronary artery disease. Clin Sci. 2015;129:675–85. https:// doi. org/ 10. 1042/ CS201 50121.
19. Ponnuswamy P, Van Vre EA, Mallat Z, et al. Humoral and cellular immune responses in atherosclerosis: spotlight on B- and T-cells. Vasc Pharmacol. 2012;56:193–203. https:// doi. org/ 10. 1016/j. vph. 2012. 01. 009.
20. Chistiakov DA, Orekhov AN, Bobryshev YV. Immune-inflammatory responses in atherosclerosis: role of an adaptive immunity mainly driven by T and B cells. Immunobiology. 2016;221:1014–33. https:// doi. org/ 10. 1016/j. imbio. 2016. 05. 010.
21. Colivicchi F, Gulizia MM, Arca M, et al. Lipid lowering treatment and eligi-bility for PCSK9 inhibition in post-myocardial infarction patients in Italy: insights from two contemporary nationwide registries. Cardiovasc Ther. 2020;2020:3856242. https:// doi. org/ 10. 1155/ 2020/ 38562 42.
22. Fosshaug LE, Colas RA, Anstensrud AK, et al. Early increase of specialized pro-resolving lipid mediators in patients with ST-elevation myocardial infarction. EBioMedicine. 2019;46:264–73. https:// doi. org/ 10. 1016/j. ebiom. 2019. 07. 024.
23. Nguyen MT, Fernando S, Schwarz N, et al. Inflammation as a therapeutic target in atherosclerosis. J Clin Med. 2019;8(8):1109. https:// doi. org/ 10. 3390/ jcm80 81109.
24. Sorbets E, Steg PG, Young R, et al. β-blockers, calcium antagonists, and mortality in stable coronary artery disease: an international cohort study. Eur Heart J. 2019;40(18):1399–407. https:// doi. org/ 10. 1093/ eurhe artj/ ehy811.
25. Sperk M, Zhang W, Nowak P, et al. Plasma soluble factor following two decades prolonged suppressive antiretroviral therapy in HIV-1-positive males: a cross-sectional study. Medicine (Baltimore). 2018;97(5):e9759. https:// doi. org/ 10. 1097/ MD. 00000 00000 009759.
26. Burton MJ, Ramadhani A, Weiss HA, et al. Active trachoma is associated with increased conjunctival expression of IL17A and profibrotic cytokines. Infect Immun. 2011;79(12):4977–83. https:// doi. org/ 10. 1128/ IAI. 05718- 11.
27. Yang T, Ahmari N, Schmidt JT, et al. Shifts in the gut microbiota com-position due to depleted bone marrow beta adrenergic signaling are associated with suppressed inflammatory transcriptional networks in the mouse colon. Front Physiol. 2017;8:220. https:// doi. org/ 10. 3389/ fphys. 2017. 00220.
28. Ramsborg CG, Papoutsakis ET. Global transcriptional analysis delineates the differential inflammatory response interleukin-15 elicits from cultured human T Cells. Exp Hematol. 2007;35(3):454–64. https:// doi. org/ 10. 1016/j. exphem. 2006. 11. 013.
29. Truong AD, Hong Y, Lee J, et al. Chicken novel leukocyte immunoglob-ulin-like receptor subfamilies B1 and B3 are transcriptional regulators of major histocompatibility complex class I genes and signaling pathways. Asian-Australas J Anim Sci. 2019;32(5):614–28. https:// doi. org/ 10. 5713/ ajas. 18. 0561.
30. Ma Ge, Pan P-Y, Eisenstein S, et al. Paired immunoglobin like receptor-B regulates the suppressive function and fate of myeloid derived suppres-sor cells. Immunity. 2011;34(3):385–95. https:// doi. org/ 10. 1016/j. immuni. 2011. 02. 004.
31. Renauer P, Saruhan-Direskeneli G, Coit P, et al. Genome-wide association study identifies susceptibility loci in IL6, RPS9/LILRB3, and an intergenic locus on chromosome 21q22 in Takayasu’s arteritis. Arthritis Rheumatol. 2015;67(5):1361–8.
32. Renauer P, Sawalha AH. The genetics of Takayasu arteritis. Press Med. 2017;46(7–82):e179–87. https:// doi. org/ 10. 1016/j. lpm. 2016. 11. 031.
33. Jahangiri L, Sharpe M, Novikov N, et al. The AP-1 transcription factor com-ponent Fosl2 potentiates the rate of myocardial differentiation from the zebrafish second heart field. Development. 2016;143(1):113–22. https:// doi. org/ 10. 1242/ dev. 126136.
34. Stelekati E, Chen Z, Manne S, et al. Long-term persistence of exhausted CD8 T cells in chronic infection is regulated by MicroRNA-155. Cell Rep. 2018;23(7):2142–56. https:// doi. org/ 10. 1016/j. celrep. 2018. 04. 038.
35. Li S, Teegarden A, Bauer EM, et al. Transcription factor CTIP1/ BCL11A regulates epidermal differentiation and lipid metabolism during skin development. Sci Rep. 2017;7:13427. https:// doi. org/ 10. 1038/ s41598- 017- 13347-7.
36. Ahn JY, Tae HJ, Cho JH, et al. Activation of immediate-early response gene c-Fos protein in the rat paralimbic cortices after myocardial infarction. Neural Regen Res. 2015;10(8):1251–7. https:// doi. org/ 10. 4103/ 1673- 5374. 162757.
Page 12 of 12Zhang et al. BMC Cardiovasc Disord (2021) 21:344
• fast, convenient online submission
•
thorough peer review by experienced researchers in your field
• rapid publication on acceptance
• support for research data, including large and complex data types
•
gold Open Access which fosters wider collaboration and increased citations
maximum visibility for your research: over 100M website views per year •
At BMC, research is always in progress.
Learn more biomedcentral.com/submissions
Ready to submit your researchReady to submit your research ? Choose BMC and benefit from: ? Choose BMC and benefit from:
37. Roy RK, Augustine RA, Brown CH, et al. Activation of oxytocin neurons in the paraventricular nucleus drives cardiac sympathetic nerve activation following myocardial infarction in rats. Commun Biol. 2018;1:160. https:// doi. org/ 10. 1038/ s42003- 018- 0169-5.
38. Nagata T, Yasukawa H, Kyogoku S, et al. Cardiac-specific SOCS3 dele-tion prevents in vivo myocardial ischemia reperfusion injury through sustained activation of cardioprotective signaling molecules. PLoS ONE. 2015;10(5):e0127942. https:// doi. org/ 10. 1371/ journ al. pone. 01279 42.
39. Barrett TJ, Schlegel M, Zhou F, et al. Platelet regulation of myeloid sup-pressor of cytokine signaling 3 accelerates atherosclerosis. Sci Transl Med. 2019;11(517):eax0481. https:// doi. org/ 10. 1126/ scitr anslm ed. aax04 81.
40. Yasukawa H, Nagata T, Oba T, et al. SOCS3: a novel therapeutic target for cardioprotection. JAKSTAT. 2012;1(4):234–40. https:// doi. org/ 10. 4161/ jkst. 22435.
41. Thomas RL, Gustafsson ÅB. MCL1 is critical for mitochondrial function and autophagy in the heart. Autophagy. 2013;9(11):1902–3. https:// doi. org/ 10. 4161/ auto. 26168.
42. Zhao J, Jie Q, Li G, et al. Rac1 promotes the survival of H9c2 cells during serum deficiency targeting JNK/c-JUN/Cyclin-D1 and AKT2/MCL1 path-ways. Int J Med Sci. 2018;15(10):1062–71. https:// doi. org/ 10. 7150/ ijms. 25527.
43. Li X, Zhang N, Zhang Y, et al. E3 ligase Fbw7 participates in oxidative stress-induced myocardial cell injury via interacting with Mcl-1. Mol Med Rep. 2019;20(2):1561–8. https:// doi. org/ 10. 3892/ mmr. 2019. 10394.
Publisher’s NoteSpringer Nature remains neutral with regard to jurisdictional claims in pub-lished maps and institutional affiliations.
Qiang Zhang a doctor of Tianjin Medical University.
Yue Zheng a Ph.D. student in School of Medicine in Nankai University, Tianjin, China.
Tong Li a professor of Cardiology in Tianjin Medical University and Nankai University, and a Chief of cardiology in Tianjin Third Central Hospital.