‘knife crime’ a review of evidence and policy · pdf fileassessments of the...
TRANSCRIPT
‘Knife Crime’A review
of evidence and policy
Chris EadesRoger GrimshawArianna SilvestriEnver Solomon
second edition
Whose Justice? series

‘Knife Crime’A review
of evidence and policy
Chris EadesRoger GrimshawArianna SilvestriEnver Solomon
second edition
About the authorsChris Eades was policy and information officer at the Centre for Crime and JusticeStudies until March 2007. Roger Grimshaw is the Centre’s research director,Arianna Silvestri is the Centre’s policy and information intern, and Enver Solomonis the Centre’s deputy director.
Published by:Centre for Crime and Justice StudiesKing’s College LondonStrandLondon WC2R 2LS
Tel: 020 7848 1688Fax: 020 7848 1689www.crimeandjustice.org.uk
The Centre for Crime and Justice Studies at King’s College London is anindependent charity that informs and educates about all aspects of crime andcriminal justice. We provide information, produce research and carry out policyanalysis to encourage and facilitate an understanding of the complex nature ofissues concerning crime.
Registered Charity No. 251588A Company Limited by GuaranteeRegistered in England No. 496821© Centre for Crime and Justice Studies, December 2007
ISBN: 978-1-906003-06-7
Contents
Introduction 7
Chapter 1: What is the nature and extent of the problem? 9
Measures of crime; measures of ‘knife crime’ 9
Knife carrying 11
The use of knives in crime 14
Deaths caused by the use of knives 18
Chapter 2: Why carry or use a knife? 21
Chapter 3: Who does ‘knife crime’ affect most? 23
Young people 23
Those living in poverty 24
Black and minority ethnic communities 24
Chapter 4: Amnesties, prison sentences, education and prevention: what works for ‘knife crime’? 27
The national knife amnesty 27
Stop and search 28
Increased prison sentences 28
Education and awareness-raising 29
Prevention and the causes of crime 30
Conclusion 31

6 Centre for Crime and Justice Studies ‘Knife Crime’ A review of evidence and policy
Introduction
The Centre for Crime and Justice Studies (CCJS) first published this briefing paper inAugust 2006. It received widespread media coverage and a great deal of interest from thepolice, voluntary sector organisations and members of the public. Since publication therehave been around 4,000 downloads per month of the report from our website. We havetherefore decided to update the report to take account of developments over the last yearand to include the most recently published crime data. We have also carried out moredetailed statistical analysis to determine what trends, if any, can be established in the useof knives in crime in recent years.
There has continued to be a number of widely reported stabbing incidents, which has keptthe nation’s attention focused on knives and ‘knife crime’. In March 2007 there were fivefatal stabbings across the country reported in one week, the highest number in a seven-day period during the past year. In response, the Home Office announced plans toimprove the recording of knife use in crime. Yet relatively little detailed information existson ‘knife crime’ and knife carrying: who is committing it, who is suffering it, the reasonsfor it and what might be the best ways of reducing it. This review aims to draw togethersome of the existing information and research on these issues and makes tentativeassessments of the programmes in place to combat knife usage.
The paper begins by providing information from the available sources on the extent of theproblem as it pertains to different levels of seriousness: the carrying of knives; the use ofknives in crime; and the use of knives in homicides. It then investigates possible reasonsfor knife carrying before establishing which sections of the population are most likely tosuffer knife-related offences. Next, assessments are made of the current strategies beingconsidered or used to reduce levels of knife carrying and knife use. These include thenational knife amnesty, police stop and search, increased prison sentences, education andawareness-raising, and prevention strategies.
It is important to note that this report primarily relates to England and Wales, althoughthere is reference to research and knife amnesties in Scotland. There are interestingcomparisons to be made between different countries, and some are made with Scotland,but, in general, this report has not sought to provide international comparisons.
‘Knife Crime’ A review of evidence and policy Centre for Crime and Justice Studies 7
The current state of the law Laws restricting the sale, carrying, use and production of knives are contained in a number of pieces of legislation: the Prevention of Crime Act 1953, the Restriction ofOffensive Weapons Act 1959, the Criminal Justice Act 1988, the Public Order Act 1994,the Offensive Weapons Act 1996, the Knives Act 1997, the Criminal Justice Act 1988(as amended in 2004) and the more recent Violent Crime Reduction Act 2006.
The Prevention of Crime Act 1953 defines an offensive weapon as ‘any article made oradapted for use for causing injury to the person, or intended by the person having itwith him for such use by him or by some other person’. As the law now stands, it is anoffence to have an article with a blade or point in a school or public place without goodreason or lawful excuse, although an exception applies to folding pocket knives with ablade of less than three inches. Certain types of knives, such as flick knives, gravity
8 Centre for Crime and Justice Studies ‘Knife Crime’ A review of evidence and policy
1. A gravity knife is a knife thatuses gravity to deploy theblade. It normally consists of aroughly cylindrical handle witha hole in the front from whichthe blade deploys when abutton is pushed. The knifemust be held pointed downfor the blade to fall into place.
2. Replica samurai swords areto be added to the offensiveweapons order from April2008, meaning that their sale,hire and import is prohibited.The Home Office states thatapproximately 80 ‘seriouscrimes’ involving imitationsamurai swords have beencommitted in England andWales over the last four years.See Home Office (2007),Banning Offensive Weapons – A Consultation, London: HomeOffice, available at:http://www.homeoffice.gov.uk/documents/cons-ban-offensive-weapons-0307?view=Binary
knives1 and replica samurai swords2 have been banned outright. An officer of inspectorrank or above may, in certain circumstances, authorise police officers within a givenarea to stop and search for offensive weapons. The carrying of a knife while committinganother crime (such as burglary or theft) would be likely to result in a harsher sentence.
Prior to the most recent piece of legislation, an offender could be sentenced to amaximum of two years for carrying a knife in public and four years for carrying a knife ina school. The Violent Crime Reduction Act, which received Royal Assent on 8 November2006, has increased the penalty for possession of a knife in a public place without alawful reason to a maximum of four years. The Act has also:
• Raised the minimum age at which a young person can buy a knife from 16 to 18years of age.
• Introduced a power for head teachers and other members of staff in schools tosearch pupils for knives.
• Reduced the threshold for a police constable to enter a school and search thepremises and/or people from 'reasonable grounds for believing' to 'reasonablegrounds for suspecting' that weapons are held.
• Created a new offence of using another person to mind a weapon and included an aggravating factor in sentencing if the person involved is a child.

Chapter 1
What is the nature and extent of the problem?
‘Knife crime’ has become an expression commonly used by politicians and the media, butit is not always entirely clear what it actually is or what they actually mean when they usethe term. ‘Knife crime’ potentially encompasses a very broad range of offences and thuscauses problems in both the definition and determination of its prevalence. Clearly, theproduction of a knife in the commission of a crime, such as in a robbery or sexual assault,even if not used to cause injury, is a ‘knife crime’ under any interpretation. But it is lessclear whether the term may also be accurately applied to, for example, a burglary duringthe course of which the perpetrator is arrested and found to be in possession of a knifewhich was never produced or used. Whatever the meaning, the public and political debateabout ‘knife crime’ would benefit from both an attempt to define what is actually meant bythe term and a more careful, and less sensational, use of it. Disaggregating the offencesthat can be termed ‘knife crime’ (for example: offences in which an individual is stabbed;those in which a knife is used in a threatening manner; those in which a knife happens tobe in a person’s back pocket, etc.) would provide far greater clarity.
Much of the media reporting and political comment has been misleading, in part due tothe paucity of reliable information on the problem and in part due to the failure to presentknown facts accurately. For example, some newspaper articles have cited figures from theYouth Justice Board’s annual Youth Survey, conducted by the market research groupMORI, on the percentage of young people who have carried a knife in the year beforequestioning without also stating that such knife carrying may only have occurred once andthat most of those school pupils carried nothing more than a penknife, which is usuallylegal. Such inaccuracies are not confined to the press. The Metropolitan Police Service, inpublicising the national knife amnesty in 2006, released a statement that ‘52 teenagers arevictims of knife crime EVERY week in London’.3 What does ‘knife crime’ mean in thatsentence? It is easy to infer from such a statement that each of those 52 incidents of ‘knifecrime’ involves a stabbing. It must, however, be remembered that ‘knife crime’ will notnecessarily result in a physically harmed victim, although it may cause significant distressto the victim. Sensational statements increase public fear of crime beyond the actual riskand might, in the end, hinder rather than help the police.
Measures of crime; measures of ‘knife crime’In attempting to estimate the levels of knife-related offences, this report relies on anumber of official documents. But it must do so with a caveat: it is impossible to knowwith certainty how much knife carrying and how many knife-related offences there are. AsCCJS director, Richard Garside, in his analysis of crime statistics, noted:
‘Seeking a definitive figure for crime levels is akin to asking how many headaches thereare, or how many beetles. Though in principle, and given perfect knowledge, the questionis answerable, in practice no definitive answer is possible.’4
‘Knife Crime’ A review of evidence and policy Centre for Crime and Justice Studies 9
3. http://cms.met.police.uk/met/boroughs/hammersmith/04how_are_we_doing/news/operation_blunt_met_s_knife_amnesty
4. Garside, R. (2004), Crime,Persistent Offenders and theJustice Gap, London: Crimeand Society Foundation, p.10.
10 Centre for Crime and Justice Studies ‘Knife Crime’ A review of evidence and policy
Owing to the lack of specificity or focus on knife-related offences and the amount of other violent offences that go unmeasured and might involve the use of a knife, it is only possible to compare the underestimates from surveys and records.
In order to discern what can be established from the most comprehensive currentestimates, this paper relies predominantly on four official measures: the British CrimeSurvey (BCS); police recorded crime figures; and, for children and young people, theOffending, Crime and Justice Survey (OCJS) and the Youth Surveys commissioned by the Youth Justice Board and carried out by MORI (YJB–YS).
The BCS is an annual rolling survey currently based on a large sample of approximately47,000 people, having risen from a sample of almost 15,000 in 1997. The BCS asksindividuals living in private households in England and Wales and aged 16 and over abouttheir experience of victimisation by certain crimes over the course of the previous 12months. There are a number of crimes which the BCS has not routinely covered, includingdrug-dealing, homicide, sexual offences and crimes against children – all of which may or may not involve knife use. Those under 16 years old, homeless or living in institutions,for example, are not respondents, and so crime against them is not counted.
Police recorded crime figures are composed of a list of categories outlined in the HomeOffice counting rules, known as ‘notifiable offences’. It should be noted that policerecorded crime has undergone a number of changes since 1998. In particular, in April1998, many new offences were added, and the introduction of the National CrimeRecording Standard in 2002 had the effect of increasing recorded crime by 10 per centsimply through a change in recording practices. These changes notwithstanding, for manyreasons, most crimes go unreported to the police and fewer still are recorded. ‘Thus,recorded crime figures and trends are not reliable measures of ‘[real]’ crime rates andtrends.’5 In particular, it is important to note that it is currently not possible to identifyoffences involving the use of weapons, other than firearms, from national police recordedcrime statistics. This is rather surprising given the public and political attention given tothe issue in recent years. The government has made a commitment to address this, andfrom 2007–2008 onwards figures for attempted murder, serious wounding and robberyinvolving knives and other sharp instruments will be presented in police crime data. Inaddition, the Home Office is working with police on a pilot project involving accident andemergency departments sharing anonymised information on knife injuries in order toaddress the fact that a significant proportion of incidents will not be reported to the police.It is also encouraging the recording and reporting of knife-related incidents by schoolsand licensed premises.6
In 2005, the OCJS interviewed around 5,000 people aged between 10 and 25 living inprivate households in England and Wales about their involvement in various criminal and delinquent activities. Also in 2005, the YJB–YS surveyed 5,463 pupils in mainstreameducation aged 11 to 16.
Using all four measures, it is very difficult to make accurate and precise claims about the levels of knife carrying or the use of knives in violence. None include all possible knife-related offences. Although the BCS provides a more complete picture than policerecorded crime figures, one Home Office report estimated the real level of total offencesto be five to six times that recorded by the BCS.7 There may or may not in fact be six timesthe number of crimes involving a knife than recorded by the BCS. However, there arecertainly more because the BCS fails to include certain violent crimes and does notconsider victimisation experienced by certain population groups. The BCS can be used as a source of broad estimates of the frequency of knife-related offences across largesections of the population.
5. ibid
6. Home Affairs Committee(2007), Knife Crime: Oral andWritten Evidence, London:Stationery Office;Sivarajasingam, V., Shepherd,J., Walker, R., Walters, L. andMorgan, P. (2005), Trends inViolence in England and Wales2000–4. An Accident andEmergency Perspective, Cardiff:Cardiff University.
7. Brand, S. and Price, R.(2000), The Economic andSocial Costs of Crime, HomeOffice Research Study 217,London: Home Office.
‘Knife Crime’ A review of evidence and policy Centre for Crime and Justice Studies 11
Likewise, for similar reasons, the OCJS and YJB–YS do not provide an accurate picture.Furthermore, the smaller (though still large) sample sizes of these surveys compared tothe BCS and the lack of sufficient specific questions make precise assessment moredifficult. Estimations are all that are available. Moreover, limited trend analysis is possiblegiven the recent introduction of the Youth Surveys.
Bearing these flaws and caveats in mind, it is possible to identify some features of theunderlying problems associated with knives, some of the broad patterns of knife use andto assess what further needs to be better measured and understood.
Knife carryingKnife carrying is the most common form of knife-related offence but creates no specific orharmed victims until the knife is used. Knife carrying can be a precursor to knife use incrime and is thus a matter for concern but knife use and knife carrying rarely result in astabbing. A number of studies have looked at the prevalence of knife carrying but noneprovides a complete picture.
A study conducted in Scotland in 2000 found that, among 3,121 children aged between 11and 16 who completed a confidential questionnaire, 12 per cent claimed to have carried asharp instrument (referred to as a ‘blade’ and including knives, razors, machetes andswords) as a weapon at some stage in their lives. However, the study says nothing aboutthe frequency of knife carrying, a matter of some importance, and respondents mightbriefly have carried a knife only once in their lives.
The YJB Youth Surveys, conducted by the market research group MORI, have providedinformation on knife carrying amongst school children in England and Wales from 1999 to2005. In the most recent survey, conducted in 2005, 5,463 pupils aged 11 to 16 years oldwere questioned. It found that 32 per cent of the children said they had carried a knife inthe last 12 months.
According to an analysis carried out by MORI of trends in the data for the five years to2005 there has been a notable increase in knife carrying among school children in recentyears. It states that for specific violent offences ‘the greatest increase is evidence for theoffences of “hurting somebody without the requirement for medical attention”… and“carrying a knife” (plus 12 percentage points since 2002)’.8 However, the analysis fails tohighlight that the wording of the question related to knife carrying in the survey changedin the 2003 questionnaire and therefore, as explained in the 2004 Youth Survey, thefindings are not directly comparable between 2002 and subsequent years. The 2004 YouthSurvey states:
‘The wording of this category changed in the 2003 questionnaire, so the findings are not directly comparable year on year. In the 2002 survey, this was worded as “carried a weapon other than a knife (e.g. a stick) to use to defend yourself or to attack other people”.’
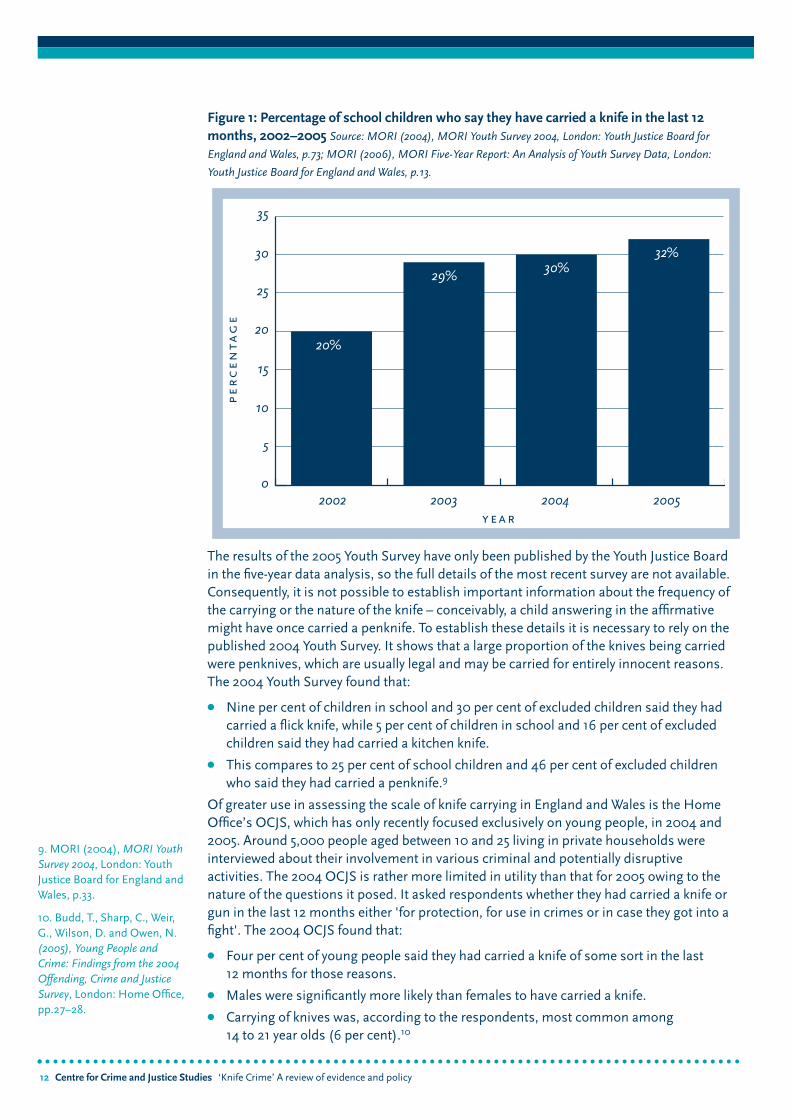
The apparent dramatic rise reported in the MORI five-year trend analysis should thereforebe treated with considerable caution. As Figure 1 shows, since the questionnaire wordingwas amended in 2003, the proportion of children who say they have carried a knife hasremained stable.
8. MORI (2006), MORI Five-Year Report: An Analysis ofYouth Survey Data, London:Youth Justice Board forEngland and Wales, p.13.
12 Centre for Crime and Justice Studies ‘Knife Crime’ A review of evidence and policy
Figure 1: Percentage of school children who say they have carried a knife in the last 12months, 2002–2005 Source: MORI (2004), MORI Youth Survey 2004, London: Youth Justice Board for
England and Wales, p.73; MORI (2006), MORI Five-Year Report: An Analysis of Youth Survey Data, London:
Youth Justice Board for England and Wales, p.13.
The results of the 2005 Youth Survey have only been published by the Youth Justice Boardin the five-year data analysis, so the full details of the most recent survey are not available.Consequently, it is not possible to establish important information about the frequency ofthe carrying or the nature of the knife – conceivably, a child answering in the affirmativemight have once carried a penknife. To establish these details it is necessary to rely on thepublished 2004 Youth Survey. It shows that a large proportion of the knives being carriedwere penknives, which are usually legal and may be carried for entirely innocent reasons.The 2004 Youth Survey found that:
• Nine per cent of children in school and 30 per cent of excluded children said they hadcarried a flick knife, while 5 per cent of children in school and 16 per cent of excludedchildren said they had carried a kitchen knife.
• This compares to 25 per cent of school children and 46 per cent of excluded childrenwho said they had carried a penknife.9
Of greater use in assessing the scale of knife carrying in England and Wales is the HomeOffice’s OCJS, which has only recently focused exclusively on young people, in 2004 and2005. Around 5,000 people aged between 10 and 25 living in private households wereinterviewed about their involvement in various criminal and potentially disruptiveactivities. The 2004 OCJS is rather more limited in utility than that for 2005 owing to thenature of the questions it posed. It asked respondents whether they had carried a knife orgun in the last 12 months either 'for protection, for use in crimes or in case they got into afight'. The 2004 OCJS found that:
• Four per cent of young people said they had carried a knife of some sort in the last 12 months for those reasons.
• Males were significantly more likely than females to have carried a knife.
• Carrying of knives was, according to the respondents, most common among 14 to 21 year olds (6 per cent).10
9. MORI (2004), MORI YouthSurvey 2004, London: YouthJustice Board for England andWales, p.33.
10. Budd, T., Sharp, C., Weir,G., Wilson, D. and Owen, N.(2005), Young People andCrime: Findings from the 2004Offending, Crime and JusticeSurvey, London: Home Office,pp.27–28.
pe
rc
en
tag
e
year
k
0
5
10
15
20
25
30
35
2002 2003 2004 2005
20%
29%30%
32%
‘Knife Crime’ A review of evidence and policy Centre for Crime and Justice Studies 13
It is important to note, however, that questions did not specify the type of knife carried andrespondents were not asked whether they had used a knife to threaten or harm someone.
The 2005 OCJS sought to rectify these omissions asking, for the first time, for more detailsabout carrying knives. These included the type of knife usually carried, the main reason forcarrying a knife, whether it had been used to threaten someone and whether it had beenused to injure someone. The survey found that:
• Four per cent of respondents had carried a knife in the previous 12 months.11
• Carrying of knives was most common amongst 16 to 17 year olds (7 per cent).
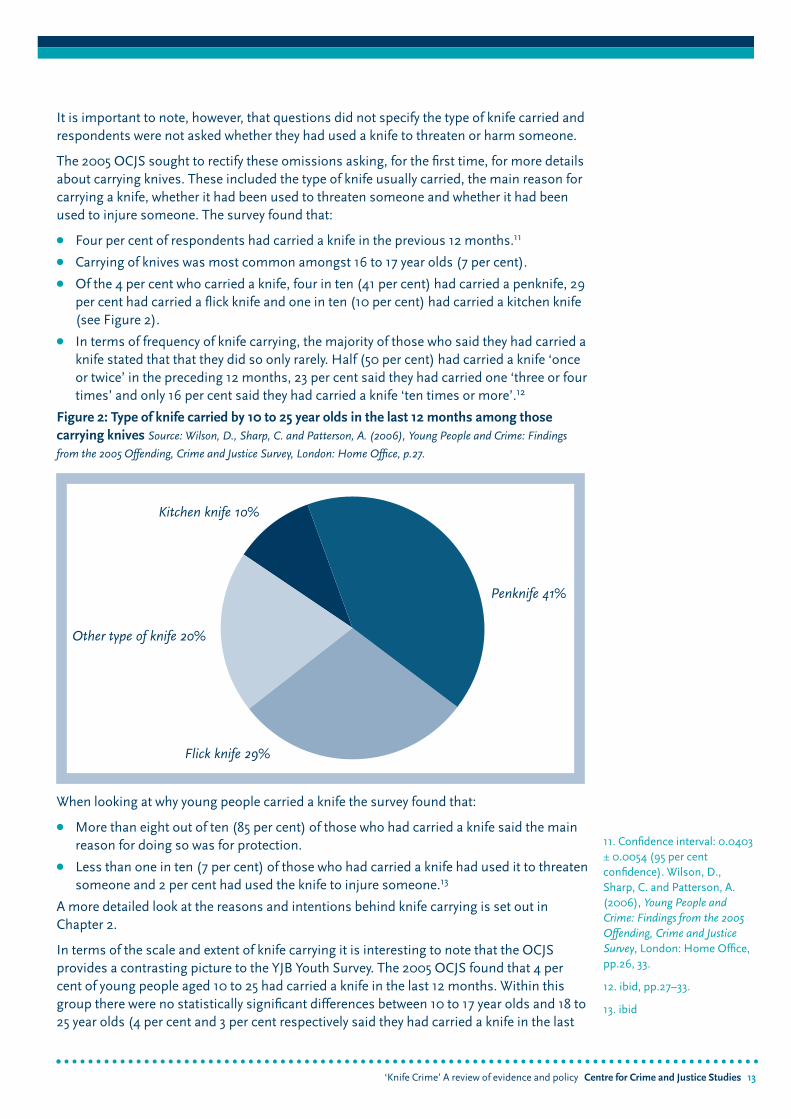
• Of the 4 per cent who carried a knife, four in ten (41 per cent) had carried a penknife, 29per cent had carried a flick knife and one in ten (10 per cent) had carried a kitchen knife(see Figure 2).
• In terms of frequency of knife carrying, the majority of those who said they had carried aknife stated that that they did so only rarely. Half (50 per cent) had carried a knife ‘onceor twice’ in the preceding 12 months, 23 per cent said they had carried one ‘three or fourtimes’ and only 16 per cent said they had carried a knife ‘ten times or more’.12
Figure 2: Type of knife carried by 10 to 25 year olds in the last 12 months among thosecarrying knives Source: Wilson, D., Sharp, C. and Patterson, A. (2006), Young People and Crime: Findings
from the 2005 Offending, Crime and Justice Survey, London: Home Office, p.27.
When looking at why young people carried a knife the survey found that:
• More than eight out of ten (85 per cent) of those who had carried a knife said the mainreason for doing so was for protection.
• Less than one in ten (7 per cent) of those who had carried a knife had used it to threatensomeone and 2 per cent had used the knife to injure someone.13
A more detailed look at the reasons and intentions behind knife carrying is set out inChapter 2.
In terms of the scale and extent of knife carrying it is interesting to note that the OCJSprovides a contrasting picture to the YJB Youth Survey. The 2005 OCJS found that 4 percent of young people aged 10 to 25 had carried a knife in the last 12 months. Within thisgroup there were no statistically significant differences between 10 to 17 year olds and 18 to25 year olds (4 per cent and 3 per cent respectively said they had carried a knife in the last
11. Confidence interval: 0.0403± 0.0054 (95 per centconfidence). Wilson, D.,Sharp, C. and Patterson, A.(2006), Young People andCrime: Findings from the 2005Offending, Crime and JusticeSurvey, London: Home Office,pp.26, 33.
12. ibid, pp.27–33.
13. ibid
Penknife 41%
Flick knife 29%
Other type of knife 20%
Kitchen knife 10%
p
kn
ife
ca
rr
yin
gp
er
ce
nta
ge
0
10
20
30
40
50
60
70
80
Children in school Excluded children
Victims of crime Non-victims
0
12 months).14 This diverges sharply from the 2005 Youth Survey of schoolchildren, whichfound that 32 per cent had carried a knife in the previous year. However, although theyprovide a useful comparison, the two surveys are not directly comparable because of thedifferent methodology used and the age groups included in each survey.
In comparison with the YJB Youth Survey and the OCJS, police recorded crime figures shedeven less light on the extent and scale of knife carrying. As already noted, the police haveonly started collecting data on the use of knives in certain offences in recent months andthese data have not yet been published. However, police data on weapons possession,which include firearms and various hitting instruments as well as knives, show a year onyear decline. There was a 2 per cent drop in offences of possession of a weapon, from35,590 in 2005–2006 to 34,707 in 2006–2007.15 It is not possible to know from thesefigures how these trends correlate with knife carrying. Furthermore, police recorded crimefigures are, by definition, only able to shed light on offences that have been recorded by thepolice; they cannot shed any light on how many crimes went unreported, or even on thosethat were reported but not recorded. Since proportionately very few incidents of knifecarrying are likely to come to the attention of the police, police recorded crime figures are not very useful in assessing with any precision the extent of knife carrying.
A Home Office report noted in 2003 that ‘[t]here is relatively little evidence as to the extentof knife-carrying, but there are some indications that it is by no means unusual, especiallyamong young men’.16 The available evidence has increased in volume since that time, butthis area still suffers from a lack of useful, specific, reliable, longitudinal research on thenature, extent, cause, motivation, frequency and possible growth of knife carrying. Withoutsuch research, designing and implementing programmes to reduce the incidence of knifecarrying will be difficult. It is important to note too that most of the published researchrelies on self-reporting by young people in questionnaires and is thus open to concealed or exaggerated statements of involvement. It is hoped that the quality of these surveys asthey pertain to knife carrying will improve with a wider range of, and greater specificity in,questions. More focus on frequency of carrying and motivation would be helpful. Onlywith improvements will a more accurate picture of the extent of the problem be available.
The use of knives in crimeWhile the carrying of a knife may well be legal and innocuous, the use of knives in violentcrime attracts greater concern. In considering ‘violent crime’ it is important to rememberthat, according to the 2006–2007 BCS, just under half of violent offences did not result in an injury to the victim and only 12 per cent of victims of BCS violent incidents receivedmedical attention.17 Similarly, knife use most commonly involves threats, rather thanphysical violence. Threats can cause significant distress to the victim, but are generallyless serious than a stabbing and are not specifically covered by the BCS.
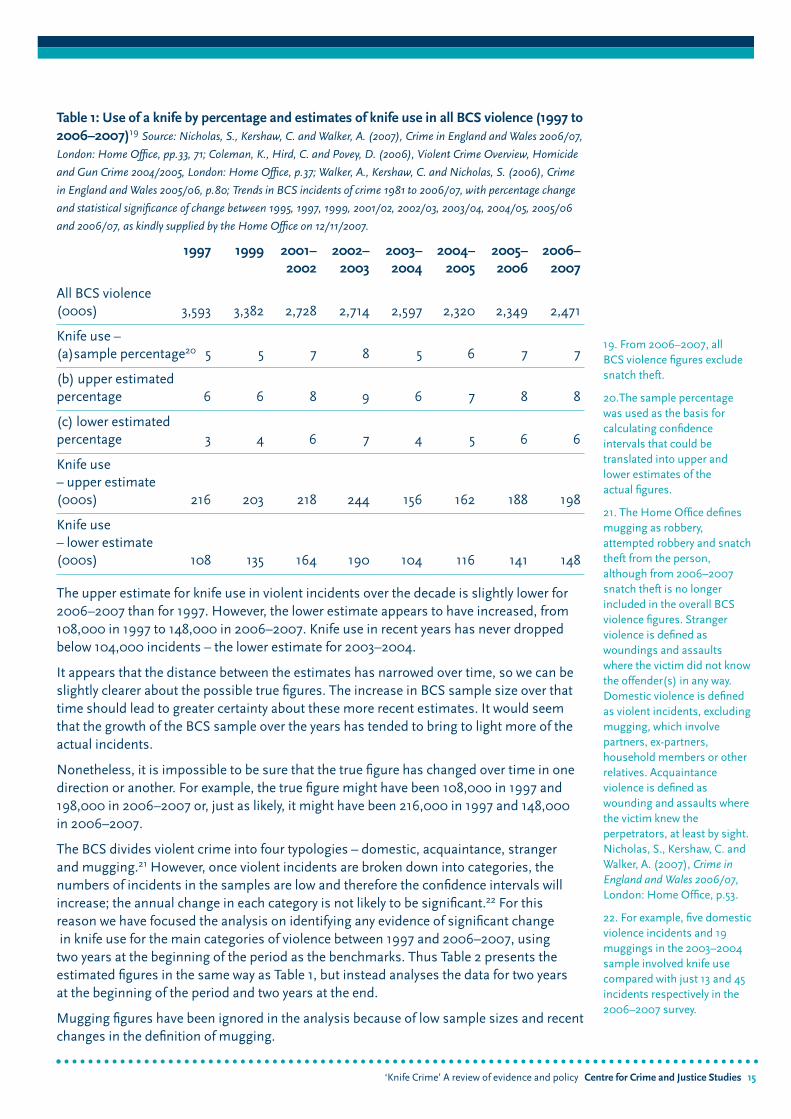
Table 1 shows the numbers for all violent incidents estimated on the basis of the samplefigures in the BCS, for the period 1997 to 2006-2007, with the percentage for knife usederived from that sample. The upper and lower estimates for knife use are then calculatedstatistically, using the confidence intervals for the percentage in the sample. This meansthat the true figure lies somewhere between these estimates.18 As a result, it is possible todraw a limited number of conclusions.
14 Centre for Crime and Justice Studies ‘Knife Crime’ A review of evidence and policy
14. ibid, p.33.
15.Nicholas, S., Kershaw, C.and Walker, A. (2007), Crime inEngland and Wales 2006/07,London: Home Office, p.57.
16. Brookman, F. andMaguire, M. (2003), ReducingHomicide: A Review of thePossibilities, Home OfficeOnline Report 01/03, p.33.
17. Nicholas, S., Kershaw, C.and Walker, A. (2007), Crime inEngland and Wales 2006/07,London: Home Office, p.62.
18. The confidence intervalmeasures the confidence thatcan be placed in the sampleproportion if that proportionis applied to the population, inthis case, of violent incidentsestimated by the BCS to occurin the year. It is calculated insuch a way that the true figurecan be assumed to lie insidethe interval with a statisticalprobability of 95 per cent.
‘Knife Crime’ A review of evidence and policy Centre for Crime and Justice Studies 15
Table 1: Use of a knife by percentage and estimates of knife use in all BCS violence (1997 to2006–2007)19 Source: Nicholas, S., Kershaw, C. and Walker, A. (2007), Crime in England and Wales 2006/07,
London: Home Office, pp.33, 71; Coleman, K., Hird, C. and Povey, D. (2006), Violent Crime Overview, Homicide
and Gun Crime 2004/2005, London: Home Office, p.37; Walker, A., Kershaw, C. and Nicholas, S. (2006), Crime
in England and Wales 2005/06, p.80; Trends in BCS incidents of crime 1981 to 2006/07, with percentage change
and statistical significance of change between 1995, 1997, 1999, 2001/02, 2002/03, 2003/04, 2004/05, 2005/06
and 2006/07, as kindly supplied by the Home Office on 12/11/2007.
1997 1999 2001– 2002– 2003– 2004– 2005– 2006–2002 2003 2004 2005 2006 2007
All BCS violence (000s) 3,593 3,382 2,728 2,714 2,597 2,320 2,349 2,471
Knife use – (a)sample percentage20 5 5 7 8 5 6 7 7
(b) upper estimated percentage 6 6 8 9 6 7 8 8
(c) lower estimated percentage 3 4 6 7 4 5 6 6
Knife use– upper estimate(000s) 216 203 218 244 156 162 188 198
Knife use– lower estimate(000s) 108 135 164 190 104 116 141 148
The upper estimate for knife use in violent incidents over the decade is slightly lower for2006–2007 than for 1997. However, the lower estimate appears to have increased, from108,000 in 1997 to 148,000 in 2006–2007. Knife use in recent years has never droppedbelow 104,000 incidents – the lower estimate for 2003–2004.
It appears that the distance between the estimates has narrowed over time, so we can beslightly clearer about the possible true figures. The increase in BCS sample size over thattime should lead to greater certainty about these more recent estimates. It would seemthat the growth of the BCS sample over the years has tended to bring to light more of theactual incidents.
Nonetheless, it is impossible to be sure that the true figure has changed over time in onedirection or another. For example, the true figure might have been 108,000 in 1997 and198,000 in 2006–2007 or, just as likely, it might have been 216,000 in 1997 and 148,000 in 2006–2007.
The BCS divides violent crime into four typologies – domestic, acquaintance, stranger and mugging.21 However, once violent incidents are broken down into categories, thenumbers of incidents in the samples are low and therefore the confidence intervals willincrease; the annual change in each category is not likely to be significant.22 For thisreason we have focused the analysis on identifying any evidence of significant changein knife use for the main categories of violence between 1997 and 2006–2007, using two years at the beginning of the period as the benchmarks. Thus Table 2 presents theestimated figures in the same way as Table 1, but instead analyses the data for two years at the beginning of the period and two years at the end.
Mugging figures have been ignored in the analysis because of low sample sizes and recentchanges in the definition of mugging.
19. From 2006–2007, all BCS violence figures excludesnatch theft.
20.The sample percentage was used as the basis forcalculating confidenceintervals that could betranslated into upper andlower estimates of the actual figures.
21. The Home Office definesmugging as robbery,attempted robbery and snatchtheft from the person,although from 2006–2007snatch theft is no longerincluded in the overall BCSviolence figures. Strangerviolence is defined aswoundings and assaultswhere the victim did not knowthe offender(s) in any way.Domestic violence is definedas violent incidents, excludingmugging, which involvepartners, ex-partners,household members or otherrelatives. Acquaintanceviolence is defined aswounding and assaults wherethe victim knew theperpetrators, at least by sight.Nicholas, S., Kershaw, C. andWalker, A. (2007), Crime inEngland and Wales 2006/07,London: Home Office, p.53.
22. For example, five domesticviolence incidents and 19muggings in the 2003–2004sample involved knife usecompared with just 13 and 45incidents respectively in the2006–2007 survey.
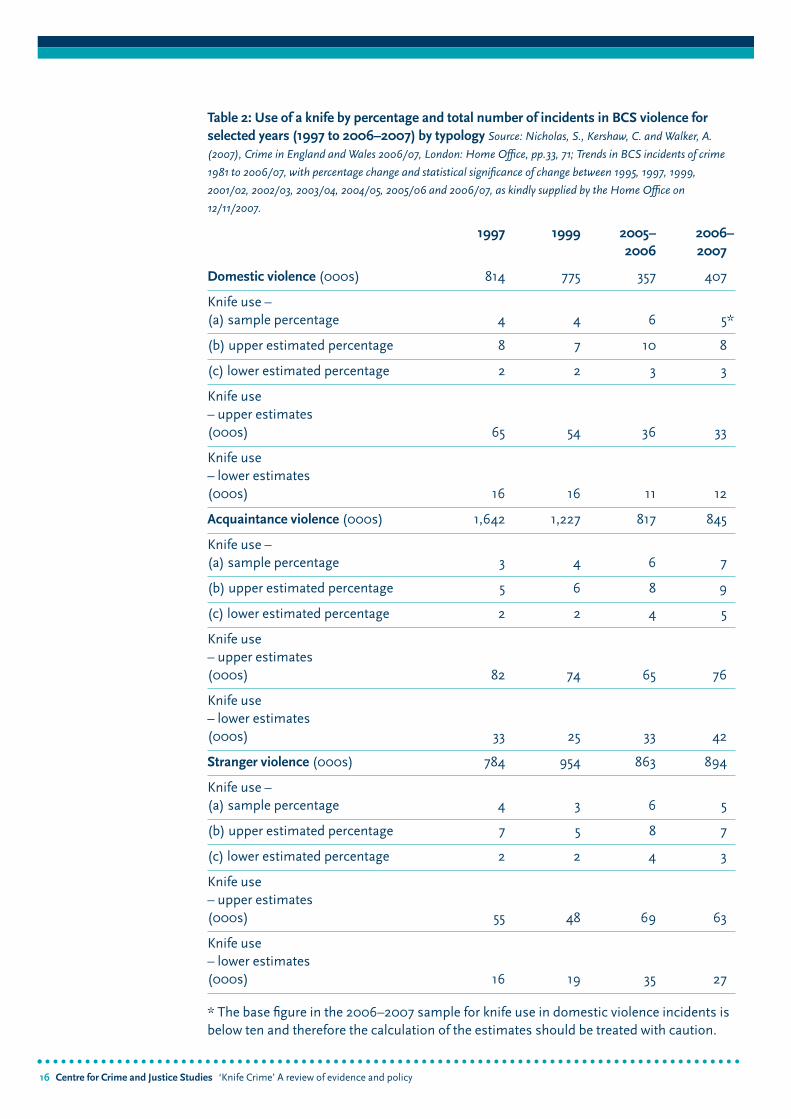
Table 2: Use of a knife by percentage and total number of incidents in BCS violence forselected years (1997 to 2006–2007) by typology Source: Nicholas, S., Kershaw, C. and Walker, A.
(2007), Crime in England and Wales 2006/07, London: Home Office, pp.33, 71; Trends in BCS incidents of crime
1981 to 2006/07, with percentage change and statistical significance of change between 1995, 1997, 1999,
2001/02, 2002/03, 2003/04, 2004/05, 2005/06 and 2006/07, as kindly supplied by the Home Office on
12/11/2007.
1997 1999 2005– 2006–2006 2007
Domestic violence (000s) 814 775 357 407
Knife use –(a) sample percentage 4 4 6 5*
(b) upper estimated percentage 8 7 10 8
(c) lower estimated percentage 2 2 3 3
Knife use– upper estimates(000s) 65 54 36 33
Knife use– lower estimates(000s) 16 16 11 12
Acquaintance violence (000s) 1,642 1,227 817 845
Knife use –(a) sample percentage 3 4 6 7
(b) upper estimated percentage 5 6 8 9
(c) lower estimated percentage 2 2 4 5
Knife use– upper estimates(000s) 82 74 65 76
Knife use– lower estimates(000s) 33 25 33 42
Stranger violence (000s) 784 954 863 894
Knife use –(a) sample percentage 4 3 6 5
(b) upper estimated percentage 7 5 8 7
(c) lower estimated percentage 2 2 4 3
Knife use– upper estimates(000s) 55 48 69 63
Knife use– lower estimates(000s) 16 19 35 27
* The base figure in the 2006–2007 sample for knife use in domestic violence incidents isbelow ten and therefore the calculation of the estimates should be treated with caution.
16 Centre for Crime and Justice Studies ‘Knife Crime’ A review of evidence and policy
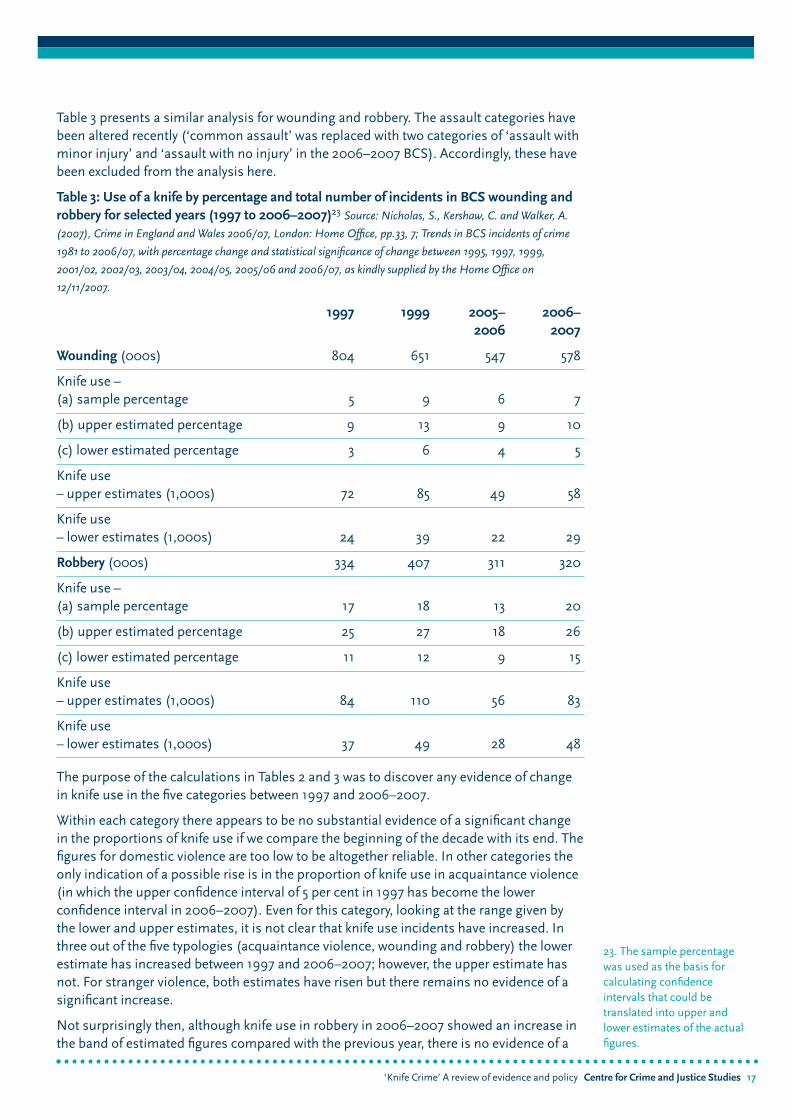
Table 3 presents a similar analysis for wounding and robbery. The assault categories havebeen altered recently (‘common assault’ was replaced with two categories of ‘assault withminor injury’ and ‘assault with no injury’ in the 2006–2007 BCS). Accordingly, these havebeen excluded from the analysis here.
Table 3: Use of a knife by percentage and total number of incidents in BCS wounding androbbery for selected years (1997 to 2006–2007)23 Source: Nicholas, S., Kershaw, C. and Walker, A.
(2007), Crime in England and Wales 2006/07, London: Home Office, pp.33, 7; Trends in BCS incidents of crime
1981 to 2006/07, with percentage change and statistical significance of change between 1995, 1997, 1999,
2001/02, 2002/03, 2003/04, 2004/05, 2005/06 and 2006/07, as kindly supplied by the Home Office on
12/11/2007.
1997 1999 2005– 2006–2006 2007
Wounding (000s) 804 651 547 578
Knife use –(a) sample percentage 5 9 6 7
(b) upper estimated percentage 9 13 9 10
(c) lower estimated percentage 3 6 4 5
Knife use– upper estimates (1,000s) 72 85 49 58
Knife use– lower estimates (1,000s) 24 39 22 29
Robbery (000s) 334 407 311 320
Knife use –(a) sample percentage 17 18 13 20
(b) upper estimated percentage 25 27 18 26
(c) lower estimated percentage 11 12 9 15
Knife use – upper estimates (1,000s) 84 110 56 83
Knife use– lower estimates (1,000s) 37 49 28 48
The purpose of the calculations in Tables 2 and 3 was to discover any evidence of changein knife use in the five categories between 1997 and 2006–2007.
Within each category there appears to be no substantial evidence of a significant changein the proportions of knife use if we compare the beginning of the decade with its end. Thefigures for domestic violence are too low to be altogether reliable. In other categories theonly indication of a possible rise is in the proportion of knife use in acquaintance violence(in which the upper confidence interval of 5 per cent in 1997 has become the lowerconfidence interval in 2006–2007). Even for this category, looking at the range given bythe lower and upper estimates, it is not clear that knife use incidents have increased. Inthree out of the five typologies (acquaintance violence, wounding and robbery) the lowerestimate has increased between 1997 and 2006–2007; however, the upper estimate hasnot. For stranger violence, both estimates have risen but there remains no evidence of asignificant increase.
Not surprisingly then, although knife use in robbery in 2006–2007 showed an increase inthe band of estimated figures compared with the previous year, there is no evidence of a
‘Knife Crime’ A review of evidence and policy Centre for Crime and Justice Studies 17
23. The sample percentagewas used as the basis forcalculating confidenceintervals that could betranslated into upper andlower estimates of the actualfigures.
18 Centre for Crime and Justice Studies ‘Knife Crime’ A review of evidence and policy
24. MORI (2004), MORI YouthSurvey 2004, London: YouthJustice Board for England andWales, p.32.
25. Wilson, D., Sharp, C. andPatterson, A. (2006), YoungPeople and Crime: Findingsfrom the 2005 Offending, Crimeand Justice Survey, London:Home Office, p.27.
26. ibid
27. ibid, p.91.
28. Francis, B., Barry, J.,Bowater, R., Miller, N.,Soothill, K. and Ackerley, E.(2004), Using Homicide Datato Assist Murder Investigations,Home Office Online Report26/04, p.12.
29. Brookman, F. andMaguire, M. (2003), ReducingHomicide: A Review of thePossibilities, Home OfficeOnline Report 01/03, p.36.
30. ibid
31. Leyland, A. (2006),‘Homicides involving knivesand other sharp objects inScotland, 1981–2003’, Journalof Public Health, Vol. 28, No. 2,pp.145–147.
32. Brookman, F. andMaguire, M. (2003), ReducingHomicide: A Review of thePossibilities, Home OfficeOnline Report 01/03, p.3.
significant increase between these two years or over the previous decade. Moreover, as theconfidence intervals are very wide, it is hard to draw any conclusions about a true figure.This applies to all typologies in the years selected.
In reviewing the analysis of the BCS figures we can conclude that an accurate pictureshowing the extent of any changes over time fails to emerge. What we can say is that thebroad estimates provide a guide to the scale, extent and regularity of knife use incidentsover recent years. Instead of a series of precise annual measures, we arrive at bands ofestimated figures, changing each year, within which more accurate measures are needed.
Turning to look at what is known about the use of knives by children in crime, it isnecessary to look at both the MORI Youth Survey for the YJB and the OCJS. For those 11 to16 year olds questioned in the YJB Youth Survey, the use of knives in crime seems to berelatively rare. The 2004 survey shows that:
• Three per cent of children in school and 14 per cent of excluded children said they had‘used a weapon against another person’.
• Three per cent of children in school and 21 per cent of excluded children said they had‘threatened another person with a weapon’.24
The weapons referred to here are as likely to be blunt instruments as knives and moredetailed information is needed.
For young people more broadly, the OCJS provides information for 10 to 25 year olds. Asalready noted, the 2005 OCJS found that of the 4 per cent of respondents who admitted tohaving carried a knife in the 12 months prior to questioning, less than one in ten (7 percent) said they had used the knife to threaten.25
According to the available information, the use of knives by young people to injure alsoseems rare. The 2005 OCJS found that only 2 per cent of those who said they had carried aknife during the previous 12 months said that they had used that knife to injure.26 The self-report survey also found that, specifically in relation to assaults that resulted in injury, only1 per cent of respondents said they had ‘knifed or stabbed’ their victim.27
More details about levels of victimisation of children and young people are set out inChapter 3.
Deaths caused by the use of knivesAccording to one Home Office analysis of the Homicide Index (a record of all suspectedhomicides occurring in England and Wales), 37.9 per cent of victims were killed using a‘sharp instrument’ between 1995 and 2000 – by far the single largest category of methodof homicide.28 Of course, sharp instruments might include bottles, glass, screwdriversand the like, but it is thought that knives make up the majority of that figure.29 Figures forhomicides caused solely by the use of knives are not available.
The use of sharp instruments in homicides in Scotland is even greater – during the 20-year period from 1979 to 1998 they were used in 40 per cent of all recorded homicides.30
According to a recent study by the Medical Research Council’s Social and Public HealthSciences Unit in Glasgow, between 1981 and 2003, the overall murder rate in Scotlandincreased by 83 per cent and murder with knives increased by 164 per cent. During thistime almost half (47 per cent) of all murders involved knives.31
The figures for sharp instrument homicides in England and Wales are not quite so bleak.The homicide figures for England and Wales have been rising steadily since the earlysixties. Between 1980 and 1984 there were 2,624; between 1995 and 1999 that number hadrisen to 3,176.32 Although the general trend for the number of homicides has been upward,
‘Knife Crime’ A review of evidence and policy Centre for Crime and Justice Studies 19
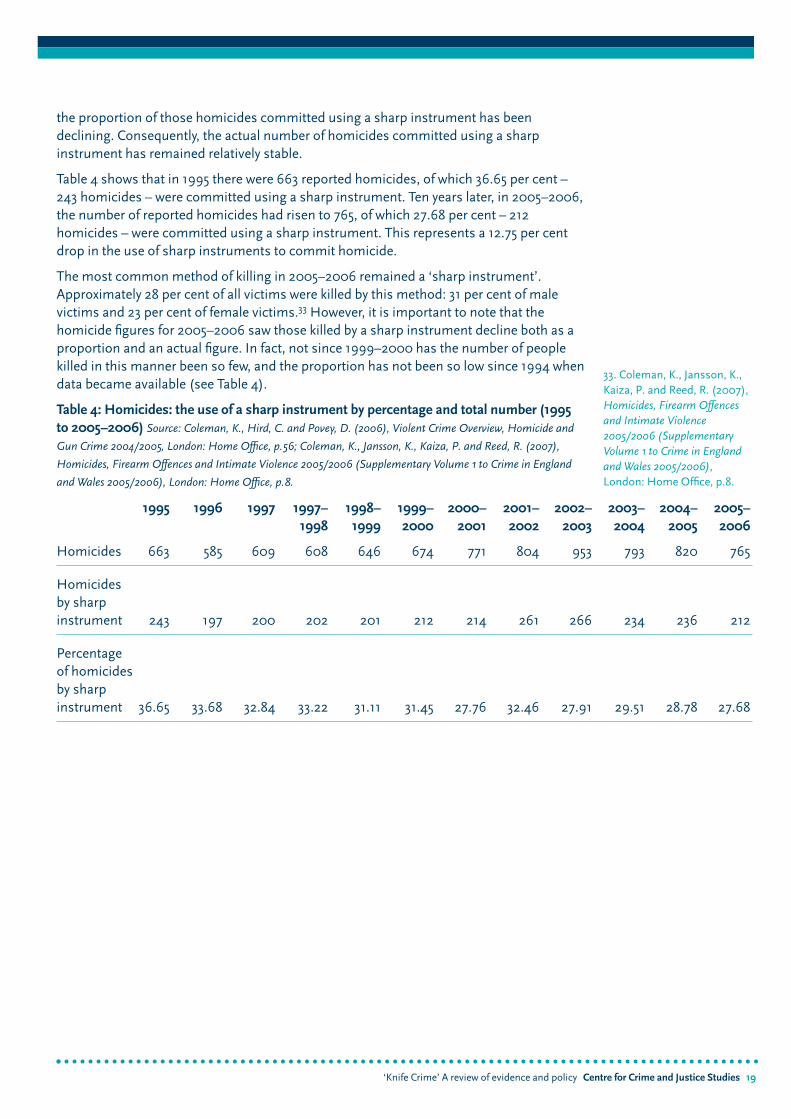
the proportion of those homicides committed using a sharp instrument has beendeclining. Consequently, the actual number of homicides committed using a sharpinstrument has remained relatively stable.
Table 4 shows that in 1995 there were 663 reported homicides, of which 36.65 per cent –243 homicides – were committed using a sharp instrument. Ten years later, in 2005–2006,the number of reported homicides had risen to 765, of which 27.68 per cent – 212homicides – were committed using a sharp instrument. This represents a 12.75 per centdrop in the use of sharp instruments to commit homicide.
The most common method of killing in 2005–2006 remained a ‘sharp instrument’.Approximately 28 per cent of all victims were killed by this method: 31 per cent of malevictims and 23 per cent of female victims.33 However, it is important to note that thehomicide figures for 2005–2006 saw those killed by a sharp instrument decline both as aproportion and an actual figure. In fact, not since 1999–2000 has the number of peoplekilled in this manner been so few, and the proportion has not been so low since 1994 whendata became available (see Table 4).
Table 4: Homicides: the use of a sharp instrument by percentage and total number (1995to 2005–2006) Source: Coleman, K., Hird, C. and Povey, D. (2006), Violent Crime Overview, Homicide and
Gun Crime 2004/2005, London: Home Office, p.56; Coleman, K., Jansson, K., Kaiza, P. and Reed, R. (2007),
Homicides, Firearm Offences and Intimate Violence 2005/2006 (Supplementary Volume 1 to Crime in England
and Wales 2005/2006), London: Home Office, p.8.
33. Coleman, K., Jansson, K.,Kaiza, P. and Reed, R. (2007),Homicides, Firearm Offencesand Intimate Violence2005/2006 (SupplementaryVolume 1 to Crime in Englandand Wales 2005/2006),London: Home Office, p.8.
1995 1996 1997 1997– 1998– 1999– 2000– 2001– 2002– 2003– 2004– 2005–1998 1999 2000 2001 2002 2003 2004 2005 2006
Homicides 663 585 609 608 646 674 771 804 953 793 820 765
Homicides by sharp instrument 243 197 200 202 201 212 214 261 266 234 236 212
Percentage of homicides by sharp instrument 36.65 33.68 32.84 33.22 31.11 31.45 27.76 32.46 27.91 29.51 28.78 27.68

20 Centre for Crime and Justice Studies ‘Knife Crime’ A review of evidence and policy

‘Knife Crime’ A review of evidence and policy Centre for Crime and Justice Studies 21
Chapter 2
Why carry or use a knife?
There is little information available on the motivations for knife carrying and, as can be seen from the media reporting, much is anecdotal and provided by youth workers,teachers and other professionals. Without definitive information it is very difficult indeed to make any serious attempt to reduce the practice.
Once again, the YJB Youth Survey and the OCJS provide the best available data. Bothsurveys show that insecurity and protection are key factors in knife carrying among youngpeople. The 2004 YJB Youth Survey found that 2 per cent of the children in schoolsurveyed and 10 per cent of excluded children had ‘taken a weapon to school to defend[themselves]’.34 More tellingly, the same survey found that children who have been thevictim of a crime are more likely to carry a knife than those who have not been a victim:
• Among children in school, double the number who claimed to have been a victim ofcrime carried a knife compared to those who had claimed not to have experiencedvictimisation – 36 per cent compared with 18 per cent (see Figure 3).
• Among excluded children, 62 per cent who had been a victim of a crime carried a knifecompared with 51 per cent who had not been a victim35 (see Figure 3).
Figure 3: Knife carrying by self-reported victims of crime versus non-victims Source: MORI (2004), MORI Youth Survey 2004, London: Youth Justice Board for England and Wales.
34. MORI (2004), MORI YouthSurvey 2004, London: YouthJustice Board for England andWales, p.32.
35. ibid, p.34.
Penknife 41%
F
Kitchen knife 10%
p
kn
ife
ca
rr
yin
gp
er
ce
nta
ge
0
10
20
30
40
50
60
70
80
Children in school Excluded children
Victims of crime Non-victims
0
22 Centre for Crime and Justice Studies ‘Knife Crime’ A review of evidence and policy
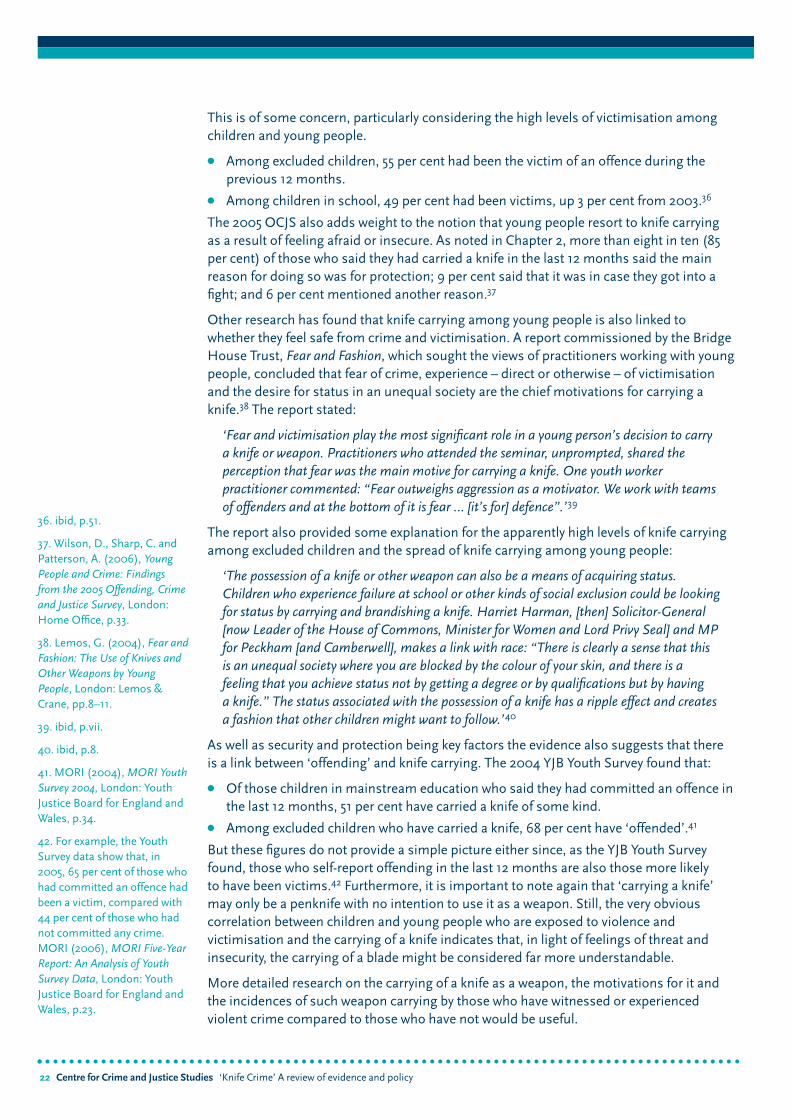
This is of some concern, particularly considering the high levels of victimisation amongchildren and young people.
• Among excluded children, 55 per cent had been the victim of an offence during theprevious 12 months.
• Among children in school, 49 per cent had been victims, up 3 per cent from 2003.36
The 2005 OCJS also adds weight to the notion that young people resort to knife carryingas a result of feeling afraid or insecure. As noted in Chapter 2, more than eight in ten (85per cent) of those who said they had carried a knife in the last 12 months said the mainreason for doing so was for protection; 9 per cent said that it was in case they got into afight; and 6 per cent mentioned another reason.37
Other research has found that knife carrying among young people is also linked towhether they feel safe from crime and victimisation. A report commissioned by the BridgeHouse Trust, Fear and Fashion, which sought the views of practitioners working with youngpeople, concluded that fear of crime, experience – direct or otherwise – of victimisationand the desire for status in an unequal society are the chief motivations for carrying a knife.38 The report stated:
‘Fear and victimisation play the most significant role in a young person’s decision to carrya knife or weapon. Practitioners who attended the seminar, unprompted, shared theperception that fear was the main motive for carrying a knife. One youth workerpractitioner commented: “Fear outweighs aggression as a motivator. We work with teamsof offenders and at the bottom of it is fear … [it’s for] defence”.’39
The report also provided some explanation for the apparently high levels of knife carryingamong excluded children and the spread of knife carrying among young people:
‘The possession of a knife or other weapon can also be a means of acquiring status.Children who experience failure at school or other kinds of social exclusion could be lookingfor status by carrying and brandishing a knife. Harriet Harman, [then] Solicitor-General[now Leader of the House of Commons, Minister for Women and Lord Privy Seal] and MPfor Peckham [and Camberwell], makes a link with race: “There is clearly a sense that thisis an unequal society where you are blocked by the colour of your skin, and there is afeeling that you achieve status not by getting a degree or by qualifications but by having a knife.” The status associated with the possession of a knife has a ripple effect and createsa fashion that other children might want to follow.’40
As well as security and protection being key factors the evidence also suggests that thereis a link between ‘offending’ and knife carrying. The 2004 YJB Youth Survey found that:
• Of those children in mainstream education who said they had committed an offence inthe last 12 months, 51 per cent have carried a knife of some kind.
• Among excluded children who have carried a knife, 68 per cent have ‘offended’.41
But these figures do not provide a simple picture either since, as the YJB Youth Surveyfound, those who self-report offending in the last 12 months are also those more likely to have been victims.42 Furthermore, it is important to note again that ‘carrying a knife’may only be a penknife with no intention to use it as a weapon. Still, the very obviouscorrelation between children and young people who are exposed to violence andvictimisation and the carrying of a knife indicates that, in light of feelings of threat andinsecurity, the carrying of a blade might be considered far more understandable.
More detailed research on the carrying of a knife as a weapon, the motivations for it andthe incidences of such weapon carrying by those who have witnessed or experiencedviolent crime compared to those who have not would be useful.
36. ibid, p.51.
37. Wilson, D., Sharp, C. andPatterson, A. (2006), YoungPeople and Crime: Findingsfrom the 2005 Offending, Crimeand Justice Survey, London:Home Office, p.33.
38. Lemos, G. (2004), Fear andFashion: The Use of Knives andOther Weapons by YoungPeople, London: Lemos &Crane, pp.8–11.
39. ibid, p.vii.
40. ibid, p.8.
41. MORI (2004), MORI YouthSurvey 2004, London: YouthJustice Board for England andWales, p.34.
42. For example, the YouthSurvey data show that, in2005, 65 per cent of those whohad committed an offence hadbeen a victim, compared with44 per cent of those who hadnot committed any crime.MORI (2006), MORI Five-YearReport: An Analysis of YouthSurvey Data, London: YouthJustice Board for England andWales, p.23.
‘Knife Crime’ A review of evidence and policy Centre for Crime and Justice Studies 23
43. Nicholas, S., Kershaw, C.and Walker, A. (2007), Crime inEngland and Wales 2006/07,London: Home Office, p.60.In reality this figure is likely tobe higher owing to the limitednumber of crimes measuredby the BCS.
44. ibid, p.49.
45. Wilson, D., Sharp, C. andPatterson, A. (2006), YoungPeople and Crime: Findingsfrom the 2005 Offending, Crimeand Justice Survey, London:Home Office, pp.67–69.These are figures for allassaults, whether with orwithout injury.
46. Figures compiled using:Wilson, D., Sharp, C. andPatterson, A. (2006), YoungPeople and Crime: Findingsfrom the 2005 Offending, Crimeand Justice Survey, London:Home Office, pp.67, 80.
47. Confidence interval:0.0328 ± 0.0158 (95 per centconfidence)
48. Wilson, D., Sharp, C. andPatterson, A. (2006), YoungPeople and Crime: Findingsfrom the 2005 Offending, Crimeand Justice Survey, London:Home Office, p.83.
Chapter 3
Who does ‘knife crime’ affect most?
Knife-related offences, as with most types of crime, appear to affect different groups of the population to greater and lesser degrees. From the research available, it seems thatchildren and young people, those living in poor areas, and members of black and minorityethnic communities are more likely to be the victims of knife use.
Young people Compared to adults, children and young people experience greater levels of violent crimevictimisation. According to the 2006–2007 BCS, the risk of becoming a victim of violentcrime is 3.6 per cent for a British adult.43 However, the available figures for children andyoung people provide a striking and stark contrast. For young men aged 16 to 24 the riskwas almost four times greater: 13.8 per cent experienced a violent crime of some sort inthe year prior to their BCS interview.44 As previously mentioned, almost half of childrenattending school surveyed in the 2004 YJB Youth Survey had been victims of a crime in theprevious year. And according to the 2005 OCJS, just under one-fifth (18 per cent) of youngpeople aged from 10 to 25 years had been a victim of an assault in the last 12 months, with10 to 15 year olds more likely to have been victims than 16 to 25 year olds (20 per cent and16 per cent respectively).45 The evidence clearly suggests that children and young peoplesuffer much higher rates of victimisation.
Looking more closely at the data from the YJB Youth Surveys, it is clear that children andyoung people are directly affected by ‘knife crime’, but incidents that result in a child oryoung person actually being injured appear to be less common. According to the OCJS2005,46 of the 483 respondents aged between 10 and 25 years who had suffered an assaultwith injury in the last 12 months (just under 10 per cent of all OCJS respondents in thatage group) only 3 per cent (14 respondents) said they were ‘knifed or stabbed’.47
What these figures mean for an estimation of the proportion of the young populationvictimised by knife use remains unclear. The base figure of respondents reporting knifeuse against them is very low and details about the proportion of the population sufferingfrom assault with injury are not readily available.
Of the 91 respondents aged between 10 and 25 who had been the victim of a robbery (justunder 2 per cent of all 2005 OCJS respondents in that age group), 1 per cent had been‘knifed or stabbed’ during the course of the robbery. Evidently, it is extremely difficult todraw any conclusions about knife use in robbery.
Also of interest is that, of those incidents involving children and young people aged 10 to25 who had been the victim of a robbery or an assault causing injury, only 28 and 24 percent of incidents respectively came to the attention of the police.48 Consequently, it seemsunreasonable to expect successful police interventions to greatly reduce the number ofthese sorts of incidents when the young are disinclined to involve the police.
It should be noted that these figures, while helpful in providing a picture of stabbings
24 Centre for Crime and Justice Studies ‘Knife Crime’ A review of evidence and policy
49. ibid, p.68. The OCJS asks10 to 25 year olds if they havebeen the victim of an assaultin the last 12 months. It doesnot ask if the victim is relatedto or in a relationship with the offender.
50. Dorling, D., ‘Primesuspect: murder in Britain’, inHillyard, P., Pantazis, C.,Tombs, S., Gordon, D. andDorling, D. (2005), CriminalObsessions: Why Harm MattersMore than Crime, London:Crime and SocietyFoundation, p.27.
51. Brookman, F. and Maguire,M. (2003), Reducing Homicide:A Review of the Possibilities,Home Office Online Report01/03, p.4.
52. ACORN is ageodemographic tool thatcategorises all 1.9 million UKpostcodes, which aredescribed using over 125demographic statistics withinEngland, Scotland, Wales andNorthern Ireland and 287lifestyle variables.
53. Nicholas, S., Kershaw, C.and Walker, A. (2007), Crime inEngland and Wales 2006/07,London: Home Office,pp.67–68.
54. Wilson, D., Sharp, C. andPatterson, A. (2006), YoungPeople and Crime: Findingsfrom the 2005 Offending, Crimeand Justice Survey, London:Home Office, pp.71–73.
55. Nicholas, S., Kershaw, C.and Walker, A. (2007), Crime in England and Wales 2006/07,London: Home Office p.68.
56. ibid, p.67.
57. Brookman, F. and Maguire,M. (2003), Reducing Homicide:A Review of the Possibilities,Home Office Online Report01/03, p.4.
among young people, say nothing of those incidents in which young people may bethreatened with a knife or by a claim to have a knife – which are both likely to be far morecommon.
More specifically than young people, all the evidence suggests that it is young males whoare most at risk:
• According to the 2005 OCJS, males aged 10 to 25 years were almost twice as likely tohave been the victim of an assault without injury than females of the same age.49
• The single age group with the highest murder rate is that of boys under the age of one(40 per million per year) and then men aged 21 (38 per million per year).
• One-quarter of all murders are of men aged between 17 and 32 years. A male’s chanceof being murdered doubles between the age of 10 and 14, doubles again between 14and 15, 15 and 16, 16 and 19, and then does not halve until the age of 46.
• The murder rate for men aged 20 to 24 doubled in the 1980s and 1990s.50
Since young people are at greater risk of becoming a victim of assault and homicide, it isgenerally that age group too which is most likely to be stabbed and to die by the knife.51
Those living in povertyPeople living in poor neighbourhoods also stand a far greater chance of findingthemselves at the wrong end of a knife. The unemployed have a BCS violencevictimisation rate more than double the national average, and those living in ‘hardpressed’ ACORN52 areas are also over twice as likely to be victims of violence than those in wealthier areas.53 For 10 to 25 year olds, the characteristics of those at higher risk of being frequently victimised included being part of households that had difficultiesmanaging on their income and living in areas experiencing disorder problems.54
According to the 2006–2007 BCS, adults who noticed a high level of physical disorder in their neighbourhood were nearly twice as likely to experience violent victimisation as those who reported a low level of physical disorder.55
A brief look at those reporting being a victim of mugging as part of the 2006–2007 BCS is illustrative of the issue. Men aged 16 to 24 are almost three times more likely to be mugged than any other age group. Whites are less than half as likely to be mugged asnon-whites and the economically inactive are four times more likely to be mugged thanthe employed.56
For homicides by any method, ‘[b]oth offenders and victims tend to come from lower socio-economic groups’.57 Despite the rise in the homicide rate that Britain hasexperienced over the last two and a half decades, the wealthiest 20 per cent of areas haveactually witnessed the homicide rate fall. Meanwhile, the homicide rate in the pooresttenth of areas in Britain rose by 39 per cent in the eighties and nineties.58 Moreover, by far the most common way in which people are murdered in the poorest fifth of areas inBritain is through being cut with a knife or broken glass or bottle.59 About 60 per cent diethat way, much more than by firearms, which are the method of homicide in only 11 percent of cases. In the wealthiest areas, cutting with knife or glass accounts for just over 30 per cent of homicides, and firearms account for 29 per cent.60
Black and minority ethnic communities ‘Afro-Caribbeans and Asians are more at risk of homicide than Whites.’61 Considering toothat black and minority ethnic (BME) communities are disproportionately concentrated indeprived areas, the members of those communities are more likely to experience violentcrime, and muggings in particular, which involve a high proportion of knife usage.
More work needs to be done to determine whether particular BME groups orcommunities suffer more knife-related offences or are more likely to carry knives. Limitedinformation is available. Following a recent Freedom of Information Act request concerningthe ethnicity of those accused of knife-enabled robbery, knife-enabled violence and knife-enabled crime and the ethnicity of the victims of these crimes, the Home Officeresponded that ‘this information is not held centrally’. The only data the Home Office wasable to provide were figures on the ethnicity of homicide victims killed by ‘sharpinstruments’. Those figures for the decade to 2006 reveal that each year, on average, 12per cent of homicide victims by sharp instrument have been black – around five timesover-represented against population estimates. Asians occupy a similar position,accounting for each year, on average, 7 per cent of victims.
As for knife carrying, although the 2004 YJB Youth Survey found little difference in weaponcarrying by mainstream school pupils based on ethnicity (38 per cent of white pupils, 41per cent of black pupils and 33 per cent of Asian pupils reported having carried a weaponof some sort),62 there were some differences in knife carrying habits. Of those children inmainstream schools:
• White pupils are more likely to say that they carry a penknife than young people fromblack or minority ethnic groups (26 per cent compared with 20 per cent).
• On the other hand, young people who are black are more likely to admit to carrying aflick knife – illegal and likely to be more dangerous – than white or Asian young people(15 per cent compared with 9 per cent and 8 per cent respectively).63
The Safer London Youth Survey 2004 found that the rates for knife carrying in the capitalare significantly higher for white British and black Caribbean young people than for blackAfrican and South Asian young people. Of the respondents who indicated they had carrieda knife in the past 12 months, 12 per cent were white British, 12 per cent black Caribbean, 6per cent black African and 6 per cent South Asian.64
‘Knife Crime’ A review of evidence and policy Centre for Crime and Justice Studies 25
58. Dorling, D., ‘Primesuspect: murder in Britain’, inHillyard, P., Pantazis, C.,Tombs, S., Gordon, D. andDorling, D. (2005), CriminalObsessions: Why Harm MattersMore than Crime, London:Crime and SocietyFoundation, p.31.
59. ibid, p.33.
60. ibid, pp.32–33
61. Brookman, F. andMaguire, M. (2003), ReducingHomicide: A Review of thePossibilities, Home OfficeOnline Report 01/03, p.4.
62. MORI (2004), MORIYouth Survey 2004, London:Youth Justice Board forEngland and Wales, p.26.
63. ibid, p.33.
64. Communities that Care(2005), Findings from the SaferLondon Youth Survey, p.6.

26 Centre for Crime and Justice Studies ‘Knife Crime’ A review of evidence and policy
‘Knife Crime’ A review of evidence and policy Centre for Crime and Justice Studies 27
65. The Job, Vol. 37, Issue 946, 1 February 2005,http://www.met.police.uk/job/job946/live_files/index.htm
66. ibid, Vol. 38, Issue 953, 13 May 2005,http://www.met.police.uk/job/job953/live_files/8.htm
67. ‘Knives off the streetsmakes our communitiessafer’, Home Office PressRelease 097/2006, 13 July2006.
68. Metropolitan PoliceService (2006), Knife AmnestyImpact on Knife-EnabledOffences, London:Metropolitan Police Service, available at:http://news.bbc.co.uk/1/shared/bsp/hi/pdfs/06_12_06_knife_amnesty.pdf
69. Bleetman, A., Perry, C.,Crawford, R. and Swann I.(1997), ‘Effect of Strathclydepolice initiative ‘OperationBlade’ on accident andemergency attendances due to assault’, Journal of AccidentEmergency Medicine, 14,pp.153–156.
Chapter 4
Amnesties, prison sentences,education and prevention: what works for ‘knife crime’?
The government has adopted a range of different approaches to tackling ‘knife crime’. The most publicised have included a national knife amnesty and harsher sentences. Yet it is far from clear what actually works to reduce knife carrying and knife offences.
The national knife amnesty With much fanfare, a national knife amnesty was declared and began in May 2006,running for five weeks until the end of June. Although a national knife amnesty is arelatively rare event, there is often a knife amnesty running somewhere in a local authorityarea in Britain. Recently, within London, Croydon ran an amnesty from 20 February to 31 March 2006, Southwark ran one from September 2004 to January 2005 (185 knivescollected)65 and Hillingdon ran one from January to April 2005 (378 ‘frightening weapons’collected).66 Little research has followed these and other knife amnesties to assess theirimpact on knife carrying and knife offences.
According to the Home Office, a total of 89,864 knives were handed in during the nationalamnesty.67 Home Office minister Vernon Coaker stated that this means ‘fewer knives on our streets’ and greater security for everyone. Assuming that there are approximately 22 million households in England and Wales, each possessing a single kitchen knife, theamnesty has been successful in removing 0.0041 per cent of knives that might be used incrimes. Of course, most households contain many more than a single knife and it is barelyworth considering the tens of thousands sitting in shops waiting to be purchased. Assuch, it is at best questionable whether this will result in a reduction in knife carrying andknife-related offences. Indeed, work carried out by the Metropolitan Police Service (MPS)on the effect of the amnesty concluded: ‘Reductions in MPS Knife-Enabled offencesstarted 5-weeks into the operation, and then continued for approximately 8-weeks (whichis 6 weeks beyond the end of the operation) before returning to pre-operation levels.’68
Evidence from other knife amnesties also shows that they have a very limited impact on crime levels. One retrospective records-based study in Strathclyde found that a knifeamnesty (‘Operation Blade’, which ran for four weeks in 1993) did not have a long-termbeneficial effect. The campaign in Strathclyde was followed by a reduction in the numberof serious stabbings for ten months during and after the intervention but the rate forsubsequent months exceeded the rates prior to the intervention.69
Essentially, knife amnesties address but one tool of expression of interpersonal violenceand do nothing to address the underlying causes of such violence. Thus they do not affecteither those who retain their knives believing it might be necessary to use them or thosewho pick up a knife on the spur of the moment in anger or fear.
Little is known about who is likely to hand in a knife during the amnesty or why. It is likely,however, that those people who routinely carry a knife for protection or intend to use a
knife in crime will not be safely disposing of their knives in the bins provided at policestations. Moreover, unlike guns, once a knife has been disposed of it merely takes a trip to the kitchen drawer to get another. As long as there is unsliced bread, opportunities for‘knife crime’ will exist. Removing offensive weapons is to be welcomed, as is raisingawareness of the issue, but it does not address the underlying causes of the problem.
Stop and searchIncreased use and extension of police stop and search powers is also a problematicresponse to knife offences. A 2003 Home Office report noted that out of a total of 18,900people stopped and searched in 2001–2002 under s60 of the Public Order Act 1994 (i.e. in ‘anticipation of violence’), 1,367 (7 per cent) were found to be carrying an offensive ordangerous instrument, and of these, 203 (14 per cent) were arrested for possession. The report concluded:
‘Considering that the search powers in question should be used only where a specific threatof violence is present, these ‘hit rates’ are surprisingly low, and suggest that police actionsalone are unlikely to have a huge impact on the carrying of knives. They need to be backedup by educational campaigns and perhaps periodic ‘crackdowns’ when there is evidence of weapons being carried in a particular area.’70
It should be noted too that police stop and search powers are disproportionately usedagainst black and minority ethnic young males and have huge potential to createresentment.71
Under the Violent Crime Reduction Act 2006 teachers in schools and further educationinstitutions now have the power to search pupils and students in order to look for a knifeor other weapon. Previously teachers who had suspected someone to be carrying aweapon would have had to call the police to effect a search, unless the child agreed to besearched, which would give the ‘suspect’ time to get rid of the weapon. The governmentsays these measures are intended to increase the safety of staff and children, but teachingunions have expressed concern that teachers are not best placed or equipped toundertake these kind of searches. Moreover, obtrusive searches of children by powerfuladults are likely to have some impact on a child’s sense of well-being and personalintegrity, and may decrease the degree of trust between students and teachers. It istherefore possible that schools will resort to other, less personally intrusive, preventativemeasures and that searches will be considered as a last resort.
When police activity results in the seizure of a firearm, the prospect that this might have abeneficial impact on crime is greater than when a knife is discovered, simply because it ismuch harder to get hold of guns than knives. The number of knives available to thoseinclined to use them is almost infinite. Young people and children can simply take a knifefrom their home. School teachers using their new search powers or the police makinggreater use of stop and search are unlikely to impact significantly on the number ofchildren and young people carrying and using knives.
Increased prison sentencesThe government has increased the maximum available sentence for carrying a knife in public without lawful reason from two to four years through the Violent CrimeReduction Act 2006. It hopes that the doubling of the sentence for possession will send a clear message about the severity of the offence of knife carrying and will deterwould-be offenders.
28 Centre for Crime and Justice Studies ‘Knife Crime’ A review of evidence and policy
70. Brookman, F. andMaguire, M. (2003), ReducingHomicide: A Review of thePossibilities, Home OfficeOnline Report 01/03,pp.33–34.
71. See, for example, Wilson,D. and Rees, G. (eds.) (2006),Just Justice: A Study into BlackYoung People’s Experiences ofthe Youth Justice System,London: The Children’sSociety.
‘Knife Crime’ A review of evidence and policy Centre for Crime and Justice Studies 29
72. Halliday, J., French, C. and Goodwin, C. (2001),Making Punishments Work:Report of a Review of theSentencing Framework forEngland and Wales, London:Home Office, p.8.
73. ibid, pp.8–9.
74. Lemos, G. (2004), Fear and Fashion: The Use ofKnives and Other Weapons byYoung People, London: Lemos& Crane, p.viii.
75. Brookman, F. and Maguire,M. (2003), Reducing Homicide:A Review of the Possibilities,Home Office Online Report01/03, p.36.
76. Seehttp://www.besafeproject.org.uk/index.html
77. ibid
But it is unclear whether this will reduce knife carrying, particularly among young people.The Halliday review of sentencing carried out on behalf of the government in 2001 foundthat, although sentences had a deterrent effect, there was ‘no evidence to show whatlevels of punishment produce what levels of general deterrence’.72 It further noted:
‘The evidence shows the importance of certainty of punishment, so that deterrent effectsare unlikely to be achieved if the prospects of avoiding detection and conviction are high. Itis the prospect of getting caught that has deterrence value, rather than alterations to the‘going rate’ for severity of sentences. The lack of correlation between punishment levelsand crime levels is in line with the current literature which analyses these trends in otherjurisdictions ... There appears to be no statistical correlation between types of sentence andlikelihood of desistance, according to Home Office analysis of the Offenders’ Index.’73
Knife carrying, as already noted, is hard to detect. Consequently, the tougher sentenceswill have a very uncertain deterrent effect. However, given that knife carrying is mostcommon among those aged 16 to 17, this new sentence may well result in children andyoung people going to prison for longer.
Relying on the implausible view that increased sentence length will have a deterrent effect,it seems unlikely that the government’s chosen policy will have an impact on knifecarrying in public. This is particularly the case because such behaviour is most commonamong children and young people who are less likely to foresee the consequences of theiractions, less likely to appreciate cause and effect and are most likely to be the victims ofviolent crime.
Education and awareness-raisingEducational and awareness-raising campaigns targeting, in particular, knife carryingamong young people might help to reduce the prevalence of knife carrying and ‘knifecrime’. Such programmes are being used by both the police and community organisationsand can offer alternatives to traditional criminal justice, arrest, convict and punishresponses.
The Fear and Fashion report on the use of knives by young people listed key priorities foraction that made no mention of enforcement and sanctions. It recommended:
1. Developing local demonstration programmes and activities
2. Developing good practice materials for schools, youth clubs, youth offending teamsand the police
3. Promoting and disseminating good practice materials and examples.74
Similarly, a Home Office report that considered possible approaches to reducinghomicide rates concluded that first among ‘the most promising weapons-relatedstrategies’ was ‘[e]ducational campaigns regarding the dangers and penalties in relationto the illegal carrying of knives and other weapons’.75 Only then did it mention‘crackdowns’ and weapon searches.
While the educational approach may well be useful, few of the programmes have beenevaluated for their effectiveness in reducing knife carrying and knife-related offences. TheBe Safe Project,76 which ‘goes into schools to educate young people on the harsh realitiesof what can happen when they carry a knife’, states that it has been evaluated by NewhamYouth Offending Team and claims some impressive results.77 However, more systematicassessment and evaluation of educational projects is needed.
The evidence also suggests that who delivers the programmes is important. Communityand educational organisations that include former knife carriers, victims of knife offencesand experienced youth workers have an important role to play. Given that, according to the2005 OCJS, one of the factors associated with a heightened risk of serious offending andfrequent offending for both 10 to 15 and 16 to 25 year olds is ‘do not trust local police’,community groups might have more of an impact than police officers.78
Prevention and the causes of crimeAlthough the emphasis has been on extending powers to search young people andchildren for knives, harsher sentences and knife amnesties, the governmentacknowledges that prevention has an important role to play. The Home Office minister,Vernon Coaker, recently told the Home Affairs Committee: ‘It is about law enforcement …and about legislation … but it is also about prevention and working with schools andcommunities and listening to what they have to say …’79
The government’s draft Guns, Gangs and Knives Action Plan includes a prevention strand alongside policing and powers strands.80 It highlights a range of initiatives such asthe development of a gangs toolkit for schools, neighbourhood renewal and communitycohesion programmes, family intervention projects and the establishment of a LondonYouth Crime Prevention Board. The government has also recently set out plans for a network of youth centres aimed at providing activities for young people in everycommunity in England and extra spending to help voluntary organisations provide music, sport, drama, summer camps and other activities, ranging from Scout troops to rap groups.81
After many years of neglect, investment in youth services is to be welcomed. But thegovernment’s overall prevention approach to tackling youth crime lacks a coherentframework and is made up of a range of piecemeal initiatives. Most recently, in responseto a number of high profile stabbings, government ministers have resorted primarily to criminal justice responses – in particular the various measures in the Violent CrimeReduction Act 2006 – rather than developing prevention strategies. This is despite the factthat evidence suggests that a more concerted focus is needed to address the underlyingsocial and economic factors.
A study for the Youth Justice Board into the reasons for the increase in young people’sinvolvement in street crime, which is closely related to knife possession and knife use,identified the issue of relative poverty among young people, especially in areas where theirpaths crossed with wealthier people, as being a key factor.82 It found that the latter hadincreasingly begun to possess portable objects of desire such as MP3 players and mobilephones, which ten years ago would only have been accessible in their homes. The statusattached to possessing these objects made them not only desirable in their own right butalso a valuable commodity in an expanding juvenile market for stolen goods.
There is clearly a need to recognise that trends in any form of violence, particularly ‘knifecrime’, are not determined by criminal justice responses but are related to underlyingsocial and economic developments, which cannot be ignored in any strategy that seeks toprevent increasing numbers of people being both the victims and perpetrators of knife-related violence.
30 Centre for Crime and Justice Studies ‘Knife Crime’ A review of evidence and policy
78. Wilson, D., Sharp, C. andPatterson, A. (2006), YoungPeople and Crime: Findingsfrom the 2005 Offending, Crimeand Justice Survey, London:Home Office, pp.40, 42.
79. Home Affairs Committee(2007), Knife Crime: Oral andWritten Evidence, Tuesday, 27March 2007, London:Stationery Office.
80. ‘Draft Guns, Gangs andKnives Action Plan’, in Houseof Commons Home AffairsCommittee (2007), KnifeCrime: Oral and WrittenEvidence, Ev 40–41, London:The Stationery Office.
81. HM Treasury (2007),Aiming High for Young People:A Ten-Year Strategy for PositiveActivities, London: StationeryOffice.
82. Fitzgerald M., Stockdale J.and Hale C. (2003), YoungPeople and Street Crime,London: Youth Justice Board.
‘Knife Crime’ A review of evidence and policy Centre for Crime and Justice Studies 31
83. Doward, J. (2006), ‘Instantfines urged for knife crime’, 11June 2006, The Observer.
84. See ‘Cameron attacksRadio 1’s hip-hop’, BBC, 07.06.06,http://news.bbc.co.uk/1/hi/uk_politics/5055724.stm.
Conclusion
A lack of a considered, clear strategy based on high quality, specific research characterisesthe government and police approach to the problem of knife-related offences. For example,in the summer of 2006, following a number of stabbings, the government’s quick decisionwas to call for an increase in the maximum penalty for knife carrying. Two weeks later, a Home Office report detailed calls by senior police officers for knife possession to beadded to the list of offences for which police officers can issue an £80 Penalty Notice forDisorder.83 Politicians and some police officers clearly hold very different views on theseriousness of carrying knives and how best to respond to knife carrying.
This is, in part, explained by the lack of proper research. Yet it should be remembered that concern about ‘knife crime’ is not a recent development but one that resurfacesintermittently, usually following news of the use of a knife in a murder. Consequently, the lack of research and co-ordinated, evidence-based policies to deal with the problem is hard to justify – particularly to the victims of these offences.
This lack of research has also led to some rather unhelpful media reporting and politicalcomment. David Cameron’s comment that rap music encourages the carrying of knivesshows a lack of understanding of the reality of the problem. Hip hop reflects the livedexperience of many young people, and suggestions that the music is a causal factor forknife carrying risks accusations of cultural bias.84
Gaps in the research should be addressed by commissioning new research on themotivations for carrying knives and through clarifying the nature and extent of theproblems in specific local areas by pooling data from different sources such as domesticviolence projects, care homes, schools, accident and emergency departments, publicsurveys and the police.
There are limitations to the current data, so it is difficult to establish an accurate picture of the nature and extent of knife possession and knife use in offending. Knife use continuesto be only a small proportion of all violence as measured by the British Crime Survey.However, it is clearly a significant problem. Knife carrying may be increasing, especiallyamong children and the young. Young people who carry knives are more likely to do so if they have been victims of a crime. They often do so because they feel unsafe, and easydistinctions between victim and offender do not necessarily apply.
Enforcement and punitive action on knife carrying and knife use fails to take account of thefact that it is merely one expression of interpersonal violence, and a reduction in the use ofknives will only occur if the incidence of violence is addressed by a long-term strategy. Theknife is merely an implement used in crime. Without dealing with the underlying causes ofviolent crime, initiatives to reduce knife usage will have only a limited impact. Knives – likeguns, baseball bats, screwdrivers and poison – make an expression of violence potentiallymore damaging or lethal, even if not intended to cause death, but, ultimately, stabbingsare not caused merely by the presence of a knife. More essential is the context within whichthe resort to extreme acts of violence unfolds. As research commissioned by the HomeOffice has stated:
‘First of all, one of the most consistent findings is that homicide, like most other violentcrime and predatory property crime, is strongly associated with poverty and socialinequality. This suggests that preventive strategies focused upon particular offences should be complemented by, and complementary to, broader long-term initiatives against poverty and social exclusion.’85
Moves towards a more co-ordinated approach that recognises the importance ofprevention are to be welcomed. More fundamentally, the link between crime and deeper structural causes of inequality, poverty and social disaffection needs to be fully acknowledged and acted upon if the solutions are to be more than cosmetic andshort term. At present the government seems to be acting in response to a problemwithout knowing the full nature and extent of that problem and while overlooking thefundamental causes.
32 Centre for Crime and Justice Studies ‘Knife Crime’ A review of evidence and policy
85. Brookman, F. andMaguire, M. (2003), ReducingHomicide: A Review of thePossibilities, Home OfficeOnline Report 01/03, p.4.

‘Knife Crime’ A review of evidence and policy Centre for Crime and Justice Studies 33

34 Centre for Crime and Justice Studies ‘Knife Crime’ A review of evidence and policy

The Centre for Crime and Justice Studies at King’s College London is anindependent charity that informs and educates about all aspects of crimeand criminal justice. We provide information, produce research and carryout policy analysis to encourage and facilitate an understanding of thecomplex nature of issues concerning crime.
Whose Justice? is a strategic project of the Centre for Crime and JusticeStudies. It offers critical and innovative perspectives on the scope andpurpose of the criminal justice system in the UK, shedding new light on old problems.
www.crimeandjustice.org.uk