knoll workplace research – the metrics of distributed work · pdf filethe metrics of...
TRANSCRIPT

Tracy D. Wymer Vice President, Workplace Strategy Knoll, Inc.
Dr. Michael O’Neill Senior Director, Workplace Research Knoll, Inc.
Knoll Workplace Research
The Metrics of Distributed WorkFinancial and Performance Benefits of an Emerging Work Model

The Metrics of Distributed Work Page 1© 2011 Knoll, Inc.
Our study sample represents a diversity of perspectives
This study includes 40 organizations from eleven industries, reflecting multiple points of view. Slightly over half of the real estate managed by participants is in North America, the remaining is located elsewhere in the world (Europe, Asia, Central and South America, Middle East, Australia and Africa).
See Appendix for more details about the demographics of study participants.
Most offer distributed work programs
32%17%
3%8%
40%
Distributed Work Adoption Levels
Figure 1. Ninety percent of study participants are actively delivering distributed work programs
Not planning to adoptPlanning to adopt; no activity yet
Common practice at all locations
Exists in multiple locations
One or more pilots
The Metrics of Distributed WorkFinancial and Performance Benefits of an Emerging Work Model
New workstyles demand fundamental rethinking of workplace strategy
In many companies, employees are working in an increasingly social, mobile, and collaborative fashion. The conventional, boilerplate office programs and spaces that most of us are familiar with were never intended to support the complexity and unpredictability of these new work patterns.
This new workstyle is often referred to as “distributed work”—a combination of heads down “focus” work, formal and informal collaboration of varying duration, and social interaction that occurs in a wide variety of settings within the building, campus or other locations. In addition to physical space, work policies, technology and communications networks play a key role in facilitating distributed work.
Employees embrace new levels of personal freedom in spaces that are explicitly designed to support distributed work. These dynamic, interactive workplaces recognize the substantial shift toward formal and informal collaborative activities, as well as the social component of work.
While many organizations currently have distributed work programs, there has been little organized information and few metrics to assist companies wanting to learn more about this emerging workspace strategy.
To address this need, Knoll engaged Ratekin Consulting, a leading workplace research firm, to conduct this study.
Our study sample represented a cross section of forty organizations across eleven industries, having varying levels of familiarity with distributed work programs.
For three-quarters of our sample, distributed work programs are common practice across all or multiple locations (Figure 1), with an average of about seven years experience. Over half of the organizations involved in distributed work expect these programs to grow during the next three years.
Data were gathered from corporate real estate and facilities directors and vice presidents. With an average of 20 years experience and 10,000 end users, these participants provided a rich discussion on this topic through multiple methods: an on-line bulletin board, electronic survey and structured interviews.
Through these efforts, we identified the design attributes of distributed work programs, how success is measured, and the financial and employee satisfaction benefits of this new workplace strategy as compared to conventional workspace.
Distributed work environments are characterized by a wide variety of smaller individual and group spaces with higher sharing ratios:
4 Smaller, higher density individual spaces
4 A wider variety of individual and group setting types
4 Increased allocation of seats for collaborative spaces
4 Reduced emphasis on large formal meeting spaces
Organizations employing distributed work programs enjoy a number of important financial and employee satisfaction benefits:
4 Substantive cost savings—an average 33% first year cost avoidance over conventional workspace, with consistent savings thereafter.
The Metrics of Distributed Work Page 2© 2011 Knoll, Inc.
4 Greater space utilization—7 to 12 percentage points greater than conventional spaces.
4 Higher levels of employee satisfaction—about two-thirds of employees are satisfied with the impact of distributed work programs on their individual performance and 80% feel this way about their team performance.
1. While cost is an obvious consideration, strategic priorities drive distributed work programsPrior studies defined a list of business issues that shape decisions about workspace (O’Neill and Wymer, 2010). In this study, we asked participants to draw from the issues developed from that research and rank their importance as drivers of distributed work programs (see Table 1). Each also had the opportunity to insert issues not on the list.
The top drivers for distributed work programs are biased toward strategic considerations. While cost ranks as the number one driver, strategic issues (such as supporting effective work processes, collaboration, or retention) are what motivate organizations to implement distributed work.
Many of the drivers shown in Table 1 were ranked first on at least one organization’s list. For example, “minimize cost” is number one in the ranking, yet was chosen as the number one driver by slightly less than half of participants. Even then, the way in which cost reduction is achieved varies among participants; real estate portfolio size, reconfiguration/renovation, travel, employee turnover/on-boarding and overall real estate cost per employee were all mentioned.
2. The nature of individual and collaborative spaces is changing Reducing the footprint of individual workspace to gain efficiency has been a routine practice for at least the last ten years, for both distributed work and conventional workspaces. Regardless of workspace model, the shifting nature of collaborative work is driving higher utilization rates for small meeting spaces and lower use for large, traditional meeting rooms and presentation spaces.
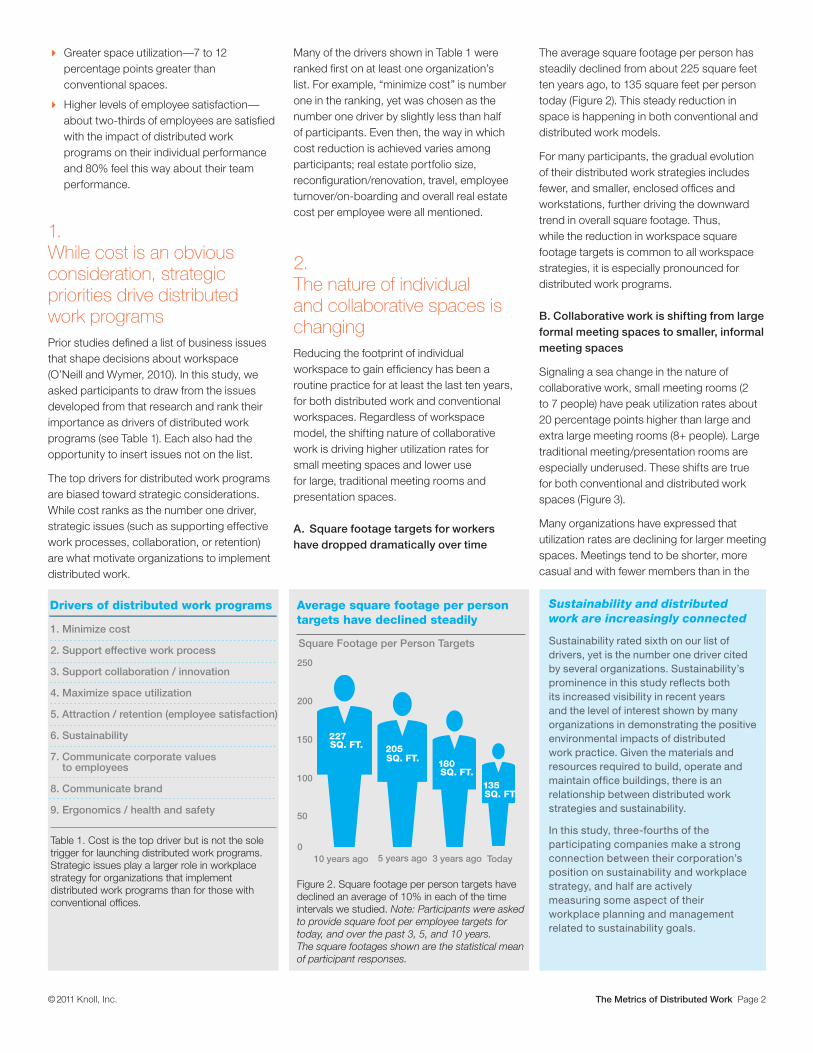
A. Square footage targets for workers have dropped dramatically over time
The average square footage per person has steadily declined from about 225 square feet ten years ago, to 135 square feet per person today (Figure 2). This steady reduction in space is happening in both conventional and distributed work models.
For many participants, the gradual evolution of their distributed work strategies includes fewer, and smaller, enclosed offices and workstations, further driving the downward trend in overall square footage. Thus, while the reduction in workspace square footage targets is common to all workspace strategies, it is especially pronounced for distributed work programs.
B. Collaborative work is shifting from large formal meeting spaces to smaller, informal meeting spaces
Signaling a sea change in the nature of collaborative work, small meeting rooms (2 to 7 people) have peak utilization rates about 20 percentage points higher than large and extra large meeting rooms (8+ people). Large traditional meeting/presentation rooms are especially underused. These shifts are true for both conventional and distributed work spaces (Figure 3).
Many organizations have expressed that utilization rates are declining for larger meeting spaces. Meetings tend to be shorter, more casual and with fewer members than in the
Table 1. Cost is the top driver but is not the sole trigger for launching distributed work programs
Strategic issues play a larger role in workplace strategy for organizations that implement distributed work programs than for those with conventional offices
1. Minimize cost
2. Support effective work process
3. Support collaboration / innovation
4. Maximize space utilization
5. Attraction / retention (employee satisfaction)
Drivers of Distributed Work Programs
6. Sustainability
7. Communicate corporate values to employees
8. Communicate brand
9. Ergonomics / health and safety
Table 1. Cost is the top driver but is not the sole trigger for launching distributed work programs. Strategic issues play a larger role in workplace strategy for organizations that implement distributed work programs than for those with conventional offices.
1. Minimize cost
2. Support effective work process
3. Support collaboration / innovation
4. Maximize space utilization
5. Attraction / retention (employee satisfaction)
6. Sustainability
7. Communicate corporate values to employees
8. Communicate brand
9. Ergonomics / health and safety
Drivers of distributed work programs Sustainability and distributed work are increasingly connected
Sustainability rated sixth on our list of drivers, yet is the number one driver cited by several organizations. Sustainability’s prominence in this study reflects both its increased visibility in recent years and the level of interest shown by many organizations in demonstrating the positive environmental impacts of distributed work practice. Given the materials and resources required to build, operate and maintain office buildings, there is an relationship between distributed work strategies and sustainability.
In this study, three-fourths of the participating companies make a strong connection between their corporation’s position on sustainability and workplace strategy, and half are actively measuring some aspect of their workplace planning and management related to sustainability goals.
Figure 2. Square footage per person targets have declined an average of 10% in each of the time intervals we studied. Note: Participants were askedto provide square foot per employee targets for today, and over the past 3, 5, and 10 years. The square footages shown are the statistical meanof participant responses.
Square Footage per Person Targets
Average square footage per person targets have declined steadily
0
50
100
150
200
250
Today3 years ago5 years ago10 years ago
205227
135
180
SQ. FT.
SQ. FT.
SQ. FT.SQ. FT.

The Metrics of Distributed Work Page 3© 2011 Knoll, Inc.
past (O’Neill and Wymer, 2010). Thus, larger meeting spaces are used less because they do not fit the criteria of need for the typical interaction (Figure 3).
3. Distributed work environments are characterized by a greater variety of workspacesThe overall amount of square footage used in office space is shrinking for both conventional workspace and distributed work models. Distributed work models are driving a profound shift in space allocation, as the square footage once devoted to individual assigned space is reduced and reassigned to create a wide variety of differently-sized individual (assigned and unassigned), collaborative and social activity areas (Figure 4). Characteristics specific to distributed work environments include:
4 Smaller, higher density individual spaces
4 A wider variety of individual and group setting types
4 Increased allocation of seats for collaborative spaces
4 Reduced emphasis on large formal meeting spaces
4 Off site locations as an emerging option
A. Distributed work settings offer aggressive sharing ratios for individual workspace
This overall ratio is sometimes referred to as a “macro sharing ratio” because it includes all desks company-wide (shared or not). The average macro sharing ratio for distributed work programs is 2.3 employees per desk (Figure 5). Participants commented that ratios tend to move higher over time as employees recognize the benefits of the more flexible workstyle it supports.
However, desk sharing ratios for specific groups, such as sales, may be 20 employees per desk or higher. This is in contrast to conventional workplaces where desks are typically provided on a one employee per desk basis (Figure 5).
B. Distributed work programs offer a plethora of smaller, individual workspaces
We found at least thirteen different variations of individual workspace types that range from the traditional private office to meditation rooms. A common thread through all these space types is their relatively small footprint, ranging from 38 square feet (touchdown station) to 132 square feet (private office) (Figure 6).
Spaces for individual work within a distributed work environment include more than the traditional workstation or office (Figure 6). Two reasons for the trend stand out: first, employees spend a lot of time meeting with others away from the desk; and second,
Utilization Rates at Peak Periods
Figure 3. Small meeting rooms (2 to 7 people) have peak utilization rates about 20 percentage points higher than large and extra large meeting rooms (8+ people). Extra large presentation rooms are especially underused (44% utilization at peak use). Note: Data represent average of participant estimates of utilization for each space type.
Small meeting spaces have much higher utilization rates
One-on-one coaching, interviewing Extra-Small Room (1-2 people)
73%
Small Room (3-7 people)Small team meetings, brainstorm, oasis
64%
Large Room (8-12 people)Large meetings, projects
54%
Extra-Large Meeting Room (13+ people)Presentations, events, multipurpose
44%
Figure 4. While individual workspaces (assigned and unassigned) are most common, we found many variations of individual, group and social spaces across organizations.
Quantity of Workspace Type per 100 Employees
Distributed work programs provide a series of individual and group settings
Open office: unassigned desk / touchdown space
Open office: assigned desk
Private office: assigned / unassigned
Ind
ivid
ual
Gro
upQuantity
Meeting room
Huddle room / phone booth
Open meeting areas / café / lounge
5 15 20 25 30 3510
9
4
5
4
30
30

The Metrics of Distributed Work Page 4© 2011 Knoll, Inc.
one workspace may not be the best place for every activity. Phone booths for lengthy or private calls and focus booths for heads down tasks that suffer from distractions are just two examples of spaces that can help an employee be more productive. Jobs that are highly collaborative and/or mobile may require desk space infrequently or for short periods, making them great candidates for a smaller or shared desk.
While distributed work programs potentially offer a wide variety of individual space types, the commonality among these spaces is that they are generally open, and unassigned. Twenty percent of the surveyed organizations provide only open workstations, with no enclosed offices. Nearly all participants provide unassigned workstations. Almost half of the organizations provide unassigned private offices as well.
Importantly, in spite of the unique size shown for each individual workstation and private office type, 75% of participants provide a single, standard workstation or office size regardless of whether it is assigned, unassigned or reservable. The clear benefit of this approach is in simplifying the reassignment of a space as usage
and behavior patterns evolve, thus avoiding costly reconfigurations.
Touchdown stations are often the first addition to the workplace to flexibly accommodate
visiting workers who need a little individual workspace for short periods of time. The most frequently reported touchdown station size in this study is 25 square feet. With sizes ranging from 20-100 square feet, the average touchdown station allocation is 38 square feet.
One individual work area not shown in Figure 6, largely due to the many forms it takes, is what is generally termed “quiet space” or “quiet room.” The basic description of quiet space, regardless of its configuration, includes banning telephones and other electronics (unless all sound is turned off) as well as prohibiting conversations of any length, above a whisper. Four approaches to providing employees with a quiet, distraction-free workspace were identified by participants:
1. Enclosed 1-2 occupant rooms
2. Large multi-occupant enclosed workspaces
3. Open workspace (often with a boundary to separate it from other work areas)
4. Open workspace (with no special provisions)
When no special provisions are made in completely open space, occupants are visible to each other and may be more sensitive to distracting co-workers. Typically, behavioral protocols are in place to manage noise levels. Only a minority of companies in our study use this approach.
C. Distributed work programs offer a wide choice of collaborative spaces to serve changing needs
In distributed work programs, a wide variety of meeting spaces (we counted 21 separate types in this study) are used to serve changing needs, such as the varied nature of meetings (shorter, casual meetings with smaller groups of people), fluctuating team sizes and overall occupancy levels.
Organizations engaged in distributed work agree that supporting collaboration is critical, whether it takes place face-to-face or remotely. The challenge is balancing the requirement with efficient planning and providing a variety of meeting spaces (Figure 7).
Distributed work strategies more than double the employee-to-desk ratio
Employees per Desk
1.0 2.3
Figure 5. While conventional office space uses a 1:1 ratio of people to desks, the average ratio for study participants using distributed work strategies is 2.3 to 1.
Distributed WorkspaceConventional Workspace
Attaining the right ratio is a moving target
Establishing an employee to desk ratio is not a one-time event, but rather a constantly evolving series of adjustments.
Ratios move higher over time as employees recognize the benefits of the more flexible workstyle it supports, and become comfortable with implementation.
Individual Workspace Types and Sizes
Distributed work programs offer a wide variety of meeting space types and sizesDistributed work programs offer a wide variety of individual work settings
Meeting Space Types and Sizes
Figure 6. Distributed work programs provide a breadth of individual settings in eight general categories ranging from as small as 38 square feet to 132 square feet. Note: Data represent the average reported square footage for each space type by study participants.
Assigned/unassigned office
Reservable office hoteling
Reservable workstation hoteling
Touchdown station
Prayer / meditation room
Mother’s room
Phone / focus / heads-down room
Assigned/unassigned workstation / free-address
Figure 7. Collaborative spaces used in distributed work range in size from outdoor spaces (1,480 square feet) to enclosed “thinkspace” for two people, which can be as small as 116 square feet. Note: Data presented show the average square footage for all participants, for each space type.
Outdoor meeting, courtyard, patio, park, amphitheater
Café
Open/enclosed XL meeting, presentation, multi-purpose room (13+ people)
Enclosed video conference, telepresence, lab room
Enclosed game room
Open game room
Open/enclosed small meeting, team, brainstorm, oasis (6-8 people)
Open 1 on 1 (2-4 people)
Open/enclosed 1 on 1 (2-4 people)
1,480
725460
442
298
207
178
122
120
Average size in square feet
132
121
54
38
112
88
77
56
Average size in square feet
“Everyone uses the meeting room with the best technology
regardless of whether it is the right size or not.” —FACILITIES DIRECTOR,
TELECOMMUNICATIONS COMPANY

The Metrics of Distributed Work Page 5© 2011 Knoll, Inc.
A variety of collaborative spaces, in size, seating type and character, enhances employee choice and offers the option for people to change venues for a refreshing change of pace. Providing a choice of meeting spaces allows people to match the location with the character of the interaction, length and preferences of meeting organizers and attendees. Most organizations provide open meeting spaces, stating that these areas facilitate spontaneous and informal meetings, save time looking for space to meet and provide overflow for busy periods. On average, 75% of formal meeting spaces can be reserved while focus booths, small meeting rooms and open meeting spaces cannot be reserved.
Key research findings:
4 Group spaces need to do double duty. This particularly applies to large rooms that frequently show the lowest utilization rates.
4 Many meetings are small, just 2-4 people. Thus, open meeting space and numerous small meeting rooms combine to efficiently accommodate as many simultaneous meetings as possible.
4 The medium size room (the 8-12 range that once was common) is less favored as it is often too small or too large for the typical meeting need.
4 Larger rooms can be made more versatile, becoming war rooms, project rooms or agile team rooms, when the furniture can be reconfigured by occupants.
4 Meeting spaces should have all technology required for employees to seamlessly conduct their work. Although it carries a higher initial cost, having the right technology in meeting rooms is critical to effective work.
Several participants noted that employees want more outdoor space (where climate permits), and that wireless networks on enclosed patios and courtyards can expand work and meeting options.
D. Distributed work programs provide more seating capacity for group work
On average, distributed work programs provide about 30% greater seating capacity for meeting spaces than conventional approaches (Figure 8). On average, conventional offices plan for 7.6 employees for each meeting room seat. Distributed work programs offer an average of 5.4 employees per meeting room seat.
Distributed work programs offer more seats for meetings because they provide a greater number and variety of group settings. These group settings vary in size and consist of both enclosed and open spaces which better support both planned and spontaneous meetings.
4. Cost and satisfaction are top success measuresEmployee satisfaction and square footage and dollars saved through real estate reduction are the three most frequently cited measures of distributed work program performance. These are powerful measures because they are closely linked to ongoing business concerns. Employee satisfaction is usually measured through surveys and meetings. To measure real estate reduction, utilization data is gathered—most often the low-tech way—by walking around with a clipboard to see “who is home.”
A. Goals for distributed work should include a mix of employee satisfaction, space utilization and cost savings
Companies report using an average of four measures to track their success, typically involving employee satisfaction, cost savings and utilization rates (Figure 9). Sustainability goals also appeared as a measure for seven percent of study participants.
When business drivers are translated into specific workspace goals, it is more likely that the goals will actually be implemented through specific actions, and measured. The key is to identify a few goals that are relevant across the lines of business within an organization.
As an example, the goal of minimizing cost may translate into a project objective of reducing occupied square footage. With this objective, a baseline measure
The café / lounge plays an increasing role
Participants made it clear that the café is becoming the central hub for employees. It serves as community space, overflow meeting space and individual workspace for those who like to be in the middle of the action. Important characteristics include a variety of seating types, access to food, allowance for technology and room for a variety of simultaneous activities.
“The open café or club space adds value for people constrained in
formal setting and allows better, informal interaction.”
— Real estate executive, Technology Company
Individual Workspace Types and Sizes
Distributed work programs offer a wide variety of meeting space types and sizesDistributed work programs offer a wide variety of individual work settings
Meeting Space Types and Sizes
Figure 6. Distributed work programs provide a breadth of individual settings in eight general categories ranging from as small as 38 square feet to 132 square feet. Note: Data represent the average reported square footage for each space type by study participants.
Assigned/unassigned office
Reservable office hoteling
Reservable workstation hoteling
Touchdown station
Prayer / meditation room
Mother’s room
Phone / focus / heads-down room
Assigned/unassigned workstation / free-address
Figure 7. Collaborative spaces used in distributed work range in size from outdoor spaces (1,480 square feet) to enclosed “thinkspace” for two people, which can be as small as 116 square feet. Note: Data presented show the average square footage for all participants, for each space type.
Outdoor meeting, courtyard, patio, park, amphitheater
Café
Open/enclosed XL meeting, presentation, multi-purpose room (13+ people)
Enclosed video conference, telepresence, lab room
Enclosed game room
Open game room
Open/enclosed small meeting, team, brainstorm, oasis (6-8 people)
Open 1 on 1 (2-4 people)
Open/enclosed 1 on 1 (2-4 people)
1,480
725460
442
298
207
178
122
120
Average size in square feet
132
121
54
38
112
88
77
56
Average size in square feet

The Metrics of Distributed Work Page 6© 2011 Knoll, Inc.
can be established (e.g. current square feet per person) against which progress may be tracked.
As one executive of a large financial company stated, “Most businesses want to save money, improve employee satisfaction, build a more collaborative team environment, and take advantage of new technology to be more productive. These four give us a consistent framework for measurement.”
B. Organizations use a variety of tools to track utilization
The primary methods used to collect utilization data include clipboard/walk around, employee badge swipes, and electronic sensors (Figure 10). An average of 1.4 methods per company were used by study participants. The relatively labor intensive clipboard/walk around method is more likely to be used when gathering data for new projects, because it reveals nuances of space use and behavior that can be applied to design of new space.
For existing spaces, organizations use methods that are less labor intensive such as badge swipes (30%), sensors (15%) and electronic log-in reports (9%) (Figure 10). These methods have limitations: they may yield sufficient data about who shows up at a location, but provide no data about the spaces they use while on-site. Electronic devices that attach to furniture to monitor actual usage of specific locations have provided helpful data, but are also costly and resource intensive.
C. Most organizations collect data on a regular basis but projects still drive almost half of data gathering
Most companies collect data on a regular basis (yearly, quarterly, monthly, daily or other regular timing). In addition, new projects are a significant driver of unscheduled data collection (Figure 11).
A majority of organizations in our sample collect utilization data. The primary reason given by companies who do not collect data is the cost and resource intensive nature of the activity.
Figure 8. Distributed work programs provide 30% greater seating capacity for meeting rooms than conventional space models. Note: Figure shows ratio of employees to available meeting room seats (a lower ratio is more favorable).
7.6 : 1
5.4 : 1Distributed Workspace
Conventional Workspace
Collaborative spaces in distributed work programs have greater capacity Employee to Seat Ratio
Off-site locations may represent another way to support distributed work
Almost half of study participants provide, or are considering providing, offsite satellite spaces for employees. This concept may represent an emerging opportunity for distributed work solutions. However, the concept of a shared offsite facility (telework center) is much less popular with the great majority stating they do not provide and will not consider it as an option, due to security concerns of sharing space with other companies.
Figure 9. Square foot real estate reduction, employee satisfaction and dollars saved are the three most frequently used measures of distributed work program success. Note: Results are shown as a percentage of the total number of responses to the question. Participants typically chose several measures. Only one organization reported gathering no data.
Other 6%
7%$ per person cost savings
13%$ saved through real estate reduction
Multiple measures are used to define success
6%Attraction/retention measures
8%% increase in employee satisfaction
18%Employee satisfaction scores
Success Measures for Distributed Work
8%Seat occupancy / utilization
9%% real estate reduction
18%Square footage reduction
7%Sustainability

The Metrics of Distributed Work Page 7© 2011 Knoll, Inc.
D. Employee satisfaction is an important measure and is often used as a proxy measure of employee engagement, future retention and productivity
Monitoring satisfaction scores over time can be highly informative and help focus change management activities. The most common means of collecting this data include surveys, meetings and informal conversations (Figure 12).
Post-occupancy surveys are the most often used tool, typically in conjunction with a pre-move survey for comparison. While more qualitative in nature, a variety of informal conversational methods are regularly employed and valued as an opportunity to connect directly with workers and add depth to survey results.
5. Distributed work programs are more cost effective and result in greater employee satisfaction than conventional workspaceOrganizations employing distributed work programs enjoy a number of important financial and employee satisfaction benefits:
4 Cost savings
— An average 33% first year cost avoidance over conventional workspace, with greater savings thereafter
4 Greater space utilization
— Utilization of individual workspaces is 7 to 12 percentage points greater than conventional spaces
4 Employees satisfaction with individual and team performance
— About two-thirds of employees are satisfied with the impact of distributed work programs on their individual performance and 80% feel this way about their team performance
4 The right mix of workspace, training, policies and technology, which leads to employee satisfaction
— About 80% of employees are satisfied with distributed work policies, technology, training, and the variety and types of the workspaces offered by their company’s distributed work program
Figure 10. The primary methods organizations use to collect utilization data include clipboard/walk around, electronic employee badge swipes, and electronic sensors. Note: Organizations were asked to select all methods they use to collect data. Results are shown as percentage of the total number of responses to the question.
34%
Clipboard/walk-around
30%
Badge swipe/security card
Two approaches dominate data collection methods
OtherSensors 15%
Electronic log-in report 9%
Other methods 12%
Data Collection Methods
Measuring utilization quickens response time to changing needs
Forty-five percent of the organizations that measure utilization, do so on a regular basis.
Those measuring utilization on a regular basis report that they actively revise desk sharing ratios in response to changing use. This allows managers to better respond to demand and allocate space quickly when needed.
Unscheduled or “on demand”
(includes project driven)
Annually 4%
Quarterly 8%
Daily 8%
9%
Monthly 29%
Other regular schedule
Figure 11. Most organizations collect data on a regular basis but new projects are also a significant driver of unscheduled data collection. Note: 24 organizations in our sample (60%) collect utilization data. Those participants were asked to select one category that most accurately represents their situation.
Most data collection occurs on a regular basis
Data Collection Frequency
42%

The Metrics of Distributed Work Page 8© 2011 Knoll, Inc.
A. A return-on-investment model for distributed work shows significant space reductions and ongoing cost savings
An organization can thoughtfully choose the measures that highlight the greatest benefits to the combined business and real estate strategy. From our sample of 40 participating enterprises, we collected data on four of the most frequently used space utilization and cost measures:
4 Square foot real estate space reduction
4 Dollars saved in real estate reduction
4 Percentage of real estate reduction
4 Cost per person savings
Ultimately, the most important aspect of any of these measures is using them on a regular basis to monitor and review findings, using the data to guide adjustments to the program and the work environment. In addition, year over year metrics should be gathered and compared at both the portfolio level and individual office or site level.
We analyzed the data provided to us by participants as part of their conventional workspace and distributed work implementation efforts, and provide a summary of key metrics in Table 2.
The more intensive space utilization within a distributed work environment means that the cost of utilities and services of various kinds, including general maintenance and cleaning, are often higher than in conventional spaces. Study participants report the cost of operating distributed workspace to be on average 7%
higher ($21.40 versus $20.00 per square foot for conventional space) (Table 2).
Offsetting the higher maintenance cost is the fact that distributed work spaces on
average use 33% less square footage than conventional spaces (130 square feet per person for distributed work space versus 195 square feet per person for conventional space). Distributed workspaces also use a significantly higher employee to desk sharing ratio, more than double that of conventional workspaces (Table 2).
Return on investment model
A return on investment model for these data is summarized in Table 3, and detailed below. This example assumes that the organization is providing new space for both conventional and distributed work environments (as opposed to remodeling):
4 Conventional office space A firm of 512 employees creates a conventional workspace that requires 100,000 square feet of space (an average 195 square feet per person). The total cost of construction (at $175 per square foot) is $17.5 million. The annual cost of this space is $56 per square foot ($36 per square foot lease cost, plus $20 per square foot operating cost), resulting in a $5.6 million annual
Employee Satisfaction Measurement Tools
Figure 12. A mix of qualitative and quantitative data sources provide insights on employee satisfaction with the workspace. Note: This figure illustrates the percentage of the total number of times a given category was selected. Organizations reported using an average of four of these measurement tools.
Employee satisfaction is primarily measured through surveys, meetings, and conversations
29%
Post-occupancy survey
25%
Input from meetings
23%
Informal conversation Misc.
Other 8%
Committee feedback 10%
All employee survey 4%
Focus group 2%
Table 2. While operating costs are about 7% higher than conventional space, distributed work programs offer considerable cost savings because they use, on average, about one-third less space than conventional settings, and more than double the employee to desk ratio of conventional workspace. Note: Numbers represent averages from those participants with distributed work or conventional workspaces.
Participant metrics
130 Average square feet per person: distributed workspace
195 Average square feet per person: conventional space
$20.00 Average annual operating cost per square foot: conventional space
$21.40 Average annual operating cost per square foot: distributed work space
2.3:1 Average employee/desk sharing ratio: distributed workspace (see Figure 5)
“The real estate opportunity serves as the lever for workplace change
–not as the primary driver.”—VICE PRESIDENT,
INSURANCE COMPANY

The Metrics of Distributed Work Page 9© 2011 Knoll, Inc.
facilities operating cost. The combined construction and operating costs total $23.1 million for “year 1” facility costs.
4 Distributed work office space A firm of 512 employees creates distributed workspace that requires 67,000 square feet of space (an average 130 square feet per person). The total cost of construction (at $175 per square foot) is $11.7 million. The annual cost of this space is $57.40 per square foot ($36 per square foot lease cost, plus $21.40 per square foot operating cost) resulting in a $3.8 million annual facilities operating cost. The combined construction and operating costs total about $15.6 million for “year 1” facility costs.
This comparison shows a first-year cost avoidance of about $7.5 million for distributed workspace—about 33% lower than the first year cost of conventional workspace. Second year and subsequent annual cost of distributed workspace is about 31% lower than the ongoing operating cost of conventional space ($3.8 million versus $5.6 million).
B. Distributed work programs can increase utilization of individual workspaces by 7 to 12 percentage points
While conventional individual workspaces (assigned and unassigned) average about 45% peak utilization, these same spaces within distributed work programs enjoy 7 to 12 percentage points higher utilization rates. Touchdown spaces are less used in distributed work programs than in conventional spaces, perhaps because more appropriate spaces types are available (Figure 13).
Efficient space utilization is an important objective. Employees and leaders alike note quiet, empty spaces dominate many conventional offices as a result of changing work patterns. Greater time spent in meetings, traveling to and from meetings or between sites, and working remotely have produced an “empty nest syndrome.” This syndrome existed even before the economic downturn and resulting layoffs added to the vacancies.
Distributed work programs provide greater efficiency of dollars investment
Organization Characteristics Conventional Workspace Distributed Workspace
Number of employees 512 512
Square feet per person 195 130
Rentable square footage 100,000 67,000
Annual lease cost of space per square foot
$36 $36
Annual operating cost per square foot $20 $21.40
Construction cost per square foot $175 $175
Construction cost, total* $17,500,000 $11,725,000
Annual facilities operating and lease cost $5,600,000 $3,845,800
Total annual year 1 cost $23,100,000 $15,570,800
*includes buildout and furniture
Table 3. The return on investment model shows that even after factoring in a 7% greater cost per square foot to operate the space, distributed work programs still yield a 30 to 33% cost savings over conventional workspace. Note: While we use an annual lease cost of $36 per square foot in this example, we suggest that the reader use market appropriate costs for the purpose of estimating return on investment benefits.
0
20%
40%
60%
80%
100%
Distributed Work Utilization Percentages at Peak Periods
Figure 13. While individual workspaces within a conventional model average about 45% peak utilization (yellow horizontal bar), within distributed work programs individual spaces generally enjoy 7 to 12 percentage points higher utilization. However, touchdown spaces are less used in distributed work programs than in conventional spaces, perhaps because a wider range of more appropriate spaces types are available.
Individual workspaces in distributed work models have greater utilization rates
Individual assigned desk/seat
57%
Individual unassigned desk/seat
52%
Touchdown
36%
Conventional space averages 45% peak utilization
Utilization rates improve using distributed work
Those organizations that monitor use in both distributed work and conventional workspaces indicate that overall utilization rates (for all space types) in distributed work settings are 10-50 percentage points higher, with 20% the most frequently reported rate.

The Metrics of Distributed Work Page 10© 2011 Knoll, Inc.
C. Participants report that the majority of the employees that they serve are satisfied with the impact of distributed work programs on individual and group work performance
Overall, a majority of study participants who have deployed distributed work programs report that the employees they serve are satisfied with how well the spaces support individual and group performance (Figure 14). The higher ratings for group performance may be due to the inherent predisposition of distributed work programs to provide a wide variety of group spaces.
D. Distributed work policies, technology, training/implementation are all required components of a successful program
The design of work policies, technology, workspace and training needs to be systematically coordinated to ensure the distributed work program delivers a positive work experience (Figure 15).
Thus, it is critical that all aspects of a distributed workspace program are well-thought out in advance and are launched together with the move-in to new workspace. Employee satisfaction with all elements of the distributed work program, including workspace, is critical.
6. Distributed work environments offer flexibility and choiceIn many companies, employees are working in an increasingly social, mobile, collaborative fashion. The conventional, boilerplate office programs and spaces that most of us are familiar with were never intended to support the complexity and unpredictability of these new work patterns.
In a way not before attempted, this study identifies the design attributes of distributed work programs, defines how success is measured, and provides quantitative financial and employee satisfaction benefits of this new workplace strategy as compared to conventional workspace.
This project has established a useful benchmark for organizations wishing to compare their solution to others and those who are planning new distributed work programs for their organizations.
In summing up their experiences with distributed work, participants were asked to identify the top benefits of distributed work for their organization’s employees. By far the most frequent reply was flexibility—choices about where to work and access to a
satisfying variety of settings. This flexibility results in a perception of more personal control and empowerment contributing to improved work/life balance.
In the near future, it is possible that distributed work environments will become more the norm than the exception, and the successes that are documented here will be leveraged across many organizations allowing more workers to experience greater freedom and job satisfaction while helping their organizations increase business productivity and reduce expensive real estate portfolio costs.
Satisfaction with Distributed Work Programs
Figure 14. In their assessments, workspace managers report that two-thirds of the employees they serve are “satisfied to very satisfied” about the impact of their company’s distributed work program on their individual performance, and 80% are “satisfied to very satisfied” with the impact of distributed work programs on team performance.
Employees give distributed work programs high ratings
Individual performance support
14%Dissatisfied
19%Neutral
43%Satisfied
24%Very Satisfied
Team performance support
5%Dissatisfied
45%Satisfied
35%Very Satisfied
15%Neutral
Policies Technology Physical workplace
Implementation& training
Figure 15. Organizations report that the majority of their employees are “satisfied to very satisfied” with the variety and types of workspaces, and the training, polices and technology provided through their company’s distributed work program.
Distributed Work
The Four Pillars of Program Success
The physical workspace is only one facet of a successful distributed work program
Policies Technology Physical workplace
Implementation& training
Figure 15. The design of work policies, technology, workspace and training needs to be systematically coordinated to ensure the distributed work program delivers a positive work experience.
Distributed Work
The Four Pillars of Program Success
Physical workspace is one facet of a successful distributed work program

The Metrics of Distributed Work Page 11© 2011 Knoll, Inc.
Figure 16. Fifteen percent of the companies in our sample have less than 1 million square feet in their portfolios. About half have portfolios ranging from 1 to 20 million square feet. Almost one-quarter have 20 million or greater square feet. Note: Percentage responses are rounded to whole numbers and do not equal 100%. About 15% of participants did not indicate a portfolio size.
Study participants
Participant Real Estate Portfolio Size
<1m sq ft
5–20m sq ft1–5m sq ft
>100m sq ft
20-100m sq ft
0 2 4 6 8 1210
Number of companies responding
Participant Headcount Size
Figure 17. Of responses, about one-quarter of the organizations in our sample fall into each employee headcount category.
Headcount of participating companies is evenly distributed
<5k9
10
10
10
5–20k
20–50k
50–320k
Appendix
The 40 organizations included in the study reflect a broad mix of industries, locations, and headcount
A mix of Knoll and non-Knoll clients were included in this study. Participating organizations were solicited through Ratekin Consulting and Knoll contacts, as well as solicitation through social media sites. In this section, we describe the characteristics of participants’ portfolio size (Figure 16), headcount (Figure 17) industry (Figure 18) and geographic location (Figure 19). Stages of distributed work adoption are covered in Figure 1.
Participating organizations represent diverse industries
Participant Industry Sectors
Financial
20%
Consulting
17%
Healthcare
10%
Government
8%
Energy
5%
Technology
15%
Higher Education
5%
Misc. (Manufacturing, Research & Communications)
15%
Retail
5%
Figure 18. In this study, leading global industries are represented in roughly equal proportions: financial, consulting and technology; and to a lesser extent, manufacturing, communications, research, healthcare, government, higher education, retail and energy.

The Metrics of Distributed Work Page 12© 2011 Knoll, Inc.
Participant Geographic Reach
Almost half the square footage of participants resides outside North America
Figure 19. While slightly more than half of all real estate square footage managed by participants is in North America, 42% is located elsewhere (Europe, Asia, Central and South America, Middle East, Australia and Africa), giving this study a global perspective. Note: This figure represents the total participant portfolio square footage expressed as a percentage of square footage in each region.
Over 10% of our participants are headquartered outsidethe US, and approximately one quarter of participants have locations in all regions listed
North America 58%
Europe 18%
Asia 12%
Central and South America 5%
Middle East 4%
Australia 3%
Through research, Knoll explores the connection between workspace design and human behavior, health and performance, and the quality of the user experience. We share and apply what we learn to inform product development and help our customers shape their work environments. To learn more about this topic or other research resources Knoll can provide, visit www.knoll.com/research/index.jsp
“Man,” “woman,” and “flower” symbols from thenounproject.com collection.