know your mind: adaptive cognitive activity recognition
TRANSCRIPT

Know Your Mind: Adaptive Cognitive ActivityRecognition with Reinforced CNN
Xiang Zhang∗, Lina Yao∗, Xianzhi Wang§, Wenjie Zhang∗, Shuai Zhang∗, Yunhao Liu¶∗University of New South Wales, Sydney, Australia§ University of Technology Sydney, Sydney, Australia¶ Michigan State University, East Lansing, USA
{xiang.zhang3, shuai.zhang}@student.unsw.edu.au, {lina.yao, wenjie.zhang}@[email protected], [email protected]
Abstract—Electroencephalography (EEG) signals reflect andmeasure activities in certain brain areas. Its zero clinical riskand easy-to-use features make it a good choice of providinginsights into the cognitive process. However, effective analysisof time-varying EEG signals remains challenging. First, EEGsignal processing and feature engineering are time-consumingand highly rely on expert knowledge, and most existing studiesfocus on domain-specific classification algorithms, which may notapply to other domains. Second, EEG signals usually have lowsignal-to-noise ratios and are more chaotic than other sensorsignals. In this regard, we propose a generic EEG-based cognitiveactivity recognition framework that can adaptively support awide range of cognitive applications to address the above issues.The framework uses a reinforced selective attention model tochoose the characteristic information among raw EEG signalsautomatically. It employs a convolutional mapping operation todynamically transform the selected information into a featurespace to uncover the implicit spatial dependency of EEG sampledistribution. We demonstrate the effectiveness of the frameworkunder three representative scenarios: intention recognition withmotor imagery EEG, person identification, and neurologicaldiagnosis, and further evaluate it on three widely used publicdatasets. The experimental results show our framework outper-forms multiple state-of-the-art baselines and achieves competitiveaccuracy on all the datasets while achieving low latency andhigh resilience in handling complex EEG signals across variousdomains. The results confirm the suitability of the proposedgeneric approach for a range of problems in the realm of Brain-Computer Interface applications.
Index Terms—deep learning, reinforcement learning, attentionmechanism, brain-computer interface
I. INTRODUCTION
Electroencephalography (EEG) is an electrophysiologicalmonitoring indicator to analyze brain states and activities bymeasuring the voltage fluctuations of ionic current within theneurons of brains [1]. In practice, EEG signals can be collectedby portable and off-the-shelf equipment in a non-invasive andnon-stationary way [2]. EEG signal classification algorithmshave been studied for a range of real-world applications [3].The accuracy and robustness of EEG classification modelhave promising meanings to identify cognitive activities in therealms of movement intention recognition, person identifica-tion, and neurological diagnosis. Cognitive activity recognitionsystems [4] provide a bridge between the inside cognitiveworld and the outside physical world. They are recently used inassisted living [5], smart homes [6], and entertainment industry
(a) T-2 (b) T-1 (c) T (d) T+1 (e) T+2
Fig. 1: EEG topography with continuous samples. The intervalamong samples is 0.00625 second.
[7]; EEG-based person identification technique empowers thesecurity systems deployed in bank or customs [8], [9]; EEGsignal-based neurological diagnosis can be used to detectthe organic brain injury and abnormal synchronous neuronalactivity such as epileptic seizure [10], [11].
The classification of cognitive activity faces several chal-lenges. First, the EEG data preprocessing and feature extrac-tion methods (e.g., filtering, Discrete Wavelet Transformation,and feature selection) which are employed by most existingEEG classification studies [3], [7] are time-consuming andhighly depend on expertise. Meanwhile, the hand-craftedfeatures require extensive experiments to generalize well todiverse settings such as filtering bands and wavelet orders.Therefore, an effective method which can directly work onraw EEG data is necessary.
Second, most current EEG classification methods are de-signed based on domain-specific knowledge and thus maybecome ineffective or even fail in different scenarios [2]. Forexample, the approach customized for EEG-based neurologicaldiagnosis may not work well on intention recognition. There-fore, a general EEG signal classification method is expected tobe both efficient and robust across various domains for betterusability and suitability.
Third, EEG signals have a low signal-to-noise ratio andmore chaotic than other sensor signals such as wearable sen-sors. Thus, the segment-based classification which is widelyused in sensing signal classification may not fit cognitiveactivity recognition. A segment contains some continuousEEG samples clipped by the sliding window method [12]while a single EEG sample (also called EEG instance) iscollected at a specific time point. In particular, segment-based classification has two drawbacks compared with sample-based classification: 1) in a segment with many samples, the
arX
iv:1
802.
0399
6v5
[cs
.HC
] 2
4 A
ug 2
019
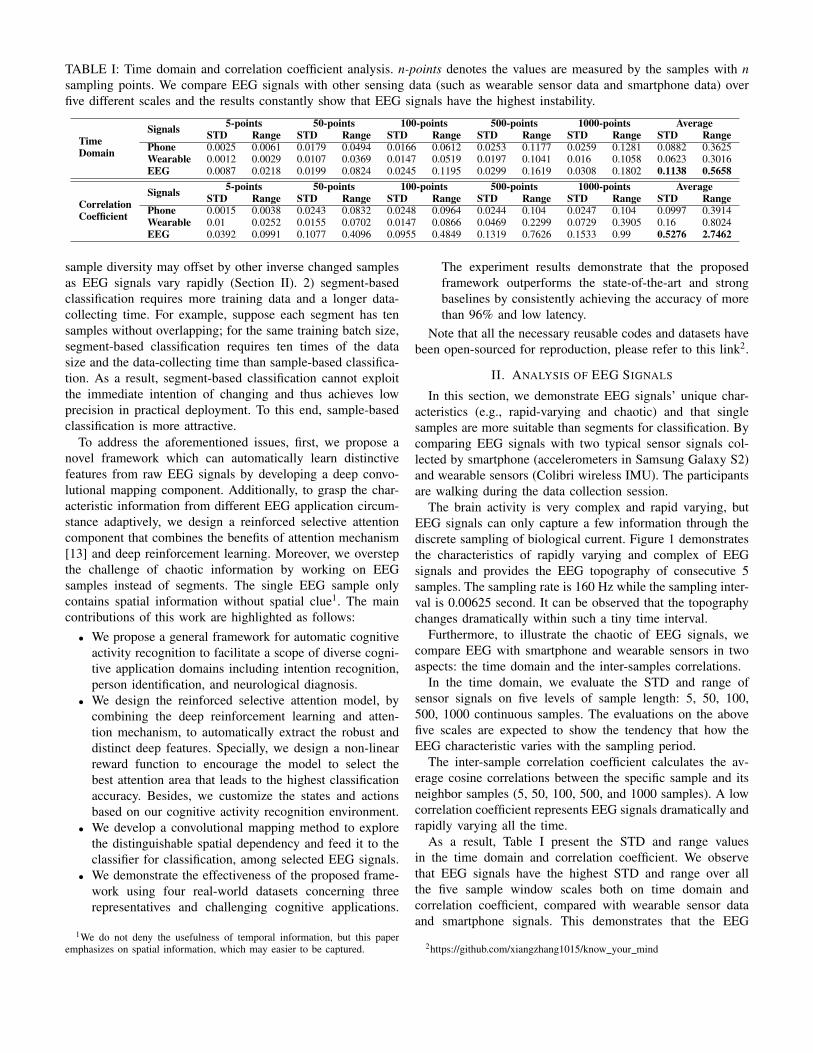
TABLE I: Time domain and correlation coefficient analysis. n-points denotes the values are measured by the samples with nsampling points. We compare EEG signals with other sensing data (such as wearable sensor data and smartphone data) overfive different scales and the results constantly show that EEG signals have the highest instability.
TimeDomain
Signals 5-points 50-points 100-points 500-points 1000-points AverageSTD Range STD Range STD Range STD Range STD Range STD Range
Phone 0.0025 0.0061 0.0179 0.0494 0.0166 0.0612 0.0253 0.1177 0.0259 0.1281 0.0882 0.3625Wearable 0.0012 0.0029 0.0107 0.0369 0.0147 0.0519 0.0197 0.1041 0.016 0.1058 0.0623 0.3016EEG 0.0087 0.0218 0.0199 0.0824 0.0245 0.1195 0.0299 0.1619 0.0308 0.1802 0.1138 0.5658
CorrelationCoefficient
Signals 5-points 50-points 100-points 500-points 1000-points AverageSTD Range STD Range STD Range STD Range STD Range STD Range
Phone 0.0015 0.0038 0.0243 0.0832 0.0248 0.0964 0.0244 0.104 0.0247 0.104 0.0997 0.3914Wearable 0.01 0.0252 0.0155 0.0702 0.0147 0.0866 0.0469 0.2299 0.0729 0.3905 0.16 0.8024EEG 0.0392 0.0991 0.1077 0.4096 0.0955 0.4849 0.1319 0.7626 0.1533 0.99 0.5276 2.7462
sample diversity may offset by other inverse changed samplesas EEG signals vary rapidly (Section II). 2) segment-basedclassification requires more training data and a longer data-collecting time. For example, suppose each segment has tensamples without overlapping; for the same training batch size,segment-based classification requires ten times of the datasize and the data-collecting time than sample-based classifica-tion. As a result, segment-based classification cannot exploitthe immediate intention of changing and thus achieves lowprecision in practical deployment. To this end, sample-basedclassification is more attractive.
To address the aforementioned issues, first, we propose anovel framework which can automatically learn distinctivefeatures from raw EEG signals by developing a deep convo-lutional mapping component. Additionally, to grasp the char-acteristic information from different EEG application circum-stance adaptively, we design a reinforced selective attentioncomponent that combines the benefits of attention mechanism[13] and deep reinforcement learning. Moreover, we overstepthe challenge of chaotic information by working on EEGsamples instead of segments. The single EEG sample onlycontains spatial information without spatial clue1. The maincontributions of this work are highlighted as follows:• We propose a general framework for automatic cognitive
activity recognition to facilitate a scope of diverse cogni-tive application domains including intention recognition,person identification, and neurological diagnosis.
• We design the reinforced selective attention model, bycombining the deep reinforcement learning and atten-tion mechanism, to automatically extract the robust anddistinct deep features. Specially, we design a non-linearreward function to encourage the model to select thebest attention area that leads to the highest classificationaccuracy. Besides, we customize the states and actionsbased on our cognitive activity recognition environment.
• We develop a convolutional mapping method to explorethe distinguishable spatial dependency and feed it to theclassifier for classification, among selected EEG signals.
• We demonstrate the effectiveness of the proposed frame-work using four real-world datasets concerning threerepresentatives and challenging cognitive applications.
1We do not deny the usefulness of temporal information, but this paperemphasizes on spatial information, which may easier to be captured.
The experiment results demonstrate that the proposedframework outperforms the state-of-the-art and strongbaselines by consistently achieving the accuracy of morethan 96% and low latency.
Note that all the necessary reusable codes and datasets havebeen open-sourced for reproduction, please refer to this link2.
II. ANALYSIS OF EEG SIGNALS
In this section, we demonstrate EEG signals’ unique char-acteristics (e.g., rapid-varying and chaotic) and that singlesamples are more suitable than segments for classification. Bycomparing EEG signals with two typical sensor signals col-lected by smartphone (accelerometers in Samsung Galaxy S2)and wearable sensors (Colibri wireless IMU). The participantsare walking during the data collection session.
The brain activity is very complex and rapid varying, butEEG signals can only capture a few information through thediscrete sampling of biological current. Figure 1 demonstratesthe characteristics of rapidly varying and complex of EEGsignals and provides the EEG topography of consecutive 5samples. The sampling rate is 160 Hz while the sampling inter-val is 0.00625 second. It can be observed that the topographychanges dramatically within such a tiny time interval.
Furthermore, to illustrate the chaotic of EEG signals, wecompare EEG with smartphone and wearable sensors in twoaspects: the time domain and the inter-samples correlations.
In the time domain, we evaluate the STD and range ofsensor signals on five levels of sample length: 5, 50, 100,500, 1000 continuous samples. The evaluations on the abovefive scales are expected to show the tendency that how theEEG characteristic varies with the sampling period.
The inter-sample correlation coefficient calculates the av-erage cosine correlations between the specific sample and itsneighbor samples (5, 50, 100, 500, and 1000 samples). A lowcorrelation coefficient represents EEG signals dramatically andrapidly varying all the time.
As a result, Table I present the STD and range valuesin the time domain and correlation coefficient. We observethat EEG signals have the highest STD and range over allthe five sample window scales both on time domain andcorrelation coefficient, compared with wearable sensor dataand smartphone signals. This demonstrates that the EEG
2https://github.com/xiangzhang1015/know your mind
sample has more unstable correlations with neighbors and theinstability is very high even in the nearest five samples. Morespecifically, EEG signals are very chaotic and rapidly changingat each single sampling point.
III. PROPOSED METHOD
Based on the above analysis, we propose reinforced attentiveconvolutional neural networks (CNNs) to classify raw EEGsignals accurately and efficiently directly. The overall work-flow is shown in Figure 2.
A. Replicate and Shuffle
To provide as much as possible information, we designan approach to exploit the spatial relationships among EEGsignals. The signals belonging to different brain activities aresupposed to have different spatial dependent relationships. Wereplicate and shuffle the input EEG signals on dimension-wise.Within this method, all the possible dimension arrangementshave the equiprobable appearance.
Suppose the input raw EEG data are denoted by X ={(xi, yi), i = 1, 2, · · · I}, where (xi, yi) denotes a singleEEG sample and I denotes the number of samples. In eachsample, the feature xi = {xik, k = 1, 2, · · · ,K},xi ∈ RK
contains K elements corresponding to K EEG channels andyi ∈ R denotes the corresponding label. xik denotes the k-thdimension value in the i-th sample.
In real-world collection scenarios, the EEG data are gen-erally concatenated following the distribution of biomedicalEEG channels. However, the biomedical dimension ordermay not present the best spatial dependency. The exhaustingmethod is too computationally expensive to exhaust all thepossible dimension arrangements. For example, a 64-channelEEG sample has A64
64 = 1.28 × 1089 combinations, which isan astronomical figure.
To provide more potential dimension combinations, wepropose a method called Replicate and Shuffle (RS). RSis a two-step mapping method which maps xi to a higherdimensional space x′i with complete element combinations:
xi ∈ RK → x′i ∈ RK′,K ′ > K (1)
In the first step (Replicate), replicating xi for h = K ′/K+1times. Then, we get a new vector with length as h ∗K whichis not less than K ′; in the second step (Shuffle), we randomlyshuffle the replicated vector in the first step and interceptthe first K ′ elements to generate x′i. Theoretically, comparedwith xi, x′i contains more diverse dimension combinations.Note, this RS operation only be performed once for a specificinput dataset in order to provide a stable environment for thefollowing reinforcement learning.
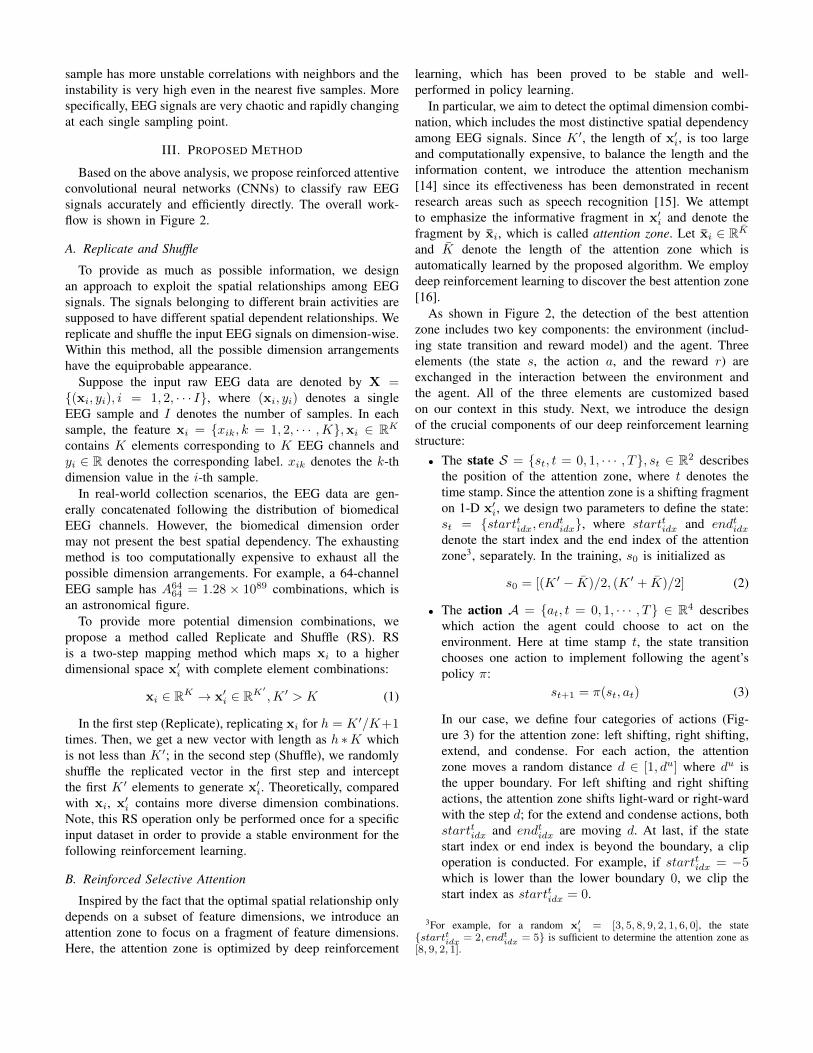
B. Reinforced Selective Attention
Inspired by the fact that the optimal spatial relationship onlydepends on a subset of feature dimensions, we introduce anattention zone to focus on a fragment of feature dimensions.Here, the attention zone is optimized by deep reinforcement
learning, which has been proved to be stable and well-performed in policy learning.
In particular, we aim to detect the optimal dimension combi-nation, which includes the most distinctive spatial dependencyamong EEG signals. Since K ′, the length of x′i, is too largeand computationally expensive, to balance the length and theinformation content, we introduce the attention mechanism[14] since its effectiveness has been demonstrated in recentresearch areas such as speech recognition [15]. We attemptto emphasize the informative fragment in x′i and denote thefragment by xi, which is called attention zone. Let xi ∈ RK
and K denote the length of the attention zone which isautomatically learned by the proposed algorithm. We employdeep reinforcement learning to discover the best attention zone[16].
As shown in Figure 2, the detection of the best attentionzone includes two key components: the environment (includ-ing state transition and reward model) and the agent. Threeelements (the state s, the action a, and the reward r) areexchanged in the interaction between the environment andthe agent. All of the three elements are customized basedon our context in this study. Next, we introduce the designof the crucial components of our deep reinforcement learningstructure:• The state S = {st, t = 0, 1, · · · , T}, st ∈ R2 describes
the position of the attention zone, where t denotes thetime stamp. Since the attention zone is a shifting fragmenton 1-D x′i, we design two parameters to define the state:st = {starttidx, endtidx}, where starttidx and endtidxdenote the start index and the end index of the attentionzone3, separately. In the training, s0 is initialized as
s0 = [(K ′ − K)/2, (K ′ + K)/2] (2)
• The action A = {at, t = 0, 1, · · · , T} ∈ R4 describeswhich action the agent could choose to act on theenvironment. Here at time stamp t, the state transitionchooses one action to implement following the agent’spolicy π:
st+1 = π(st, at) (3)
In our case, we define four categories of actions (Fig-ure 3) for the attention zone: left shifting, right shifting,extend, and condense. For each action, the attentionzone moves a random distance d ∈ [1, du] where du isthe upper boundary. For left shifting and right shiftingactions, the attention zone shifts light-ward or right-wardwith the step d; for the extend and condense actions, bothstarttidx and endtidx are moving d. At last, if the statestart index or end index is beyond the boundary, a clipoperation is conducted. For example, if starttidx = −5which is lower than the lower boundary 0, we clip thestart index as starttidx = 0.
3For example, for a random x′i = [3, 5, 8, 9, 2, 1, 6, 0], the state{starttidx = 2, endtidx = 5} is sufficient to determine the attention zone as[8, 9, 2, 1].

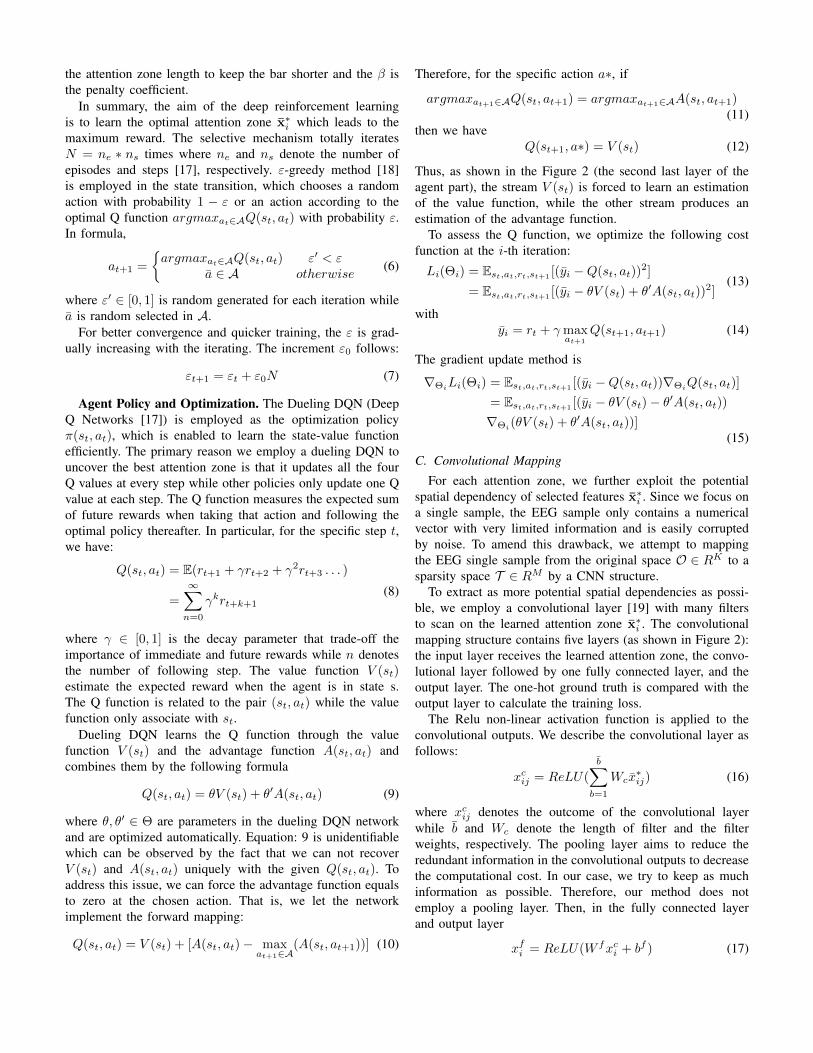
Fig. 2: Flowchart of the proposed approach. The input raw EEG single sample xi (K denotes the Kth element) is replicated andshuffled to provide more latent spatial combinations of feature dimensions. Then, an attention zone xi, which is a fragment inx′i, with the state st = {starttidx, endtidx} is selected. The selected attention zone is input to the state transition and the rewardmodel. In each step t, one action is selected by the state transition to update st based on the agent’s feedback. The rewardmodel evaluates the quality of the attention zone by the reward score rt. The dueling DQN is employed to discover the bestattention zone x∗i which will be fed into the convolutional mapping procedure to extract the spatial dependency representation.The represented features will be used for the classification. FCL denotes a fully connected layer. The reward model is thecombination of the convolutional mapping and the classifier.
Fig. 3: Four actions in the state transition: left shifting, rightshifting, extend, and condense. The dashed line indicates theposition of the attention zone before the action while the solidline indicates after the action.
• The reward R = {rt, t = 0, 1, · · · , T} ∈ R is calculatedby the reward model, which will be detailed later. Thereward model Φ:
rt = Φ(st) (4)
receives the current state and returns an evaluation as thereward.
Reward Model. Next, we introduce in detail the designof the reward model. The purpose of the reward model is toevaluate how the current state impacts the classification perfor-mance. Intuitively, the state which leads to better classification
performance should have a higher reward: rt = F(st). Weset the reward modal F as a combination of the convolutionalmapping and classification (Section III-C). Since in the practi-cal approach optimization, the higher the accuracy is, the moredifficult to increase the classification accuracy. For example,improving the accuracy on a higher level (e.g., from 90% to100%) is much harder than on a lower level(e.g., from 50%to 60%). To encourage accuracy improvement at the higherlevel, we design a non-linear reward function:
rt =eacc
e− 1− β K
K ′(5)
where acc denotes the classification accuracy. The functioncontains two parts; the first part is a normalized exponentialfunction with the exponent acc ∈ [0, 1], this part encouragesthe reinforcement learning algorithm to search the better stwhich leads to a higher acc. The motivation of the exponentialfunction is that: the reward growth rate is increasing with theaccuracy’s increase4. The second part is a penalty factor for
4For example, for the same accuracy increment 10%, acc : 90%→ 100%can earn a higher reward increment than acc : 50%→ 60%.
the attention zone length to keep the bar shorter and the β isthe penalty coefficient.
In summary, the aim of the deep reinforcement learningis to learn the optimal attention zone x∗i which leads to themaximum reward. The selective mechanism totally iteratesN = ne ∗ ns times where ne and ns denote the number ofepisodes and steps [17], respectively. ε-greedy method [18]is employed in the state transition, which chooses a randomaction with probability 1 − ε or an action according to theoptimal Q function argmaxat∈AQ(st, at) with probability ε.In formula,
at+1 =
{argmaxat∈AQ(st, at) ε′ < ε
a ∈ A otherwise(6)
where ε′ ∈ [0, 1] is random generated for each iteration whilea is random selected in A.
For better convergence and quicker training, the ε is grad-ually increasing with the iterating. The increment ε0 follows:
εt+1 = εt + ε0N (7)
Agent Policy and Optimization. The Dueling DQN (DeepQ Networks [17]) is employed as the optimization policyπ(st, at), which is enabled to learn the state-value functionefficiently. The primary reason we employ a dueling DQN touncover the best attention zone is that it updates all the fourQ values at every step while other policies only update one Qvalue at each step. The Q function measures the expected sumof future rewards when taking that action and following theoptimal policy thereafter. In particular, for the specific step t,we have:
Q(st, at) = E(rt+1 + γrt+2 + γ2rt+3 . . . )
=
∞∑n=0
γkrt+k+1(8)
where γ ∈ [0, 1] is the decay parameter that trade-off theimportance of immediate and future rewards while n denotesthe number of following step. The value function V (st)estimate the expected reward when the agent is in state s.The Q function is related to the pair (st, at) while the valuefunction only associate with st.
Dueling DQN learns the Q function through the valuefunction V (st) and the advantage function A(st, at) andcombines them by the following formula
Q(st, at) = θV (st) + θ′A(st, at) (9)
where θ, θ′ ∈ Θ are parameters in the dueling DQN networkand are optimized automatically. Equation: 9 is unidentifiablewhich can be observed by the fact that we can not recoverV (st) and A(st, at) uniquely with the given Q(st, at). Toaddress this issue, we can force the advantage function equalsto zero at the chosen action. That is, we let the networkimplement the forward mapping:
Q(st, at) = V (st) + [A(st, at)− maxat+1∈A
(A(st, at+1))] (10)
Therefore, for the specific action a∗, if
argmaxat+1∈AQ(st, at+1) = argmaxat+1∈AA(st, at+1)(11)
then we haveQ(st+1, a∗) = V (st) (12)
Thus, as shown in the Figure 2 (the second last layer of theagent part), the stream V (st) is forced to learn an estimationof the value function, while the other stream produces anestimation of the advantage function.
To assess the Q function, we optimize the following costfunction at the i-th iteration:
Li(Θi) = Est,at,rt,st+1[(yi −Q(st, at))
2]
= Est,at,rt,st+1 [(yi − θV (st) + θ′A(st, at))2]
(13)
withyi = rt + γmax
at+1
Q(st+1, at+1) (14)
The gradient update method is
∇ΘiLi(Θi) = Est,at,rt,st+1
[(yi −Q(st, at))∇ΘiQ(st, at)]
= Est,at,rt,st+1[(yi − θV (st)− θ′A(st, at))
∇Θi(θV (st) + θ′A(st, at))]
(15)
C. Convolutional Mapping
For each attention zone, we further exploit the potentialspatial dependency of selected features x∗i . Since we focus ona single sample, the EEG sample only contains a numericalvector with very limited information and is easily corruptedby noise. To amend this drawback, we attempt to mappingthe EEG single sample from the original space O ∈ RK to asparsity space T ∈ RM by a CNN structure.
To extract as more potential spatial dependencies as possi-ble, we employ a convolutional layer [19] with many filtersto scan on the learned attention zone x∗i . The convolutionalmapping structure contains five layers (as shown in Figure 2):the input layer receives the learned attention zone, the convo-lutional layer followed by one fully connected layer, and theoutput layer. The one-hot ground truth is compared with theoutput layer to calculate the training loss.
The Relu non-linear activation function is applied to theconvolutional outputs. We describe the convolutional layer asfollows:
xcij = ReLU(
b∑b=1
Wcx∗ij) (16)
where xcij denotes the outcome of the convolutional layerwhile b and Wc denote the length of filter and the filterweights, respectively. The pooling layer aims to reduce theredundant information in the convolutional outputs to decreasethe computational cost. In our case, we try to keep as muchinformation as possible. Therefore, our method does notemploy a pooling layer. Then, in the fully connected layerand output layer
xfi = ReLU(W fxci + bf ) (17)
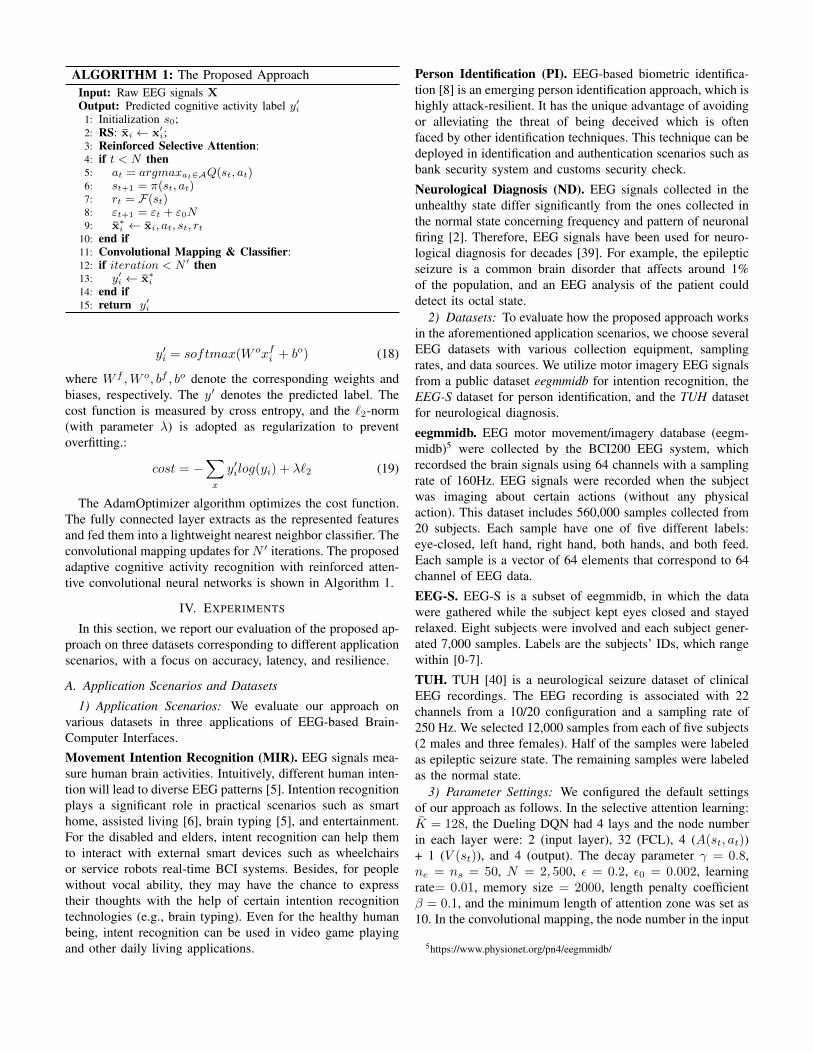
ALGORITHM 1: The Proposed ApproachInput: Raw EEG signals XOutput: Predicted cognitive activity label y′i
1: Initialization s0;2: RS: xi ← x′i;3: Reinforced Selective Attention:4: if t < N then5: at = argmaxat∈AQ(st, at)6: st+1 = π(st, at)7: rt = F(st)8: εt+1 = εt + ε0N9: x∗i ← xi, at, st, rt
10: end if11: Convolutional Mapping & Classifier:12: if iteration < N ′ then13: y′i ← x∗i14: end if15: return y′i
y′i = softmax(W oxfi + bo) (18)
where W f ,W o, bf , bo denote the corresponding weights andbiases, respectively. The y′ denotes the predicted label. Thecost function is measured by cross entropy, and the `2-norm(with parameter λ) is adopted as regularization to preventoverfitting.:
cost = −∑x
y′ilog(yi) + λ`2 (19)
The AdamOptimizer algorithm optimizes the cost function.The fully connected layer extracts as the represented featuresand fed them into a lightweight nearest neighbor classifier. Theconvolutional mapping updates for N ′ iterations. The proposedadaptive cognitive activity recognition with reinforced atten-tive convolutional neural networks is shown in Algorithm 1.
IV. EXPERIMENTS
In this section, we report our evaluation of the proposed ap-proach on three datasets corresponding to different applicationscenarios, with a focus on accuracy, latency, and resilience.
A. Application Scenarios and Datasets
1) Application Scenarios: We evaluate our approach onvarious datasets in three applications of EEG-based Brain-Computer Interfaces.Movement Intention Recognition (MIR). EEG signals mea-sure human brain activities. Intuitively, different human inten-tion will lead to diverse EEG patterns [5]. Intention recognitionplays a significant role in practical scenarios such as smarthome, assisted living [6], brain typing [5], and entertainment.For the disabled and elders, intent recognition can help themto interact with external smart devices such as wheelchairsor service robots real-time BCI systems. Besides, for peoplewithout vocal ability, they may have the chance to expresstheir thoughts with the help of certain intention recognitiontechnologies (e.g., brain typing). Even for the healthy humanbeing, intent recognition can be used in video game playingand other daily living applications.
Person Identification (PI). EEG-based biometric identifica-tion [8] is an emerging person identification approach, which ishighly attack-resilient. It has the unique advantage of avoidingor alleviating the threat of being deceived which is oftenfaced by other identification techniques. This technique can bedeployed in identification and authentication scenarios such asbank security system and customs security check.
Neurological Diagnosis (ND). EEG signals collected in theunhealthy state differ significantly from the ones collected inthe normal state concerning frequency and pattern of neuronalfiring [2]. Therefore, EEG signals have been used for neuro-logical diagnosis for decades [39]. For example, the epilepticseizure is a common brain disorder that affects around 1%of the population, and an EEG analysis of the patient coulddetect its octal state.
2) Datasets: To evaluate how the proposed approach worksin the aforementioned application scenarios, we choose severalEEG datasets with various collection equipment, samplingrates, and data sources. We utilize motor imagery EEG signalsfrom a public dataset eegmmidb for intention recognition, theEEG-S dataset for person identification, and the TUH datasetfor neurological diagnosis.
eegmmidb. EEG motor movement/imagery database (eegm-midb)5 were collected by the BCI200 EEG system, whichrecordsed the brain signals using 64 channels with a samplingrate of 160Hz. EEG signals were recorded when the subjectwas imaging about certain actions (without any physicalaction). This dataset includes 560,000 samples collected from20 subjects. Each sample have one of five different labels:eye-closed, left hand, right hand, both hands, and both feed.Each sample is a vector of 64 elements that correspond to 64channel of EEG data.
EEG-S. EEG-S is a subset of eegmmidb, in which the datawere gathered while the subject kept eyes closed and stayedrelaxed. Eight subjects were involved and each subject gener-ated 7,000 samples. Labels are the subjects’ IDs, which rangewithin [0-7].
TUH. TUH [40] is a neurological seizure dataset of clinicalEEG recordings. The EEG recording is associated with 22channels from a 10/20 configuration and a sampling rate of250 Hz. We selected 12,000 samples from each of five subjects(2 males and three females). Half of the samples were labeledas epileptic seizure state. The remaining samples were labeledas the normal state.
3) Parameter Settings: We configured the default settingsof our approach as follows. In the selective attention learning:K = 128, the Dueling DQN had 4 lays and the node numberin each layer were: 2 (input layer), 32 (FCL), 4 (A(st, at))+ 1 (V (st)), and 4 (output). The decay parameter γ = 0.8,ne = ns = 50, N = 2, 500, ε = 0.2, ε0 = 0.002, learningrate= 0.01, memory size = 2000, length penalty coefficientβ = 0.1, and the minimum length of attention zone was set as10. In the convolutional mapping, the node number in the input
5https://www.physionet.org/pn4/eegmmidb/
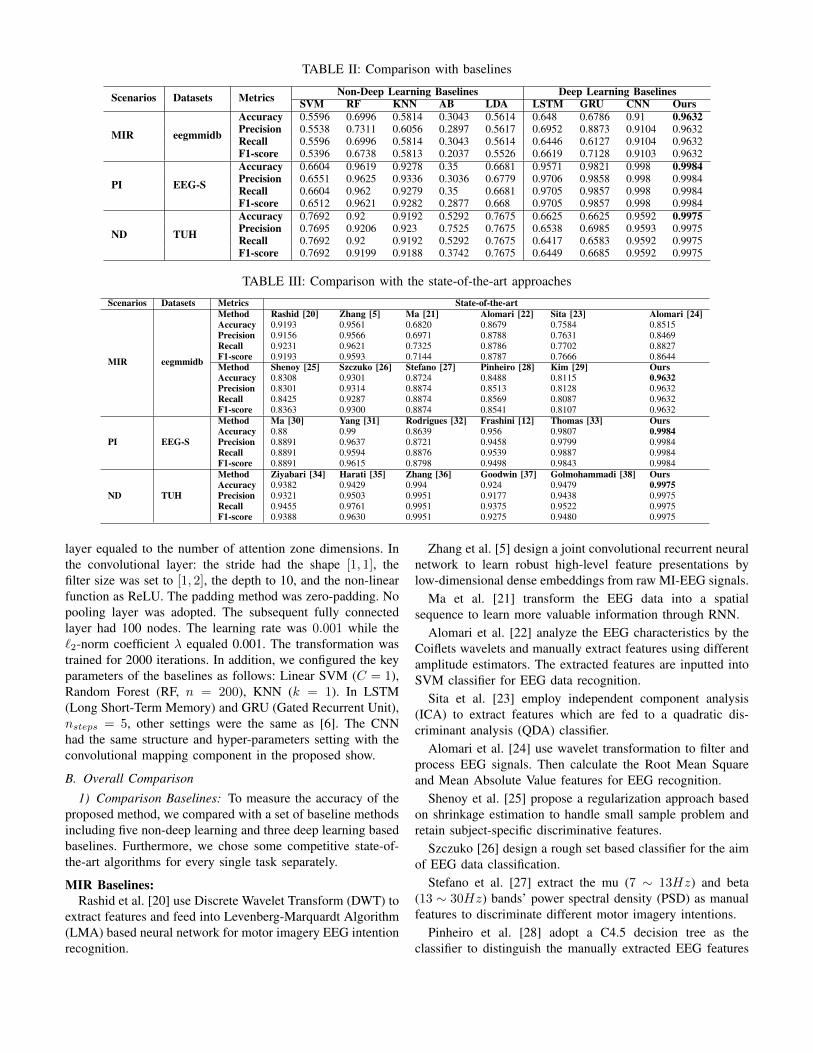
TABLE II: Comparison with baselines
Scenarios Datasets Metrics Non-Deep Learning Baselines Deep Learning BaselinesSVM RF KNN AB LDA LSTM GRU CNN Ours
MIR eegmmidb
Accuracy 0.5596 0.6996 0.5814 0.3043 0.5614 0.648 0.6786 0.91 0.9632Precision 0.5538 0.7311 0.6056 0.2897 0.5617 0.6952 0.8873 0.9104 0.9632Recall 0.5596 0.6996 0.5814 0.3043 0.5614 0.6446 0.6127 0.9104 0.9632F1-score 0.5396 0.6738 0.5813 0.2037 0.5526 0.6619 0.7128 0.9103 0.9632
PI EEG-S
Accuracy 0.6604 0.9619 0.9278 0.35 0.6681 0.9571 0.9821 0.998 0.9984Precision 0.6551 0.9625 0.9336 0.3036 0.6779 0.9706 0.9858 0.998 0.9984Recall 0.6604 0.962 0.9279 0.35 0.6681 0.9705 0.9857 0.998 0.9984F1-score 0.6512 0.9621 0.9282 0.2877 0.668 0.9705 0.9857 0.998 0.9984
ND TUH
Accuracy 0.7692 0.92 0.9192 0.5292 0.7675 0.6625 0.6625 0.9592 0.9975Precision 0.7695 0.9206 0.923 0.7525 0.7675 0.6538 0.6985 0.9593 0.9975Recall 0.7692 0.92 0.9192 0.5292 0.7675 0.6417 0.6583 0.9592 0.9975F1-score 0.7692 0.9199 0.9188 0.3742 0.7675 0.6449 0.6685 0.9592 0.9975
TABLE III: Comparison with the state-of-the-art approaches
Scenarios Datasets Metrics State-of-the-art
MIR eegmmidb
Method Rashid [20] Zhang [5] Ma [21] Alomari [22] Sita [23] Alomari [24]Accuracy 0.9193 0.9561 0.6820 0.8679 0.7584 0.8515Precision 0.9156 0.9566 0.6971 0.8788 0.7631 0.8469Recall 0.9231 0.9621 0.7325 0.8786 0.7702 0.8827F1-score 0.9193 0.9593 0.7144 0.8787 0.7666 0.8644Method Shenoy [25] Szczuko [26] Stefano [27] Pinheiro [28] Kim [29] OursAccuracy 0.8308 0.9301 0.8724 0.8488 0.8115 0.9632Precision 0.8301 0.9314 0.8874 0.8513 0.8128 0.9632Recall 0.8425 0.9287 0.8874 0.8569 0.8087 0.9632F1-score 0.8363 0.9300 0.8874 0.8541 0.8107 0.9632
PI EEG-S
Method Ma [30] Yang [31] Rodrigues [32] Frashini [12] Thomas [33] OursAccuracy 0.88 0.99 0.8639 0.956 0.9807 0.9984Precision 0.8891 0.9637 0.8721 0.9458 0.9799 0.9984Recall 0.8891 0.9594 0.8876 0.9539 0.9887 0.9984F1-score 0.8891 0.9615 0.8798 0.9498 0.9843 0.9984
ND TUH
Method Ziyabari [34] Harati [35] Zhang [36] Goodwin [37] Golmohammadi [38] OursAccuracy 0.9382 0.9429 0.994 0.924 0.9479 0.9975Precision 0.9321 0.9503 0.9951 0.9177 0.9438 0.9975Recall 0.9455 0.9761 0.9951 0.9375 0.9522 0.9975F1-score 0.9388 0.9630 0.9951 0.9275 0.9480 0.9975
layer equaled to the number of attention zone dimensions. Inthe convolutional layer: the stride had the shape [1, 1], thefilter size was set to [1, 2], the depth to 10, and the non-linearfunction as ReLU. The padding method was zero-padding. Nopooling layer was adopted. The subsequent fully connectedlayer had 100 nodes. The learning rate was 0.001 while the`2-norm coefficient λ equaled 0.001. The transformation wastrained for 2000 iterations. In addition, we configured the keyparameters of the baselines as follows: Linear SVM (C = 1),Random Forest (RF, n = 200), KNN (k = 1). In LSTM(Long Short-Term Memory) and GRU (Gated Recurrent Unit),nsteps = 5, other settings were the same as [6]. The CNNhad the same structure and hyper-parameters setting with theconvolutional mapping component in the proposed show.
B. Overall Comparison
1) Comparison Baselines: To measure the accuracy of theproposed method, we compared with a set of baseline methodsincluding five non-deep learning and three deep learning basedbaselines. Furthermore, we chose some competitive state-of-the-art algorithms for every single task separately.
MIR Baselines:Rashid et al. [20] use Discrete Wavelet Transform (DWT) to
extract features and feed into Levenberg-Marquardt Algorithm(LMA) based neural network for motor imagery EEG intentionrecognition.
Zhang et al. [5] design a joint convolutional recurrent neuralnetwork to learn robust high-level feature presentations bylow-dimensional dense embeddings from raw MI-EEG signals.
Ma et al. [21] transform the EEG data into a spatialsequence to learn more valuable information through RNN.
Alomari et al. [22] analyze the EEG characteristics by theCoiflets wavelets and manually extract features using differentamplitude estimators. The extracted features are inputted intoSVM classifier for EEG data recognition.
Sita et al. [23] employ independent component analysis(ICA) to extract features which are fed to a quadratic dis-criminant analysis (QDA) classifier.
Alomari et al. [24] use wavelet transformation to filter andprocess EEG signals. Then calculate the Root Mean Squareand Mean Absolute Value features for EEG recognition.
Shenoy et al. [25] propose a regularization approach basedon shrinkage estimation to handle small sample problem andretain subject-specific discriminative features.
Szczuko [26] design a rough set based classifier for the aimof EEG data classification.
Stefano et al. [27] extract the mu (7 ∼ 13Hz) and beta(13 ∼ 30Hz) bands’ power spectral density (PSD) as manualfeatures to discriminate different motor imagery intentions.
Pinheiro et al. [28] adopt a C4.5 decision tree as theclassifier to distinguish the manually extracted EEG features
(a) CM of eegmmidb (b) CM of EEG-S (c) CM of TUH
(d) ROC of eegmmidb (e) ROC of EEG-S (f) ROC of TUH
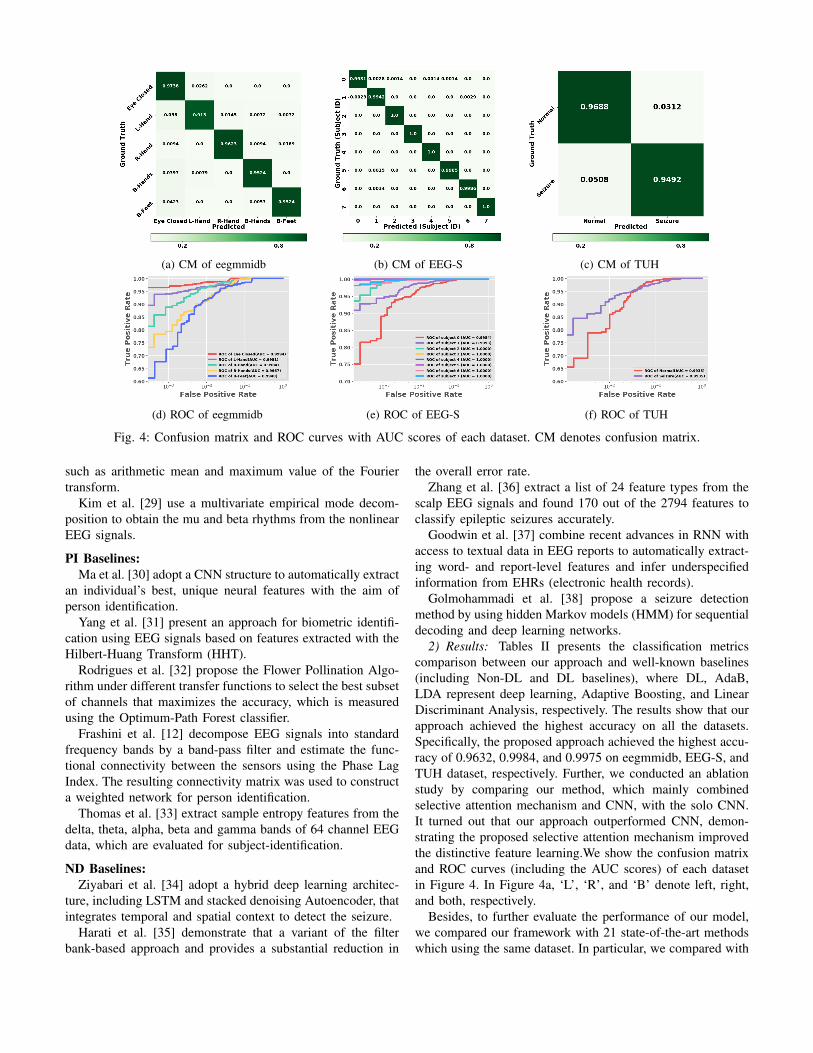
Fig. 4: Confusion matrix and ROC curves with AUC scores of each dataset. CM denotes confusion matrix.
such as arithmetic mean and maximum value of the Fouriertransform.
Kim et al. [29] use a multivariate empirical mode decom-position to obtain the mu and beta rhythms from the nonlinearEEG signals.
PI Baselines:Ma et al. [30] adopt a CNN structure to automatically extract
an individual’s best, unique neural features with the aim ofperson identification.
Yang et al. [31] present an approach for biometric identifi-cation using EEG signals based on features extracted with theHilbert-Huang Transform (HHT).
Rodrigues et al. [32] propose the Flower Pollination Algo-rithm under different transfer functions to select the best subsetof channels that maximizes the accuracy, which is measuredusing the Optimum-Path Forest classifier.
Frashini et al. [12] decompose EEG signals into standardfrequency bands by a band-pass filter and estimate the func-tional connectivity between the sensors using the Phase LagIndex. The resulting connectivity matrix was used to constructa weighted network for person identification.
Thomas et al. [33] extract sample entropy features from thedelta, theta, alpha, beta and gamma bands of 64 channel EEGdata, which are evaluated for subject-identification.
ND Baselines:Ziyabari et al. [34] adopt a hybrid deep learning architec-
ture, including LSTM and stacked denoising Autoencoder, thatintegrates temporal and spatial context to detect the seizure.
Harati et al. [35] demonstrate that a variant of the filterbank-based approach and provides a substantial reduction in
the overall error rate.Zhang et al. [36] extract a list of 24 feature types from the
scalp EEG signals and found 170 out of the 2794 features toclassify epileptic seizures accurately.
Goodwin et al. [37] combine recent advances in RNN withaccess to textual data in EEG reports to automatically extract-ing word- and report-level features and infer underspecifiedinformation from EHRs (electronic health records).
Golmohammadi et al. [38] propose a seizure detectionmethod by using hidden Markov models (HMM) for sequentialdecoding and deep learning networks.
2) Results: Tables II presents the classification metricscomparison between our approach and well-known baselines(including Non-DL and DL baselines), where DL, AdaB,LDA represent deep learning, Adaptive Boosting, and LinearDiscriminant Analysis, respectively. The results show that ourapproach achieved the highest accuracy on all the datasets.Specifically, the proposed approach achieved the highest accu-racy of 0.9632, 0.9984, and 0.9975 on eegmmidb, EEG-S, andTUH dataset, respectively. Further, we conducted an ablationstudy by comparing our method, which mainly combinedselective attention mechanism and CNN, with the solo CNN.It turned out that our approach outperformed CNN, demon-strating the proposed selective attention mechanism improvedthe distinctive feature learning.We show the confusion matrixand ROC curves (including the AUC scores) of each datasetin Figure 4. In Figure 4a, ‘L’, ‘R’, and ‘B’ denote left, right,and both, respectively.
Besides, to further evaluate the performance of our model,we compared our framework with 21 state-of-the-art methodswhich using the same dataset. In particular, we compared with
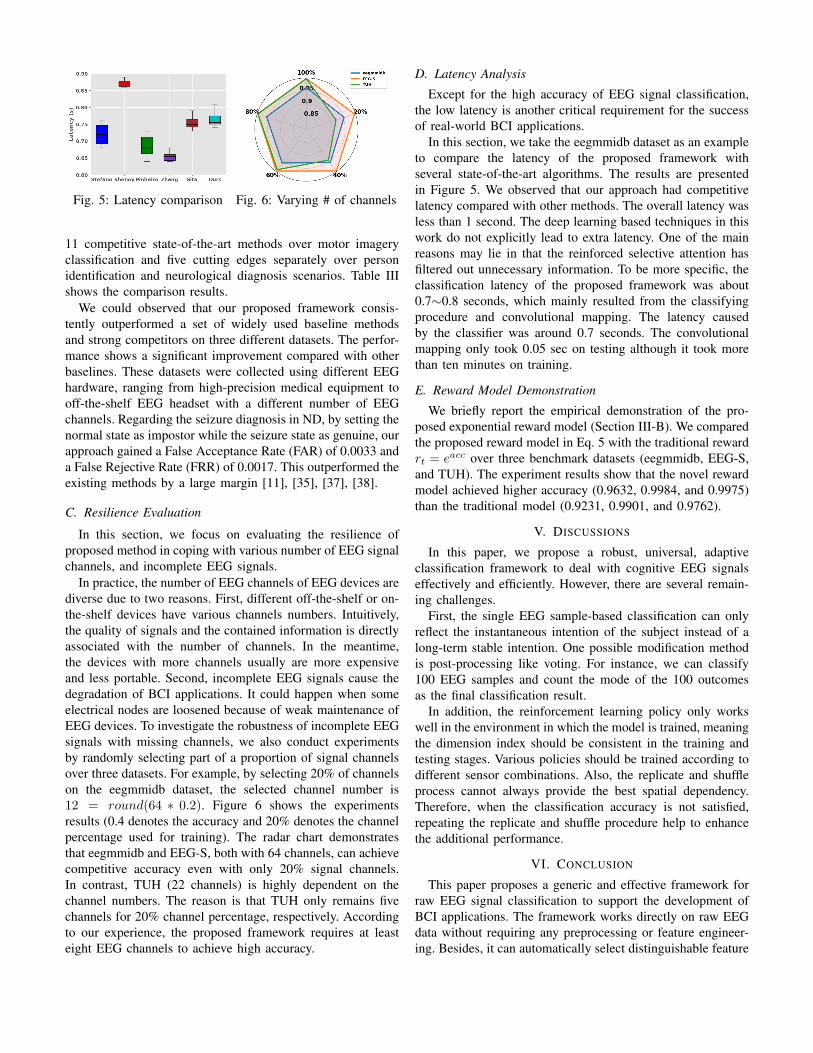
Fig. 5: Latency comparison Fig. 6: Varying # of channels
11 competitive state-of-the-art methods over motor imageryclassification and five cutting edges separately over personidentification and neurological diagnosis scenarios. Table IIIshows the comparison results.
We could observed that our proposed framework consis-tently outperformed a set of widely used baseline methodsand strong competitors on three different datasets. The perfor-mance shows a significant improvement compared with otherbaselines. These datasets were collected using different EEGhardware, ranging from high-precision medical equipment tooff-the-shelf EEG headset with a different number of EEGchannels. Regarding the seizure diagnosis in ND, by setting thenormal state as impostor while the seizure state as genuine, ourapproach gained a False Acceptance Rate (FAR) of 0.0033 anda False Rejective Rate (FRR) of 0.0017. This outperformed theexisting methods by a large margin [11], [35], [37], [38].
C. Resilience Evaluation
In this section, we focus on evaluating the resilience ofproposed method in coping with various number of EEG signalchannels, and incomplete EEG signals.
In practice, the number of EEG channels of EEG devices arediverse due to two reasons. First, different off-the-shelf or on-the-shelf devices have various channels numbers. Intuitively,the quality of signals and the contained information is directlyassociated with the number of channels. In the meantime,the devices with more channels usually are more expensiveand less portable. Second, incomplete EEG signals cause thedegradation of BCI applications. It could happen when someelectrical nodes are loosened because of weak maintenance ofEEG devices. To investigate the robustness of incomplete EEGsignals with missing channels, we also conduct experimentsby randomly selecting part of a proportion of signal channelsover three datasets. For example, by selecting 20% of channelson the eegmmidb dataset, the selected channel number is12 = round(64 ∗ 0.2). Figure 6 shows the experimentsresults (0.4 denotes the accuracy and 20% denotes the channelpercentage used for training). The radar chart demonstratesthat eegmmidb and EEG-S, both with 64 channels, can achievecompetitive accuracy even with only 20% signal channels.In contrast, TUH (22 channels) is highly dependent on thechannel numbers. The reason is that TUH only remains fivechannels for 20% channel percentage, respectively. Accordingto our experience, the proposed framework requires at leasteight EEG channels to achieve high accuracy.
D. Latency Analysis
Except for the high accuracy of EEG signal classification,the low latency is another critical requirement for the successof real-world BCI applications.
In this section, we take the eegmmidb dataset as an exampleto compare the latency of the proposed framework withseveral state-of-the-art algorithms. The results are presentedin Figure 5. We observed that our approach had competitivelatency compared with other methods. The overall latency wasless than 1 second. The deep learning based techniques in thiswork do not explicitly lead to extra latency. One of the mainreasons may lie in that the reinforced selective attention hasfiltered out unnecessary information. To be more specific, theclassification latency of the proposed framework was about0.7∼0.8 seconds, which mainly resulted from the classifyingprocedure and convolutional mapping. The latency causedby the classifier was around 0.7 seconds. The convolutionalmapping only took 0.05 sec on testing although it took morethan ten minutes on training.
E. Reward Model Demonstration
We briefly report the empirical demonstration of the pro-posed exponential reward model (Section III-B). We comparedthe proposed reward model in Eq. 5 with the traditional rewardrt = eacc over three benchmark datasets (eegmmidb, EEG-S,and TUH). The experiment results show that the novel rewardmodel achieved higher accuracy (0.9632, 0.9984, and 0.9975)than the traditional model (0.9231, 0.9901, and 0.9762).
V. DISCUSSIONS
In this paper, we propose a robust, universal, adaptiveclassification framework to deal with cognitive EEG signalseffectively and efficiently. However, there are several remain-ing challenges.
First, the single EEG sample-based classification can onlyreflect the instantaneous intention of the subject instead of along-term stable intention. One possible modification methodis post-processing like voting. For instance, we can classify100 EEG samples and count the mode of the 100 outcomesas the final classification result.
In addition, the reinforcement learning policy only workswell in the environment in which the model is trained, meaningthe dimension index should be consistent in the training andtesting stages. Various policies should be trained according todifferent sensor combinations. Also, the replicate and shuffleprocess cannot always provide the best spatial dependency.Therefore, when the classification accuracy is not satisfied,repeating the replicate and shuffle procedure help to enhancethe additional performance.
VI. CONCLUSION
This paper proposes a generic and effective framework forraw EEG signal classification to support the development ofBCI applications. The framework works directly on raw EEGdata without requiring any preprocessing or feature engineer-ing. Besides, it can automatically select distinguishable feature

dimensions for different EEG data, thus achieving high usabil-ity. We conduct extensive experiments on three well-knownpublic datasets and one local dataset. The experimental resultsdemonstrate that our approach not only outperforms severalstate-of-the-art baselines by a large margin but also shows lowlatency and high resilience in coping with multiple EEG signalchannels and incomplete EEG signals. Our approach appliesto wider application scenarios such as intention recognition,person identification, and neurological diagnosis.
VII. ACKNOWLEDGMENTS
This research was partially supported by grant ONRGNICOP N62909-19-1-2009.
REFERENCES
[1] X. Zhang, L. Yao, X. Wang, J. Monaghan, D. Mcalpine, and Y. Zhang,“A survey on deep learning based brain computer interface: Recentadvances and new frontiers,” arXiv preprint arXiv:1905.04149, 2019.
[2] H. Adeli, S. Ghosh-Dastidar, and N. Dadmehr, “A wavelet-chaosmethodology for analysis of eegs and eeg subbands to detect seizureand epilepsy,” IEEE Transactions on Biomedical Engineering, vol. 54,no. 2, pp. 205–211, 2007.
[3] D. Zhang, L. Yao, X. Zhang, S. Wang, W. Chen, and R. Boots, “Eeg-based intention recognition from spatio-temporal representations viacascade and parallel convolutional recurrent neural networks,” in AAAI,2018.
[4] A. Vallabhaneni, T. Wang, and B. He, “Brain computer interface,” inNeural engineering. Springer, 2005, pp. 85–121.
[5] X. Zhang, L. Yao, Q. Z. Sheng, S. S. Kanhere, T. Gu, and D. Zhang,“Converting your thoughts to texts: Enabling brain typing via deepfeature learning of eeg signals,” 2018.
[6] X. Zhang, L. Yao, C. Huang, Q. Z. Sheng, and X. Wang, “Intentrecognition in smart living through deep recurrent neural networks,”in ICONIP. Springer, 2017, pp. 748–758.
[7] C. V. Russoniello, K. OBrien, and J. M. Parks, “The effectiveness ofcasual video games in improving mood and decreasing stress,” Journalof CyberTherapy & Rehabilitation, vol. 2, no. 1, pp. 53–66, 2009.
[8] V. Schetinin, L. Jakaite, N. Nyah, D. Novakovic, and W. Krzanowski,“Feature extraction with gmdh-type neural networks for eeg-basedperson identification,” IJNS, p. 1750064, 2017.
[9] X. Zhang, L. Yao, S. S. Kanhere, Y. Liu, T. Gu, and K. Chen, “Mindid:Person identification from brain waves through attention-based recurrentneural network,” ACM IMWUT, vol. 2, no. 3, p. 149, 2018.
[10] V. Veeriah, R. Durvasula, and G.-J. Qi, “Deep learning architecture withdynamically programmed layers for brain connectome prediction,” inSIGKDD. ACM, 2015, pp. 1205–1214.
[11] E. Acar, C. A. Bingol, H. Bingol, R. Bro, and B. Yener, “Seizurerecognition on epilepsy feature tensor,” in EMBS. IEEE, 2007, pp.4273–4276.
[12] M. Fraschini, A. Hillebrand, M. Demuru, L. Didaci, and G. L. Marcialis,“An eeg-based biometric system using eigenvector centrality in restingstate brain networks,” IEEE Signal Processing Letters, vol. 22, no. 6,pp. 666–670, 2015.
[13] X. Zhang, L. Yao, C. Huang, S. Wang, M. Tan, G. Long, and C. Wang,“Multi-modality sensor data classification with selective attention,” inIJCAI-18, 2018, pp. 3111–3117.
[14] P. Cavanagh et al., “Attention-based motion perception,” Science, vol.257, no. 5076, pp. 1563–1565, 1992.
[15] J. K. Chorowski, D. Bahdanau, D. Serdyuk, K. Cho, and Y. Bengio,“Attention-based models for speech recognition,” in NeurIPS, 2015, pp.577–585.
[16] V. Mnih, K. Kavukcuoglu, D. Silver, A. A. Rusu, J. Veness, M. G.Bellemare, A. Graves, M. Riedmiller, A. K. Fidjeland, G. Ostrovskiet al., “Human-level control through deep reinforcement learning,”Nature, vol. 518, no. 7540, p. 529, 2015.
[17] Z. Wang, T. Schaul, M. Hessel, H. Van Hasselt, M. Lanctot, andN. De Freitas, “Dueling network architectures for deep reinforcementlearning,” vol. 48, 2016, pp. 1995–2003.
[18] M. Tokic, “Adaptive ε-greedy exploration in reinforcement learningbased on value differences,” in Annual Conference on Artificial Intelli-gence. Springer, 2010, pp. 203–210.
[19] A. Krizhevsky, I. Sutskever, and G. E. Hinton, “Imagenet classificationwith deep convolutional neural networks,” in NeurIPS, 2012, pp. 1097–1105.
[20] M. M. or Rashid and M. Ahmad, “Classification of motor imagery handsmovement using levenberg-marquardt algorithm based on statisticalfeatures of eeg signal,” in ICEEICT. IEEE, 2016, pp. 1–6.
[21] X. Ma, S. Qiu, C. Du, J. Xing, and H. He, “Improving eeg-basedmotor imagery classification via spatial and temporal recurrent neuralnetworks,” in EMBC. IEEE, 2018, pp. 1903–1906.
[22] M. H. Alomari, A. AbuBaker, A. Turani, A. M. Baniyounes, andA. Manasreh, “Eeg mouse: A machine learning-based brain computerinterface,” IJACSA, vol. 5, no. 4, pp. 193–198, 2014.
[23] J. Sita and G. Nair, “Feature extraction and classification of eeg signalsfor mapping motor area of the brain,” in ICCC. IEEE, 2013, pp. 463–468.
[24] M. H. Alomari, A. M. Baniyounes, and E. A. Awada, “Eeg-basedclassification of imagined fists movements using machine learning andwavelet transform analysis,” International Journal of Advancements inElectronics and Electrical Engineering, vol. 3, no. 3, pp. 83–87, 2014.
[25] H. V. Shenoy, A. Vinod, and C. Guan, “Shrinkage estimator basedregularization for eeg motor imagery classification,” in ICICS. IEEE,2015.
[26] P. Szczuko, “Real and imaginary motion classification based on rough setanalysis of eeg signals for multimedia applications,” Multimedia Toolsand Applications, vol. 76, no. 24, pp. 25 697–25 711, 2017.
[27] C. A. Stefano Filho, R. Attux, and G. Castellano, “Eeg sensorimotorrhythms variation and functional connectivity measures during motorimagery: linear relations and classification approaches,” PeerJ, vol. 5, p.e3983, 2017.
[28] O. R. Pinheiro, L. R. Alves, M. Romero, and J. R. de Souza, “Wheelchairsimulator game for training people with severe disabilities,” in TISHW.IEEE, 2016.
[29] Y. Kim, J. Ryu, K. K. Kim, C. C. Took, D. P. Mandic, and C. Park,“Motor imagery classification using mu and beta rhythms of eeg withstrong uncorrelating transform based complex common spatial patterns,”Computational intelligence and neuroscience, vol. 2016, pp. 1–14, 2016.
[30] L. Ma, J. W. Minett, T. Blu, and W. S. Wang, “Resting state eeg-based biometrics for individual identification using convolutional neuralnetworks,” in EMBC. IEEE, 2015, pp. 2848–2851.
[31] S. Yang and F. Deravi, “Novel hht-based features for biometric identi-fication using eeg signals,” in ICPR. IEEE, 2014, pp. 1922–1927.
[32] D. Rodrigues, G. F. Silva, J. P. Papa, A. N. Marana, and X.-S.Yang, “Eeg-based person identification through binary flower pollinationalgorithm,” Expert Systems with Applications, vol. 62, pp. 81–90, 2016.
[33] K. P. Thomas and A. P. Vinod, “Biometric identification of persons usingsample entropy features of eeg during rest state,” in SMC. IEEE, 2016,pp. 003 487–003 492.
[34] S. Ziyabari, V. Shah, M. Golmohammadi, I. Obeid, and J. Picone,“Objective evaluation metrics for automatic classification of eeg events,”arXiv preprint arXiv:1712.10107, 2017.
[35] A. Harati, M. Golmohammadi, S. Lopez, I. Obeid, and J. Picone,“Improved eeg event classification using differential energy,” in SPMB.IEEE, 2015, pp. 1–4.
[36] Y. Zhang, S. Yang, Y. Liu, Y. Zhang, B. Han, and F. Zhou, “Integrationof 24 feature types to accurately detect and predict seizures using scalpeeg signals,” Sensors (Basel, Switzerland), vol. 18, no. 5, 2018.
[37] T. R. Goodwin and S. M. Harabagiu, “Deep learning from eeg reports forinferring underspecified information,” AMIA Summits on TranslationalScience Proceedings, vol. 2017, pp. 112–121, 2017.
[38] M. Golmohammadi, A. H. H. N. Torbati, S. L. de Diego, I. Obeid, andJ. Picone, “Automatic analysis of eegs using big data and hybrid deeplearning architectures,” arXiv preprint arXiv:1712.09771, 2017.
[39] X. Zhang, L. Yao, and F. Yuan, “Adversarial variational embedding forrobust semi-supervised learning,” in SIGKDD, 2019, pp. 139–147.
[40] M. Golmohammadi, V. Shah, S. Lopez, S. Ziyabari, S. Yang, J. Cama-ratta, I. Obeid, and J. Picone, “The tuh eeg seizure corpus,” in ACNSAnnual Meeting, 2017, p. 1.