knowledge tier platform for graph mining in (smart) citiesceur-ws.org/vol-1743/paper13.pdf ·...
TRANSCRIPT

Knowledge Tier Platform for Graph Mining in (Smart) Cities
Miguel Nunez-del-Prado Edgardo Bravo Miguel SierraIsaias Hoyos Miguel Canchay
Universidad del PacficoAv. Salaverry 2020
Lima - Peru{m.nunezdelpradoc,er.bravoo,l.sierraflores,i.hoyoslopez,cacnayd}@up.edu.pe
AbstractIn the present effort, we present a knowl-edge tier platform to collect informationfrom cities in a form of graphs. This plat-form enables people to share the infor-mation of the area where they live allow-ing them to inform about pollution, crimelevels, traffic jams, streets topology, com-merces, markets, etc. The main objec-tive is to provide information, stored inElastic about a city to find spatio-temporalpatterns using Graph Mining techniquesbased on Apache Spark GraphX.
1 IntroductionIn the last years, we have seen the explosion ofdata from on-line activity, user content generated,health, scientific computing, mobile phones activ-ity, etc. This data increments due to the dailytransaction of people in urban centers and stillgrows. By 2030, 60% of the worldwide popu-lation will live in cities appearing 27 megacitiesgreater than 10 million inhabitants (Chourabi etal., 2012). One technique to solve this problemis to generate new instruments for gathering andcombining information continuously (Hernandez-Munoz et al., 2011). Consequently, there is an in-crement of collaborative platforms to collect data.For instance, a platform, called WebCar, to col-lect GPS data from vehicles to estimate traffic in acity (Lo et al., 2008). In the field of human health,Psychlog (Gaggioli et al., 2013) is a mobile phoneplatform designed to collect users psychological,physiological, and activity information for mentalhealth research relying on a self-report question-naire. The last example developed an Internet siteand implemented the collection of data for a mul-ticenter study of ethical decision-making (Avidanet al., 2005).
In the present effort, we present a knowledgetire platform to collect information on cities in a
form of graphs. This platform enables people toshare the knowledge of the area where they liveallowing them to inform about pollution, crimelevels, traffic jams, streets topology, commerces,markets, etc. The primary objective is to provideinformation about the city to find spatio-temporalpatterns using Graph Mining techniques.
The present paper is organized as follows. Sec-tion 2 introduce some basic concepts, while Sec-tion 3 describes the platform architecture. Sec-tions 4 and 5 show some preliminary results andpresent the discussion about the platform. Finally,Section 6 concludes the paper and presents futureworks.
2 Basic Concepts
In the current section, we introduce some ba-sic concepts, such as graph, knowledge tiers andSpark for describing the platform.
2.1 GraphA graph is a mathematical structure composed ofvertices, nodes or points, which are connectedthrough edges, lines or arcs as depicted in Figure1. A graph (G = (V,E)) is composed of a set ofV vertices and E edges. in our context this struc-ture allows us to represent street intersections asgeo-referenced nodes and roads as edges.
2.2 Haversine distanceThe Haversine distance (Shumaker and Sinnott,1984) computes the shortest distance between twopoints represented by latitude and longitude in theearth’s surface.
dlon
= lon2 � lon1
dlat
= lat2 � lat1a = (sin(dlat2 ))2 + cos(lat1)⇥
cos(lat2)⇥ (sin(dlon2 ))2
c = 2⇥ atan2(pa,p1� a)
d = R⇥ c
(1)
110
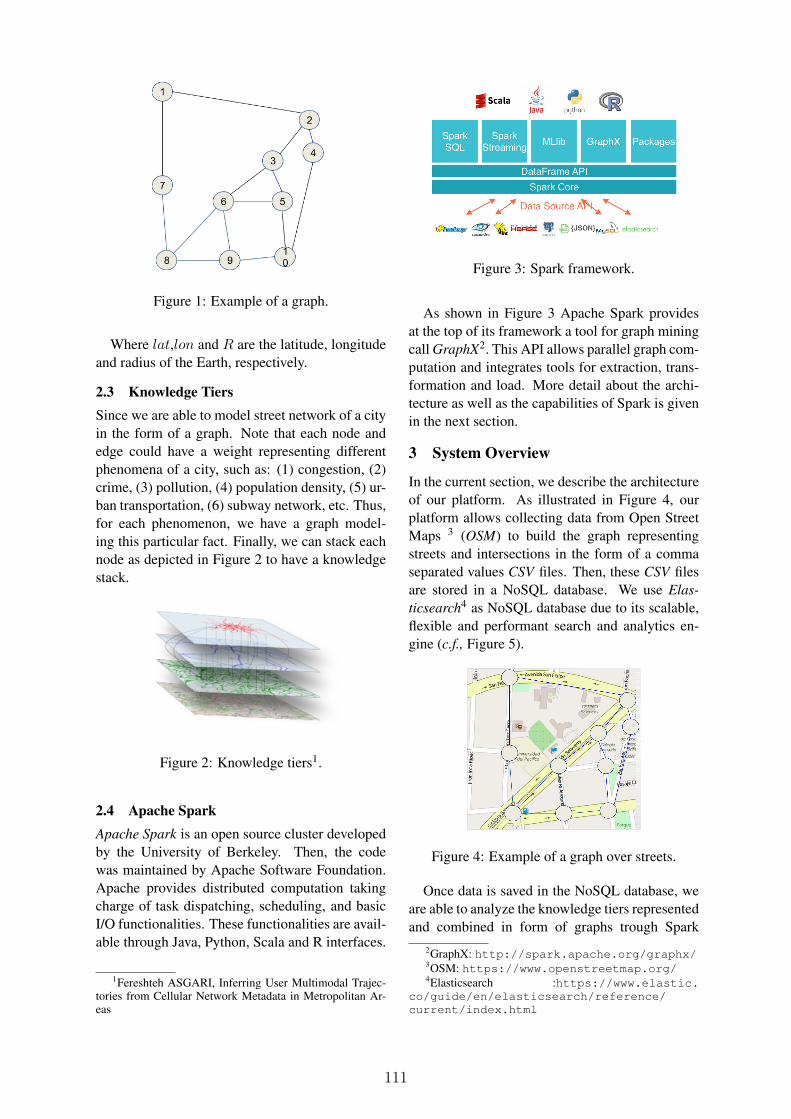
Figure 1: Example of a graph.
Where lat,lon and R are the latitude, longitudeand radius of the Earth, respectively.
2.3 Knowledge TiersSince we are able to model street network of a cityin the form of a graph. Note that each node andedge could have a weight representing differentphenomena of a city, such as: (1) congestion, (2)crime, (3) pollution, (4) population density, (5) ur-ban transportation, (6) subway network, etc. Thus,for each phenomenon, we have a graph model-ing this particular fact. Finally, we can stack eachnode as depicted in Figure 2 to have a knowledgestack.
Figure 2: Knowledge tiers1.
2.4 Apache SparkApache Spark is an open source cluster developedby the University of Berkeley. Then, the codewas maintained by Apache Software Foundation.Apache provides distributed computation takingcharge of task dispatching, scheduling, and basicI/O functionalities. These functionalities are avail-able through Java, Python, Scala and R interfaces.
1Fereshteh ASGARI, Inferring User Multimodal Trajec-tories from Cellular Network Metadata in Metropolitan Ar-eas
Figure 3: Spark framework.
As shown in Figure 3 Apache Spark providesat the top of its framework a tool for graph miningcall GraphX2. This API allows parallel graph com-putation and integrates tools for extraction, trans-formation and load. More detail about the archi-tecture as well as the capabilities of Spark is givenin the next section.
3 System Overview
In the current section, we describe the architectureof our platform. As illustrated in Figure 4, ourplatform allows collecting data from Open StreetMaps 3 (OSM) to build the graph representingstreets and intersections in the form of a commaseparated values CSV files. Then, these CSV filesare stored in a NoSQL database. We use Elas-ticsearch4 as NoSQL database due to its scalable,flexible and performant search and analytics en-gine (c.f., Figure 5).
Figure 4: Example of a graph over streets.
Once data is saved in the NoSQL database, weare able to analyze the knowledge tiers representedand combined in form of graphs trough Spark
2GraphX: http://spark.apache.org/graphx/3OSM: https://www.openstreetmap.org/4Elasticsearch :https://www.elastic.
co/guide/en/elasticsearch/reference/current/index.html
111
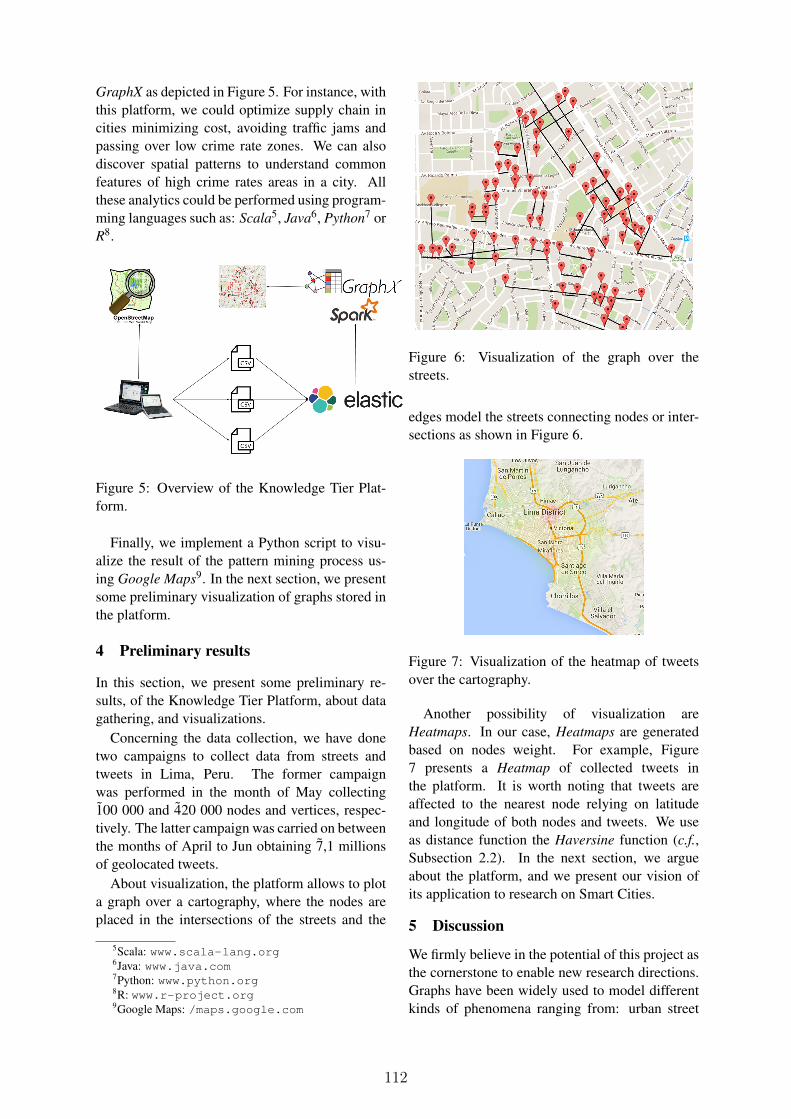
GraphX as depicted in Figure 5. For instance, withthis platform, we could optimize supply chain incities minimizing cost, avoiding traffic jams andpassing over low crime rate zones. We can alsodiscover spatial patterns to understand commonfeatures of high crime rates areas in a city. Allthese analytics could be performed using program-ming languages such as: Scala5, Java6, Python7 orR8.
Figure 5: Overview of the Knowledge Tier Plat-form.
Finally, we implement a Python script to visu-alize the result of the pattern mining process us-ing Google Maps9. In the next section, we presentsome preliminary visualization of graphs stored inthe platform.
4 Preliminary results
In this section, we present some preliminary re-sults, of the Knowledge Tier Platform, about datagathering, and visualizations.
Concerning the data collection, we have donetwo campaigns to collect data from streets andtweets in Lima, Peru. The former campaignwas performed in the month of May collecting100 000 and 420 000 nodes and vertices, respec-tively. The latter campaign was carried on betweenthe months of April to Jun obtaining 7,1 millionsof geolocated tweets.
About visualization, the platform allows to plota graph over a cartography, where the nodes areplaced in the intersections of the streets and the
5Scala: www.scala-lang.org6Java: www.java.com7Python: www.python.org8R: www.r-project.org9Google Maps: /maps.google.com
Figure 6: Visualization of the graph over thestreets.
edges model the streets connecting nodes or inter-sections as shown in Figure 6.
Figure 7: Visualization of the heatmap of tweetsover the cartography.
Another possibility of visualization areHeatmaps. In our case, Heatmaps are generatedbased on nodes weight. For example, Figure7 presents a Heatmap of collected tweets inthe platform. It is worth noting that tweets areaffected to the nearest node relying on latitudeand longitude of both nodes and tweets. We useas distance function the Haversine function (c.f.,Subsection 2.2). In the next section, we argueabout the platform, and we present our vision ofits application to research on Smart Cities.
5 Discussion
We firmly believe in the potential of this project asthe cornerstone to enable new research directions.Graphs have been widely used to model differentkinds of phenomena ranging from: urban street
112

network (Jiang and Claramunt, 2004), urban andregional models (O’Sullivan, 2001), macroscopicmodel of city traffic (Prasanna et al., 2009), modelcity evacuation plan (Yamada, 1996), to plan strat-egy for vehicular ad hoc network in a city environ-ments (Lochert et al., 2003) to mobility models(Mogre et al., 2007). In this project, we plan touse this graph model representing streets and in-tersections to study:
Supply chain from a transportation point of view.When cities have more nanostores than retail-ers, it is more complicated to transport prod-ucts to small spare stores.
Multi-modal transportation is a problem in ur-ban context where individuals need to opti-mize their movements within a city by usingdifferent massive transportation mode.
Crime patterns could be extracted by combiningdifferent features from the graph model.
Pollution dispersion could be modeled by a streetand intersection models to represent and fore-cast particles of matter dynamic in a city.
Social network activity levels could be repre-sented in the urban graph to detect social ac-tivity for extracting the hot spots in a city.
Privacy perception to understand how peopleconsider privacy and what are the real dan-gers and risks.
The aforementioned list of possible research di-rections is not limited to these topics. There aremany issues related to smart cities still opened.
6 Conclusions
In the present work, we have detailed the architec-ture of the Knowledge tier platform. The noveltyof this platform is to gather diverse kind of datafrom different knowledge layers to extract spatio-temporal patterns for smart cities applications. Wehave shown the potential of this platform as thestone corner for many research question in the nearfuture.
ReferencesAlexander Avidan, Charles Weissman, and Charles L
Sprung. 2005. An internet web site as a data collec-tion platform for multicenter research. Anesthesia &Analgesia, 100(2):506–511.
Hafedh Chourabi, Taewoo Nam, Shawn Walker, J Ra-mon Gil-Garcia, Sehl Mellouli, Karine Nahon,Theresa A Pardo, and Hans Jochen Scholl. 2012.Understanding smart cities: An integrative frame-work. In System Science (HICSS), 2012 45thHawaii International Conference on, pages 2289–2297. IEEE.
Andrea Gaggioli, Giovanni Pioggia, Gennaro Tar-tarisco, Giovanni Baldus, Daniele Corda, Pietro Ci-presso, and Giuseppe Riva. 2013. A mobile datacollection platform for mental health research. Per-sonal and Ubiquitous Computing, 17(2):241–251.
Jose M Hernandez-Munoz, Jesus Bernat Vercher,Luis Munoz, Jose A Galache, Mirko Presser, LuisA Hernandez Gomez, and Jan Pettersson. 2011.Smart cities at the forefront of the future internet.In The Future Internet Assembly, pages 447–462.Springer.
Bin Jiang and Christophe Claramunt. 2004. A struc-tural approach to the model generalization of an ur-ban street network. GeoInformatica, 8(2):157–171.
Chia-Hao Lo, Wen-Chih Peng, Chien-Wen Chen, Ting-Yu Lin, and Chun-Shuo Lin. 2008. Carweb: Atraffic data collection platform. In The Ninth Inter-national Conference on Mobile Data Management(mdm 2008), pages 221–222. IEEE.
Christian Lochert, Hannes Hartenstein, Jing Tian, Hol-ger Fussler, Dagmar Hermann, and Martin Mauve.2003. A routing strategy for vehicular ad hoc net-works in city environments. In Intelligent VehiclesSymposium, 2003. Proceedings. IEEE, pages 156–161. IEEE.
Parag S Mogre, Matthias Hollick, Nico d’Heureuse,Hans Werner Heckel, Tronje Krop, and Ralf Stein-metz. 2007. A graph-based simple mobility model.In Communication in Distributed Systems (KiVS),2007 ITG-GI Conference, pages 1–12. VDE.
David O’Sullivan. 2001. Graph-cellular automata: ageneralised discrete urban and regional model. En-vironment and Planning B: Planning and Design,28(5):687–705.
UR Prasanna, M Srinivas, and L Umanand. 2009.Macroscopic model of city traffic using bond graphmodelling. International Journal of EngineeringSystems Modelling and Simulation, 1(2-3):176–183.
BP Shumaker and RW Sinnott. 1984. Astronomi-cal computing: 1. computing under the open sky. 2.virtues of the haversine. Sky and telescope, 68:158–159.
Takeo Yamada. 1996. A network flow approach to acity emergency evacuation planning. InternationalJournal of Systems Science, 27(10):931–936.
113