knox county retirement and pension board .... for the voluntary 457 and merp plans, participants may...
TRANSCRIPT
KNOX COUNTY RETIREMENT AND PENSION BOARD AND SYSTEM
PENSION, OTHER POST EMPLOYMENT BENEFIT AND RETIREMENT TRUST FUNDS OF
KNOX COUNTY, TENNESSEE
Knoxville, Tennessee
FINANCIAL STATEMENTS
June 30, 2017 and 2016

KNOX COUNTY RETIREMENT AND PENSION BOARD AND SYSTEM
PENSION, OTHER POST EMPLOYMENT BENEFIT AND RETIREMENT TRUST FUNDS OF KNOX COUNTY, TENNESSEE
TABLE OF CONTENTS
Page
Number INTRODUCTORY SECTION
Roster of Board Members, Officials and Others .................................................................................................... i-ii
FINANCIAL SECTION
Independent Auditor’s Report .............................................................................................................................. 1-2
Management Discussion and Analysis ................................................................................................................ 3-8
Basic Financial Statements:
Statements of Fiduciary Net Position ............................................................................................................. 9-10
Statements of Changes in Fiduciary Net Position ........................................................................................ 11-12
Notes to the Financial Statements ............................................................................................................... 13-45
REQUIRED SUPPLEMENTARY INFORMATION SECTION
Schedule of Changes in County’s Net Pension Liability and Related Ratios .................................................. 46-48
Schedule of County’s Pension Contributions .................................................................................................. 49-51
Schedule of Investment Returns .......................................................................................................................... 52
Schedule of Changes in the County’s Net OPEB Liability and Related Ratios…………………………………... .. 53
Schedule of County’s OPEB Contributions .......................................................................................................... 54
INTERNAL CONTROL AND COMPLIANCE SECTION
Report on Internal Control over Financial Reporting and on Compliance and Other Matters Based on an Audit of Financial Statements Performed in Accordance with Government Auditing Standards ................................................................................... 55-56
Schedule of Findings and Responses .................................................................................................................. 57
Schedule of Prior Year Findings ........................................................................................................................... 58
CORRECTIVE ACTION PLAN
Corrective Action Plan .......................................................................................................................................... 59

INTRODUCTORY SECTION
- i -
KNOX COUNTY RETIREMENT AND PENSION BOARD AND SYSTEM
PENSION, OTHER POST EMPLOYMENT BENEFIT AND RETIREMENT TRUST FUNDS OF KNOX COUNTY, TENNESSEE
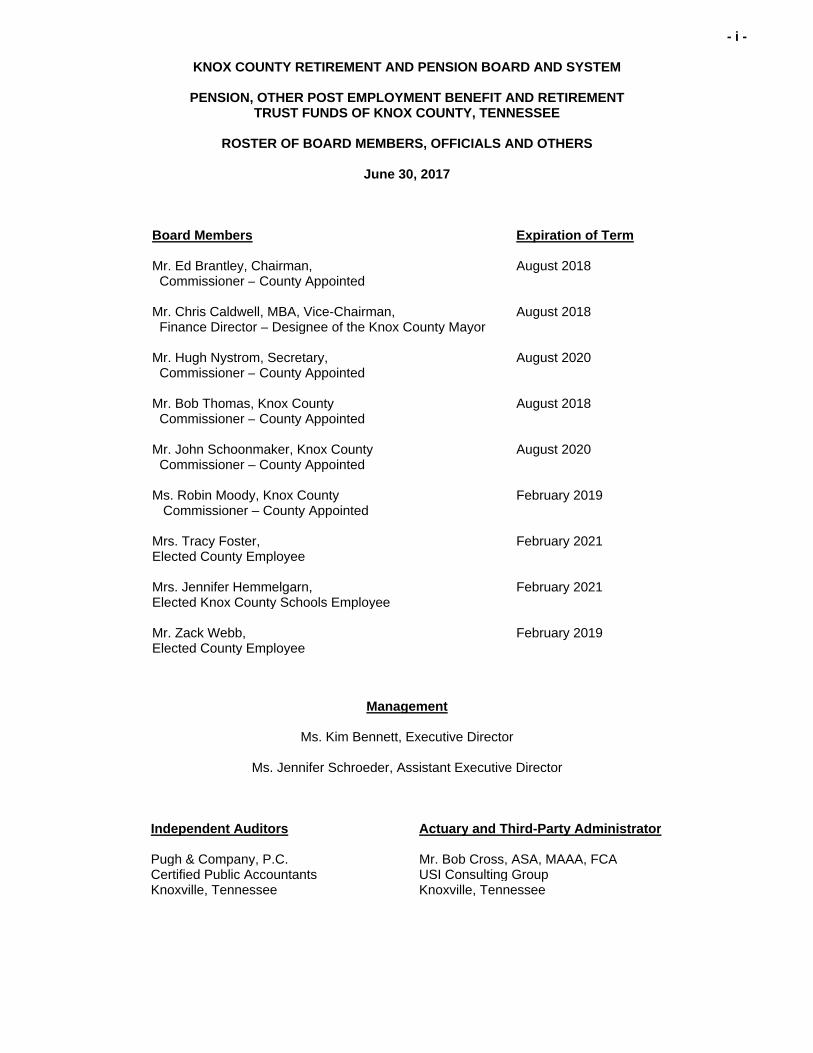
ROSTER OF BOARD MEMBERS, OFFICIALS AND OTHERS
June 30, 2017
Board Members Expiration of Term Mr. Ed Brantley, Chairman, Commissioner – County Appointed
August 2018
Mr. Chris Caldwell, MBA, Vice-Chairman, Finance Director – Designee of the Knox County Mayor
August 2018
Mr. Hugh Nystrom, Secretary, Commissioner – County Appointed
August 2020
Mr. Bob Thomas, Knox County Commissioner – County Appointed
August 2018
Mr. John Schoonmaker, Knox County Commissioner – County Appointed Ms. Robin Moody, Knox County Commissioner – County Appointed Mrs. Tracy Foster, Elected County Employee Mrs. Jennifer Hemmelgarn, Elected Knox County Schools Employee
August 2020 February 2019 February 2021 February 2021
Mr. Zack Webb, Elected County Employee
February 2019
Management
Ms. Kim Bennett, Executive Director
Ms. Jennifer Schroeder, Assistant Executive Director
Independent Auditors Actuary and Third-Party Administrator Pugh & Company, P.C. Mr. Bob Cross, ASA, MAAA, FCA Certified Public Accountants USI Consulting GroupKnoxville, Tennessee Knoxville, Tennessee
- ii -
KNOX COUNTY RETIREMENT AND PENSION BOARD AND SYSTEM
PENSION, OTHER POST EMPLOYMENT BENEFIT AND RETIREMENT TRUST FUNDS OF KNOX COUNTY, TENNESSEE
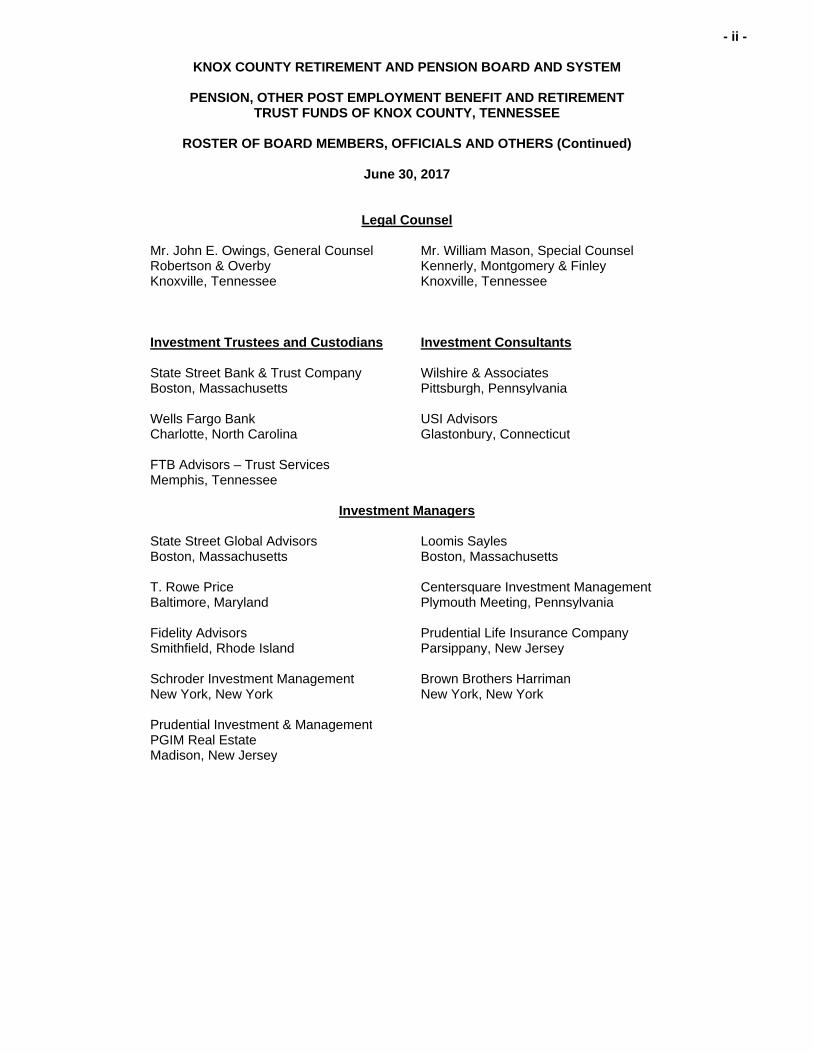
ROSTER OF BOARD MEMBERS, OFFICIALS AND OTHERS (Continued)
June 30, 2017
Legal Counsel Mr. John E. Owings, General Counsel Robertson & Overby Knoxville, Tennessee
Mr. William Mason, Special Counsel Kennerly, Montgomery & Finley Knoxville, Tennessee
Investment Trustees and Custodians Investment Consultants State Street Bank & Trust Company Boston, Massachusetts
Wilshire & Associates Pittsburgh, Pennsylvania
Wells Fargo Bank Charlotte, North Carolina
USI Advisors Glastonbury, Connecticut
FTB Advisors – Trust Services Memphis, Tennessee
Investment Managers
State Street Global Advisors Boston, Massachusetts
Loomis Sayles Boston, Massachusetts
T. Rowe Price Baltimore, Maryland
Centersquare Investment Management Plymouth Meeting, Pennsylvania
Fidelity Advisors Smithfield, Rhode Island
Prudential Life Insurance Company Parsippany, New Jersey
Schroder Investment Management New York, New York
Brown Brothers Harriman New York, New York
Prudential Investment & Management
PGIM Real Estate Madison, New Jersey

FINANCIAL SECTION

- 1 -
TSCPA
Members of the Tennessee Society Of Certified Public Accountants
RSM US Alliance member firms are separate and independent businesses and legal entities that are responsible for their own acts and omissions, and each are separate and independent from RSM US LLP. RSM US LLP is the U.S. member firm of RSM International, a global network of independent audit, tax, and consulting firms.
Members of RSM US Alliance have access to RSM International resources through RSM US LLP but are not member firms of RSM International.
KNOXVILLE OFFICE: OAK RIDGE OFFICE:
315 NORTH CEDAR BLUFF ROAD – SUITE 200 800 OAK RIDGE TURNPIKE – SUITE A404
KNOXVILLE, TENNESSEE 37923 OAK RIDGE, TENNESSEE 37830
TELEPHONE 865-769-0660 TELEPHONE 865-769-1657
PUGH & COMPANY, P.C.
www.pughcpas.com
INDEPENDENT AUDITOR’S REPORT Members of the Knox County Retirement and Pension Board and System Knoxville, Tennessee Report on the Financial Statements
We have audited the accompanying financial statements of the Knox County Retirement and Pension Board and System (the “System”) pension trust funds of Knox County, Tennessee, which comprise the statements of fiduciary net position as of June 30, 2017 and 2016, and the related statements of changes in fiduciary net position and related notes to the financial statements for the years then ended. Management’s Responsibility for the Financial Statements
Management is responsible for the preparation and fair presentation of these financial statements in accordance with accounting principles generally accepted in the United States of America; this includes the design, implementation, and maintenance of internal control relevant to the preparation and fair presentation of financial statements that are free from material misstatement, whether due to fraud or error. Auditor’s Responsibility
Our responsibility is to express an opinion on these financial statements based on our audits. We conducted our audits in accordance with auditing standards generally accepted in the United States of America and the standards applicable to financial audits contained in Government Auditing Standards, issued by the Comptroller General of the United States. Those standards require that we plan and perform the audits to obtain reasonable assurance about whether the financial statements are free from material misstatement. An audit involves performing procedures to obtain audit evidence about the amounts and disclosures in the financial statements. The procedures selected depend on the auditor’s judgment, including the assessment of the risks of material misstatement of the financial statements, whether due to fraud or error. In making those risk assessments, the auditor considers internal control relevant to the entity’s preparation and fair presentation of the financial statements in order to design audit procedures that are appropriate in the circumstances, but not for the purpose of expressing an opinion on the effectiveness of the entity’s internal controls. Accordingly, we express no such opinion. An audit also includes evaluating the appropriateness of accounting policies used and the reasonableness of significant accounting estimates made by management, as well as evaluating the overall presentation of the financial statements. We believe that the audit evidence we have obtained is sufficient and appropriate to provide a basis for our qualified audit opinion.
- 2 -
Basis for Qualified Opinion
Because we did not perform auditing procedures with respect to some of the System’s Defined Contribution Plans’ (Asset Accumulation, Voluntary 457, and Medical Expense Retirement Plans) individual participant account balances accumulated from inception to January 1, 2011, we were unable to satisfy ourselves as to the basis on which participants’ equity is stated as of the beginning and end of the years ended June 30, 2017 and 2016 or the propriety of the benefits paid to participants during the years then ended. Consequently, we were unable to determine whether any adjustments to these amounts were necessary. Qualified Opinion
In our opinion, except for the possible effects of the matter described in the Basis for Qualified Opinion paragraph, the financial statements referred to above present fairly, in all material respects, the fiduciary net position of the System as of June 30, 2017 and 2016 and the changes in its fiduciary net position for the years then ended in accordance with accounting principles generally accepted in the United States of America. Emphasis of Matter
As discussed in Note 2, the financial statements of the Knox County Retirement and Pension Board and System are intended to present only the statements of fiduciary net position and changes in fiduciary net position of the System. They do not purport to, and do not, present fairly the financial position of Knox County, Tennessee, as of June 30, 2017 and 2016, and the changes in its financial position for the years then ended in conformity with accounting principles generally accepted in the United States of America. As discussed in Note 14, the Knox County Law Director filed a lawsuit against the System regarding the administration of the Uniform Officers Pension Plan. Other Matters - Required Supplementary Information
Accounting principles generally accepted in the United States of America require that the Management Discussion and Analysis on pages 3 through 8 and the Required Supplementary Information Section on pages 46 through 54 be presented to supplement the basic financial statements. Such information, although not a part of the basic financial statements, is required by the Governmental Accounting Standards Board who considers it to be an essential part of financial reporting for placing the basic financial statements in an appropriate operational, economic, or historical context. We have applied certain limited procedures to the required supplementary information in accordance with auditing standards generally accepted in the United States of America, which consisted of inquiries of management about the methods of preparing the information and comparing the information for consistency with management’s responses to our inquiries, the basic financial statements, and other knowledge we obtained during our audit of the basic financial statements. We do not express an opinion or provide any assurance on the information because the limited procedures do not provide us with sufficient evidence to express an opinion or provide any assurance. Other Information
Our audits were conducted for the purpose of forming an opinion on the financial statements as a whole. The introductory section and the corrective action plan are presented for purposes of additional analysis and are not a required part of the financial statements. The introductory section and corrective action plan have not been subjected to the auditing procedures applied in the audits of the basic financial statements, and accordingly, we do not express an opinion or provide any assurance on them. Other Reporting Required by Government Auditing Standards
In accordance with Government Auditing Standards, we have also issued our report dated December 29, 2017, on our consideration of the System’s internal control over financial reporting and on our tests of its compliance with certain provisions of laws, regulations, contracts and grant agreements and other matters. The purpose of that report is to describe the scope of our testing of internal control over financial reporting and compliance and the results of that testing, and not to provide an opinion on internal control over financial reporting or on compliance. That report is an integral part of an audit performed in accordance with Government Auditing Standards in considering the System’s internal control over financial reporting and compliance.
Pugh &Company, P.C. Certified Public Accountants Knoxville, Tennessee December 29, 2017
- 3 -
KNOX COUNTY RETIREMENT AND PENSION BOARD AND SYSTEM
PENSION, OTHER POST EMPLOYMENT BENEFIT AND RETIREMENT TRUST FUNDS OF KNOX COUNTY, TENNESSEE
MANAGEMENT DISCUSSION AND ANALYSIS
For the Years Ended June 30, 2017, 2016 and 2015
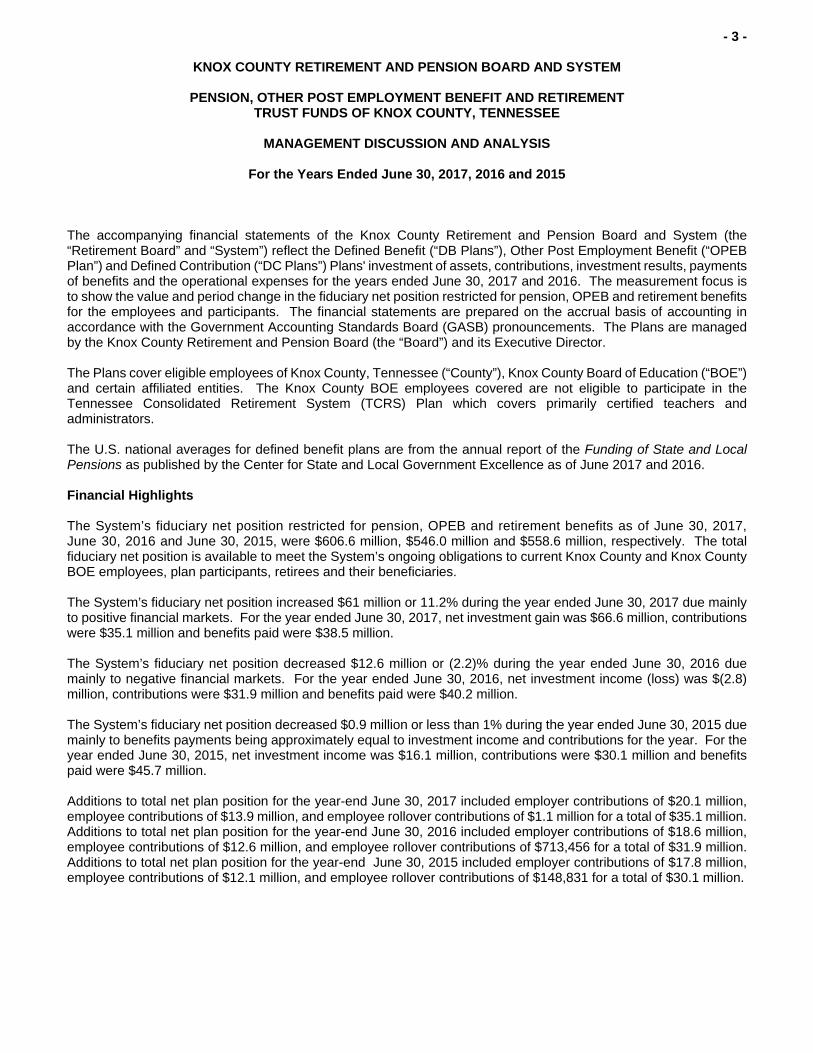
The accompanying financial statements of the Knox County Retirement and Pension Board and System (the “Retirement Board” and “System”) reflect the Defined Benefit (“DB Plans”), Other Post Employment Benefit (“OPEB Plan”) and Defined Contribution (“DC Plans”) Plans' investment of assets, contributions, investment results, payments of benefits and the operational expenses for the years ended June 30, 2017 and 2016. The measurement focus is to show the value and period change in the fiduciary net position restricted for pension, OPEB and retirement benefits for the employees and participants. The financial statements are prepared on the accrual basis of accounting in accordance with the Government Accounting Standards Board (GASB) pronouncements. The Plans are managed by the Knox County Retirement and Pension Board (the “Board”) and its Executive Director. The Plans cover eligible employees of Knox County, Tennessee (“County”), Knox County Board of Education (“BOE”) and certain affiliated entities. The Knox County BOE employees covered are not eligible to participate in the Tennessee Consolidated Retirement System (TCRS) Plan which covers primarily certified teachers and administrators. The U.S. national averages for defined benefit plans are from the annual report of the Funding of State and Local Pensions as published by the Center for State and Local Government Excellence as of June 2017 and 2016. Financial Highlights The System’s fiduciary net position restricted for pension, OPEB and retirement benefits as of June 30, 2017, June 30, 2016 and June 30, 2015, were $606.6 million, $546.0 million and $558.6 million, respectively. The total fiduciary net position is available to meet the System’s ongoing obligations to current Knox County and Knox County BOE employees, plan participants, retirees and their beneficiaries. The System’s fiduciary net position increased $61 million or 11.2% during the year ended June 30, 2017 due mainly to positive financial markets. For the year ended June 30, 2017, net investment gain was $66.6 million, contributions were $35.1 million and benefits paid were $38.5 million. The System’s fiduciary net position decreased $12.6 million or (2.2)% during the year ended June 30, 2016 due mainly to negative financial markets. For the year ended June 30, 2016, net investment income (loss) was $(2.8) million, contributions were $31.9 million and benefits paid were $40.2 million. The System’s fiduciary net position decreased $0.9 million or less than 1% during the year ended June 30, 2015 due mainly to benefits payments being approximately equal to investment income and contributions for the year. For the year ended June 30, 2015, net investment income was $16.1 million, contributions were $30.1 million and benefits paid were $45.7 million. Additions to total net plan position for the year-end June 30, 2017 included employer contributions of $20.1 million, employee contributions of $13.9 million, and employee rollover contributions of $1.1 million for a total of $35.1 million. Additions to total net plan position for the year-end June 30, 2016 included employer contributions of $18.6 million, employee contributions of $12.6 million, and employee rollover contributions of $713,456 for a total of $31.9 million. Additions to total net plan position for the year-end June 30, 2015 included employer contributions of $17.8 million, employee contributions of $12.1 million, and employee rollover contributions of $148,831 for a total of $30.1 million.
- 4 -
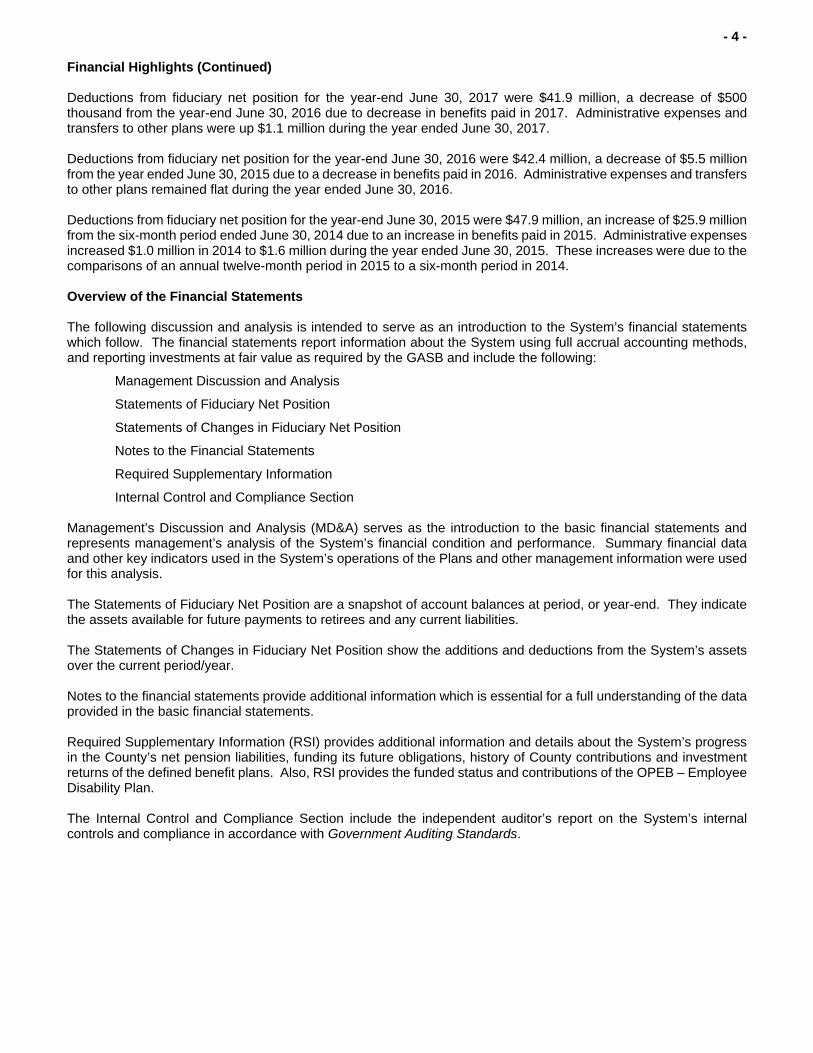
Financial Highlights (Continued) Deductions from fiduciary net position for the year-end June 30, 2017 were $41.9 million, a decrease of $500 thousand from the year-end June 30, 2016 due to decrease in benefits paid in 2017. Administrative expenses and transfers to other plans were up $1.1 million during the year ended June 30, 2017. Deductions from fiduciary net position for the year-end June 30, 2016 were $42.4 million, a decrease of $5.5 million from the year ended June 30, 2015 due to a decrease in benefits paid in 2016. Administrative expenses and transfers to other plans remained flat during the year ended June 30, 2016. Deductions from fiduciary net position for the year-end June 30, 2015 were $47.9 million, an increase of $25.9 million from the six-month period ended June 30, 2014 due to an increase in benefits paid in 2015. Administrative expenses increased $1.0 million in 2014 to $1.6 million during the year ended June 30, 2015. These increases were due to the comparisons of an annual twelve-month period in 2015 to a six-month period in 2014. Overview of the Financial Statements The following discussion and analysis is intended to serve as an introduction to the System’s financial statements which follow. The financial statements report information about the System using full accrual accounting methods, and reporting investments at fair value as required by the GASB and include the following:
Management Discussion and Analysis
Statements of Fiduciary Net Position
Statements of Changes in Fiduciary Net Position
Notes to the Financial Statements
Required Supplementary Information
Internal Control and Compliance Section Management’s Discussion and Analysis (MD&A) serves as the introduction to the basic financial statements and represents management’s analysis of the System’s financial condition and performance. Summary financial data and other key indicators used in the System’s operations of the Plans and other management information were used for this analysis. The Statements of Fiduciary Net Position are a snapshot of account balances at period, or year-end. They indicate the assets available for future payments to retirees and any current liabilities. The Statements of Changes in Fiduciary Net Position show the additions and deductions from the System’s assets over the current period/year. Notes to the financial statements provide additional information which is essential for a full understanding of the data provided in the basic financial statements. Required Supplementary Information (RSI) provides additional information and details about the System’s progress in the County’s net pension liabilities, funding its future obligations, history of County contributions and investment returns of the defined benefit plans. Also, RSI provides the funded status and contributions of the OPEB – Employee Disability Plan. The Internal Control and Compliance Section include the independent auditor’s report on the System’s internal controls and compliance in accordance with Government Auditing Standards.
- 5 -
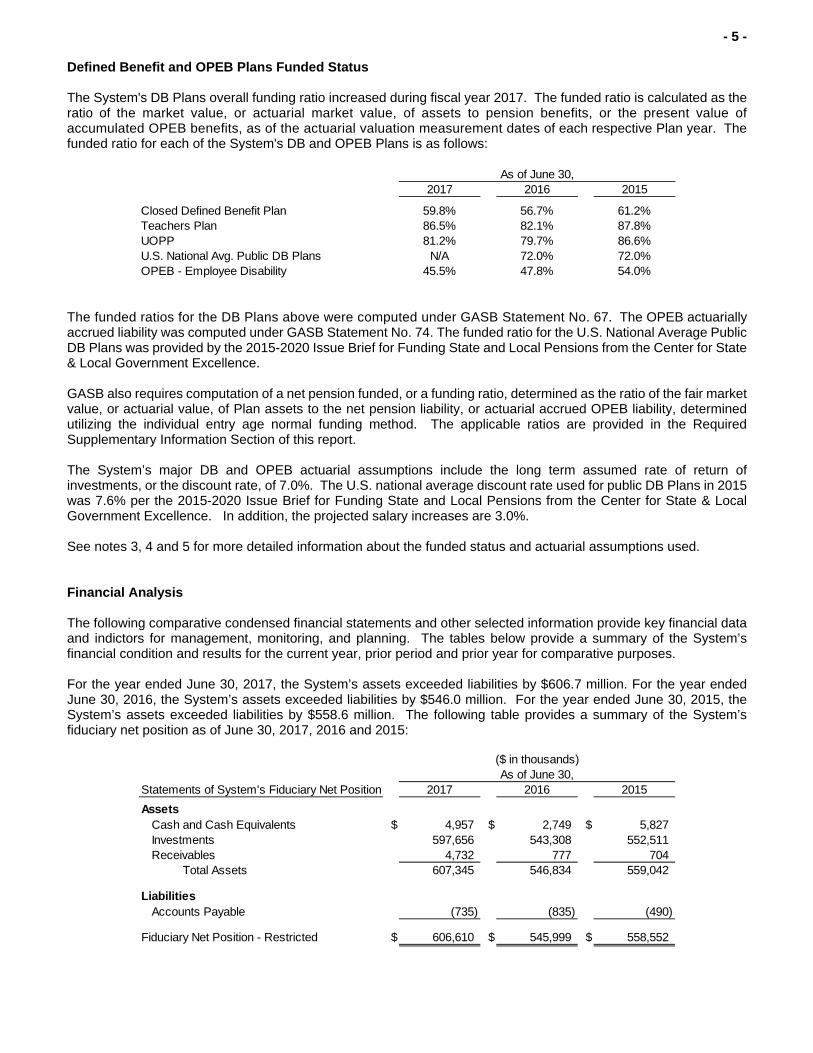
Defined Benefit and OPEB Plans Funded Status The System's DB Plans overall funding ratio increased during fiscal year 2017. The funded ratio is calculated as the ratio of the market value, or actuarial market value, of assets to pension benefits, or the present value of accumulated OPEB benefits, as of the actuarial valuation measurement dates of each respective Plan year. The funded ratio for each of the System's DB and OPEB Plans is as follows:
2017 2016 2015
Closed Defined Benefit Plan 59.8% 56.7% 61.2%Teachers Plan 86.5% 82.1% 87.8%UOPP 81.2% 79.7% 86.6%U.S. National Avg. Public DB Plans N/A 72.0% 72.0%OPEB - Employee Disability 45.5% 47.8% 54.0%
As of June 30,
The funded ratios for the DB Plans above were computed under GASB Statement No. 67. The OPEB actuarially accrued liability was computed under GASB Statement No. 74. The funded ratio for the U.S. National Average Public DB Plans was provided by the 2015-2020 Issue Brief for Funding State and Local Pensions from the Center for State & Local Government Excellence. GASB also requires computation of a net pension funded, or a funding ratio, determined as the ratio of the fair market value, or actuarial value, of Plan assets to the net pension liability, or actuarial accrued OPEB liability, determined utilizing the individual entry age normal funding method. The applicable ratios are provided in the Required Supplementary Information Section of this report. The System’s major DB and OPEB actuarial assumptions include the long term assumed rate of return of investments, or the discount rate, of 7.0%. The U.S. national average discount rate used for public DB Plans in 2015 was 7.6% per the 2015-2020 Issue Brief for Funding State and Local Pensions from the Center for State & Local Government Excellence. In addition, the projected salary increases are 3.0%. See notes 3, 4 and 5 for more detailed information about the funded status and actuarial assumptions used. Financial Analysis The following comparative condensed financial statements and other selected information provide key financial data and indictors for management, monitoring, and planning. The tables below provide a summary of the System’s financial condition and results for the current year, prior period and prior year for comparative purposes. For the year ended June 30, 2017, the System’s assets exceeded liabilities by $606.7 million. For the year ended June 30, 2016, the System’s assets exceeded liabilities by $546.0 million. For the year ended June 30, 2015, the System’s assets exceeded liabilities by $558.6 million. The following table provides a summary of the System’s fiduciary net position as of June 30, 2017, 2016 and 2015:
Statements of System's Fiduciary Net Position 2017 2016 2015
AssetsCash and Cash Equivalents $ 4,957 $ 2,749 $ 5,827Investments 597,656 543,308 552,511Receivables 4,732 777 704
Total Assets 607,345 546,834 559,042
LiabilitiesAccounts Payable (735) (835) (490)
Fiduciary Net Position - Restricted $ 606,610 $ 545,999 $ 558,552
($ in thousands)As of June 30,

- 6 -
Financial Analysis (Continued) The following table provides a summary of the changes in fiduciary net position for the years ended June 30, 2017, 2016 and 2015 :
Statements of Changes in System's Fiduciary Net Position 2017 2016 2015
AdditionsNet Investment Income (Loss) $ 66,635 $ (2,777) $ 16,145Interest on Notes Receivable 85 0 0Participant's Contributions 13,886 12,603 12,090Employer Contributions 20,078 18,626 17,896Rollover Contributions 1,094 713 149Transfers In from Other Plans 736 694 617Other 0 0 5
Total Additions 102,514 29,859 46,902
DeductionsBenefits Paid 39,198 40,151 45,657Administrative Expenses 1,970 1,565 1,605Transfers to Other Plans 735 694 617
Total Deductions 41,903 42,410 47,879
Change in Fiduciary Net Position $ 60,611 $ (12,551) $ (977)
For the Years Ended June 30,($ in thousands)
County Employer Contributions The County’s employer contributions increased by $1.5 million during the year ended June 30, 2017, of which $0.3 million was for the DB plans and $1.2 million was for the DC plans. These increases were attributed mainly to normal plan activity. The County’s employer matching contribution percentages did not change for any of the DC Plans during the year ended June 30, 2017. The County’s employer contributions increased by $0.7 million during the year ended June 30, 2016, of which $0.3 million was for the DB plans and $0.4 million was for the DC plans. These increases were attributed mainly to normal plan activity. The County’s employer matching contribution percentages did not change for any of the DC Plans during the year ended June 30, 2016. The County’s employer contributions increased by $10.8 million during the year ended June 30, 2015, of which $4.8 million was for the DB plans. Knox County increased its employer contributions to the Closed Defined Benefit Plan by $2.5 million, the Teacher’s Plan by $1.1 million and the UOPP by $1.1 million for the year ended June 30, 2015 when compared to the six-month period ended June 30, 2014. The increases in the DB employer contributions were due to the comparison of an annual period to a six-month period. The employer matching contribution percentage for the Medical Expense Retirement Plan (MERP) increased to a 50% match with a maximum match of $208 per participant during the year ended June 30, 2015. All other DC employer matching contribution percentages did not change during the year ended June 30, 2015.
- 7 -
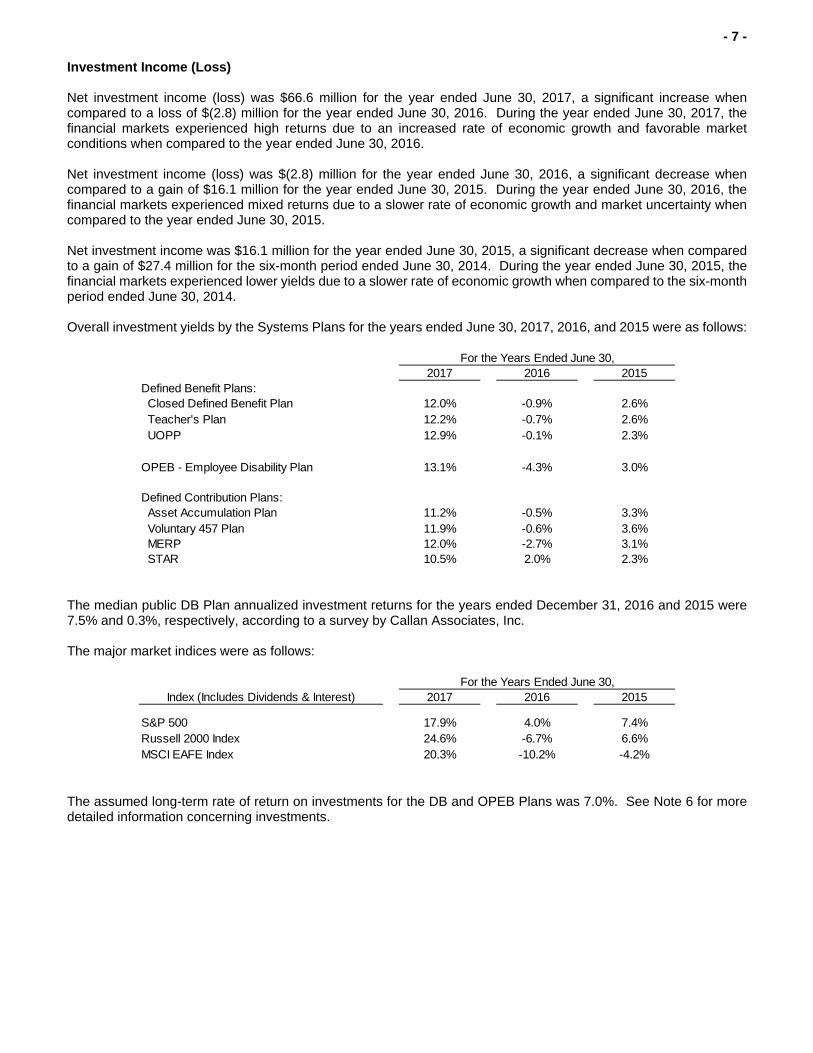
Investment Income (Loss) Net investment income (loss) was $66.6 million for the year ended June 30, 2017, a significant increase when compared to a loss of $(2.8) million for the year ended June 30, 2016. During the year ended June 30, 2017, the financial markets experienced high returns due to an increased rate of economic growth and favorable market conditions when compared to the year ended June 30, 2016. Net investment income (loss) was $(2.8) million for the year ended June 30, 2016, a significant decrease when compared to a gain of $16.1 million for the year ended June 30, 2015. During the year ended June 30, 2016, the financial markets experienced mixed returns due to a slower rate of economic growth and market uncertainty when compared to the year ended June 30, 2015. Net investment income was $16.1 million for the year ended June 30, 2015, a significant decrease when compared to a gain of $27.4 million for the six-month period ended June 30, 2014. During the year ended June 30, 2015, the financial markets experienced lower yields due to a slower rate of economic growth when compared to the six-month period ended June 30, 2014. Overall investment yields by the Systems Plans for the years ended June 30, 2017, 2016, and 2015 were as follows:
2017 2016 2015Defined Benefit Plans: Closed Defined Benefit Plan 12.0% -0.9% 2.6% Teacher's Plan 12.2% -0.7% 2.6% UOPP 12.9% -0.1% 2.3%
OPEB - Employee Disability Plan 13.1% -4.3% 3.0%
Defined Contribution Plans: Asset Accumulation Plan 11.2% -0.5% 3.3% Voluntary 457 Plan 11.9% -0.6% 3.6% MERP 12.0% -2.7% 3.1% STAR 10.5% 2.0% 2.3%
For the Years Ended June 30,
The median public DB Plan annualized investment returns for the years ended December 31, 2016 and 2015 were 7.5% and 0.3%, respectively, according to a survey by Callan Associates, Inc. The major market indices were as follows:
2017 2016 2015
S&P 500 17.9% 4.0% 7.4%Russell 2000 Index 24.6% -6.7% 6.6%MSCI EAFE Index 20.3% -10.2% -4.2%
Index (Includes Dividends & Interest)For the Years Ended June 30,
The assumed long-term rate of return on investments for the DB and OPEB Plans was 7.0%. See Note 6 for more detailed information concerning investments.
- 8 -
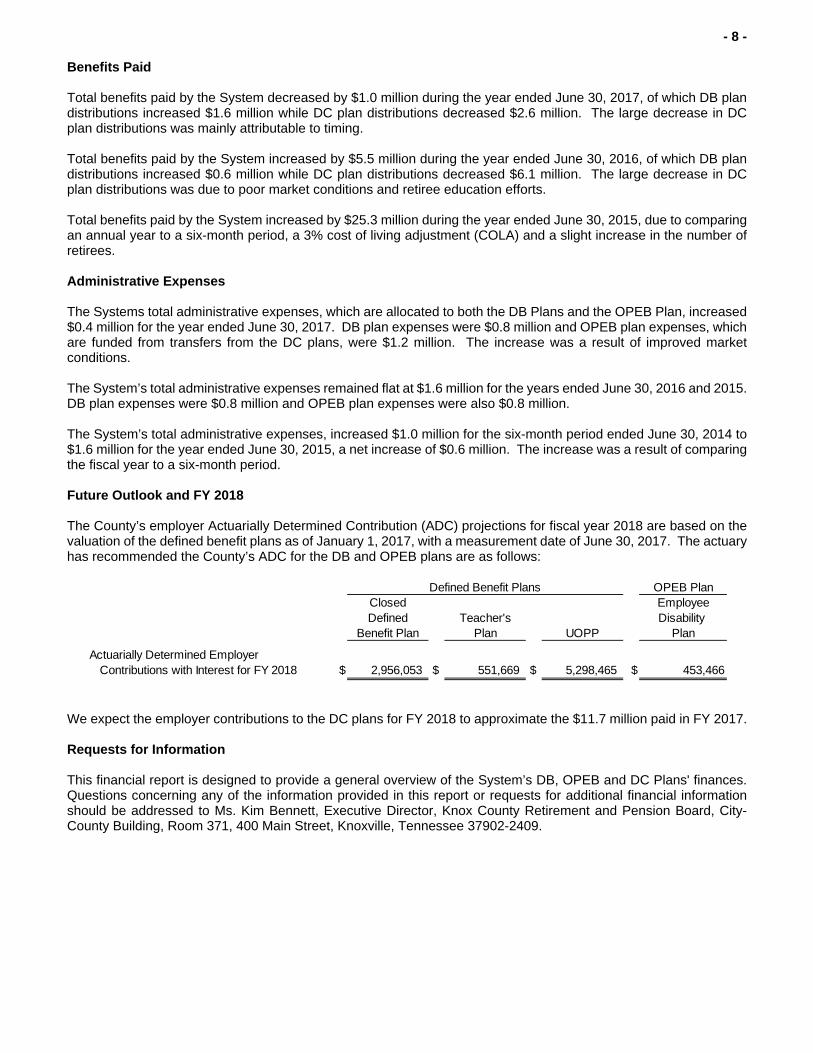
Benefits Paid Total benefits paid by the System decreased by $1.0 million during the year ended June 30, 2017, of which DB plan distributions increased $1.6 million while DC plan distributions decreased $2.6 million. The large decrease in DC plan distributions was mainly attributable to timing. Total benefits paid by the System increased by $5.5 million during the year ended June 30, 2016, of which DB plan distributions increased $0.6 million while DC plan distributions decreased $6.1 million. The large decrease in DC plan distributions was due to poor market conditions and retiree education efforts. Total benefits paid by the System increased by $25.3 million during the year ended June 30, 2015, due to comparing an annual year to a six-month period, a 3% cost of living adjustment (COLA) and a slight increase in the number of retirees. Administrative Expenses The Systems total administrative expenses, which are allocated to both the DB Plans and the OPEB Plan, increased $0.4 million for the year ended June 30, 2017. DB plan expenses were $0.8 million and OPEB plan expenses, which are funded from transfers from the DC plans, were $1.2 million. The increase was a result of improved market conditions. The System’s total administrative expenses remained flat at $1.6 million for the years ended June 30, 2016 and 2015. DB plan expenses were $0.8 million and OPEB plan expenses were also $0.8 million. The System’s total administrative expenses, increased $1.0 million for the six-month period ended June 30, 2014 to $1.6 million for the year ended June 30, 2015, a net increase of $0.6 million. The increase was a result of comparing the fiscal year to a six-month period. Future Outlook and FY 2018 The County’s employer Actuarially Determined Contribution (ADC) projections for fiscal year 2018 are based on the valuation of the defined benefit plans as of January 1, 2017, with a measurement date of June 30, 2017. The actuary has recommended the County’s ADC for the DB and OPEB plans are as follows:
OPEB PlanClosed EmployeeDefined Teacher's Disability
Benefit Plan Plan UOPP Plan
Actuarially Determined EmployerContributions with Interest for FY 2018 $ 2,956,053 $ 551,669 $ 5,298,465 $ 453,466
Defined Benefit Plans
We expect the employer contributions to the DC plans for FY 2018 to approximate the $11.7 million paid in FY 2017. Requests for Information This financial report is designed to provide a general overview of the System’s DB, OPEB and DC Plans' finances. Questions concerning any of the information provided in this report or requests for additional financial information should be addressed to Ms. Kim Bennett, Executive Director, Knox County Retirement and Pension Board, City-County Building, Room 371, 400 Main Street, Knoxville, Tennessee 37902-2409.

OPEB PlanClosed Uniformed Total Medical Sheriff's Total Total Defined Officers Defined Employee Asset Expense Accumulation DefinedBenefit Teacher's Pension Benefit Disability Accumulation Voluntary Retirement Retirement Contribution
Plan Plan Plan Plans Plan Plan 457 Plan Plan Plan Plans TotalASSETS
Cash and Cash Equivalents $ 687,713 $ 945,462 $ 3,109,002 $ 4,742,177 $ 0 $ 152,407 $ 0 $ 0 $ 62,603 $ 215,010 $ 4,957,187
Investments, at Fair ValueMutual Funds 2,230,647 3,067,790 10,357,235 15,655,672 874,981 227,378,245 15,593,838 4,065,421 1,666,787 248,704,291 265,234,944Interest-Earning Investment Contracts 0 0 0 0 268,651 50,028,533 2,412,569 385,992 615,583 53,442,677 53,711,328Collective Investment Trusts 39,675,667 54,565,602 155,487,887 249,729,156 82,707 8,582,760 694,216 1,254,331 53,748 10,585,055 260,396,918
Total Investments at Fair Value 41,906,314 57,633,392 165,845,122 265,384,828 1,226,339 285,989,538 18,700,623 5,705,744 2,336,118 312,732,023 579,343,190
Investments, at Contract ValueGuaranteed Investment Contract 0 0 0 0 0 17,022,236 1,290,142 0 0 18,312,378 18,312,378
Total Investments 41,906,314 57,633,392 165,845,122 265,384,828 1,226,339 303,011,774 19,990,765 5,705,744 2,336,118 331,044,401 597,655,568
ReceivablesParticipant's Contributions 2,624 0 58,099 60,723 0 240,503 129,724 10,160 18,322 398,709 459,432Employer Contributions 0 0 108 108 0 308,406 0 0 36,643 345,049 345,157Accrued Interest and Dividends 829 1,140 3,755 5,724 0 31,161 0 0 0 31,161 36,885Receivable from Other Plans 0 0 0 0 202,803 0 0 0 0 0 202,803Receivable for Investments Sold 210,500 289,500 0 500,000 0 0 0 0 0 0 500,000Notes Receivable from Participants 0 0 0 0 0 3,187,274 0 0 0 3,187,274 3,187,274
Total Receivables 213,953 290,640 61,962 566,555 202,803 3,767,344 129,724 10,160 54,965 3,962,193 4,731,551
Total Assets 42,807,980 58,869,494 169,016,086 270,693,560 1,429,142 306,931,525 20,120,489 5,715,904 2,453,686 335,221,604 607,344,306
LIABILITIES
Accounts Payable - Administrative Expenses (63,757) (84,716) (224,777) (373,250) (158,586) 0 0 0 0 0 (531,836)Accounts Payable - to Other Plans 0 0 0 0 0 (140,199) 0 0 (62,603) (202,802) (202,802)
Total Liabilities (63,757) (84,716) (224,777) (373,250) (158,586) (140,199) 0 0 (62,603) (202,802) (734,638)
NET POSITION - RESTRICTED FOR PENSION, OPEB, AND
RETIREMENT BENEFITS $ 42,744,223 $ 58,784,778 $ 168,791,309 $ 270,320,310 $ 1,270,556 $ 306,791,326 $ 20,120,489 $ 5,715,904 $ 2,391,083 $ 335,018,802 $ 606,609,668
Defined Benefit Plans Defined Contribution Plans
KNOX COUNTY RETIREMENT AND PENSION BOARD AND SYSTEM
PENSION, OPEB, AND RETIREMENTTRUST FUNDS OF KNOX COUNTY, TENNESSEE
STATEMENTS OF FIDUCIARY NET POSITION
June 30, 2017
-9
-
The accompanying notes are an integral part of these financial statements.
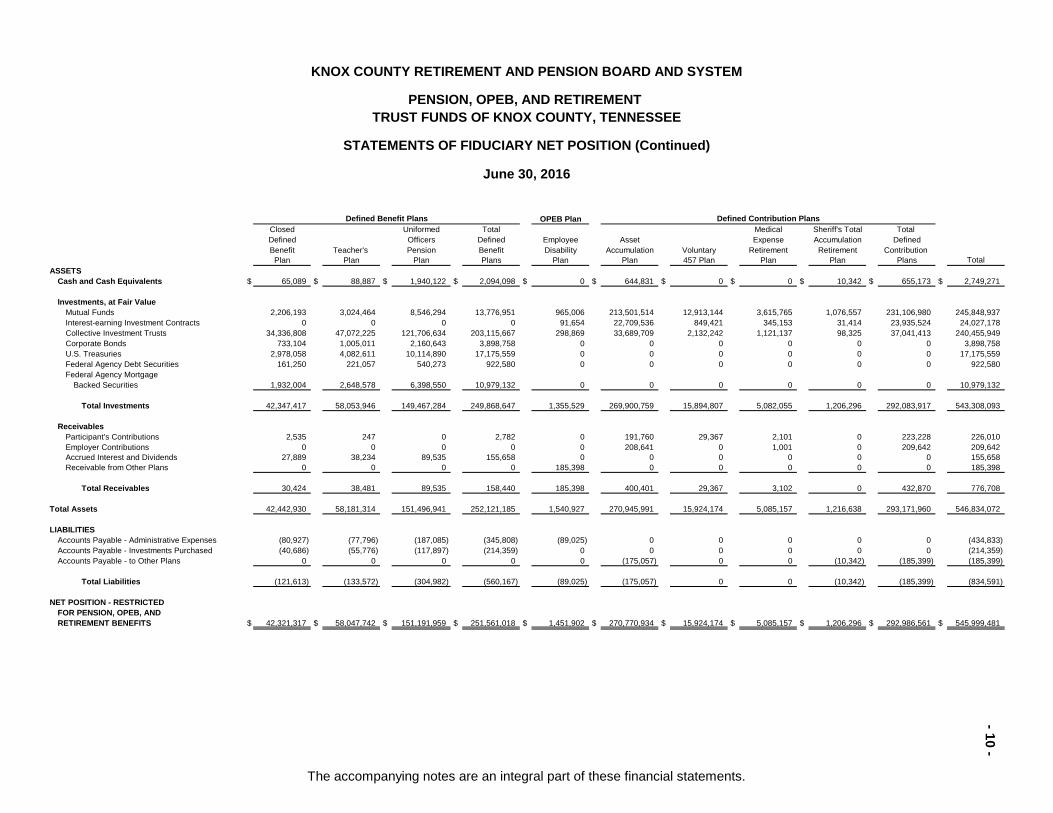
OPEB PlanClosed Uniformed Total Medical Sheriff's Total Total Defined Officers Defined Employee Asset Expense Accumulation DefinedBenefit Teacher's Pension Benefit Disability Accumulation Voluntary Retirement Retirement Contribution
Plan Plan Plan Plans Plan Plan 457 Plan Plan Plan Plans TotalASSETS
Cash and Cash Equivalents $ 65,089 $ 88,887 $ 1,940,122 $ 2,094,098 $ 0 $ 644,831 $ 0 $ 0 $ 10,342 $ 655,173 $ 2,749,271
Investments, at Fair ValueMutual Funds 2,206,193 3,024,464 8,546,294 13,776,951 965,006 213,501,514 12,913,144 3,615,765 1,076,557 231,106,980 245,848,937Interest-earning Investment Contracts 0 0 0 0 91,654 22,709,536 849,421 345,153 31,414 23,935,524 24,027,178Collective Investment Trusts 34,336,808 47,072,225 121,706,634 203,115,667 298,869 33,689,709 2,132,242 1,121,137 98,325 37,041,413 240,455,949Corporate Bonds 733,104 1,005,011 2,160,643 3,898,758 0 0 0 0 0 0 3,898,758U.S. Treasuries 2,978,058 4,082,611 10,114,890 17,175,559 0 0 0 0 0 0 17,175,559Federal Agency Debt Securities 161,250 221,057 540,273 922,580 0 0 0 0 0 0 922,580Federal Agency Mortgage Backed Securities 1,932,004 2,648,578 6,398,550 10,979,132 0 0 0 0 0 0 10,979,132
Total Investments 42,347,417 58,053,946 149,467,284 249,868,647 1,355,529 269,900,759 15,894,807 5,082,055 1,206,296 292,083,917 543,308,093
ReceivablesParticipant's Contributions 2,535 247 0 2,782 0 191,760 29,367 2,101 0 223,228 226,010Employer Contributions 0 0 0 0 0 208,641 0 1,001 0 209,642 209,642Accrued Interest and Dividends 27,889 38,234 89,535 155,658 0 0 0 0 0 0 155,658Receivable from Other Plans 0 0 0 0 185,398 0 0 0 0 0 185,398
Total Receivables 30,424 38,481 89,535 158,440 185,398 400,401 29,367 3,102 0 432,870 776,708
Total Assets 42,442,930 58,181,314 151,496,941 252,121,185 1,540,927 270,945,991 15,924,174 5,085,157 1,216,638 293,171,960 546,834,072
LIABILITIESAccounts Payable - Administrative Expenses (80,927) (77,796) (187,085) (345,808) (89,025) 0 0 0 0 0 (434,833)Accounts Payable - Investments Purchased (40,686) (55,776) (117,897) (214,359) 0 0 0 0 0 0 (214,359)Accounts Payable - to Other Plans 0 0 0 0 0 (175,057) 0 0 (10,342) (185,399) (185,399)
Total Liabilities (121,613) (133,572) (304,982) (560,167) (89,025) (175,057) 0 0 (10,342) (185,399) (834,591)
NET POSITION - RESTRICTED FOR PENSION, OPEB, AND
RETIREMENT BENEFITS $ 42,321,317 $ 58,047,742 $ 151,191,959 $ 251,561,018 $ 1,451,902 $ 270,770,934 $ 15,924,174 $ 5,085,157 $ 1,206,296 $ 292,986,561 $ 545,999,481
Defined Benefit Plans Defined Contribution Plans
KNOX COUNTY RETIREMENT AND PENSION BOARD AND SYSTEM
STATEMENTS OF FIDUCIARY NET POSITION (Continued)
June 30, 2016
PENSION, OPEB, AND RETIREMENT TRUST FUNDS OF KNOX COUNTY, TENNESSEE
-1
0 -
The accompanying notes are an integral part of these financial statements.
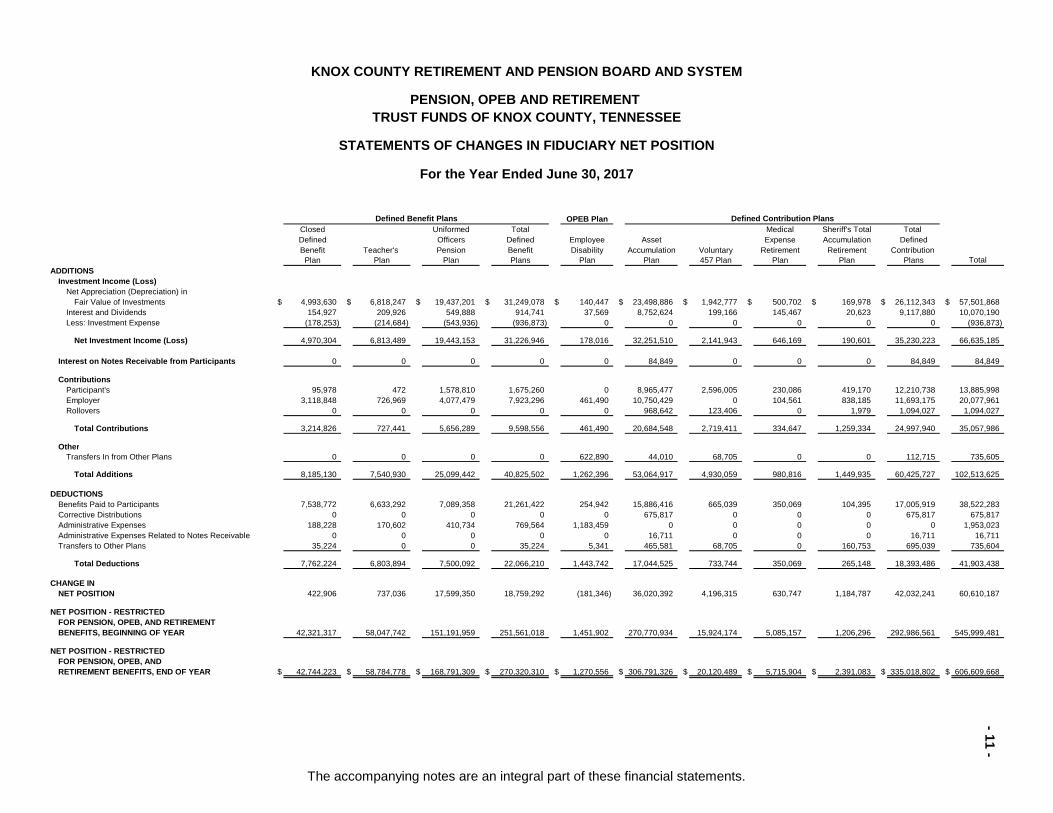
OPEB PlanClosed Uniformed Total Medical Sheriff's Total Total Defined Officers Defined Employee Asset Expense Accumulation DefinedBenefit Teacher's Pension Benefit Disability Accumulation Voluntary Retirement Retirement Contribution
Plan Plan Plan Plans Plan Plan 457 Plan Plan Plan Plans TotalADDITIONS
Investment Income (Loss)Net Appreciation (Depreciation) in Fair Value of Investments $ 4,993,630 $ 6,818,247 $ 19,437,201 $ 31,249,078 $ 140,447 $ 23,498,886 $ 1,942,777 $ 500,702 $ 169,978 $ 26,112,343 $ 57,501,868Interest and Dividends 154,927 209,926 549,888 914,741 37,569 8,752,624 199,166 145,467 20,623 9,117,880 10,070,190Less: Investment Expense (178,253) (214,684) (543,936) (936,873) 0 0 0 0 0 0 (936,873)
Net Investment Income (Loss) 4,970,304 6,813,489 19,443,153 31,226,946 178,016 32,251,510 2,141,943 646,169 190,601 35,230,223 66,635,185
Interest on Notes Receivable from Participants 0 0 0 0 0 84,849 0 0 0 84,849 84,849
ContributionsParticipant's 95,978 472 1,578,810 1,675,260 0 8,965,477 2,596,005 230,086 419,170 12,210,738 13,885,998Employer 3,118,848 726,969 4,077,479 7,923,296 461,490 10,750,429 0 104,561 838,185 11,693,175 20,077,961Rollovers 0 0 0 0 0 968,642 123,406 0 1,979 1,094,027 1,094,027
Total Contributions 3,214,826 727,441 5,656,289 9,598,556 461,490 20,684,548 2,719,411 334,647 1,259,334 24,997,940 35,057,986
OtherTransfers In from Other Plans 0 0 0 0 622,890 44,010 68,705 0 0 112,715 735,605
Total Additions 8,185,130 7,540,930 25,099,442 40,825,502 1,262,396 53,064,917 4,930,059 980,816 1,449,935 60,425,727 102,513,625
DEDUCTIONSBenefits Paid to Participants 7,538,772 6,633,292 7,089,358 21,261,422 254,942 15,886,416 665,039 350,069 104,395 17,005,919 38,522,283Corrective Distributions 0 0 0 0 0 675,817 0 0 0 675,817 675,817Administrative Expenses 188,228 170,602 410,734 769,564 1,183,459 0 0 0 0 0 1,953,023Administrative Expenses Related to Notes Receivable 0 0 0 0 0 16,711 0 0 0 16,711 16,711Transfers to Other Plans 35,224 0 0 35,224 5,341 465,581 68,705 0 160,753 695,039 735,604
Total Deductions 7,762,224 6,803,894 7,500,092 22,066,210 1,443,742 17,044,525 733,744 350,069 265,148 18,393,486 41,903,438
CHANGE INNET POSITION 422,906 737,036 17,599,350 18,759,292 (181,346) 36,020,392 4,196,315 630,747 1,184,787 42,032,241 60,610,187
NET POSITION - RESTRICTED FOR PENSION, OPEB, AND RETIREMENT BENEFITS, BEGINNING OF YEAR 42,321,317 58,047,742 151,191,959 251,561,018 1,451,902 270,770,934 15,924,174 5,085,157 1,206,296 292,986,561 545,999,481
NET POSITION - RESTRICTED FOR PENSION, OPEB, AND RETIREMENT BENEFITS, END OF YEAR $ 42,744,223 $ 58,784,778 $ 168,791,309 $ 270,320,310 $ 1,270,556 $ 306,791,326 $ 20,120,489 $ 5,715,904 $ 2,391,083 $ 335,018,802 $ 606,609,668
KNOX COUNTY RETIREMENT AND PENSION BOARD AND SYSTEM
PENSION, OPEB AND RETIREMENT TRUST FUNDS OF KNOX COUNTY, TENNESSEE
Defined Benefit Plans Defined Contribution Plans
STATEMENTS OF CHANGES IN FIDUCIARY NET POSITION
For the Year Ended June 30, 2017
-1
1 -
The accompanying notes are an integral part of these financial statements.

OPEB PlanClosed Uniformed Total Medical Sheriff's Total Total Defined Officers Defined Employee Asset Expense Accumulation DefinedBenefit Teacher's Pension Benefit Disability Accumulation Voluntary Retirement Retirement Contribution
Plan Plan Plan Plans Plan Plan 457 Plan Plan Plan Plans TotalADDITIONS
Investment Income (Loss)Net Appreciation (Depreciation) in Fair Value of Investments $ (439,916) $ (483,914) $ (535,422) $ (1,459,252) $ (122,075) $ (4,436,701) $ (265,205) $ (221,795) $ 13,889 $ (4,909,812) $ (6,491,139)Interest and Dividends 286,433 387,093 975,508 1,649,034 61,327 3,000,424 167,034 83,283 11,484 3,262,225 4,972,586Less: Investment Expense (265,586) (339,930) (653,632) (1,259,148) 0 0 0 0 0 0 (1,259,148)
Net Investment Income (Loss) (419,069) (436,751) (213,546) (1,069,366) (60,748) (1,436,277) (98,171) (138,512) 25,373 (1,647,587) (2,777,701)
ContributionsParticipant's 93,544 3,718 1,619,506 1,716,768 0 8,305,970 2,094,590 220,302 265,285 10,886,147 12,602,915Employer 3,160,060 832,401 3,553,311 7,545,772 530,426 9,914,030 0 105,251 530,579 10,549,860 18,626,058Rollovers 0 0 0 0 0 432,597 278,581 0 2,278 713,456 713,456
Total Contributions 3,253,604 836,119 5,172,817 9,262,540 530,426 18,652,597 2,373,171 325,553 798,142 22,149,463 31,942,429
OtherTransfers In from Other Plans 0 0 0 0 653,097 40,988 0 0 0 40,988 694,085
Total Additions 2,834,535 399,368 4,959,271 8,193,174 1,122,775 17,257,308 2,275,000 187,041 823,515 20,542,864 29,858,813
DEDUCTIONSBenefits Paid to Participants 7,424,676 6,654,509 5,722,723 19,801,908 141,788 18,798,198 874,085 501,993 32,865 20,207,141 40,150,837Administrative Expenses 228,654 121,781 439,588 790,023 774,388 1,000 0 0 0 1,000 1,565,411Transfers to Other Plans 38,696 0 0 38,696 2,291 559,242 0 2,963 90,893 653,098 694,085
Total Deductions 7,692,026 6,776,290 6,162,311 20,630,627 918,467 19,358,440 874,085 504,956 123,758 20,861,239 42,410,333
CHANGE INNET POSITION (4,857,491) (6,376,922) (1,203,040) (12,437,453) 204,308 (2,101,132) 1,400,915 (317,915) 699,757 (318,375) (12,551,520)
NET POSITION - RESTRICTED FOR PENSION, OPEB, AND RETIREMENT BENEFITS, BEGINNING
OF PERIOD 47,178,808 64,424,664 152,394,999 263,998,471 1,247,594 272,872,066 14,523,259 5,403,072 506,539 293,304,936 558,551,001
NET POSITION - RESTRICTED FOR PENSION, OPEB, AND RETIREMENT BENEFITS, END
OF PERIOD $ 42,321,317 $ 58,047,742 $ 151,191,959 $ 251,561,018 $ 1,451,902 $ 270,770,934 $ 15,924,174 $ 5,085,157 $ 1,206,296 $ 292,986,561 $ 545,999,481
Defined Benefit Plans Defined Contribution Plans
KNOX COUNTY RETIREMENT AND PENSION BOARD AND SYSTEM
PENSION, OPEB, AND RETIREMENTTRUST FUNDS OF KNOX COUNTY, TENNESSEE
STATEMENTS OF CHANGES IN FIDUCIARY NET POSITION (Continued)
For the Year Ended June 30, 2016
-1
2 -
The accompanying notes are an integral part of these financial statements.

- 13 -
KNOX COUNTY RETIREMENT AND PENSION BOARD AND SYSTEM
PENSION, OTHER POST EMPLOYMENT BENEFIT AND RETIREMENT TRUST FUNDS OF KNOX COUNTY, TENNESSEE
NOTES TO THE FINANCIAL STATEMENT
For the Years Ended June 30, 2017 and 2016
NOTE 1 - DESCRIPTION OF THE KNOX COUNTY RETIREMENT AND PENSION BOARD AND SYSTEM AND PLANS Administration - The Knox County Retirement and Pension Board and System (“Retirement Board” and “System”) was created by Tennessee General Assembly, House Bill No. 866, Chapter 246, Private Acts 1967-68, as amended. The powers of the Retirement Board are governed by the Knox County Charter, Article VII, as amended. The Retirement Board is governed by nine members who include the (a) County Mayor, or his designee, (b) four members of the Knox County Commission and (c) four current employees of Knox County Government and the Board of Education who are participating members of the System and elected by the current employees. Elected Board members serve staggered four-year terms and the County Mayor and four County Commission members serve concurrently with their terms as elected County Officials. The Retirement Board employs an executive director who is responsible for administering Knox County’s single employer pension, OPEB, and retirement plans. The System uses USI Consulting Group, Inc. as the actuary for its defined benefit plans and OPEB employee disability plan and as third-party administrator to help in administering the defined contribution plans. As of January 1, 2017, the Board appointed First Tennessee Bank Advisors as Plan Trustee for the defined contribution plans and the Employee Disability Plan. Prior to this appointment, Countybank Trust Services served in this role. Wells Fargo Bank is the investment custodian of the defined contribution plans and the OPEB - Employee Disability Plan. State Street Bank & Trust Company is the Plan Trustee and Investment Custodian for the Defined Benefit Plans. The Retirement Board has also hired several different investment advisors to manage its investment portfolio for its defined benefit plans. The following brief descriptions of the System's Plans are provided for general information only. Participants should refer to the various Plan documents for more complete information. Employee Retirement and Income Security Act of 1974 (ERISA) - According to the Employee Retirement Income Security Act of 1974 (ERISA), the System operates governmental pension, OPEB and retirement plans and is not subject to the statutory provisions of ERISA. Eligibility - The System covers employees of Knox County Government, Knox County Board of Education classified education employees (not certified), the Knoxville-Knox County Public Building Authority, and various other related entities. Employees (participants) can become participants immediately upon employment and must be scheduled to work a minimum of 18.5 hours or more per week to be eligible to enroll and continue to participate in the various Plans. Eligibility for the Knox County Sheriff’s Office employees who participate in the UOPP defined benefit plan or the STAR defined contribution plan is limited to full time employees who work a minimum of 40 hours or more per week. Plans - The System operates eight single-employer pension and retirement plans which consist of three defined benefit, one OPEB and four defined contribution plans which includes the following:
Defined Benefit Plans: This includes the Closed Defined Benefit Plan (closed to new participants as of September 30, 1991), Teacher's Plan (assumed from the former City of Knoxville Board of Education July 1, 1987 and closed to new participants as of July 1, 1977), the Uniformed Officers Pension Plan (UOPP, closed to new Sheriff’s Department Officers employed on or after January 1, 2014). Effective June 30, 2014, the Plans were amended to change the plans’ year end from December 31 to June 30.
- 14 -
NOTE 1 - DESCRIPTION OF THE KNOX COUNTY RETIREMENT AND PENSION BOARD AND SYSTEM AND PLANS (Continued)
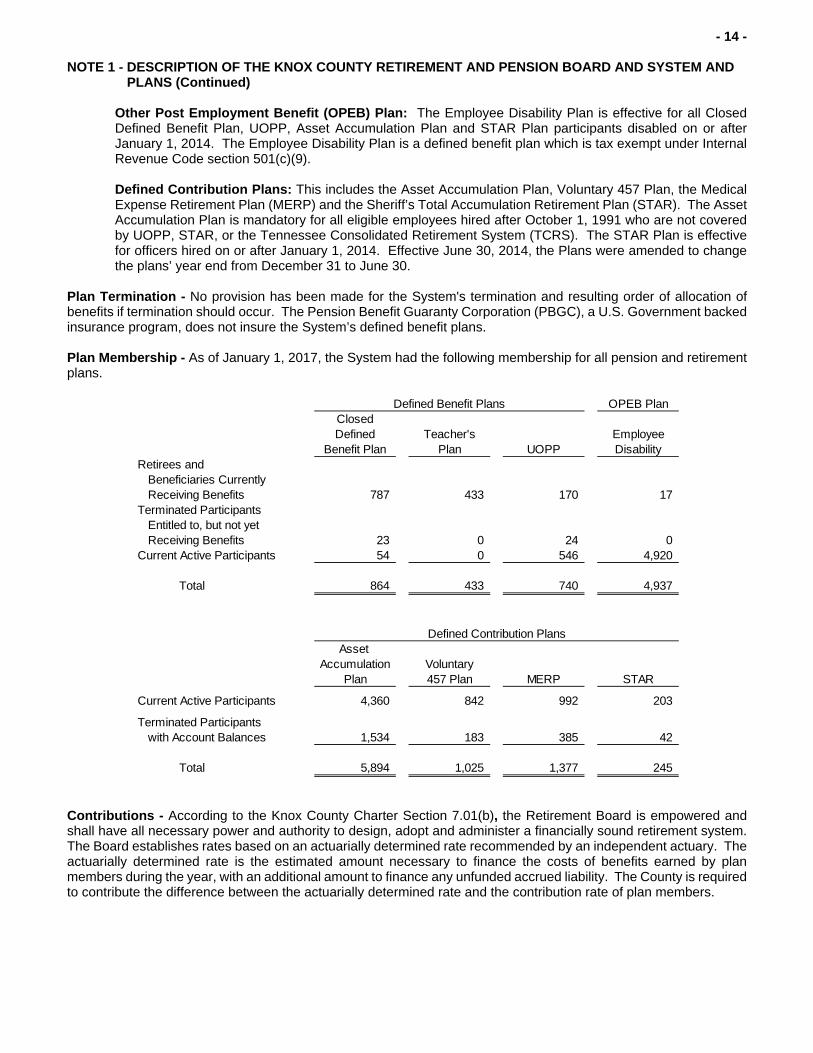
Other Post Employment Benefit (OPEB) Plan: The Employee Disability Plan is effective for all Closed Defined Benefit Plan, UOPP, Asset Accumulation Plan and STAR Plan participants disabled on or after January 1, 2014. The Employee Disability Plan is a defined benefit plan which is tax exempt under Internal Revenue Code section 501(c)(9).
Defined Contribution Plans: This includes the Asset Accumulation Plan, Voluntary 457 Plan, the Medical Expense Retirement Plan (MERP) and the Sheriff’s Total Accumulation Retirement Plan (STAR). The Asset Accumulation Plan is mandatory for all eligible employees hired after October 1, 1991 who are not covered by UOPP, STAR, or the Tennessee Consolidated Retirement System (TCRS). The STAR Plan is effective for officers hired on or after January 1, 2014. Effective June 30, 2014, the Plans were amended to change the plans’ year end from December 31 to June 30.
Plan Termination - No provision has been made for the System's termination and resulting order of allocation of benefits if termination should occur. The Pension Benefit Guaranty Corporation (PBGC), a U.S. Government backed insurance program, does not insure the System’s defined benefit plans. Plan Membership - As of January 1, 2017, the System had the following membership for all pension and retirement plans.
OPEB PlanClosedDefined Teacher's Employee
Benefit Plan Plan UOPP DisabilityRetirees and
Beneficiaries Currently Receiving Benefits 787 433 170 17
Terminated Participants Entitled to, but not yet Receiving Benefits 23 0 24 0
Current Active Participants 54 0 546 4,920
Total 864 433 740 4,937
Defined Benefit Plans
Asset Accumulation Voluntary
Plan 457 Plan MERP STAR
Current Active Participants 4,360 842 992 203
Terminated Participantswith Account Balances 1,534 183 385 42
Total 5,894 1,025 1,377 245
Defined Contribution Plans
Contributions - According to the Knox County Charter Section 7.01(b), the Retirement Board is empowered and shall have all necessary power and authority to design, adopt and administer a financially sound retirement system. The Board establishes rates based on an actuarially determined rate recommended by an independent actuary. The actuarially determined rate is the estimated amount necessary to finance the costs of benefits earned by plan members during the year, with an additional amount to finance any unfunded accrued liability. The County is required to contribute the difference between the actuarially determined rate and the contribution rate of plan members.

- 15 -
NOTE 1 - DESCRIPTION OF THE KNOX COUNTY RETIREMENT AND PENSION BOARD AND SYSTEM AND PLANS (Continued) Contributions (Defined Benefit and OPEB Plans) - The System operates one OPEB and three different single-employer defined benefit plans which are contributory plans that require the employer (Knox County and the Knox County Board of Education) to make contributions determined by annual actuarial valuations, as stated above. In addition, participants are required to make employee contributions to the defined benefit plans of varying percentages and are remitted to the trusts on a per pay period basis. For the years ended June 30, 2017 and 2016, the County’s average contribution rate as a percentage of covered payroll was as follows:
OPEB PlanClosedDefined Teacher's Employee
Fiscal Year Benefit Plan Plan UOPP Disability Plan 2017 186.55 % N/A 16.67 % 0.93 %2016 161.80 N/A 12.94 0.76
Defined Benefit PlansContribution as a Percentage of Covered Payroll
Contributions (Defined Contribution Plans) - Participants’ contributions of 6% to the Asset Accumulation Plan are mandatory and employees may voluntarily make qualified retirement contributions to the Voluntary 457 and MERP defined contribution Plans. Employee contributions are deducted pre-tax from the participants and remitted to the trusts on a per pay period basis for federal income tax purposes under Section 401(a) and 457(b) of the Internal Revenue Code. Employer matching contributions are also remitted to the trusts on a per pay period basis. Participants may also rollover amounts representing distributions from other qualified defined benefit or defined contribution plans. Participants may elect to make tax-deferred contributions to the 457 Plan subject to annual IRS limitations. For the Voluntary 457 and MERP Plans, participants may change their contribution percentage monthly and participants may stop deferring with any payroll. The Asset Accumulation and Voluntary 457 defined contribution plans allow participants to direct employee and employer contributions in a variety of mutual funds, common collective trusts and guaranteed investment contracts. Participants may change their investment options at their discretion. For the MERP the Retirement Board has selected one investment “mix” option for participants. The one MERP investment option consists of 10% conservative, 45% moderate, and 45% ultra-aggressive investment styles. The contributions for each participant are accounted for separately as to employer and participant contributions. The Sheriff’s Total Accumulation Retirement Plan (STAR) is reserved for officers of Knox County Sheriff’s Officers hired or re-hired on or after January 1, 2014. Participants’ contributions of 6% are mandatory. Employee contributions are deducted pre-tax from the participants on a per pay period basis for federal income tax purposes under Section 401(a) and 457(b) of the Internal Revenue Code. Participants may also rollover amounts representing distributions from other qualified defined benefit or defined contribution plans. Participant Accounts (Defined Contribution Plans) - Each participant's account is credited with the participant's contribution, the employer's contributions and an allocation of plan earnings. The benefit to which a participant is entitled is the benefit which can be provided from the participant's vested account. Notes Receivable from Participants (Defined Contribution Plans) - Participants in the Asset Accumulation and STAR plans may borrow from their fund accounts if they are actively employed, paid on a 12-month payroll cycle, fully vested in their accounts (STAR participants do not have to be fully vested in the Employer Supplemental Contribution Account) and have a minimum balance of $20,000. Employees from the following groups are excluded from borrowing from their fund accounts - Knox County Schools and Charter Schools. The minimum amount a participant may borrow is $5,000 up to a maximum equal to the lesser of $50,000 or 25% of their vested balance. Loan terms may not exceed five years and only one loan is permitted at any time. The loan interest rate is set at 4% per year (as of September 1, 2016). Principal and interest is paid ratably through payroll deductions.
- 16 -
NOTE 1 - DESCRIPTION OF THE KNOX COUNTY RETIREMENT AND PENSION BOARD AND SYSTEM AND PLANS (Continued) Administrative Fees and Operating Expenses (Defined Benefit Plans) - Administrative fees include those charged by the investment custodians, advisors and third-party administrator. Operating expenses of the Knox County Retirement & Pension Board office are allocated to the Closed Defined Benefit Plan, Teacher's Plan, Uniformed Officers Pension Plan and the OPEB Disability Plan. For the years ended June 30, 2017 and 2016, administrative fees include $1,975,075 and $1,565,411, respectively, of operating expenses allocated to the Plans. Forfeitures (Defined Contribution Plans) - Forfeitures were used to assist in funding the Employee Disability Plan. For the years ended June 30, 2017 and 2016, the System used $1,411,521 and $653,098, respectively, in forfeitures to assist in funding the Employee Disability Plan. Forfeited non-vested account balances as of June 30, 2017 and 2016 was $215,010 and $655,173. Tennessee State Laws for Local Government Sponsored Defined Benefit Plans - In May 2014, the Tennessee General Assembly passed “The Public Employee Defined Benefit Financial Security Act of 2014”, Tennessee Code Section 9-3-501, which requires Knox County to make annual employer contributions equal to 100% of its actuarially determined contributions (ADC), use the entry age normal cost method, limit future pension benefit improvements if the net pension plan funded ratio is less than 60% and certain other requirements beginning in fiscal year 2016 with various other provisions phased in through 2020. As of June 30, 2017 and 2016 , the County DB Plan’s funded ratio was 59.8% and 56.7%, which is less than 60% required by state law.

- 17 -
NOTE 1 - DESCRIPTION OF THE KNOX COUNTY RETIREMENT AND PENSION BOARD AND SYSTEM AND PLANS (Continued) Description of Defined Benefit Plans
Closed Defined Benefit Plan Teacher's Plan UOPP
Effective and Closed Plan was established July 1, 1968 Plan was previously a City of Plan was established July 1, 2007 Dates: and was closed to new participants Knoxville Board of Education and was closed to new participants
on September 30, 1991. which was assumed by Knox on December 31, 2013.County as of July 1, 1987.
Employees Covered: Employees of Knox County and Former City of Knoxville Board of Officers regularly employed by the the Knox County Board of Education teachers who were in Knox County Sheriff's Office and Education (non-teachers) who the Plan as of June 30,1987 and who do not participate in the were hired before the plan was regularly employed by the Knox Closed Defined Benefit or Asset closed on September 30, 1991 County Board of Education. Accumulation Plans.and did not choose to convert to the Asset Accumulation Plan.
Employees Excluded: Employees of Knox County who Employees of Knox County who Employees of Knox County who participate in one of the other two participate in one of the other two participate in closed DB Plansdefined benefit plans, or who defined benefit plans, or who or who participate in the Asset participate in the Asset participate in the Asset Accumulation Plan. Accumulation Plan. Accumulation Plan. Also, Knox
County Board of Education teachers and administrators who are participants in the Tennessee Consolidated Retirement System(TCRS).
Employee 5% of Annual Compensation 3% of base earnings ($4,800 6% of annual compensation, no Contributions: annually) with 5% for amounts in employee contributions after a
excess of base earnings. participant has completed 30 years of credited service.
Vesting: 100% after completing five years 100% after completing ten years 100% after completing five years of of credited service. of credited service. credited service.
Normal Retirement Minimum of age 65, with five years of Minimum of age 62, with ten years Minimum of age 50, with 25 years of Age & Required credited service. For elected officials, of credited service. credited service.
Creditable Service: age 55 with five years of credited service.
Normal Retirement Years of credited service times the One-twelfth of credited service Monthly benefit equal to 2.5% of Benefit Formula: greater of (a) 1.75% of average multiplied by the sum of (a) .75% average monthly compensation
monthly compensation or, (b) $30. times average base earnings and multiplied by years of credited(b) 1.50% times average excess service up to 30 years.earnings.
Normal Form of Life Annuity Life Annuity Life annuity for un-marriedBenefit: participants. A 50% joint and
survivor annuity for married participants.
- 18 -
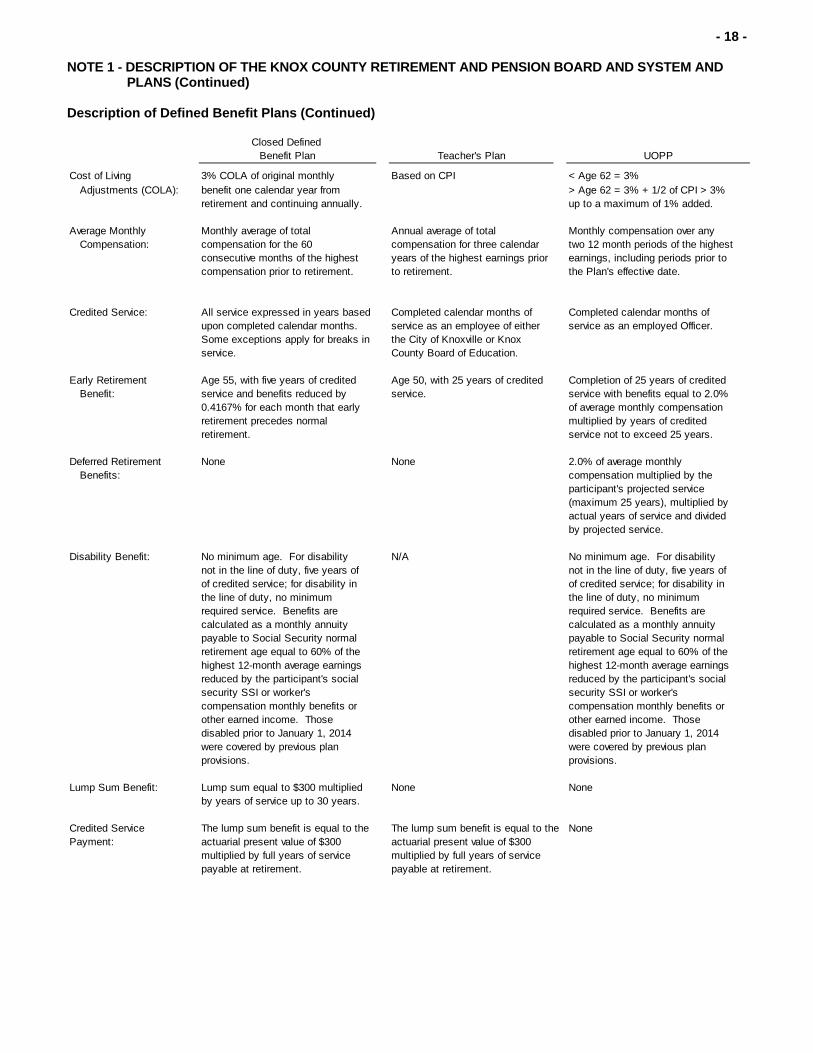
NOTE 1 - DESCRIPTION OF THE KNOX COUNTY RETIREMENT AND PENSION BOARD AND SYSTEM AND PLANS (Continued) Description of Defined Benefit Plans (Continued)
Closed Defined Benefit Plan Teacher's Plan UOPP
Cost of Living 3% COLA of original monthly Based on CPI < Age 62 = 3%
Adjustments (COLA): benefit one calendar year from > Age 62 = 3% + 1/2 of CPI > 3% retirement and continuing annually. up to a maximum of 1% added.
Average Monthly Monthly average of total Annual average of total Monthly compensation over any
Compensation: compensation for the 60 compensation for three calendar two 12 month periods of the highest consecutive months of the highest years of the highest earnings prior earnings, including periods prior tocompensation prior to retirement. to retirement. the Plan's effective date.
Credited Service: All service expressed in years based Completed calendar months of Completed calendar months of upon completed calendar months. service as an employee of either service as an employed Officer.Some exceptions apply for breaks in the City of Knoxville or Knox service. County Board of Education.
Early Retirement Age 55, with five years of credited Age 50, with 25 years of credited Completion of 25 years of creditedBenefit: service and benefits reduced by service. service with benefits equal to 2.0%
0.4167% for each month that early of average monthly compensation retirement precedes normal multiplied by years of credited retirement. service not to exceed 25 years.
Deferred Retirement None None 2.0% of average monthly Benefits: compensation multiplied by the
participant's projected service (maximum 25 years), multiplied byactual years of service and divided by projected service.
Disability Benefit: No minimum age. For disability N/A No minimum age. For disabilitynot in the line of duty, five years of not in the line of duty, five years ofof credited service; for disability in of credited service; for disability in the line of duty, no minimum the line of duty, no minimumrequired service. Benefits are required service. Benefits arecalculated as a monthly annuity calculated as a monthly annuitypayable to Social Security normal payable to Social Security normalretirement age equal to 60% of the retirement age equal to 60% of thehighest 12-month average earnings highest 12-month average earningsreduced by the participant's social reduced by the participant's social security SSI or worker's security SSI or worker's compensation monthly benefits or compensation monthly benefits or other earned income. Those other earned income. Those disabled prior to January 1, 2014 disabled prior to January 1, 2014were covered by previous plan were covered by previous plan provisions. provisions.
Lump Sum Benefit: Lump sum equal to $300 multiplied None Noneby years of service up to 30 years.
Credited Service The lump sum benefit is equal to the The lump sum benefit is equal to the NonePayment: actuarial present value of $300 actuarial present value of $300
multiplied by full years of service multiplied by full years of servicepayable at retirement. payable at retirement.
- 19 -
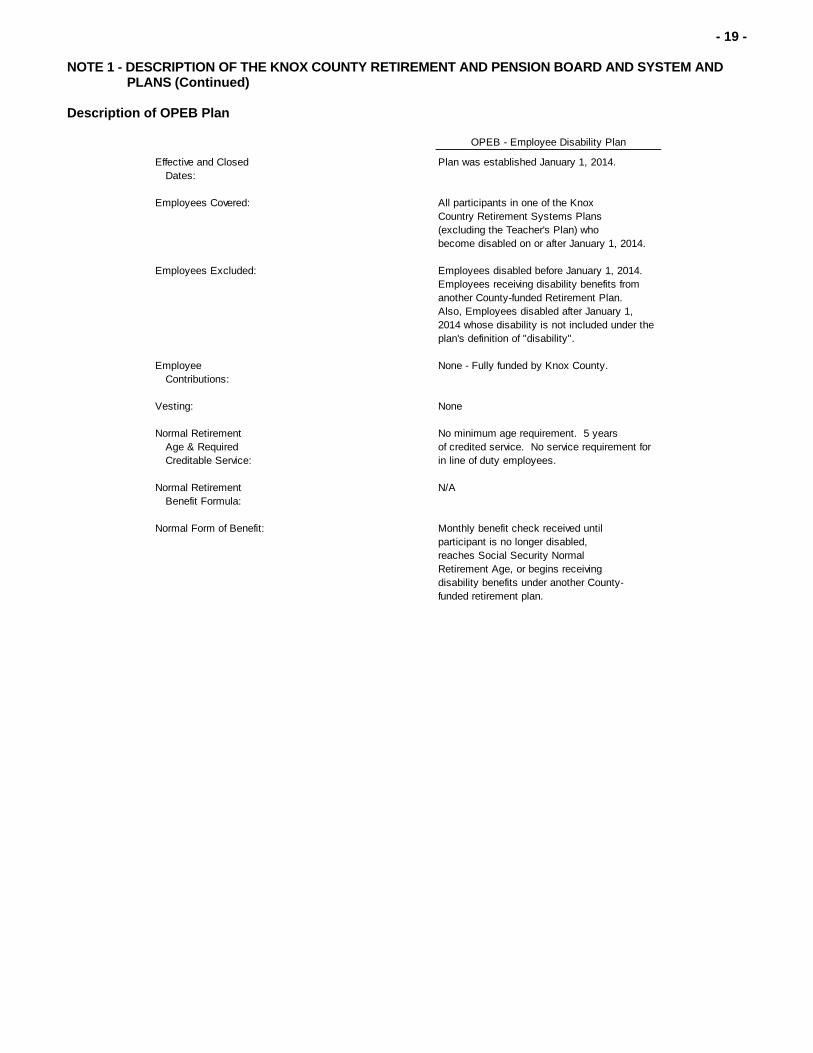
NOTE 1 - DESCRIPTION OF THE KNOX COUNTY RETIREMENT AND PENSION BOARD AND SYSTEM AND PLANS (Continued) Description of OPEB Plan
OPEB - Employee Disability Plan
Effective and Closed Plan was established January 1, 2014.Dates:
Employees Covered: All participants in one of the Knox Country Retirement Systems Plans(excluding the Teacher's Plan) who become disabled on or after January 1, 2014.
Employees Excluded: Employees disabled before January 1, 2014.Employees receiving disability benefits fromanother County-funded Retirement Plan. Also, Employees disabled after January 1, 2014 whose disability is not included under the plan's definition of "disability".
Employee None - Fully funded by Knox County.Contributions:
Vesting: None
Normal Retirement No minimum age requirement. 5 years Age & Required of credited service. No service requirement for
Creditable Service: in line of duty employees.
Normal Retirement N/ABenefit Formula:
Normal Form of Benefit: Monthly benefit check received until participant is no longer disabled, reaches Social Security Normal Retirement Age, or begins receivingdisability benefits under another County-funded retirement plan.
- 20 -
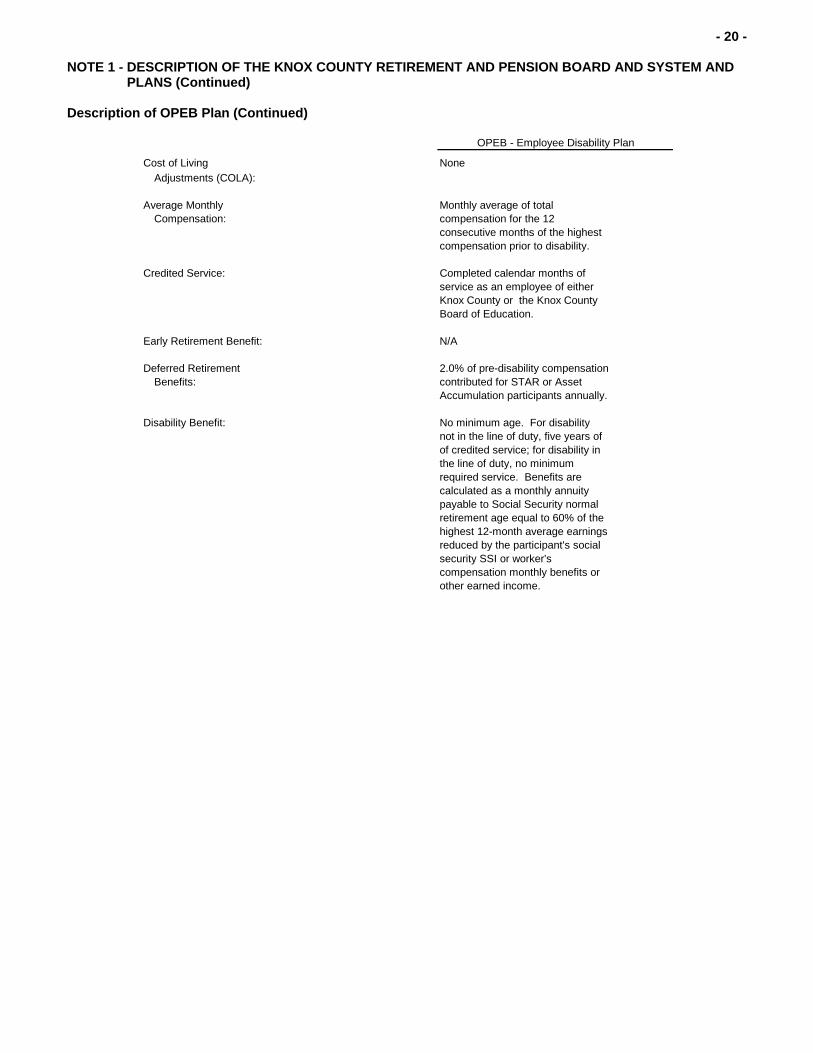
NOTE 1 - DESCRIPTION OF THE KNOX COUNTY RETIREMENT AND PENSION BOARD AND SYSTEM AND PLANS (Continued) Description of OPEB Plan (Continued)
OPEB - Employee Disability Plan
Cost of Living None
Adjustments (COLA):
Average Monthly Monthly average of total Compensation: compensation for the 12
consecutive months of the highest compensation prior to disability.
Credited Service: Completed calendar months of service as an employee of either Knox County or the Knox CountyBoard of Education.
Early Retirement Benefit: N/A
Deferred Retirement 2.0% of pre-disability compensationBenefits: contributed for STAR or Asset
Accumulation participants annually.
Disability Benefit: No minimum age. For disabilitynot in the line of duty, five years ofof credited service; for disability in the line of duty, no minimumrequired service. Benefits arecalculated as a monthly annuitypayable to Social Security normalretirement age equal to 60% of thehighest 12-month average earningsreduced by the participant's social security SSI or worker's compensation monthly benefits or other earned income.

- 21 -
NOTE 1 - DESCRIPTION OF THE KNOX COUNTY RETIREMENT AND PENSION BOARD AND SYSTEM AND PLANS (Continued) Description of Defined Contribution Plans
Asset Accumulation Plan Voluntary 457 Plan
Eligibility and Employees of Knox County and Employees of Knox County and Participation: the Knox County Board of the Knox County Board of
Education (non-teachers) who Education (non-teachers) who are were hired after the Defined Benefit participating in the Asset Plan was closed on September 30, Accumulation or the Closed 1991. Former participants of the Defined Benefit Plans.Closed Defined Plan had the option to transfer to the Asset AccumulationPlan.
Employees Excluded: Employees of Knox County who Employees of Knox County whoparticipate in one of the other three participate certain TCRS plans and certifieddefined benefit plans. Certified teachers of the Knox County Board of teachers and administrators of the Education.Knox County Board of Education covered by TCRS.
Employee Contributions: 6% of Annual Compensation Voluntary(Mandatory)
Employer Matching 6% of Annual Compensation Less than five years of service 0%, Contributions: more than five but less than 10 up
to 2%, more than 10 but less than 15 up to 4%, and more than 15 years up to 6%. Closed DB participants are up to 3%. Matching employer contributions are credited to the participant's Asset Accumulation Plan account.Participants in the UOPP, STAR and TCRSplans are not eligible for employer match.
Vesting of Employer 20% per year after completing one Immediate 100% vesting.Matching Contributions: year of service with 100% after
completing five years of creditedservice.
Normal Retirement Age 55, with five years of credited Based on retirement eligibility of Age & Required service. other plans.Creditable Service:

- 22 -
NOTE 1 - DESCRIPTION OF THE KNOX COUNTY RETIREMENT AND PENSION BOARD AND SYSTEM AND PLANS (Continued) Description of Defined Contribution Plans (Continued)
MERP STAR Plan
Eligibility and Employees of Knox County and Officer's of Knox County Sheriff'sParticipation: the Knox County Board of Office, as classified by the Merit Board
Education (non-teachers) who are as either a law enforcement or participating in the Asset correctional officer, hired or re-hired onAccumulation or the Closed or after January 1, 2014.Defined Benefit Plans.
Employees Excluded: Employees of Knox County who Employees not considered "Officers"participate in the TCRS, UOPP and by the plan. Officer's hired in priorSTAR Plans, Certified teachers years participating in the Assetof the Knox County Board of Education Accumulation Plan or the Uniformedcovered by TCRS. Officer's Pension Plan.
Employee Contributions: Voluntary 6% of Annual Compensation(Mandatory)
Employer Matching 50% of employee contributions up Base contribution of 10% andContributions: to annual maximum of $208. Supplemental contribution of 2% up
to 30 years. After 30 years base contribution decreases to 6% and there is no the supplemental contribution.
Vesting of Employer Immediate 100% vesting. The base contribution is 100% vestedMatching Contributions: after 10 years of service and the
supplemental contributions is 100% vested after 15 years. 100% vesting will occur in both after 10 years of service and the participant is at least 57 years of age.
Normal Retirement Based on retirement eligibility of Age 57, with 10 years of credited Age & Required other plans. service.Creditable Service:
- 23 -
NOTE 1 - DESCRIPTION OF THE KNOX COUNTY RETIREMENT AND PENSION BOARD AND SYSTEM AND PLANS (Continued) Description of Defined Contribution Plans (Continued)
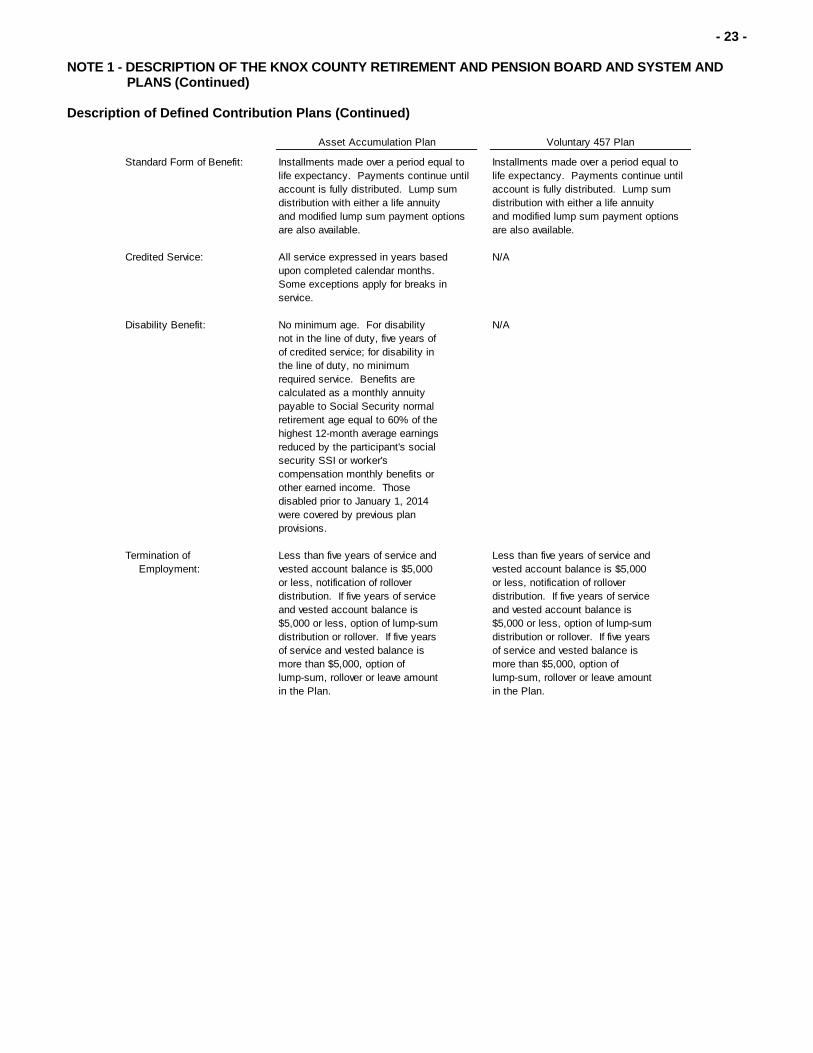
Asset Accumulation Plan Voluntary 457 Plan
Standard Form of Benefit: Installments made over a period equal to Installments made over a period equal to life expectancy. Payments continue until life expectancy. Payments continue until
account is fully distributed. Lump sum account is fully distributed. Lump sum distribution with either a life annuity distribution with either a life annuity and modified lump sum payment options and modified lump sum payment optionsare also available. are also available.
Credited Service: All service expressed in years based N/Aupon completed calendar months.Some exceptions apply for breaks inservice.
Disability Benefit: No minimum age. For disability N/Anot in the line of duty, five years ofof credited service; for disability in the line of duty, no minimumrequired service. Benefits arecalculated as a monthly annuitypayable to Social Security normalretirement age equal to 60% of thehighest 12-month average earningsreduced by the participant's social security SSI or worker's compensation monthly benefits or other earned income. Those disabled prior to January 1, 2014were covered by previous plan provisions.
Termination of Less than five years of service and Less than five years of service and Employment: vested account balance is $5,000 vested account balance is $5,000
or less, notification of rollover or less, notification of rolloverdistribution. If five years of service distribution. If five years of service and vested account balance is and vested account balance is $5,000 or less, option of lump-sum $5,000 or less, option of lump-sum distribution or rollover. If five years distribution or rollover. If five years of service and vested balance is of service and vested balance is more than $5,000, option of more than $5,000, option of lump-sum, rollover or leave amount lump-sum, rollover or leave amount in the Plan. in the Plan.
- 24 -
NOTE 1 - DESCRIPTION OF THE KNOX COUNTY RETIREMENT AND PENSION BOARD AND SYSTEM AND PLANS (Continued) Description of Defined Contribution Plans (Continued)
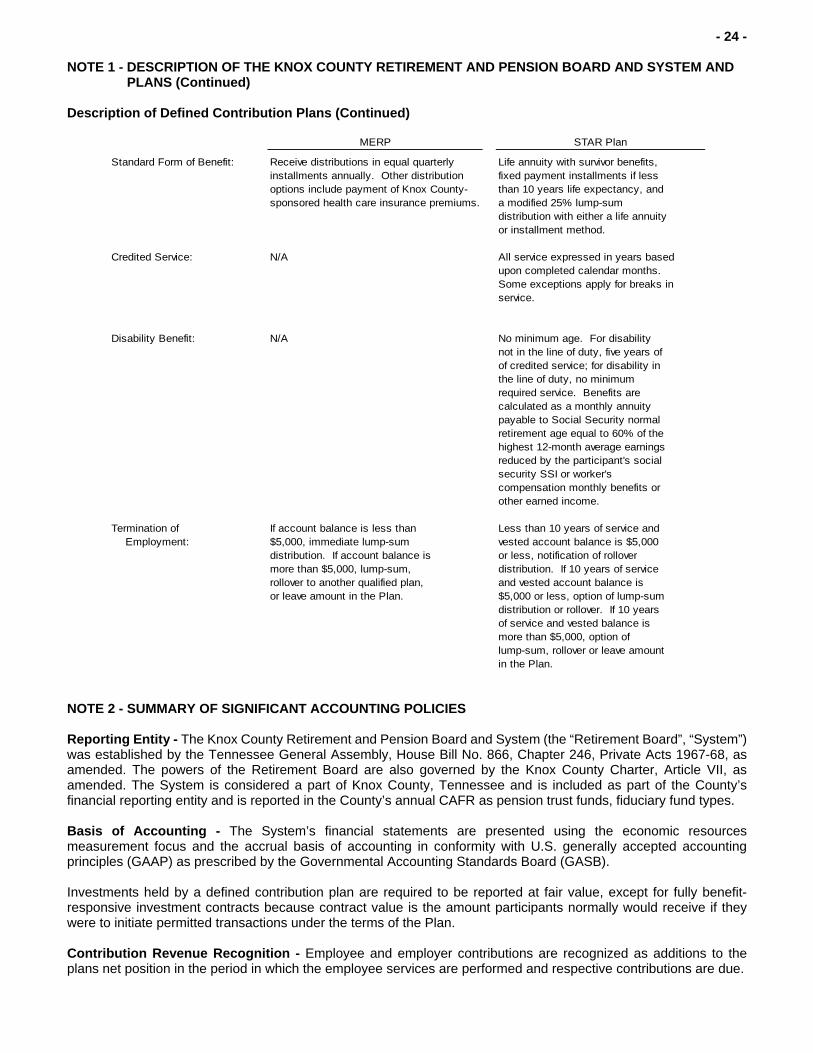
MERP STAR Plan
Standard Form of Benefit: Receive distributions in equal quarterly Life annuity with survivor benefits, installments annually. Other distribution fixed payment installments if less
options include payment of Knox County- than 10 years life expectancy, and sponsored health care insurance premiums. a modified 25% lump-sum
distribution with either a life annuity or installment method.
Credited Service: N/A All service expressed in years basedupon completed calendar months.Some exceptions apply for breaks inservice.
Disability Benefit: N/A No minimum age. For disabilitynot in the line of duty, five years ofof credited service; for disability in the line of duty, no minimumrequired service. Benefits arecalculated as a monthly annuitypayable to Social Security normalretirement age equal to 60% of thehighest 12-month average earningsreduced by the participant's social security SSI or worker's compensation monthly benefits or other earned income.
Termination of If account balance is less than Less than 10 years of service and Employment: $5,000, immediate lump-sum vested account balance is $5,000
distribution. If account balance is or less, notification of rollovermore than $5,000, lump-sum, distribution. If 10 years of service rollover to another qualified plan, and vested account balance is or leave amount in the Plan. $5,000 or less, option of lump-sum
distribution or rollover. If 10 years of service and vested balance is more than $5,000, option of lump-sum, rollover or leave amount in the Plan.
NOTE 2 - SUMMARY OF SIGNIFICANT ACCOUNTING POLICIES Reporting Entity - The Knox County Retirement and Pension Board and System (the “Retirement Board”, “System”) was established by the Tennessee General Assembly, House Bill No. 866, Chapter 246, Private Acts 1967-68, as amended. The powers of the Retirement Board are also governed by the Knox County Charter, Article VII, as amended. The System is considered a part of Knox County, Tennessee and is included as part of the County’s financial reporting entity and is reported in the County’s annual CAFR as pension trust funds, fiduciary fund types. Basis of Accounting - The System’s financial statements are presented using the economic resources measurement focus and the accrual basis of accounting in conformity with U.S. generally accepted accounting principles (GAAP) as prescribed by the Governmental Accounting Standards Board (GASB). Investments held by a defined contribution plan are required to be reported at fair value, except for fully benefit-responsive investment contracts because contract value is the amount participants normally would receive if they were to initiate permitted transactions under the terms of the Plan. Contribution Revenue Recognition - Employee and employer contributions are recognized as additions to the plans net position in the period in which the employee services are performed and respective contributions are due.
- 25 -
NOTE 2 - SUMMARY OF SIGNIFICANT ACCOUNTING POLICIES (Continued) Cash and Cash Equivalents - Cash and cash equivalents consist of highly liquid investments, including cash held on a temporary basis by the investment trustee and custodian and money market funds. Substantially all cash and cash equivalents are uninsured and uncollateralized; carrying values approximate fair value. Investment Valuation and Income Recognition - Investments, except for the guaranteed investment contract, are stated at fair value. Securities traded on a national or international exchange are valued at the last reported sales price at current exchange rates. Net increases (decreases) in fair value of investments reflect the change in market values from the preceding year-end to the current year-end (including investments bought, sold and held during the year). The guaranteed investment contract is valued at contract value. See Note 7, Guaranteed Investment Contract, for additional information. Purchases and sales of securities are recorded on a trade-date basis. Interest and dividend income is recorded on the accrual basis. Dividends are recorded on the ex-dividend date. A description of the valuation methodologies used to measure investments at fair value are further described in Note 6. Investment Policy - The Retirement Board has investment policies in regards to allocation of investment assets in the defined benefit plans and OPEB plan and may be amended by the Board. It is the policy of the Board to pursue an investment strategy that reduces risk through the prudent diversification of the investment portfolio across a broad selection of investment classes. The Board’s investment policies are further described in Note 6. Benefits Paid - Benefit payments to participants are recorded as incurred according to the plan provisions. Net Fiduciary Position - Net fiduciary position comprises results from investment income (loss), contributions, benefits paid and administrative expenses. Net fiduciary position is classified as follows: restricted for pension, OPEB and retirement benefits. Pension Liabilities and Actuarial Present Value of OPEB Liabilities (Defined Benefit and OPEB Plans) - Pension liabilities, and actuarial accrued OPEB liabilities are those future periodic payments that are attributable under the Plan's provisions to the service employees have rendered. Pension and OPEB liabilities include benefits expected to be paid to (a) retired or terminated employees or their beneficiaries, (b) beneficiaries of employees who have died, and (c) present employees or their beneficiaries. Benefits payable under all circumstances - retirement, death, disability, and termination of employment - are included, to the extent they are deemed attributable to employee service rendered to the valuation date. The pension liabilities and the actuarial present value of OPEB liabilities is determined by an actuary from USI Consulting Group and is that amount which results from applying actuarial assumptions to adjust the pension and OPEB liabilities to reflect the time value of money (through discounts for interest) and the probability of payment (by means of decrements such as for death, disability, withdrawal or retirement) between the valuation date and the expected date of payment. Net Position Flow Assumption - The System's fiduciary net position is restricted for pension, OPEB and retirement benefits. In order to calculate the amounts to report as restricted - net position and unrestricted - net position in the financial statements, a flow assumption must be made about the order in which the resources are considered to be applied. When both restricted and unrestricted resources are available for use, it is the System’s policy to consider restricted - net position to have been depleted before unrestricted - net position is applied. As of June 30, 2017 and 2016, the System did not have any unrestricted net position. Expenses - Operating expenses of the System, such as salaries, benefits, occupancy costs, and fees charged by the investment custodians, advisors, actuary and third-party administrator are allocated to the defined benefit plans and OPEB plan. Investment fees related to the defined contribution plans participants' accounts are included in net appreciation (depreciation) of fair value of investments. Use of Estimates - The preparation of financial statements in conformity with U.S. generally accepted accounting principles requires management to make certain estimates and assumptions that affect the reported amounts of assets and liabilities and disclosure of contingent assets and liabilities at the statement of plan net position date, and reported amounts of additions and deductions during the reporting period. Significant estimates include fair value of investments and all actuarial calculations. Accordingly, actual results may differ from those estimates.

- 26 -
NOTE 2 - SUMMARY OF SIGNIFICANT ACCOUNTING POLICIES (Continued) Governmental Accounting Standard Board (GASB) Pronouncements
GASB Statement No. 72 - During the year ended June 30, 2016, the System adopted GASB Statement No. 72, Fair Value Measurement and Application, required for fiscal periods beginning after June 15, 2015. The accompanying financial statements, notes and required supplementary information have been updated to incorporate the changes under GASB Statement No. 72. GASB Statement No. 74 - During the year ended June 30, 2017, the System adopted GASB Statement No. 74, Financial Reporting for Postemployment Benefit Plans Other Than Pension Plans, required for fiscal periods beginning after June 15, 2016. The accompanying financial statements, notes and required supplementary information have been updated to incorporate the changes under GASB Statement No. 74.
NOTE 3 - DEFINED BENEFIT PLANS - NET PENSION LIABILITY (ASSET) OF THE COUNTY Knox County makes periodic payments to the investment trustee of the defined benefit plans, State Street Bank & Trust, determined on the basis of annual actuarial estimates furnished by USI Consulting Group which shall be in such amounts as the administrator deems necessary for the accumulation to be sufficient to provide applicable retirement benefits. Participants are required to make contributions as described in Note 1. The Plans adopted the use of the individual entry age normal cost method effective with the January 1, 2009 valuation. As of January 1, the actuarial valuation date, and June 30, the measurement date of the actuarial report, the defined benefit plans schedule of net pension liability was:
Closed Defined Net Pension Liability (Asset) Benefit Plan Teacher's Plan UOPP
As of June 30, 2017Total Pension Liability $ 71,463,732 $ 67,981,453 $ 207,960,660
Plan Fiduciary Net Position (42,744,223) (58,784,778) (168,791,309)
$ 28,719,509 $ 9,196,675 $ 39,169,351
Plan's Fiduciary Net Position as aPercent of Total Pension Liability 59.81% 86.47% 81.17%
As of June 30, 2016Total Pension Liability $ 74,711,281 $ 70,670,417 $ 189,642,132
Plan Fiduciary Net Position (42,321,317) (58,047,742) (151,191,959)
$ 32,389,964 $ 12,622,675 $ 38,450,173
Plan's Fiduciary Net Position as aPercent of Total Pension Liability 56.65% 82.14% 79.72%
County's Net Pension Liability (Asset)
County's Net Pension Liability (Asset)
The schedule of changes in the net pension liability, presented as required supplementary information following the notes to the financial statements, presents multiyear trend information about whether the market value of plan assets is increasing or decreasing over time relative to the total pension liabilities. For the years ended June 30, 2017 and 2016, the defined benefit plans’ actuarially determined contribution (ADC) was $7,922,886 and $7,490,587, respectively. The actual employer contributions were $7,923,296 and $7,545,772 for 2017 and 2016, respectively.
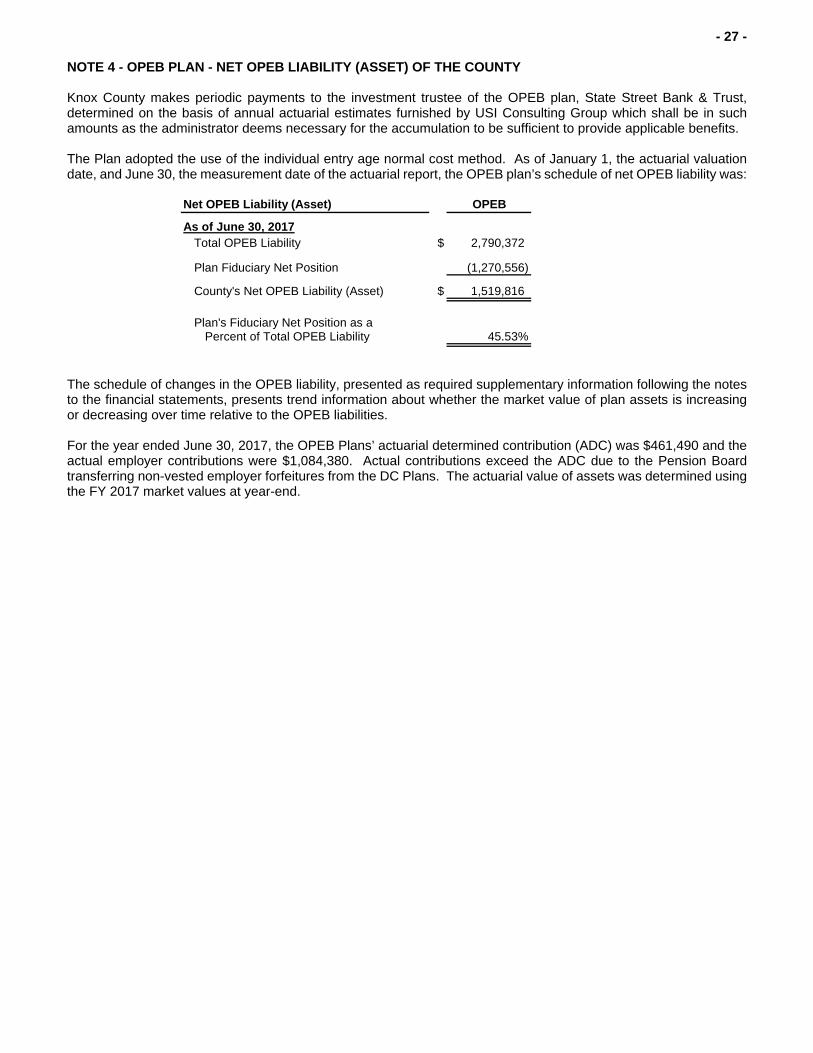
- 27 -
NOTE 4 - OPEB PLAN - NET OPEB LIABILITY (ASSET) OF THE COUNTY Knox County makes periodic payments to the investment trustee of the OPEB plan, State Street Bank & Trust, determined on the basis of annual actuarial estimates furnished by USI Consulting Group which shall be in such amounts as the administrator deems necessary for the accumulation to be sufficient to provide applicable benefits. The Plan adopted the use of the individual entry age normal cost method. As of January 1, the actuarial valuation date, and June 30, the measurement date of the actuarial report, the OPEB plan’s schedule of net OPEB liability was:
Net OPEB Liability (Asset) OPEB
As of June 30, 2017Total OPEB Liability $ 2,790,372
Plan Fiduciary Net Position (1,270,556)
County's Net OPEB Liability (Asset) $ 1,519,816
Plan's Fiduciary Net Position as aPercent of Total OPEB Liability 45.53%
The schedule of changes in the OPEB liability, presented as required supplementary information following the notes to the financial statements, presents trend information about whether the market value of plan assets is increasing or decreasing over time relative to the OPEB liabilities. For the year ended June 30, 2017, the OPEB Plans’ actuarial determined contribution (ADC) was $461,490 and the actual employer contributions were $1,084,380. Actual contributions exceed the ADC due to the Pension Board transferring non-vested employer forfeitures from the DC Plans. The actuarial value of assets was determined using the FY 2017 market values at year-end.

- 28 -
NOTE 5 - DEFINED BENEFIT AND OPEB PLANS - ACTUARIAL ASSUMPTIONS Significant actuarial assumptions used in the valuation of the defined benefit plans as of January 1, 2017, with a measurement date of June 30, 2017, are as follows:
Closed Defined Benefit Plan Teacher's Plan UOPP
Actuarial Cost Method Individual Entry Age Individual Entry Age Individual Entry AgeNormal Cost Normal Cost Normal Cost
Amortization Method Level Percentage Level Percentage Level Percentageof Payroll, Closed of Payroll, Closed of Payroll, Closed
Remaining AmortizationPeriod 16 Years 16 Years 26 Years
Asset Valuation Method for Recognized over 5 years, Recognized over 5 years, Recognized over 5 years,Actuarial Determined providing actuarial value of providing actuarial value of providing actuarial value of & Required Contributions net assets remains between net assets remains between net assets remains between (ADC & ARC) 80%-120% of market value. 90%-110% of market value. 80%-120% of market value.
Actuarial AssumptionsInvestment Rate of Return
Pre and Post-Retirement(Discount Rate) 7.00% 7.00% 7.00%
Projected Salary Increases Pre-Retirement 3.00% N/A 3.00%
Assumed Benefit IncreasesAll Participants 3.00% 3.00% 3.13%
Inflation 1.45% 1.45% 1.45%
Age at Retirement 65 N/A Participants hired before age 40, age 57 and 30 yearsof credited service. Participants hired afterage 40, age 50 and 25 yearscredited service.
Mortality Table 1983 Group Annuity 1983 Group Annuity 1984 Unisex (Male and Female) (Male and Female)
Disability Table RR 96-7 Post 94 N/A RR 96-7 Post 94
Experience Study January 1, 2008 to January 1, 2002 to January 1, 2008 toDecember 31, 2011 December 31, 2011 December 31, 2011

- 29 -
NOTE 5 - DEFINED BENEFIT AND OPEB PLANS - ACTUARIAL ASSUMPTIONS (Continued) Significant actuarial assumptions used in the valuation of the defined benefit plans as of January 1, 2016, with a measurement date of June 30, 2016, are as follows:
Closed Defined Benefit Plan Teacher's Plan UOPP
Actuarial Cost Method Individual Entry Age Individual Entry Age Individual Entry AgeNormal Cost Normal Cost Normal Cost
Amortization Method Level Percentage Level Percentage Level Percentageof Payroll, Closed of Payroll, Closed of Payroll, Closed
Remaining AmortizationPeriod 17 Years 17 Years 27 Years
Asset Valuation Method for Greater of the (a) five year Greater of the (a) five year Greater of the (a) five yearActuarial Determined moving market average, moving market average, moving market average, & Required Contributions or (b) 90% of fair value of or (b) 90% of fair value of or (b) 80% of fair value of (ADC & ARC) investments at year-end. investments at year-end. investments at year-end.
Actuarial AssumptionsInvestment Rate of Return
Pre and Post-Retirement(Discount Rate) 7.00% 7.00% 7.00%
Projected Salary Increases Pre-Retirement 3.00% N/A 3.00%
Assumed Benefit IncreasesAll Participants 3.00% 3.00% 3.25%
Inflation 1.45% 1.45% 1.45%
Age at Retirement 65 60 Participants hired before age 40, age 57 and 30 yearsof credited service. Participants hired afterage 40, age 50 and 25 yearscredited service.
Mortality Table 1983 Group Annuity 1983 Group Annuity 1984 Unisex (Male and Female) (Male and Female)
Disability Table RR 96-7 Post 94 N/A RR 96-7 Post 94
Experience Study January 1, 2002 to January 1, 2002 to January 1, 2008 toDecember 31, 2011 December 31, 2011 December 31, 2011

- 30 -
NOTE 5 - DEFINED BENEFIT AND OPEB PLANS - ACTUARIAL ASSUMPTIONS (Continued) Significant actuarial assumptions used in the valuation of the OPEB plan as of January 1, 2017 and 2016 with measurement dates of June 30, 2017 and 2016, are as follows:
June 30, June 30,2017 2016
Actuarial Cost Method Individual Entry Age Individual Entry AgeNormal Cost Normal Cost
Amortization Method Level Percentage Level Percentageof Payroll, Closed of Payroll, Closed
Remaining AmortizationPeriod 16 Years 17 Years
Asset Valuation Method for Recognized over 5 years, Recognized over 5 years,Actuarial Determined providing actuarial value of providing actuarial value of & Required Contributions net assets remains between net assets remains between (ADC & ARC) 80%-120% of market value. 80%-120% of market value.
Actuarial AssumptionsInvestment Rate of Return
Pre and Post-Retirement(Discount Rate) 7.00% 7.00%
Projected Salary IncreasesPre-Retirement 3.00% 3.00%
Assumed Benefit IncreasesAll Participants N/A N/A
Inflation 1.45% 1.45%
Age at Retirement Normal Retirement Age Normal Retirement Ageunder the other Defined under the other Defined
Benefit Plans, Asset Benefit Plans, AssetAccumulation & STAR Plans. Accumulation & STAR Plans.
Mortality Table Healthy - 1983 Group Annuity (Closed, Healthy - 1983 Group Annuity (Closed, Teacher's & Asset Accumulation Plans) Teacher's & Asset Accumulation Plans)
& 1984 Unisex (UOPP & STAR Plans) & 1984 Unisex (UOPP & STAR Plans)Disabled - RR 96-7 Post 94 Disabled - RR 96-7 Post 94

- 31 -
NOTE 5 - DEFINED BENEFIT AND OPEB PLANS - ACTUARIAL ASSUMPTIONS (Continued) Expected Investment Rates of Return - The long-term expected rate of return on pension and OPEB plan investments was determined using a building block method in which best-estimate ranges of expected future real rates of return (expected returns, net of pension and OPEB plan investment expense and inflation) are developed for each major investment type. These ranges are combined to produce the long-term expected rate of return by weighting the expected future real rates of return by the target asset allocation percentage and by adding expected inflation which was 1.95% for 2017 and 1.45% for 2016. Best estimates of arithmetic real rates of return for each major investment classification included in the pension plans’ target asset allocation as of June 30, 2017 and 2016 are as follows:
Investment Type 2017 2016
U.S. Equities 6.50 % 6.25 %Non - U.S. Equities 6.70 6.45Core Fixed Income 3.60 2.75High Yield Fixed Income 5.10 5.65U.S. Treasury Inflation Protected Securities (TIPS) 3.00 2.35Private Real Estate 5.75 5.85U.S. Real Estate ( REITS) 5.30 4.70
Long-Term Expected Real Rate of Return
Defined Benefit Plans
Discount Rate - The discount rate used in 2017 and 2016 to measure the pension liability for the DB Plans and the actuarial accrued liability of the OPEB Plan was 7.00%. The projection of cash flows used to determine the discount rate assumed that plan member contributions will be made at the current contribution rate and that County employer contributions will be made at rates equal to the difference between actuarially determined contribution rates and the participant rate. Based on those assumptions, the pension and OPEB plans’ fiduciary net positions were projected to be available to make all projected future benefit payments of current plan participants. Therefore, the long-term expected rate of return on pension plan and OPEB investments was applied to all periods of projected benefit payments to determine the total pension and OPEB liabilities. Sensitivity of the Net Pension and OPEB Liabilities (Assets) to Changes in the Discount Rate - The following tables present the net pension and OPEB liabilities (assets) of the County, calculated using the discount rate of 7.00%, as well as what the County’s net pension and OPEB liabilities would be if they were calculated using a discount rate that is 1-percentage-point lower (6.00%) or 1-percentage-point higher (8.00%) than the current rate.
Current 1% Decrease Discount Rate 1% Increase
6.00% 7.00% 8.00%
June 30, 2017Defined Benefit Plans: Closed Defined Benefit Plan $ 34,733,224 $ 28,719,509 $ 23,522,893 Teacher's Plan 14,528,393 9,196,675 4,525,299 UOPP 69,021,312 39,169,351 14,585,930
June 30, 2016Defined Benefit Plans: Closed Defined Benefit Plan $ 38,709,571 $ 32,389,964 $ 26,932,262 Teacher's Plan 18,340,154 12,622,675 7,629,640 UOPP 66,598,963 38,450,173 15,229,770
County's Net Pension Liability (Asset)
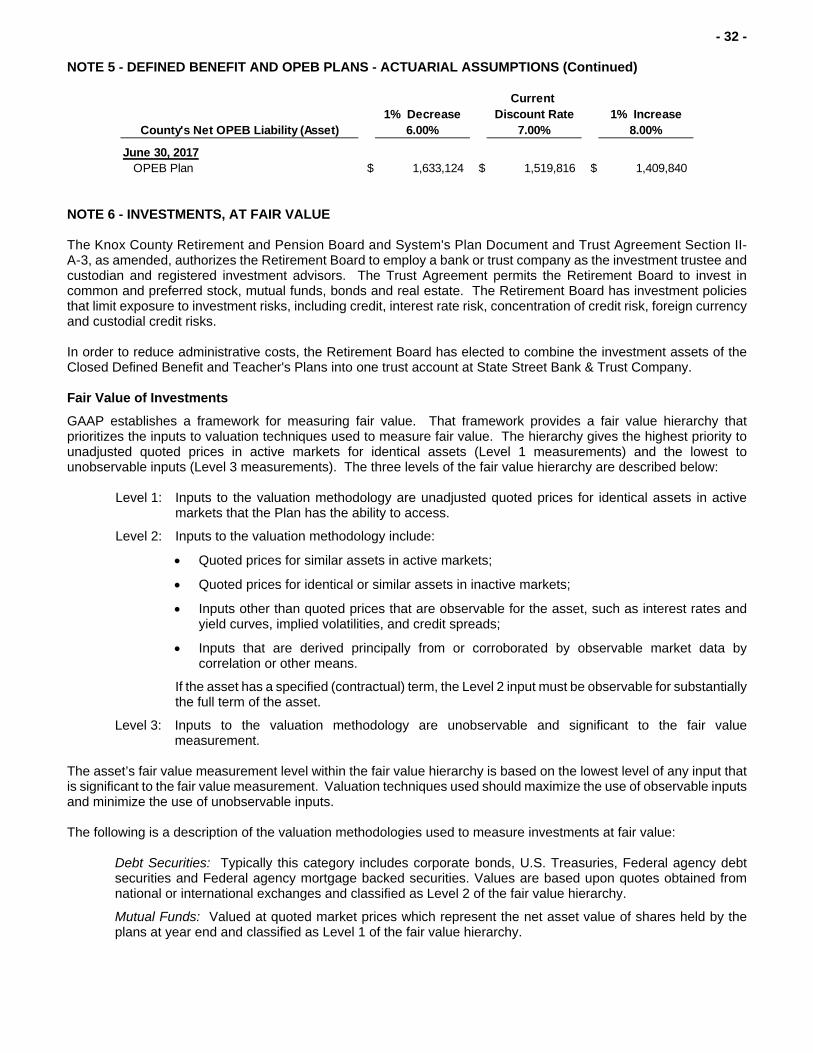
- 32 -
NOTE 5 - DEFINED BENEFIT AND OPEB PLANS - ACTUARIAL ASSUMPTIONS (Continued)
Current 1% Decrease Discount Rate 1% Increase
6.00% 7.00% 8.00%
June 30, 2017OPEB Plan $ 1,633,124 $ 1,519,816 $ 1,409,840
County's Net OPEB Liability (Asset)
NOTE 6 - INVESTMENTS, AT FAIR VALUE The Knox County Retirement and Pension Board and System's Plan Document and Trust Agreement Section II-A-3, as amended, authorizes the Retirement Board to employ a bank or trust company as the investment trustee and custodian and registered investment advisors. The Trust Agreement permits the Retirement Board to invest in common and preferred stock, mutual funds, bonds and real estate. The Retirement Board has investment policies that limit exposure to investment risks, including credit, interest rate risk, concentration of credit risk, foreign currency and custodial credit risks. In order to reduce administrative costs, the Retirement Board has elected to combine the investment assets of the Closed Defined Benefit and Teacher's Plans into one trust account at State Street Bank & Trust Company. Fair Value of Investments
GAAP establishes a framework for measuring fair value. That framework provides a fair value hierarchy that prioritizes the inputs to valuation techniques used to measure fair value. The hierarchy gives the highest priority to unadjusted quoted prices in active markets for identical assets (Level 1 measurements) and the lowest to unobservable inputs (Level 3 measurements). The three levels of the fair value hierarchy are described below:
Level 1: Inputs to the valuation methodology are unadjusted quoted prices for identical assets in active markets that the Plan has the ability to access.
Level 2: Inputs to the valuation methodology include:
Quoted prices for similar assets in active markets;
Quoted prices for identical or similar assets in inactive markets;
Inputs other than quoted prices that are observable for the asset, such as interest rates and yield curves, implied volatilities, and credit spreads;
Inputs that are derived principally from or corroborated by observable market data by correlation or other means.
If the asset has a specified (contractual) term, the Level 2 input must be observable for substantially the full term of the asset.
Level 3: Inputs to the valuation methodology are unobservable and significant to the fair value measurement.
The asset’s fair value measurement level within the fair value hierarchy is based on the lowest level of any input that is significant to the fair value measurement. Valuation techniques used should maximize the use of observable inputs and minimize the use of unobservable inputs. The following is a description of the valuation methodologies used to measure investments at fair value:
Debt Securities: Typically this category includes corporate bonds, U.S. Treasuries, Federal agency debt securities and Federal agency mortgage backed securities. Values are based upon quotes obtained from national or international exchanges and classified as Level 2 of the fair value hierarchy.
Mutual Funds: Valued at quoted market prices which represent the net asset value of shares held by the plans at year end and classified as Level 1 of the fair value hierarchy.
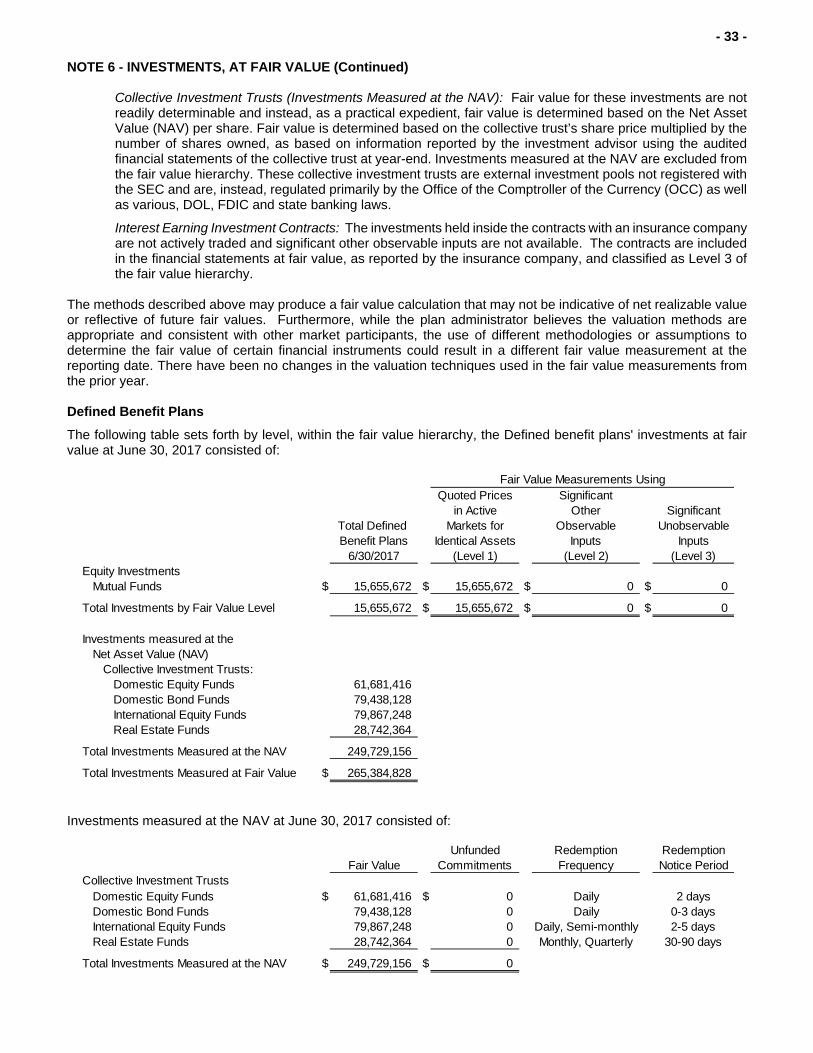
- 33 -
NOTE 6 - INVESTMENTS, AT FAIR VALUE (Continued) Collective Investment Trusts (Investments Measured at the NAV): Fair value for these investments are not readily determinable and instead, as a practical expedient, fair value is determined based on the Net Asset Value (NAV) per share. Fair value is determined based on the collective trust’s share price multiplied by the number of shares owned, as based on information reported by the investment advisor using the audited financial statements of the collective trust at year-end. Investments measured at the NAV are excluded from the fair value hierarchy. These collective investment trusts are external investment pools not registered with the SEC and are, instead, regulated primarily by the Office of the Comptroller of the Currency (OCC) as well as various, DOL, FDIC and state banking laws.
Interest Earning Investment Contracts: The investments held inside the contracts with an insurance company are not actively traded and significant other observable inputs are not available. The contracts are included in the financial statements at fair value, as reported by the insurance company, and classified as Level 3 of the fair value hierarchy.
The methods described above may produce a fair value calculation that may not be indicative of net realizable value or reflective of future fair values. Furthermore, while the plan administrator believes the valuation methods are appropriate and consistent with other market participants, the use of different methodologies or assumptions to determine the fair value of certain financial instruments could result in a different fair value measurement at the reporting date. There have been no changes in the valuation techniques used in the fair value measurements from the prior year. Defined Benefit Plans
The following table sets forth by level, within the fair value hierarchy, the Defined benefit plans' investments at fair value at June 30, 2017 consisted of:
Quoted Prices Significantin Active Other Significant
Total Defined Markets for Observable Unobservable Benefit Plans Identical Assets Inputs Inputs
6/30/2017 (Level 1) (Level 2) (Level 3)Equity Investments
Mutual Funds $ 15,655,672 $ 15,655,672 $ 0 $ 0
Total Investments by Fair Value Level 15,655,672 $ 15,655,672 $ 0 $ 0
Investments measured at the Net Asset Value (NAV)
Collective Investment Trusts:Domestic Equity Funds 61,681,416 Domestic Bond Funds 79,438,128 International Equity Funds 79,867,248 Real Estate Funds 28,742,364
Total Investments Measured at the NAV 249,729,156
Total Investments Measured at Fair Value $ 265,384,828
Fair Value Measurements Using
Investments measured at the NAV at June 30, 2017 consisted of:
Unfunded Redemption RedemptionFair Value Commitments Frequency Notice Period
Collective Investment TrustsDomestic Equity Funds $ 61,681,416 $ 0 Daily 2 daysDomestic Bond Funds 79,438,128 0 Daily 0-3 daysInternational Equity Funds 79,867,248 0 Daily, Semi-monthly 2-5 daysReal Estate Funds 28,742,364 0 Monthly, Quarterly 30-90 days
Total Investments Measured at the NAV $ 249,729,156 $ 0
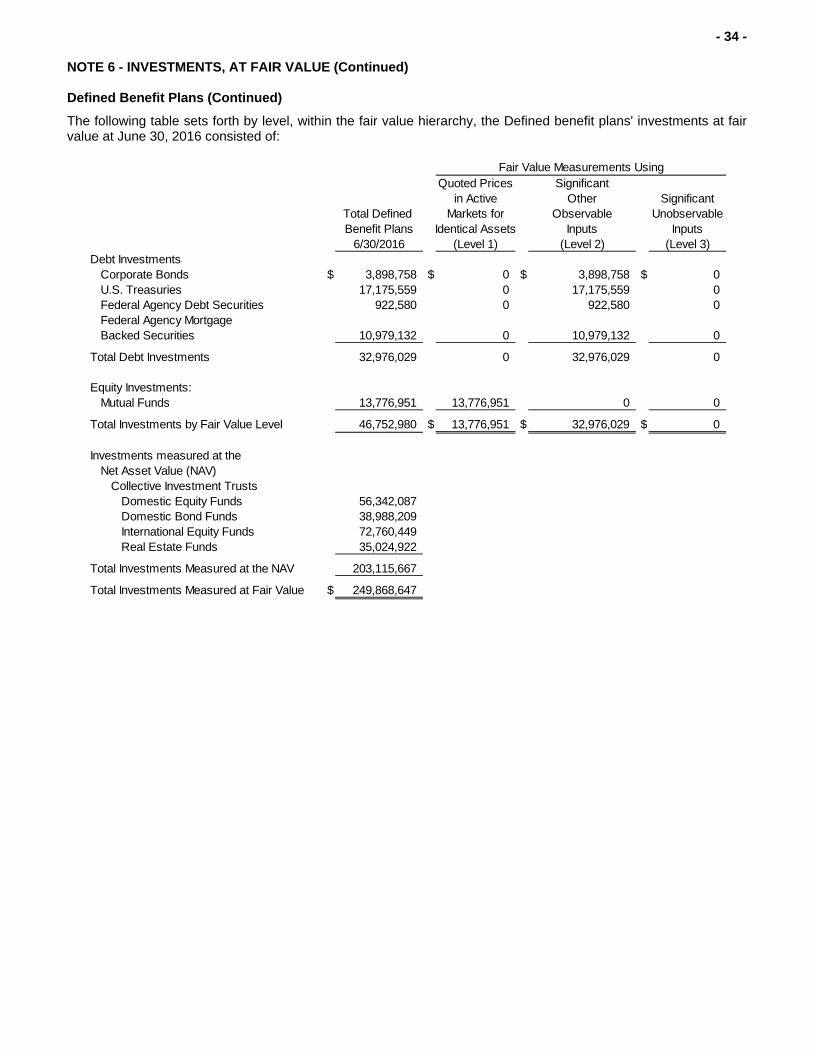
- 34 -
NOTE 6 - INVESTMENTS, AT FAIR VALUE (Continued) Defined Benefit Plans (Continued)
The following table sets forth by level, within the fair value hierarchy, the Defined benefit plans' investments at fair value at June 30, 2016 consisted of:
Quoted Prices Significantin Active Other Significant
Total Defined Markets for Observable Unobservable Benefit Plans Identical Assets Inputs Inputs
6/30/2016 (Level 1) (Level 2) (Level 3)Debt Investments
Corporate Bonds $ 3,898,758 $ 0 $ 3,898,758 $ 0U.S. Treasuries 17,175,559 0 17,175,559 0Federal Agency Debt Securities 922,580 0 922,580 0Federal Agency Mortgage Backed Securities 10,979,132 0 10,979,132 0
Total Debt Investments 32,976,029 0 32,976,029 0
Equity Investments:Mutual Funds 13,776,951 13,776,951 0 0
Total Investments by Fair Value Level 46,752,980 $ 13,776,951 $ 32,976,029 $ 0
Investments measured at the Net Asset Value (NAV)
Collective Investment TrustsDomestic Equity Funds 56,342,087 Domestic Bond Funds 38,988,209 International Equity Funds 72,760,449 Real Estate Funds 35,024,922
Total Investments Measured at the NAV 203,115,667
Total Investments Measured at Fair Value $ 249,868,647
Fair Value Measurements Using

- 35 -
NOTE 6 - INVESTMENTS, AT FAIR VALUE (Continued) Defined Benefit Plans (Continued)
Investments measured at the NAV at June 30, 2016 consisted of:
Unfunded Redemption RedemptionFair Value Commitments Frequency Notice Period
Collective Investment TrustsDomestic Equity Funds $ 56,342,087 $ 0 Daily 2 daysDomestic Bond Funds 38,988,209 0 Daily 0-3 daysInternational Equity Funds 72,760,449 0 Daily, Semi-monthly 2-5 daysReal Estate Funds 35,024,922 0 Monthly, Quarterly 30-90 days
Total Investments Measured at the NAV $ 203,115,667 $ 0
1. Domestic Equity Funds. This type includes investments in one collective investment trust that invests mainly in large capitalization U.S. common stocks. The fair value of the investment in this type has been determined using the NAV per share of the investments.
2. Domestic Bond Funds. This type includes investments in two collective investment trusts that invest mainly in U.S. Treasury Inflation Protected Securities (TIPS) and U.S. corporate high yield bonds. The fair value of the investment in this type has been determined using the NAV per share of the investments.
3. International Equity Funds. This type includes investments in three collective investment trusts that hold approximately 90% of the funds’ investments in non-U.S. common stocks and preferred and approximately 10% of the funds’ investments in foreign cash and other assets. The fair values of the investments in this type have been determined using the NAV per share of the investments.
4. Real Estate Funds. This type includes two collective investment funds that invest primarily in securities of real estate investment trusts, other companies in the real estate industry, and direct ownership of real estate. The fair values of the investments in this type have been determined using the NAV per share (or its equivalent) of the investments.
A Change in Fair Value Levels - To assess the appropriate classification of investments within the fair value hierarchy, the availability of market data is monitored. Changes in economic conditions or valuation techniques may require the transfer of investments from one fair value level to another. In such instances, the transfer is reported at the beginning of the reporting period. Management evaluates the significance of transfers between levels based upon the nature of the investment and size of the transfer relative to total net position available for benefits. For the years ended June 30, 2017 and 2016, there were no transfers in or out of Levels 1, 2 or 3.

- 36 -
NOTE 6 - INVESTMENTS, AT FAIR VALUE (Continued) OPEB Plan
The following table sets forth by level, within the fair value hierarchy, the OPEB - Employee Disability Plan investments at fair value at June 30, 2017 consisted of:
Quoted Prices Significantin Active Other Significant
Total Markets for Observable Unobservable OPEB Identical Assets Inputs Inputs
6/30/2017 (Level 1) (Level 2) (Level 3)
Equity InvestmentsMutual Funds $ 874,981 $ 874,981 $ 0 $ 0
Interest-earning Investment Contracts 268,651 0 0 268,651
Total Investments by Fair Value Level 1,143,632 $ 874,981 $ 0 $ 268,651
Investments measured at the Net Asset Value (NAV)
Collective Investment Trusts 82,707
Total Investments Measured at the NAV 82,707
Total Investments Measured at Fair Value $ 1,226,339
Fair Value Measurements Using
Investments measured at the NAV at June 30, 2017 consisted of:
Unfunded Redemption RedemptionFair Value Commitments Frequency Notice Period
$ 82,707 $ 0 Daily 0 daysCollective Investment Trusts
The following table sets forth by level, within the fair value hierarchy, the OPEB - Employee Disability Plan investments at fair value at June 30, 2016 consisted of:
Quoted Prices Significantin Active Other Significant
Total Markets for Observable Unobservable OPEB Identical Assets Inputs Inputs
6/30/2016 (Level 1) (Level 2) (Level 3)Equity Investments
Mutual Funds $ 965,006 $ 965,006 $ 0 $ 0Interest-earning Investment Contracts 91,654 0 0 91,654
Total Investments by Fair Value Level 1,056,660 $ 965,006 $ 0 $ 91,654
Investments measured at the Net AssetValue (NAV)
Collective Investment Trusts 298,869
Total Investments Measured at the NAV 298,869
Total Investments Measured at Fair Value $ 1,355,529
Fair Value Measurements Using

- 37 -
NOTE 6 - INVESTMENTS, AT FAIR VALUE (Continued) OPEB Plan (Continued)
Investments measured at the NAV at June 30, 2016 consisted of:
Unfunded Redemption RedemptionFair Value Commitments Frequency Notice Period
Collective Investment Trusts $ 298,869 $ 0 Daily 0 days
Collective Investment Trusts. Invests primarily in high quality stable value investment contracts such as guaranteed investment contracts (GICs), synthetic GICs, and separate account contracts. fair values of the investments in this type have been determined using the NAV per share (or its equivalent) of the investments. Interest Rate Risk - Interest rate risk, in general, is the risk that the value of an investment will decline as interest rates rise. The Board has approved investment policies for the Defined Benefit and OPEB Plans which prohibits debt securities with maturities greater than 30 years and is expected to remain interest rate neutral relative to the asset class benchmark. Interest rate risk is disclosed in the preceding table. Credit Risk - Credit risk is the risk that the issuer, or other counterparty to an investment, will not fulfill its obligations. The Retirement Board’s investment policy requires that the fixed income portfolio maintain an aggregate “A” Standard & Poor’s credit rating.
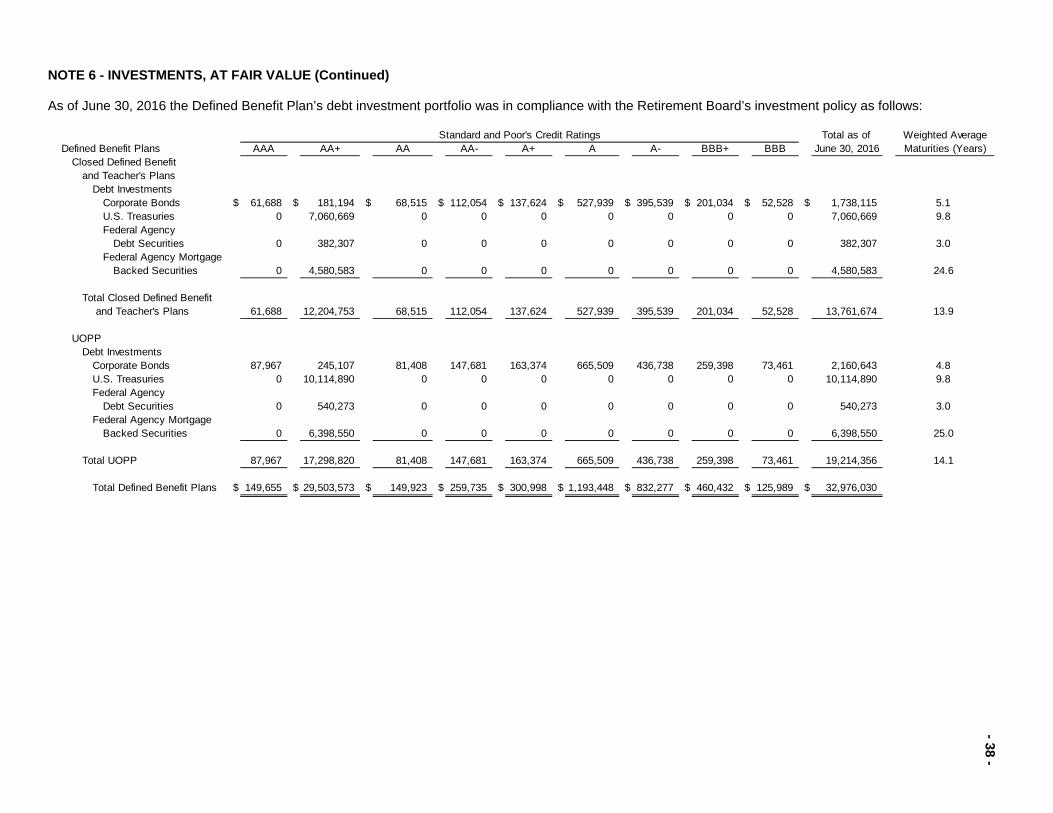
- 38 -
NOTE 6 - INVESTMENTS, AT FAIR VALUE (Continued) As of June 30, 2016 the Defined Benefit Plan’s debt investment portfolio was in compliance with the Retirement Board’s investment policy as follows:
Total as of Weighted AverageDefined Benefit Plans AAA AA+ AA AA- A+ A A- BBB+ BBB June 30, 2016 Maturities (Years)
Closed Defined Benefit and Teacher's Plans
Debt InvestmentsCorporate Bonds $ 61,688 $ 181,194 $ 68,515 $ 112,054 $ 137,624 $ 527,939 $ 395,539 $ 201,034 $ 52,528 $ 1,738,115 5.1U.S. Treasuries 0 7,060,669 0 0 0 0 0 0 0 7,060,669 9.8Federal Agency
Debt Securities 0 382,307 0 0 0 0 0 0 0 382,307 3.0Federal Agency Mortgage
Backed Securities 0 4,580,583 0 0 0 0 0 0 0 4,580,583 24.6
Total Closed Defined Benefit and Teacher's Plans 61,688 12,204,753 68,515 112,054 137,624 527,939 395,539 201,034 52,528 13,761,674 13.9
UOPP
Debt InvestmentsCorporate Bonds 87,967 245,107 81,408 147,681 163,374 665,509 436,738 259,398 73,461 2,160,643 4.8U.S. Treasuries 0 10,114,890 0 0 0 0 0 0 0 10,114,890 9.8Federal Agency
Debt Securities 0 540,273 0 0 0 0 0 0 0 540,273 3.0Federal Agency Mortgage
Backed Securities 0 6,398,550 0 0 0 0 0 0 0 6,398,550 25.0
Total UOPP 87,967 17,298,820 81,408 147,681 163,374 665,509 436,738 259,398 73,461 19,214,356 14.1
Total Defined Benefit Plans $ 149,655 $ 29,503,573 $ 149,923 $ 259,735 $ 300,998 $ 1,193,448 $ 832,277 $ 460,432 $ 125,989 $ 32,976,030
Standard and Poor's Credit Ratings

- 39 -
NOTE 6 - INVESTMENTS, AT FAIR VALUE (Continued) Defined Benefit and OPEB Plans (Continued) Concentration of Credit Risk - The Retirement Board has adopted investment policies that limit the System’s exposure to certain classes of investments. The policy requires each asset class to be broadly diversified. As of June 30, 2017, the Defined Benefit Plans' investment holdings, which include cash and other short-term investments, debt and mutual fund securities, and receivable for investments sold, were in compliance with the Retirement Board’s investment policy. The investment holdings at June 30, 2017 were as follows:
Fair Value Actual Minimum Maximum($ in thousands) Exposure Exposure Exposure
Investment Type U.S. Equities $ 26,984 27% 22% 33%Non - U.S. Equities 27,774 27% 22% 33%Core Fixed Income 15,498 15% 12% 18%High Yield Fixed Income 15,096 15% 12% 18%U.S. Treasury Inflation Protected Securities 4,165 4% 3% 7%Private Real Estate 8,006 8% 5% 9%U.S. Real Estate (REITS) 2,517 2% 1% 5%Short-Term and Cash and Cash Equivalents 1,634 2% 0% 5%
Total $ 101,674 100%
Investment Type U.S. Equities $ 50,353 30% 24.0% 36.0%Non - U.S. Equities 52,095 31% 24.0% 36.0%Core Fixed Income 18,991 11% 10.0% 16.0%High Yield Fixed Income 18,765 11% 9.0% 14.0%U.S. Treasury Inflation Protected Securities 7,422 4% 3.0% 7.0%Private Real Estate 13,688 8% 5.5% 9.5%U.S. Real Estate (REITS) 4,531 3% 1.0% 5.0%Short-Term and Cash and Cash Equivalents 3,109 2% 0.0% 5.0%
Total $ 168,954 100%
Closed Defined Benefit& Teacher's Plans
UOPP
For the OPEB - Employee Disability Plan, the Retirement Board has established one investment option for the plan that consists of 10% conservative, 45% moderate, and 45% ultra-aggressive investment styles.

- 40 -
NOTE 6 - INVESTMENTS, AT FAIR VALUE (Continued) Defined Benefit and OPEB Plans (Continued) As of June 30, 2016 the Defined Benefit Plans' investment holdings, which include debt and mutual fund securities, were in compliance with the Retirement Board’s investment policy. REITS reflected a temporary variance due to market activity. The investment holdings at June 30, 2016 and were as follows:
Fair Value Actual Minimum Maximum($ in thousands) Exposure Exposure Exposure
Investment Type: U.S. Equities $ 27,222 27% 20% 28%Non - U.S. Equities 28,976 29% 29% 39%Core Fixed Income 13,761 14% 10% 14%High Yield Fixed Income 12,055 12% 8% 12%U.S. Treasury Inflation Protected Securities 5,178 5% 3% 7%Private Real Estate 7,504 7% 3% 7%U.S. Real Estate (REITS) 5,705 6% 8% 12%Short-Term and Cash and Cash Equivalents 154 0% 0% 5%
Total $ 100,555 100%
Investment Type: U.S. Equities $ 42,897 28% 20.0% 28.0%Non - U.S. Equities 43,785 29% 28.0% 38.0%Core Fixed Income 19,214 13% 11.0% 15.0%High Yield Fixed Income 14,789 10% 8.0% 12.0%U.S. Treasury Inflation Protected Securities 6,966 5% 3.0% 7.0%Private Real Estate 12,828 8% 5.5% 9.5%U.S. Real Estate (REITS) 8,988 6% 5.5% 9.5%Short-Term and Cash and Cash Equivalents 1,940 1% 0.0% 5.0%
Total $ 151,407 100%
Closed Defined Benefit& Teacher's Plans
UOPP
For the OPEB - Employee Disability Plan, the Retirement Board has established one investment option for plan participant’s that consists of 10% conservative, 45% moderate, and 45% ultra-aggressive investment styles. Rates of Return - The annual money-weighted rates of returns on defined benefit pension plan investments, net of investment expenses for the years ended June 30, 2017 and 2016 were as follows:
2017 2016Defined Benefit Plans:
Closed Defined Benefit Plan 11.98 % -0.90 %Teacher's Plan 12.24 -0.70UOPP 12.92 -0.14OPEB Plan 4.46 N/A
The money-weighted rate of return expresses investment performance, net of investment expense, adjusted for the changing amount actually invested.

- 41 -
NOTE 6 - INVESTMENTS, AT FAIR VALUE (Continued) Defined Benefit and OPEB Plans (Continued) Foreign Currency Risk - Foreign currency risk is a form of financial risk that arises from the potential change in the exchange of one currency against another. All investments of the Defined Benefit and OPEB Plans are denominated in U.S. dollars. The non-U.S. equity composite is expected to be fully invested at all times. Cash equivalent exposure will be minimized and limited to 5%. Both developed and emerging market exposure will be used to implement the non-U.S. equity strategy. The investment structure of the non-U.S. equity composite has been developed to mimic the overall profile of the non-U.S. equity market. Approximately 75% to 85% of the non-U.S. equity composite is required to be invested in developed markets while 15% to 20% is expected to be invested in emerging markets. Custodial Credit Risk - Deposits - The Retirement Board’s investment policy requires that investment securities be registered in the name of the System and that investments are held in accounts under trust. In the case of bank deposits (cash and cash equivalents), this is the risk that in the event of a bank failure, the Plan’s deposits may not be returned to it. The State Street Global Advisors (SSGA) Short Term Investment Fund (STIF) is used as the default short-term account from which receipts and disbursements flow through the custodian. The fund seeks to provide safety of principal and daily liquidity. The fund is not a money market fund registered with the Securities and Exchange Commission, and is not subject to various rules and limitations that apply to such funds. There can be no assurance that the Fund will maintain a stable net asset value. Defined Contribution Plans The following table sets forth by level, within the fair value hierarchy, the Defined contribution plans' investments at fair value as of June 30, 2017 consisted of:
Quoted Prices Significantin Active Other Significant
Total Defined Markets for Observable Unobservable Contribution Plans Identical Assets Inputs Inputs
6/30/2017 (Level 1) (Level 2) (Level 3)Equity Investments
Mutual Funds $ 248,704,291 $ 248,704,291 $ 0 $ 0Interest-Earning Investment Contracts 53,442,677 0 0 53,442,677
Total Investments by Fair Value Level 302,146,968 $ 248,704,291 $ 0 $ 53,442,677
Investments measured at the Net Asset Value (NAV)
Collective Investment Trusts 10,585,055
Total Investments Measured at the NAV 10,585,055
Total Investments Measured at Fair Value $ 312,732,023
Fair Value Measurements Using
Investments measured at the NAV at June 30, 2017 consisted of:
Unfunded Redemption RedemptionFair Value Commitments Frequency Notice Period
Collective Investment Trusts $ 10,585,055 $ 0 Daily 12 Months

- 42 -
NOTE 6 - INVESTMENTS, AT FAIR VALUE (Continued) Defined Contribution Plans (Continued) The following table sets forth by level, within the fair value hierarchy, the Defined contribution plans' investments at fair value as of June 30, 2016 consisted of:
Quoted Prices SignificantTotal Defined in Active Other SignificantContribution Markets for Observable Unobservable
Plans Identical Assets Inputs InputsJune 30, 2016 (Level 1) (Level 2) (Level 3)
Equity InvestmentsMutual Funds $ 231,106,980 $ 231,106,980 $ 0 $ 0
Interest-earning Investment Contracts 23,935,524 0 0 23,935,524
Total Investments by Fair Value Level 255,042,504 $ 231,106,980 $ 0 $ 23,935,524
Investments measured at the Net Asset Value (NAV)
Collective Investment Trusts 37,041,413
Total Investments Measured at the NAV 37,041,413
Total Investments Measured at Fair Value $ 292,083,917
Fair Value Measurements Using
Investments measured at the NAV at June 30, 2016 consisted of:
Unfunded Redemption RedemptionFair Value Commitments Frequency Notice Period
Collective Investment Trusts $ 37,041,413 $ 0 Daily 12 months
Collective Investment Trusts. Invests primarily in high quality stable value investment contracts such as guaranteed investment contracts (GICs), synthetic GICs, and separate account contracts. fair values of the investments in this type have been determined using the NAV per share (or its equivalent) of the investments. Concentration of Credit Risk - For the Asset Accumulation, Voluntary 457 and STAR Plans the employee deferral and employer matching contributions are participant directed into a variety of investment choices that are measured against various market benchmarks such as the S&P 500, Russell 2000, etc. The Retirement Board monitors the Plans individual fund’s investment performances to determine if the individual fund’s results are above the 50th percentile as compared to its peers as measured against the relevant market benchmarks. For the years ended June 30, 2017 and 2016, the Retirement Board has established for the MERP and STAR’s 2% employer supplemental matching contribution, one investment option for plan participant’s that consists of 10% conservative, 45% moderate, and 45% ultra-aggressive investment styles.

- 43 -
NOTE 6 - INVESTMENTS, AT FAIR VALUE (Continued) Defined Contribution Plans (Continued)
Concentration of Credit Risk (Continued)
The following individual investments represent 5% or more of each Defined Contribution Plan’s total investments at June 30, 2017 and 2016:
Asset Accumulation Voluntary
Plan 457 Plan MERP STAR Total
Interest-Earning Investment Contracts:TransAmerica Life Insurance Company $ 50,028,533 $ 2,412,569 $ 385,992 $ 615,583 $ 53,442,677
Percentage of Total Investments 16.5% 12.1% 6.8% 26.4% 16.1%
Interest-Earning Investment Contracts:TransAmerica Life Insurance Company $ 22,709,536 $ 849,421 $ 345,153 $ 31,414 $ 23,935,524
Percentage of Total Investments 8.4% 5.3% 6.8% 2.6% 8.2%
2017
2016
Foreign Currency Risk - Foreign currency risk is a form of financial risk that arises from the potential change in the exchange of one currency against another. All investments of the Defined Contribution Plans are denominated in U.S. dollars. The Plans various funds invest in non-U.S. bonds and equities in varying degrees. These funds invest in international developed and emerging markets. Custodial Credit Risk - Deposits - The Retirement Board’s investment policy requires that investment securities be registered in the name of the System and that investments are held in accounts under trust. In the case of bank deposits (cash and cash equivalents), this is the risk that in the event of a bank failure, the Plan’s deposits may not be returned to it. NOTE 7 - GUARANTEED INVESTMENT CONTRACT The Standard Stable Asset Funds are group annuity contracts that offer full guarantees on principal and interest by the Standard Insurance Company (Issuer). The contracts are fully benefit-responsive. The Funds qualify as fully benefit-responsive investment contracts because they meet all of the following criteria:
a. The investment contracts are effected directly between the Funds and the Issuer and prohibits the Funds from assigning or selling the contracts or their proceeds to another party without the consent of the Issuer.
b. The contract Issuer is obligated to (i) repay principal and interest, or (ii) apply prospective crediting rate adjustments with an assurance the crediting rates will not be less than zero.
c. The terms of the investment contracts require all permitted participant-initiated transactions with the Funds to occur at contract value with no conditions, limits or restrictions. Permitted participant-initiated transactions are those transactions allowed by the underlying defined-contribution plans, such as withdrawals for benefits, loans or transfers to other funds within the Plans.
d. An event that limits the ability of the Funds to transact at contract value with the Issuer (for example, premature termination of contracts by the Funds, plan termination, bankruptcy and early retirement incentives) and that also limits the ability of the Funds to transact at contract value with the participants in the Funds must be probable of not occurring.
e. The Funds themselves must allow participants reasonable access to their funds. Investment contracts held in the Funds are recorded at their contract value. The Plans own a promise to pay interest at crediting rates which are announced in advance and guaranteed for a specified period of time as outlined in the group annuity contracts. Contract value represents deposits made to the contracts, plus earnings at guaranteed crediting rates, less withdrawals and fees.
- 44 -
NOTE 7 - GUARANTEED INVESTMENT CONTRACT (Continued) Certain events may limit the ability of the Plans to transact at contract value. Such events include termination of the contract, layoffs, partial or total plan termination, retirement incentive programs, and the liberalization of plan withdrawal or transfer rules. Upon occurrence of any of these events, a market value adjustment or withdrawal restrictions may apply. The Plan Sponsor may choose to pay the market value adjustment directly, if applicable, so that participants’ contract values are not affected. The Issuer may terminate the contract with 30 days advance written notice to the contract owner for reasonable cause, including the contract owner’s failure to abide by state or federal law, failure to render performance necessary to comply with the terms of the contract, layoffs, plan disqualification or failure to adopt the Plan in a reasonable period of time. Upon termination by the Issuer, a market value adjustment or withdrawal restrictions may apply. The Plan Sponsor may choose to pay the market value adjustment directly, if applicable, so that participants’ contract values are not affected. The Plan Sponsor was not aware of any events that would have limited the Plan to transact at contract value as of June 30, 2017. NOTE 8 - TRANSFERS BETWEEN PLANS During the year ended June 30, 2017, the System made a transfer of $35,224 from the Closed Defined Benefit Plan to the Asset Accumulation Plan for disabled participants who formerly participated in the Closed Defined Benefit Plan. The System also made several transfers for a total of $622,890 from the Asset Accumulation, 457 and STAR Plan’s forfeiture accounts to fund the OPEB - Employee Disability Plan. In 2017 and 2016, forfeitures were transferred into the Disability Plan to cover the expenses incurred for all plans. During the year ended June 30, 2016, the System made a transfer of $38,696 from the Closed Defined Benefit Plan to the Asset Accumulation Plan for disabled participants who formerly participated in the Closed Defined Benefit Plan. The System also made several transfers for a total of $653,098 from the Asset Accumulation, MERP and STAR Plan’s forfeiture accounts to fund the OPEB – Employee Disability Plan. NOTE 9 - RELATED PARTY TRANSACTIONS Certain defined benefit plans' cash and cash equivalents and investments are with State Street Bank and Trust Company, or its affiliated entities. State Street Bank and Trust Company is the investment trustee and custodian and, therefore, these investments qualify as related party transactions. The amount of these investments at June 30, 2017 and 2016 were $98,149,381 and $86,748,533, respectively. Certain defined contributions plans' investments are with Wells Fargo, or its affiliated entities. Wells Fargo is the investment trustee and custodian and, therefore, these investments qualify as related party transactions. The amount of these investments at June 30, 2017 and 2016 were $1,508,062 and $995,553, respectively. NOTE 10 - PLANS TAX STATUS The Internal Revenue Service (IRS) has determined and informed the Retirement Board that the Plans are documented in accordance with the applicable sections of the Internal Revenue Code (IRC). On August 25, 2014, the Retirement Board received an IRS determination letter for the OPEB – Employee Disability Plan. On October 16, 2014, the Retirement Board received IRS determination letters for the Closed Defined Benefit Plan, Teacher’s Plan, UOPP, STAR and MERP plans. On December 8, 2014, the Retirement Board received an IRS determination letter for the Asset Accumulation Plan. The Plans have been amended since receiving those determination letters. However, the Executive Director and the System’s legal counsel believe that the Plans are currently being operated in compliance with the applicable requirements of the IRC. Therefore, no provision for income taxes has been included in the Plans' financial statements. The Plans are subject to audits by taxing authorities. However, as of June 30, 2017 and 2016 there are currently no audits for any periods in progress.

- 45 -
NOTE 11 - DEFINED CONTRIBUTION RETIREMENT AND BENEFIT PLANS The Retirement Board offers to its employee’s participation in three different defined contribution retirement plans, that cover certain full-time employees, which includes the Knox County Asset Accumulation Plan, Voluntary 457 Plan, Medical Expense Retirement Plan and OPEB - Employee Disability Plan. For a description of these Plans see Note 1. During the year ended June 30, 2017, the Retirement Board’s employer matching contributions to these Plans was $43,888 and the employee contributions were $61,903. During the year ended June 30, 2016, the Retirement Board’s employer matching contributions to these Plans was $41,613 and the employee contributions were $52,137 NOTE 12 - RISKS AND UNCERTAINTIES Defined Benefit and OPEB Plans
Investment securities in general, are subject to various risks, such as interest rate, credit and overall market volatility. Due to the levels of risk associated with certain investment securities, it is possible that changes in the defined benefit plans’ values of investment securities could occur and that such changes could materially affect the amounts reported in the Statements of Fiduciary Net Position. Employer contributions could be expected to change as well. Defined benefit plan contributions are made and the actuarial present value of accumulated plan benefits are reported based on certain assumptions pertaining to interest rates, inflation rates and employee demographics, all of which are subject to change. Due to uncertainties inherent in the estimations and assumptions process, it is at least reasonably possible that changes in these estimates and assumptions in the near term could be material to the financial statements. Defined Contribution Plans
The defined contribution plans provide for various investment options. Investment securities are exposed to various risks, such as interest rate, market and credit risk. Due to the level of risk associated with certain investment securities and the level of uncertainty related to changes in the value of investment securities, it is at least reasonably possible that changes in risks in the near term would materially affect participant’s account balances and the amounts reported in the Statements of Fiduciary Net Position and the Statements of Changes in Fiduciary Net Position. NOTE 13 - CORRECTIVE DISTRIBUTIONS A line for corrective distributions is included within the Statement of Changes in Fiduciary Net Position. This balance is made up of two items – (1) a payment of a balance owed by a former participant to Knox County following a court order regarding a fraudulent pay scheme ($206,165), and (2) participants who were inadvertently allowed to participant in the Asset Accumulation Plan (AAP) instead of the Tennessee Consolidated Retirement System (TCRS). The Asset Accumulation Plan allows for employees of Knox County Schools who are not a certificated employee (teacher) or employees participating in the TCRS Plan to participate in the Plan. It was noted in a previous year that certain participants included in the Asset Accumulation Plan should have been included within the TCRS Plan instead. These participants balances totaling $469,652, including earnings, were distributed out of the AAP and into the TCRS Plan within the year under audit. NOTE 14 - CONTINGENCY/ SUBSEQUENT EVENT On November 22, 2017, the Knox County Law Director filed suit against the Knox County Retirement and Pension Board and System asserting discrepancies in the administration of the Uniform Officers Pension Plan (UOPP) compared to the Knox County Charter. The treatment of accrued leave in the calculation of retirement benefits under the UOPP Plan is contested by the County. The lawsuit is in the initial discovery stage. The System will defend its position. The impact of the lawsuit on benefit payments of the UOPP Plan is not known at this stage. However, it is the opinion of management that the disposition or ultimate resolution of any claims will not have a material adverse effect on the financial position of the System.
REQUIRED SUPPLEMENTARY INFORMATION SECTION
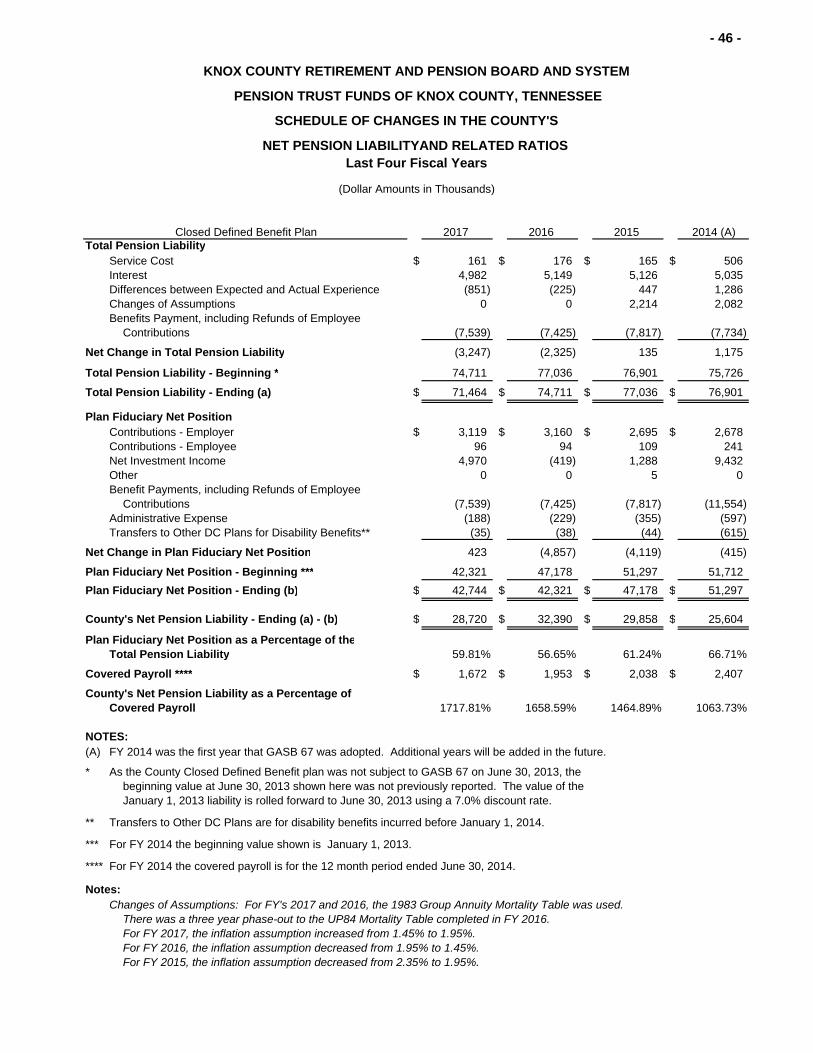
- 46 -
2017 2016 2015 2014 (A)Total Pension Liability
Service Cost $ 161 $ 176 $ 165 $ 506Interest 4,982 5,149 5,126 5,035Differences between Expected and Actual Experience (851) (225) 447 1,286Changes of Assumptions 0 0 2,214 2,082Benefits Payment, including Refunds of Employee
Contributions (7,539) (7,425) (7,817) (7,734)
Net Change in Total Pension Liability (3,247) (2,325) 135 1,175
Total Pension Liability - Beginning * 74,711 77,036 76,901 75,726
Total Pension Liability - Ending (a) $ 71,464 $ 74,711 $ 77,036 $ 76,901
Plan Fiduciary Net PositionContributions - Employer $ 3,119 $ 3,160 $ 2,695 $ 2,678Contributions - Employee 96 94 109 241Net Investment Income 4,970 (419) 1,288 9,432Other 0 0 5 0Benefit Payments, including Refunds of Employee
Contributions (7,539) (7,425) (7,817) (11,554)Administrative Expense (188) (229) (355) (597)Transfers to Other DC Plans for Disability Benefits** (35) (38) (44) (615)
Net Change in Plan Fiduciary Net Position 423 (4,857) (4,119) (415)
Plan Fiduciary Net Position - Beginning *** 42,321 47,178 51,297 51,712
Plan Fiduciary Net Position - Ending (b) $ 42,744 $ 42,321 $ 47,178 $ 51,297
County's Net Pension Liability - Ending (a) - (b) $ 28,720 $ 32,390 $ 29,858 $ 25,604
Plan Fiduciary Net Position as a Percentage of theTotal Pension Liability 59.81% 56.65% 61.24% 66.71%
Covered Payroll **** $ 1,672 $ 1,953 $ 2,038 $ 2,407
County's Net Pension Liability as a Percentage of Covered Payroll 1717.81% 1658.59% 1464.89% 1063.73%
NOTES: (A) FY 2014 was the first year that GASB 67 was adopted. Additional years will be added in the future.
* As the County Closed Defined Benefit plan was not subject to GASB 67 on June 30, 2013, the beginning value at June 30, 2013 shown here was not previously reported. The value of theJanuary 1, 2013 liability is rolled forward to June 30, 2013 using a 7.0% discount rate.
** Transfers to Other DC Plans are for disability benefits incurred before January 1, 2014.
*** For FY 2014 the beginning value shown is January 1, 2013.
**** For FY 2014 the covered payroll is for the 12 month period ended June 30, 2014.
Notes:Changes of Assumptions: For FY's 2017 and 2016, the 1983 Group Annuity Mortality Table was used.
There was a three year phase-out to the UP84 Mortality Table completed in FY 2016.For FY 2017, the inflation assumption increased from 1.45% to 1.95%.For FY 2016, the inflation assumption decreased from 1.95% to 1.45%.For FY 2015, the inflation assumption decreased from 2.35% to 1.95%.
PENSION TRUST FUNDS OF KNOX COUNTY, TENNESSEE
KNOX COUNTY RETIREMENT AND PENSION BOARD AND SYSTEM
Closed Defined Benefit Plan
SCHEDULE OF CHANGES IN THE COUNTY'S
NET PENSION LIABILITYAND RELATED RATIOS Last Four Fiscal Years
(Dollar Amounts in Thousands)
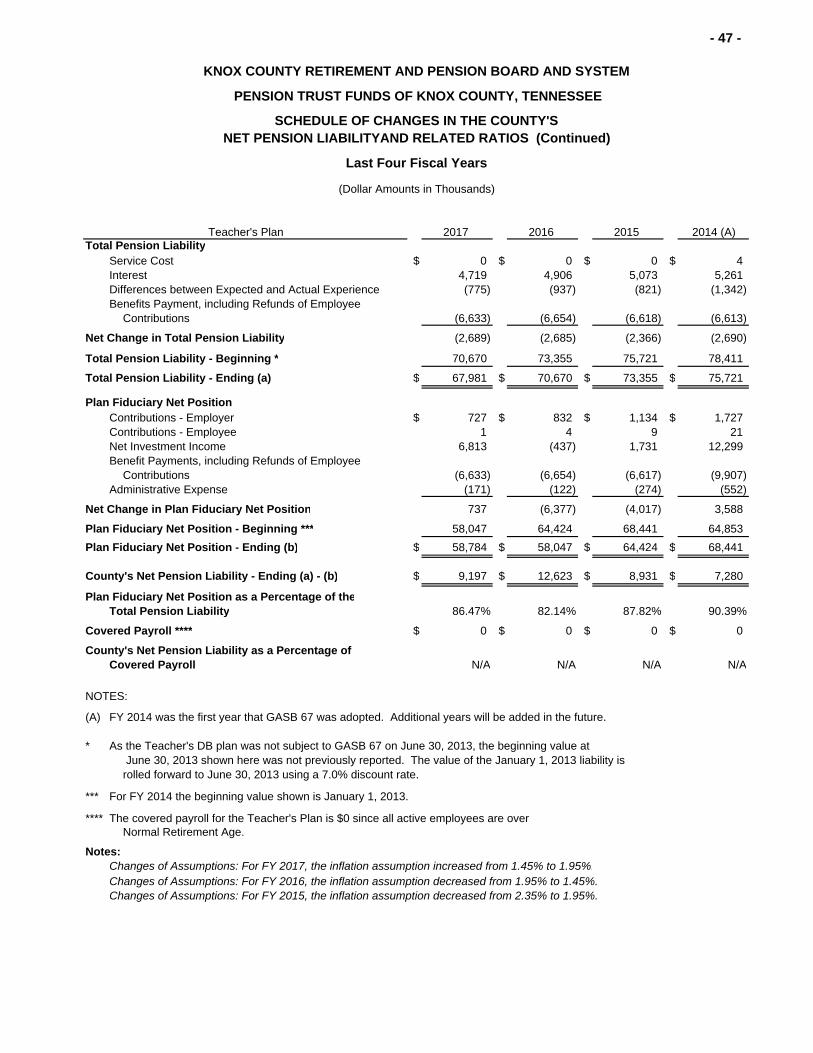
- 47 -
2017 2016 2015 2014 (A)Total Pension Liability
Service Cost $ 0 $ 0 $ 0 $ 4Interest 4,719 4,906 5,073 5,261Differences between Expected and Actual Experience (775) (937) (821) (1,342)Benefits Payment, including Refunds of Employee
Contributions (6,633) (6,654) (6,618) (6,613)
Net Change in Total Pension Liability (2,689) (2,685) (2,366) (2,690)
Total Pension Liability - Beginning * 70,670 73,355 75,721 78,411
Total Pension Liability - Ending (a) $ 67,981 $ 70,670 $ 73,355 $ 75,721
Plan Fiduciary Net PositionContributions - Employer $ 727 $ 832 $ 1,134 $ 1,727Contributions - Employee 1 4 9 21Net Investment Income 6,813 (437) 1,731 12,299Benefit Payments, including Refunds of Employee
Contributions (6,633) (6,654) (6,617) (9,907)Administrative Expense (171) (122) (274) (552)
Net Change in Plan Fiduciary Net Position 737 (6,377) (4,017) 3,588
Plan Fiduciary Net Position - Beginning *** 58,047 64,424 68,441 64,853
Plan Fiduciary Net Position - Ending (b) $ 58,784 $ 58,047 $ 64,424 $ 68,441
County's Net Pension Liability - Ending (a) - (b) $ 9,197 $ 12,623 $ 8,931 $ 7,280
Plan Fiduciary Net Position as a Percentage of theTotal Pension Liability 86.47% 82.14% 87.82% 90.39%
Covered Payroll **** $ 0 $ 0 $ 0 $ 0
County's Net Pension Liability as a Percentage of Covered Payroll N/A N/A N/A N/A
NOTES:
(A) FY 2014 was the first year that GASB 67 was adopted. Additional years will be added in the future.
* As the Teacher's DB plan was not subject to GASB 67 on June 30, 2013, the beginning value at June 30, 2013 shown here was not previously reported. The value of the January 1, 2013 liability is rolled forward to June 30, 2013 using a 7.0% discount rate.
*** For FY 2014 the beginning value shown is January 1, 2013.
**** The covered payroll for the Teacher's Plan is $0 since all active employees are over Normal Retirement Age.
Notes:Changes of Assumptions: For FY 2017, the inflation assumption increased from 1.45% to 1.95%.Changes of Assumptions: For FY 2016, the inflation assumption decreased from 1.95% to 1.45%.Changes of Assumptions: For FY 2015, the inflation assumption decreased from 2.35% to 1.95%.
Teacher's Plan
(Dollar Amounts in Thousands)
KNOX COUNTY RETIREMENT AND PENSION BOARD AND SYSTEM
PENSION TRUST FUNDS OF KNOX COUNTY, TENNESSEE
SCHEDULE OF CHANGES IN THE COUNTY'SNET PENSION LIABILITYAND RELATED RATIOS (Continued)
Last Four Fiscal Years
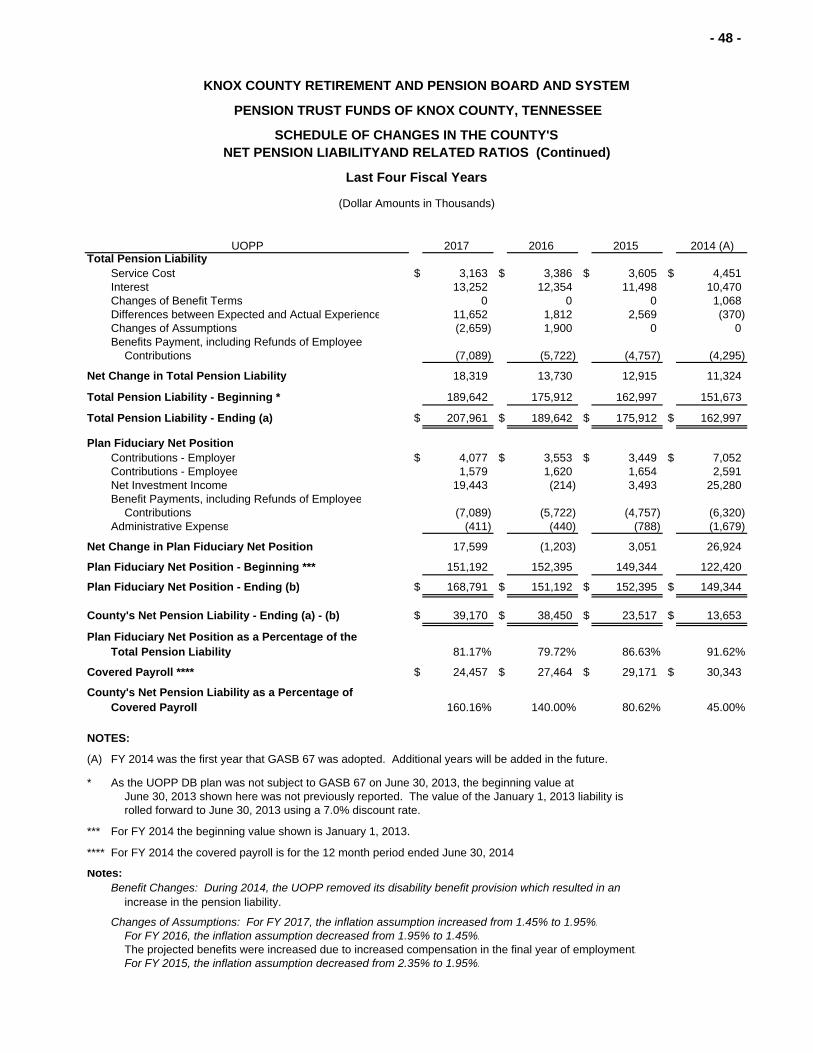
- 48 -
2017 2016 2015 2014 (A)Total Pension Liability
Service Cost $ 3,163 $ 3,386 $ 3,605 $ 4,451Interest 13,252 12,354 11,498 10,470Changes of Benefit Terms 0 0 0 1,068Differences between Expected and Actual Experience 11,652 1,812 2,569 (370)Changes of Assumptions (2,659) 1,900 0 0Benefits Payment, including Refunds of Employee
Contributions (7,089) (5,722) (4,757) (4,295)
Net Change in Total Pension Liability 18,319 13,730 12,915 11,324
Total Pension Liability - Beginning * 189,642 175,912 162,997 151,673
Total Pension Liability - Ending (a) $ 207,961 $ 189,642 $ 175,912 $ 162,997
Plan Fiduciary Net PositionContributions - Employer $ 4,077 $ 3,553 $ 3,449 $ 7,052Contributions - Employee 1,579 1,620 1,654 2,591Net Investment Income 19,443 (214) 3,493 25,280Benefit Payments, including Refunds of Employee
Contributions (7,089) (5,722) (4,757) (6,320)Administrative Expense (411) (440) (788) (1,679)
Net Change in Plan Fiduciary Net Position 17,599 (1,203) 3,051 26,924
Plan Fiduciary Net Position - Beginning *** 151,192 152,395 149,344 122,420
Plan Fiduciary Net Position - Ending (b) $ 168,791 $ 151,192 $ 152,395 $ 149,344
County's Net Pension Liability - Ending (a) - (b) $ 39,170 $ 38,450 $ 23,517 $ 13,653
Plan Fiduciary Net Position as a Percentage of theTotal Pension Liability 81.17% 79.72% 86.63% 91.62%
Covered Payroll **** $ 24,457 $ 27,464 $ 29,171 $ 30,343
County's Net Pension Liability as a Percentage of Covered Payroll 160.16% 140.00% 80.62% 45.00%
NOTES:
(A) FY 2014 was the first year that GASB 67 was adopted. Additional years will be added in the future.
* As the UOPP DB plan was not subject to GASB 67 on June 30, 2013, the beginning value at June 30, 2013 shown here was not previously reported. The value of the January 1, 2013 liability is rolled forward to June 30, 2013 using a 7.0% discount rate.
*** For FY 2014 the beginning value shown is January 1, 2013.
**** For FY 2014 the covered payroll is for the 12 month period ended June 30, 2014.
Notes:Benefit Changes: During 2014, the UOPP removed its disability benefit provision which resulted in an
Changes of Assumptions: For FY 2017, the inflation assumption increased from 1.45% to 1.95%.For FY 2016, the inflation assumption decreased from 1.95% to 1.45%.The projected benefits were increased due to increased compensation in the final year of employment.For FY 2015, the inflation assumption decreased from 2.35% to 1.95%.
increase in the pension liability.
UOPP
(Dollar Amounts in Thousands)
KNOX COUNTY RETIREMENT AND PENSION BOARD AND SYSTEM
PENSION TRUST FUNDS OF KNOX COUNTY, TENNESSEE
SCHEDULE OF CHANGES IN THE COUNTY'SNET PENSION LIABILITYAND RELATED RATIOS (Continued)
Last Four Fiscal Years

- 49 -
KNOX COUNTY RETIREMENT AND PENSION BOARD AND SYSTEM
PENSION TRUST FUNDS OF KNOX COUNTY, TENNESSEE
SCHEDULE OF COUNTY’S PENSION CONTRIBUTIONS
Last Four Fiscal Years
(Dollar Amounts in Thousands)
2017 (C) 2016 (C) 2015 2014 (A)
Actuarially Determined Contribution (ADC) $ 3,119 $ 3,111 $ 2,660 $ 2,468Contributions in Relation to the Actuarially Determined
Contribution* 3,119 3,160 2,695 2,678
Contribution Deficiency (Excess) $ 0 $ (49) $ (35) $ (210)
Covered Payroll** $ 1,672 $ 1,953 $ 2,038 $ 2,407
Contributions as a Percentage of Covered Payroll 186.55% 161.80% 132.24% 111.26%
NOTES:* For FY 2014 contributions made are for the 18 month period from January 1, 2013 to June 30, 2014.** For FY 2014 covered payroll is for the 12 month period ended June 30, 2014.
A. FY 2014 was the first year that GASB 67 was adopted. Additional years will be added in the future.
B. Due to Pension Board changing its Plans' year end to June 30, the contributions made in FY 2014 are for the18-month period ended June 30, 2014.
C. Valuation Dates: January 1, 2017 and 2016
Measurement Dates: June 30, 2017 and 2016
Actuarial determined contribution rates are calculated as of June 30, one year prior to the end of the fiscal year in which contributions are reported.
Methods and Assumptions used to Determine Contribution Rates:
Actuarial Cost Method Individual Entry Age, Normal Cost
Amortization Method Level Percentage of Payroll, Closed
Remaining Amortization Period 16 Years
Asset Valuation Method Greater of the (a) five year moving market average,or (b) 90% of fair value of investment at year-end.
Inflation 1.95%
Salary 3.00%, Average, including inflation
Investment Rate of Return 7%, Net of Pension Plan Investment Expense, including inflation
Retirement Age 65 Years
Mortality 1983 Group Annuity (Male and Female)
Closed Defined Benefit Plan

- 50 -
KNOX COUNTY RETIREMENT AND PENSION BOARD AND SYSTEM
PENSION TRUST FUNDS OF KNOX COUNTY, TENNESSEE
SCHEDULE OF COUNTY’S PENSION CONTRIBUTIONS (Continued)
Last Four Fiscal Years
(Dollar Amounts in Thousands) 2017 (C) 2016 (C) 2015 2014 (A)
Actuarially Determined Contribution (ADC) $ 727 $ 832 $ 1,134 $ 1,727Contributions in Relation to the Actuarially Determined
Contribution* 727 832 1,134 1,727
Contribution Deficiency (Excess) $ 0 $ 0 $ 0 $ 0
Covered Payroll** $ 0 $ 0 $ 0 $ 0
Contributions as a Percentage of Covered Payroll N/A N/A N/A N/A
NOTES:* For 2014 contributions made are for the 18 month period from January 1, 2013 to June 30, 2014.** The covered payroll for the Teacher's plan is $0 since all active employees are over the Normal
Retirement Age.
A. FY 2014 was the first year that GASB 67 was adopted. Additional years will be added in the future.
B. Due to Pension Board changing its Plans' year end to June 30, the contributions made in FY 2014 are for the 18-month period ended June 30, 2014.
C. Valuation Dates: January 1, 2017 and 2016
Measurement Dates: June 30, 2017 and 2016
Actuarial determined contribution rates are calculated as of June 30, one year prior to the end of the fiscal year in which contributions are reported.
Methods and Assumptions used to Determine Contribution Rates:
Actuarial Cost Method Individual Entry Age, Normal Cost
Amortization Method Level Percentage of Payroll, Closed
Remaining Amortization Period 16 Years
Asset Valuation Method Greater of the (a) five year moving market average,or (b) 90% of fair value of investment at year-end.
Inflation 1.95%
Salary 3.00%, Average, including inflation
Investment Rate of Return 7%, Net of Pension Plan Investment Expense, including inflation
Retirement Age 60 Years
Mortality 1983 Group Annuity (Male and Female)
Teacher's Plan

- 51 -
KNOX COUNTY RETIREMENT AND PENSION BOARD AND SYSTEM
PENSION TRUST FUNDS OF KNOX COUNTY, TENNESSEE
SCHEDULE OF COUNTY’S PENSION CONTRIBUTIONS (Continued)
Last Four Fiscal Years
(Dollar Amounts in Thousands) 2017 (C) 2016 (C) 2015 2014 (A)
Actuarially Determined Contribution (ADC) $ 4,077 $ 3,547 $ 3,434 $ 4,484Contributions in Relation to the Actuarially Determined
Contribution* 4,077 3,553 3,449 7,052
Contribution Deficiency (Excess) $ 0 $ (6) $ (15) $ (2,568)
Covered Payroll** $ 24,457 $ 27,464 $ 29,171 $ 30,343
Contributions as a Percentage of Covered Payroll 16.67% 12.94% 11.82% 23.24%
NOTES:* For FY 2014 contributions made are for the 18 month period from January 1, 2013 to June 30, 2014.** For FY 2014 covered payroll is for the 12 month period ended June 30, 2014.
A. FY 2014 was the first year that GASB 67 was adopted. Additional years will be added in the future.
B. Due to Pension Board changing its Plans' year end to June 30, the contributions made in FY 2014 are for the 18-month period ended June 30, 2014.
C. Valuation Dates: January 1, 2017 and 2016
Measurement Dates: June 30, 2017 and 2016
Actuarial determined contribution rates are calculated as of June 30, one year prior to the end of the fiscal year in which contributions are reported.
Methods and Assumptions used to Determine Contribution Rates:
Actuarial Cost Method Individual Entry Age, Normal Cost
Amortization Method Level Percentage of Payroll, Closed
Remaining Amortization Period 26 Years
Asset Valuation Method Greater of the (a) five year moving market average, or (b) 80% of fair value of investment at year-end.
Inflation 1.95%
Salary 3.00%, Average, including inflation
Investment Rate of Return 7%, Net of Pension Plan Investment Expense, including inflation
Retirement Age Participants hired before age 40: age 57 and 30 years of credited service.Participants hired after age 40: age 50 and 25 years of credited service.
Mortality 1984 Unisex
UOPP
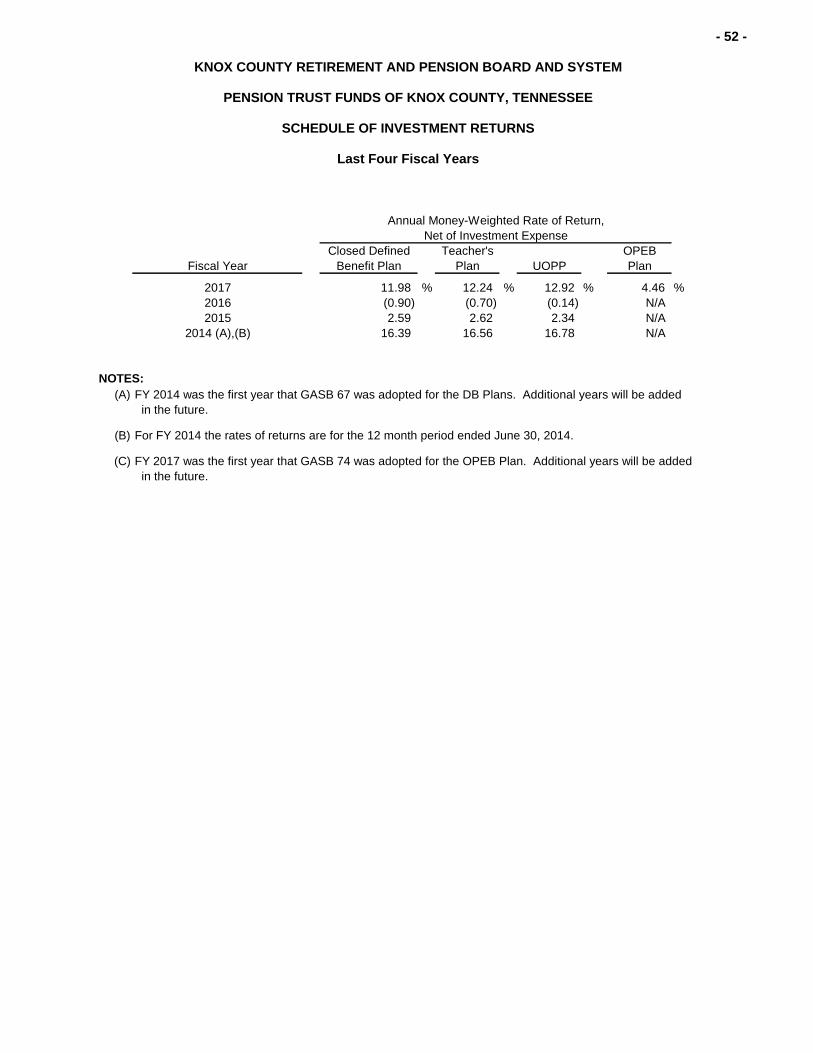
- 52 -
KNOX COUNTY RETIREMENT AND PENSION BOARD AND SYSTEM
PENSION TRUST FUNDS OF KNOX COUNTY, TENNESSEE
SCHEDULE OF INVESTMENT RETURNS
Last Four Fiscal Years
Closed Defined Teacher's OPEBFiscal Year Benefit Plan Plan UOPP Plan
2017 11.98 % 12.24 % 12.92 % 4.46 %2016 (0.90) (0.70) (0.14) N/A 2015 2.59 2.62 2.34 N/A
2014 (A),(B) 16.39 16.56 16.78 N/A
NOTES:(A) FY 2014 was the first year that GASB 67 was adopted for the DB Plans. Additional years will be added
in the future.
(B) For FY 2014 the rates of returns are for the 12 month period ended June 30, 2014.
(C) FY 2017 was the first year that GASB 74 was adopted for the OPEB Plan. Additional years will be added in the future.
Net of Investment ExpenseAnnual Money-Weighted Rate of Return,
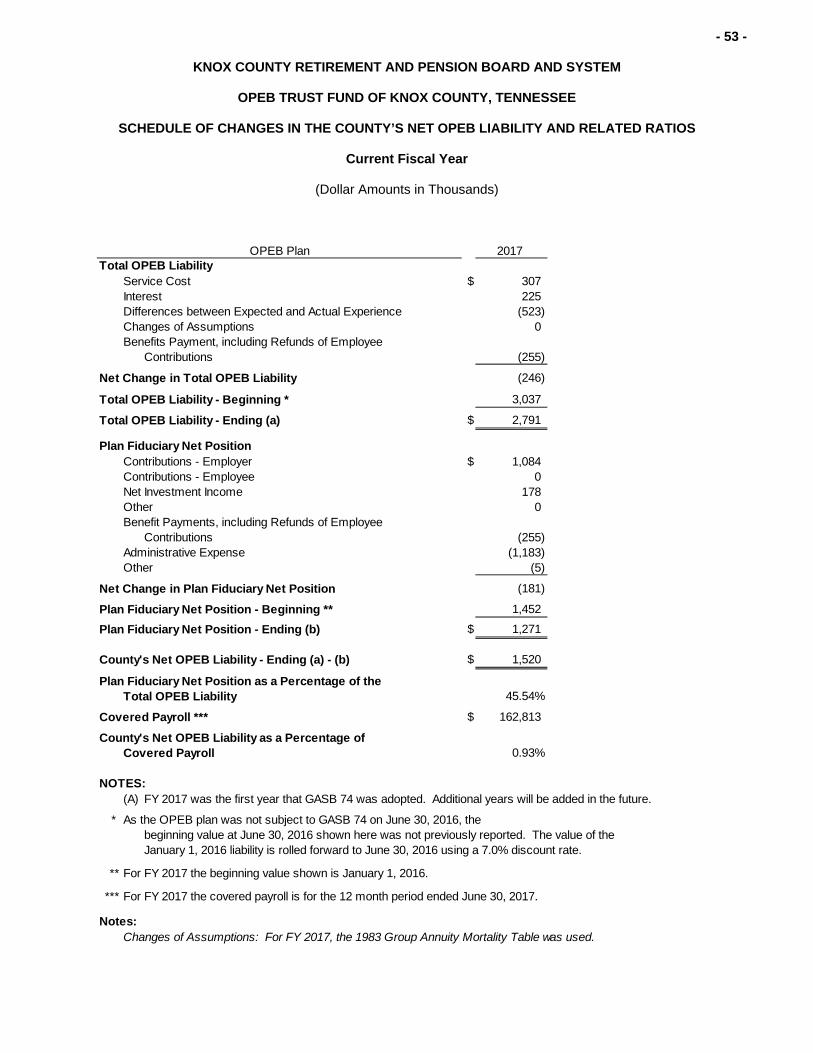
- 53 -
KNOX COUNTY RETIREMENT AND PENSION BOARD AND SYSTEM
OPEB TRUST FUND OF KNOX COUNTY, TENNESSEE
SCHEDULE OF CHANGES IN THE COUNTY’S NET OPEB LIABILITY AND RELATED RATIOS
Current Fiscal Year
(Dollar Amounts in Thousands)
2017Total OPEB Liability
Service Cost $ 307 Interest 225Differences between Expected and Actual Experience (523)Changes of Assumptions 0Benefits Payment, including Refunds of Employee
Contributions (255)
Net Change in Total OPEB Liability (246)
Total OPEB Liability - Beginning * 3,037
Total OPEB Liability - Ending (a) $ 2,791
Plan Fiduciary Net PositionContributions - Employer $ 1,084 Contributions - Employee 0Net Investment Income 178Other 0Benefit Payments, including Refunds of Employee
Contributions (255)Administrative Expense (1,183)Other (5)
Net Change in Plan Fiduciary Net Position (181)
Plan Fiduciary Net Position - Beginning ** 1,452
Plan Fiduciary Net Position - Ending (b) $ 1,271
County's Net OPEB Liability - Ending (a) - (b) $ 1,520
Plan Fiduciary Net Position as a Percentage of theTotal OPEB Liability 45.54%
Covered Payroll *** $ 162,813
County's Net OPEB Liability as a Percentage of Covered Payroll 0.93%
NOTES: (A) FY 2017 was the first year that GASB 74 was adopted. Additional years will be added in the future.
* As the OPEB plan was not subject to GASB 74 on June 30, 2016, the beginning value at June 30, 2016 shown here was not previously reported. The value of theJanuary 1, 2016 liability is rolled forward to June 30, 2016 using a 7.0% discount rate.
** For FY 2017 the beginning value shown is January 1, 2016.
*** For FY 2017 the covered payroll is for the 12 month period ended June 30, 2017.
Notes:Changes of Assumptions: For FY 2017, the 1983 Group Annuity Mortality Table was used.
OPEB Plan
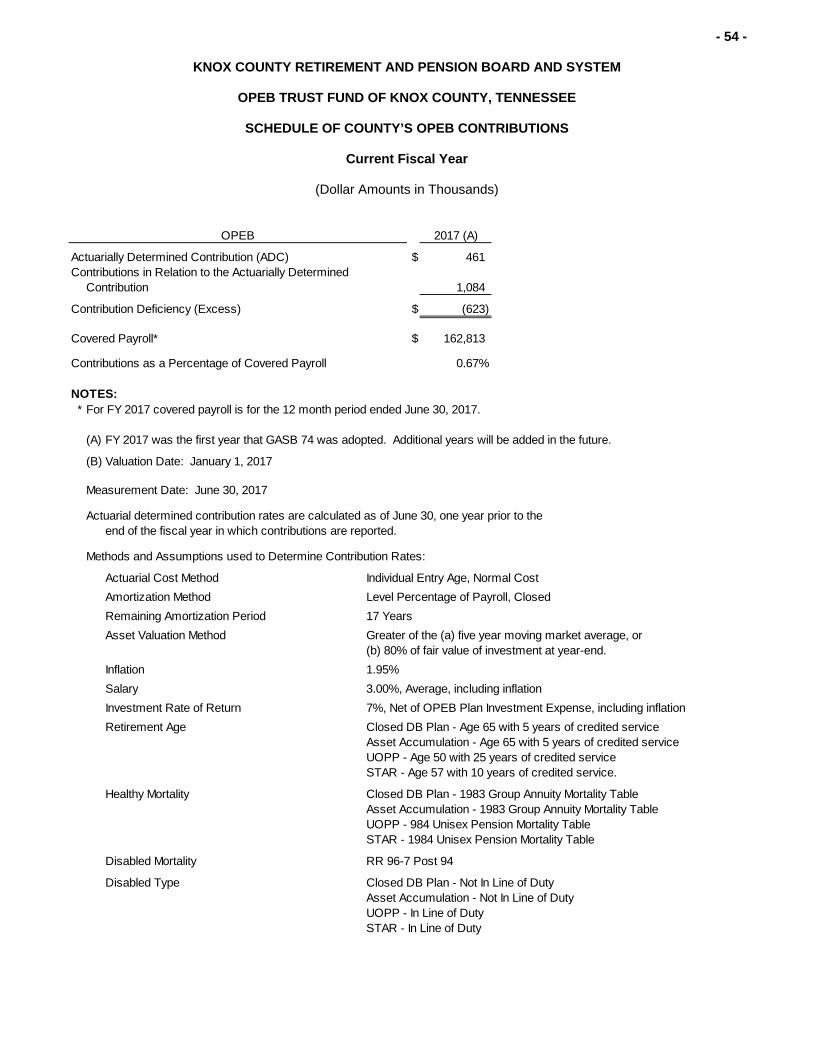
- 54 -
KNOX COUNTY RETIREMENT AND PENSION BOARD AND SYSTEM
OPEB TRUST FUND OF KNOX COUNTY, TENNESSEE
SCHEDULE OF COUNTY’S OPEB CONTRIBUTIONS
Current Fiscal Year
(Dollar Amounts in Thousands)
2017 (A)
Actuarially Determined Contribution (ADC) $ 461Contributions in Relation to the Actuarially Determined
Contribution 1,084
Contribution Deficiency (Excess) $ (623)
Covered Payroll* $ 162,813
Contributions as a Percentage of Covered Payroll 0.67%
NOTES:* For FY 2017 covered payroll is for the 12 month period ended June 30, 2017.
(A) FY 2017 was the first year that GASB 74 was adopted. Additional years will be added in the future.
(B) Valuation Date: January 1, 2017
Measurement Date: June 30, 2017
Actuarial determined contribution rates are calculated as of June 30, one year prior to the end of the fiscal year in which contributions are reported.
Methods and Assumptions used to Determine Contribution Rates:
Actuarial Cost Method Individual Entry Age, Normal Cost
Amortization Method Level Percentage of Payroll, Closed
Remaining Amortization Period 17 Years
Asset Valuation Method Greater of the (a) five year moving market average, or (b) 80% of fair value of investment at year-end.
Inflation 1.95%
Salary 3.00%, Average, including inflation
Investment Rate of Return 7%, Net of OPEB Plan Investment Expense, including inflation
Retirement Age Closed DB Plan - Age 65 with 5 years of credited serviceAsset Accumulation - Age 65 with 5 years of credited serviceUOPP - Age 50 with 25 years of credited serviceSTAR - Age 57 with 10 years of credited service.
Healthy Mortality Closed DB Plan - 1983 Group Annuity Mortality TableAsset Accumulation - 1983 Group Annuity Mortality TableUOPP - 984 Unisex Pension Mortality TableSTAR - 1984 Unisex Pension Mortality Table
Disabled Mortality RR 96-7 Post 94
Disabled Type Closed DB Plan - Not In Line of DutyAsset Accumulation - Not In Line of DutyUOPP - In Line of DutySTAR - In Line of Duty
OPEB

INTERNAL CONTROL AND
COMPLIANCE SECTION

- 55 -
TSCPA
Members of the Tennessee Society Of Certified Public Accountants
RSM US Alliance member firms are separate and independent businesses and legal entities that are responsible for their own acts and omissions, and each are separate and independent from RSM US LLP. RSM US LLP is the U.S. member firm of RSM International, a global network of independent audit, tax, and consulting firms.
Members of RSM US Alliance have access to RSM International resources through RSM US LLP but are not member firms of RSM International.
KNOXVILLE OFFICE: OAK RIDGE OFFICE:
315 NORTH CEDAR BLUFF ROAD – SUITE 200 800 OAK RIDGE TURNPIKE – SUITE A404
KNOXVILLE, TENNESSEE 37923 OAK RIDGE, TENNESSEE 37830
TELEPHONE 865-769-0660 TELEPHONE 865-769-1657
PUGH & COMPANY, P.C.
www.pughcpas.com
INDEPENDENT AUDITOR’S REPORT ON INTERNAL CONTROL OVER FINANCIAL REPORTING
AND ON COMPLIANCE AND OTHER MATTERS BASED ON AN AUDIT OF FINANCIAL STATEMENTS PERFORMED IN ACCORDANCE
WITH GOVERNMENT AUDITING STANDARDS Members of the Knox County Retirement and Pension Board and System Knoxville, Tennessee We have audited, in accordance with the auditing standards generally accepted in the United States of America and the standards applicable to financial audits contained in Government Auditing Standards issued by the Comptroller General of the United States, the financial statements of the Knox County Retirement and Pension Board and System (the “System”), a department of Knox County, Tennessee, which comprise the statements of fiduciary net position as of June 30, 2017 and 2016 and the related statements of changes in fiduciary net position for the years then ended and the related notes to the financial statements, and we have issued our report thereon dated December 29, 2017. We qualified our auditor’s opinion because we did not perform auditing procedures with respect to the System's defined contribution plans’ (Asset Accumulation, Voluntary 457, and Medical Expense Retirement Plans) individual participant account balances accumulated from inception to January 1, 2011, and we were unable to satisfy ourselves as to the basis on which participants’ equity is stated as of the beginning and end of the years ended June 30, 2017 and 2016, or the propriety of the benefits paid to participants during the years then ended. Consequently, we were unable to determine whether any adjustments to these amounts were necessary. Internal Control Over Financial Reporting
In planning and performing our audit of the financial statements, we considered the System's internal control over financial reporting (internal control) to determine the audit procedures that are appropriate in the circumstances for the purpose of expressing our opinion on the financial statements, but not for the purpose of expressing an opinion on the effectiveness of the System's internal control. Accordingly, we do not express an opinion on the effectiveness of the System's internal control. A deficiency in internal control exists when the design or operation of a control does not allow management or employees, in the normal course of performing their assigned functions, to prevent, or detect and correct, misstatements on a timely basis. A material weakness is a deficiency, or a combination of deficiencies, in internal control, such that there is a reasonable possibility that a material misstatement of the System’s financial statements will not be prevented, or detected and corrected on a timely basis. A significant deficiency is a deficiency, or a combination of deficiencies, in internal control that is less severe than a material weakness, yet important enough to merit attention by those charged with governance.

- 56 -
Our consideration of internal control was for the limited purpose described in the first paragraph of this section and was not designed to identify all deficiencies in internal control that might be material weaknesses or significant deficiencies and therefore, material weaknesses or significant deficiencies may exist that were not identified. Given these limitations, during our audit we did not identify any deficiencies in internal control that we consider to be material weaknesses. We did identify a certain deficiency in internal control, described in the accompanying schedule of findings and responses as item 2017-001, that we consider to be a significant deficiency. Compliance and Other Matters
As part of obtaining reasonable assurance about whether the System’s financial statements are free from material misstatement, we performed tests of its compliance with certain provisions of laws, regulations, contracts and grant agreements, noncompliance with which could have a direct and material effect on the determination of financial statement amounts. However, providing an opinion on compliance with those provisions was not an objective of our audit, and accordingly, we do not express such an opinion. The results of our tests disclosed no instances of noncompliance or other matters that are required to be reported under Government Auditing Standards. Response to Finding
The System’s response to the finding identified in our audit is described in the accompanying schedule of findings and responses and management’s corrective action plan. The System’s response and corrective action plan were not subjected to the auditing procedures applied in the audit of the financial statements and, accordingly, we express no opinion on them. Purpose of this Report
The purpose of this report is solely to describe the scope of our testing of internal control and compliance and the results of that testing, and not to provide an opinion on the effectiveness of the System’s internal control systems or on compliance. This report is an integral part of an audit performed in accordance with Government Auditing Standards in considering the System’s internal control systems and compliance. Accordingly, this communication is not suitable for any other purpose.
Pugh &Company, P.C.
Certified Public Accountants Knoxville, Tennessee December 29, 2017
- 57 -
KNOX COUNTY RETIREMENT AND PENSION BOARD AND SYSTEM
SCHEDULE OF FINDINGS AND RESPONSES
For the Year Ended June 30, 2017 2017-001 Review of Benefit Calculations and Supporting Documentation
Criteria or Specific Requirement - Benefit calculations under the defined benefit plans are regularly prepared by the Retirement Board’s staff. These calculations should be reviewed for accuracy by knowledgeable personnel prior to submission to the actuary. Condition - During the 2016 fiscal year, it was noted that certain benefit calculations and supporting documentation were not reviewed by anyone other than the preparer prior to submission to the actuary.
Cause and Effect - The review of benefit calculations and supporting documentation was not regularly performed by management during 2016 and preceding years. The possibility of an error was greatly increased by not performing an independent review of benefit calculations including supporting documentation during this period.
Recommendation - We recommended in 2016 that the Pension office implement procedures to ensure that benefit calculations and supporting documentation are reviewed by management prior to submission to the actuary. The review includes a comparison to source documents including payroll data. We recommend in the current year that the Pension office consider a review of prior year benefit calculations on a sample basis.
Current Status - During the fiscal year ended June 30, 2017 year, we noted two exceptions in benefit payment amounts to defined benefit plan participants. Both participants were retirees already receiving benefits in prior years. A practice was implemented during the current year to ensure benefit calculations and supporting documentation are reviewed prior to submission to the actuary. This review includes a comparison to source documents including payroll data. This review is conducted by management personnel. There were no exceptions noted for new retirees in the 2017 fiscal year.
Management’s Response – The Retirement Office implemented a practice as of December 1, 2016 that ensures benefit calculations and supporting documentation are now reviewed prior to submission to the actuary. The review includes a comparison to source documents including payroll data. This review is conducted by management personnel. We will also implement a plan/ procedure by April, 2018 where benefit calculations prepared prior to December 1, 2016 will be re-calculated on a sample basis.

- 58 -
KNOX COUNTY RETIREMENT AND PENSION BOARD AND SYSTEM
SCHEDULE OF PRIOR YEAR FINDINGS
For the Year Ended June 30, 2016
Status/Current Year
PY Finding Finding Title Finding Number
2016-001 Review of Benefit Calculations and Supporting DocumentationStatus Updated/ See 2017-001

Knox County Retirement & Pension Board City-County Building, Room 371 400 Main Street Knoxville, Tennessee 37902-2409
Phone (865) 215-2323 Fax (865) 215-2421
Kim Bennett
Executive Director
BOARD MEMBERS
Mayor Tim Burchett
Chairman By Proxy
Mr. Chris Caldwell
Commissioner Hugh Nystrom Vice Chairman
Ms. Tracy Foster Secretary
Commissioner Ed Brantley
Commissioner John Schoonmaker
Commissioner Bob Thomas
Ms. Jennifer Hemmelgarn
Mr. Garrett Raiden
Mr. Zack Webb
KNOX COUNTY RETIREMENT AND PENSION BOARD AND SYSTEM
CORRECTIVE ACTION PLAN
For the Year Ended June 30, 2017
2017 - 001 Benefit Calculations
Finding: The review of benefit calculations and supporting documentation was not regularly performed by management during 2016 and preceding years which can affect current year benefit payments. Corrective Action Taken or Planned: We implemented a practice as of December 1, 2016 that ensures benefit calculations and supporting documentation are now reviewed prior to submission to the actuary. The review includes a comparison to source documents including payroll data. This review is conducted by management personnel. We will also implement a plan/procedure by April 2018 where benefit calculations prepared prior to December 1, 2016 will be re-calculated on a sample basis.
- 59 -
