kobay technology bhd. (company no.: 308279 a ... · pdf file(incorporated in malaysia)...
TRANSCRIPT

Company No.: 308279 A
KOBAY TECHNOLOGY BHD. (COMPANY NO.: 308279 A)
(Incorporated in Malaysia)
FINANCIAL STATEMENTS JUNE 30, 2006
(In Ringgit Malaysia)

Company No.: 308279 A
KOBAY TECHNOLOGY BHD. (Incorporated in Malaysia) FINANCIAL STATEMENTS JUNE 30, 2006 CONTENTS PAGE(S) Directors’ report 1-7 Report of the auditors 8-9 Income statements 10 Balance sheets 11-12 Statements of changes in equity 13-15 Cash flow statements 16-19 Notes to the financial statements 20-67 Statement by directors 68 Declaration by the director primarily responsible for the financial
management of the Company
68

Company No.: 308279 A
1
KOBAY TECHNOLOGY BHD. (Incorporated in Malaysia) DIRECTORS' REPORT The directors of KOBAY TECHNOLOGY BHD. have pleasure in submitting their report and the audited financial statements of the Group and of the Company for the financial year ended June 30, 2006. PRINCIPAL ACTIVITIES The Company is principally involved in investment holding and providing management services. The principal activities of the subsidiary companies are disclosed in Note 10 to the financial statements. There have been no significant changes in the nature of the activities of the Group and of the Company during the financial year except that certain subsidiary companies have ceased their manufacturing activities during the financial year as disclosed in Note 10 to the financial statements. RESULTS OF OPERATIONS The Group The Company RM RM Profit after tax 4,155,080 1,005,463 Minority interests (262,146) - Net profit for the year 3,892,934 1,005,463
In the opinion of the directors, the results of operations of the Group and of the Company during the financial year have not been substantially affected by any item, transaction or event of a material and unusual nature. DIVIDENDS A first and final dividend of 3 sen per ordinary share, tax exempt, amounting to RM2,020,576 in respect of the financial year ended June 30, 2005 which was proposed and dealt with in the previous directors’ report was declared and paid by the Company during the current financial year. The directors proposed a first and final dividend of 3.5 sen per ordinary share, tax exempt, in respect of the current financial year. The proposed first and final dividend if payable in respect of all outstanding ordinary shares in issue as of the end of the current financial year would amount to RM2,357,339. The dividend is subject to approval by the shareholders at the forthcoming Annual General Meeting of the Company and has not been included as a liability in the financial statements. RESERVES AND PROVISIONS There were no material transfers to or from reserves or provisions during the financial year other than those disclosed in the financial statements. ISSUE OF SHARES AND DEBENTURES The Company has not issued any new shares or debentures during the financial year.

Company No.: 308279 A
2
EMPLOYEES’ SHARE OPTION SCHEME The Company’s Employees’ Share Option Scheme (“ESOS”) was approved by the shareholders at an Extraordinary General Meeting held on December 27, 2002 and became effective on February 18, 2003. The principal features of the ESOS are as follows: (i) The maximum number of shares of the Company which may be subscribed on the exercise of
options granted under the ESOS shall not, in aggregate, exceed ten per centum (10%) of the issued and paid-up share capital of the Company or such maximum percentages as allowable by any other relevant authorities at any point of time during the existence of the ESOS;
(ii) In order to qualify for participation in the ESOS, a participant must be an eligible executive
director or employee of the Group. Eligibility, however, does not confer an eligible executive director or employee a claim or right to participate in the ESOS unless an offer has been extended to the eligible executive director or employee;
(iii) The number of new shares that may be offered and allotted to any eligible executive director
and employee of the Group, who are entitled to participate in the ESOS, shall be at the discretion of the committee appointed by the Board of Directors of the Group (“Option Committee”) after taking into consideration the performance, seniority and length of service of the eligible executive directors and employees in the Group and such other factors that the Option Committee may deem relevant subject to the following:-
(a) not more than fifty per centum (50%) (or such percentage as allowable by the relevant
authorities) of the shares available under the ESOS should be allocated, in aggregate, to directors and senior management of the Group; and
(b) not more than ten per centum (10%) (or such percentage as allowable by the relevant
authorities) of the shares available under the ESOS should be allocated to any individual director or employee who, either singly or collectively through his/her associates (as defined in the Companies Act, 1965), holds twenty per centum (20%) or more in the issued and paid-up share capital of the Company;
provided always that it is in accordance with any prevailing guidelines issued by the Securities Commission (“SC”) or any other relevant authorities as amended from time to time;
(iv) The ESOS shall continue to be in force for a period of ten (10) years and expiring on February 17, 2013;
(v) The price payable upon exercise of each of the option share granted under the ESOS shall be
set based on the 5-days weighted average market price of the Company’s shares, as quoted on the Bursa Malaysia Securities, immediately preceding the date the option is granted, with a discount of not more than ten per centum (10%), if deemed appropriate, or such lower or higher limit in accordance with any prevailing guidelines issued by the SC or any other relevant authorities as amended from time to time, or at the par value of each of the share of the Company, whichever is higher; and

Company No.: 308279 A
3
(vi) The new shares to be allotted and issued upon exercise of any option shall upon allotment rank pari passu in all respects with the existing issued and paid-up shares of the Company except that the new shares so allotted shall not be entitled to any dividend, rights, allotment or other distribution unless the shares so allotted have been credited into the relevant securities accounts maintained by Bursa Malaysia Depository Sdn. Bhd. before the entitlement date and will be subject to all the provisions of the Articles of Association of the Company relating to the transfer, transmission or otherwise of the shares of the Company.
The share options granted and exercised during the financial year are as follows:
No. of options over ordinary shares of RM1 each
Exercisable from
Exercise price per ordinary
share
Balance
as of 1.7.2005
Granted
Exercised
Lapsed
Balance
as of 30.6.2006
RM February 18, 2003 1.20 4,296,000 - - (269,000) 4,027,000 May 15, 2003 1.20 199,000 - - (20,000) 179,000 According to Section 169 (11) of the Companies Act, 1965, the Company is required to disclose the name of persons to whom any option has been granted during the financial year. Pursuant to Section 169A of the Companies Act, 1965, the Company has applied and has been granted exemption by the Companies Commission of Malaysia from having to disclose the name of employees who have been granted options below 100,000. During the financial year, none of employees have been granted options of 100,000 and above. OTHER FINANCIAL INFORMATION Before the income statements and balance sheets of the Group and of the Company were made out, the directors took reasonable steps: (a) to ascertain that proper action had been taken in relation to the writing off of bad debts and
the making of allowance for doubtful debts, and have satisfied themselves that all known bad debts had been written off and that adequate allowance has been made for doubtful debts; and
(b) to ensure that any current assets which were unlikely to realise their book values in the
ordinary course of business have been written down to their estimated realisable values. At the date of this report, the directors are not aware of any circumstances: (a) which would render the amount written off for bad debts or the amount of the allowance for
doubtful debts in the financial statements of the Group and of the Company inadequate to any substantial extent; or
(b) which would render the values attributed to current assets in the financial statements of the
Group and of the Company misleading; or (c) which have arisen which render adherence to the existing method of valuation of assets or
liabilities of the Group and of the Company misleading or inappropriate; or (d) not otherwise dealt with in this report or financial statements which would render any amount
stated in the financial statements of the Group and of the Company misleading.

Company No.: 308279 A
4
At the date of this report, there does not exist: (a) any charge on the assets of the Group and of the Company which has arisen since the end of
the financial year and secures the liability of any other person; and (b) any contingent liability of the Group and of the Company which has arisen since the end of
the financial year. No contingent or other liability has become enforceable or is likely to become enforceable within the period of twelve months after the end of the financial year which, in the opinion of the directors, will or may substantially affect the ability of the Group and of the Company to meet their obligations as and when they fall due. In the opinion of the directors, no item, transaction or event of a material and unusual nature has arisen in the interval between the end of the financial year and the date of this report which is likely to affect substantially the results of operations of the Group and of the Company for the succeeding financial year. SIGNIFICANT EVENTS DURING THE FINANCIAL YEAR A summary of the significant events which occurred during the financial year is set out as follows: a. On March 28, 2006, the Company acquired 100% equity interest in Polytool Systems Sdn.
Bhd. (formerly known as Paradigm Precision Industries Sdn. Bhd.) comprising 2 ordinary shares of RM1 each for a cash consideration of RM1,800.
b. On June 21, 2006, a wholly owned subsidiary company, Polytool Industries (Thailand)
Limited had been struck off from the register of Civil and Commercial Code of Thailand. On the event date, the Company deemed disposed of 100% equity interest in Polytool Industries (Thailand) Limited.
SIGNIFICANT EVENTS SUBSEQUENT TO BALANCE SHEET DATE Significant events subsequent to balance sheet date are disclosed in Note 34 to the financial statements.
Company No.: 308279 A
5
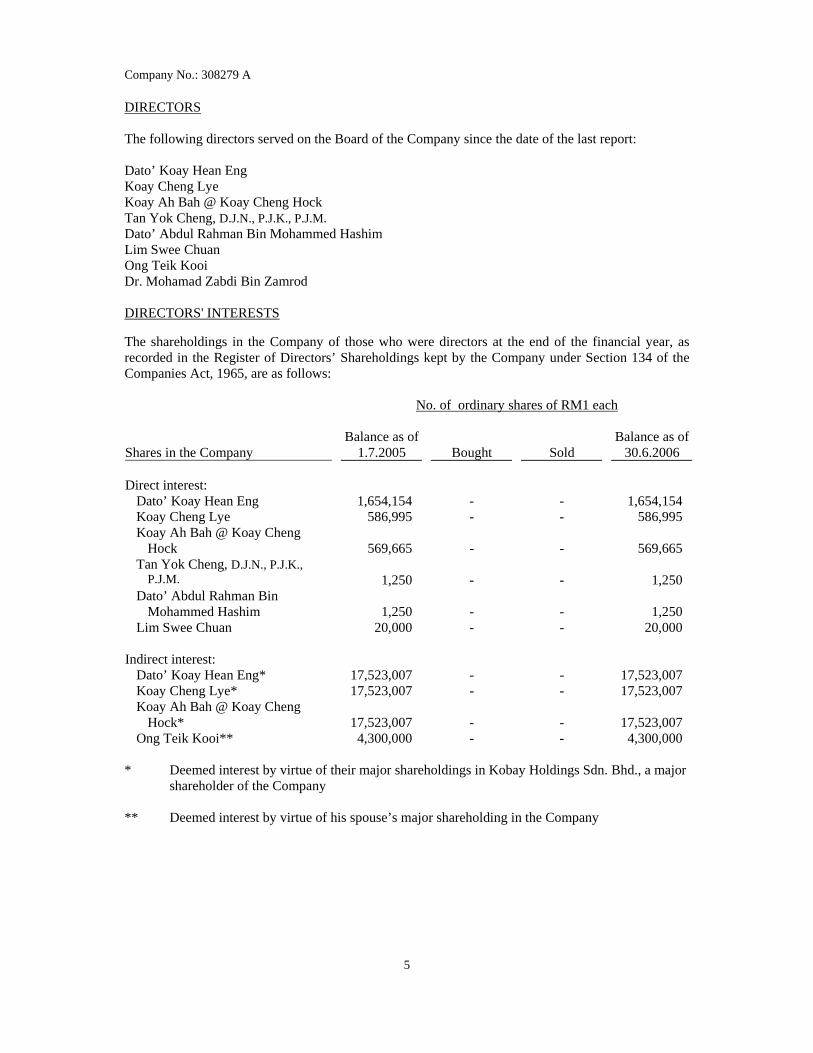
DIRECTORS The following directors served on the Board of the Company since the date of the last report: Dato’ Koay Hean Eng Koay Cheng Lye Koay Ah Bah @ Koay Cheng Hock Tan Yok Cheng, D.J.N., P.J.K., P.J.M. Dato’ Abdul Rahman Bin Mohammed Hashim Lim Swee Chuan Ong Teik Kooi Dr. Mohamad Zabdi Bin Zamrod DIRECTORS' INTERESTS The shareholdings in the Company of those who were directors at the end of the financial year, as recorded in the Register of Directors’ Shareholdings kept by the Company under Section 134 of the Companies Act, 1965, are as follows: No. of ordinary shares of RM1 each Shares in the Company
Balance as of 1.7.2005
Bought
Sold
Balance as of 30.6.2006
Direct interest:
Dato’ Koay Hean Eng 1,654,154 - - 1,654,154 Koay Cheng Lye 586,995 - - 586,995 Koay Ah Bah @ Koay Cheng
Hock
569,665
-
-
569,665 Tan Yok Cheng, D.J.N., P.J.K.,
P.J.M.
1,250
-
-
1,250 Dato’ Abdul Rahman Bin
Mohammed Hashim
1,250
-
-
1,250 Lim Swee Chuan 20,000 - - 20,000
Indirect interest:
Dato’ Koay Hean Eng* 17,523,007 - - 17,523,007 Koay Cheng Lye* 17,523,007 - - 17,523,007 Koay Ah Bah @ Koay Cheng
Hock*
17,523,007
-
-
17,523,007 Ong Teik Kooi** 4,300,000 - - 4,300,000
* Deemed interest by virtue of their major shareholdings in Kobay Holdings Sdn. Bhd., a major
shareholder of the Company ** Deemed interest by virtue of his spouse’s major shareholding in the Company

Company No.: 308279 A
6
In addition to the above, the following directors are also deemed to have interest in the shares of the Company to the extent of the options granted to them pursuant to the ESOS of the Company: No. of options over ordinary shares of RM1 each Options over shares in the Company
Balance as of 1.7.2005
Granted
Exercised
Balance as of 30.6.2006
Dato’ Koay Hean Eng 600,000 - - 600,000 Lim Swee Chuan 250,000 - - 250,000 Ong Teik Kooi 300,000 - - 300,000 By virtue of their interest in the shares of the Company, Dato’ Koay Hean Eng, Mr. Koay Cheng Lye and Mr. Koay Ah Bah @ Koay Cheng Hock are also deemed to have an interest in the shares of all the subsidiary companies of Kobay Technology Bhd. to the extent that Kobay Technology Bhd. has an interest. None of the other directors held shares or have beneficial interests in the shares of the Company or its subsidiary companies during the financial year. DIRECTORS' BENEFITS Since the end of the previous financial year, none of the directors of the Company has received or become entitled to receive any benefit (other than those disclosed as directors' remuneration in the financial statements) by reason of a contract made by the Company or a related corporation with the director or with a firm of which he is a member, or with a company in which he has a substantial financial interest except for any benefits which may be deemed to have arisen by virtue of the transactions mentioned in Note 33 to the financial statements. During and at the end of the financial year, no arrangement subsisted to which the Company was a party whereby directors of the Company might acquire benefits by means of the acquisition of shares in, or debentures of, the Company or any other body corporate except for options granted to certain directors pursuant to the Company’s ESOS.

Company No.: 308279 A
7
Company No.: 308279 A
8
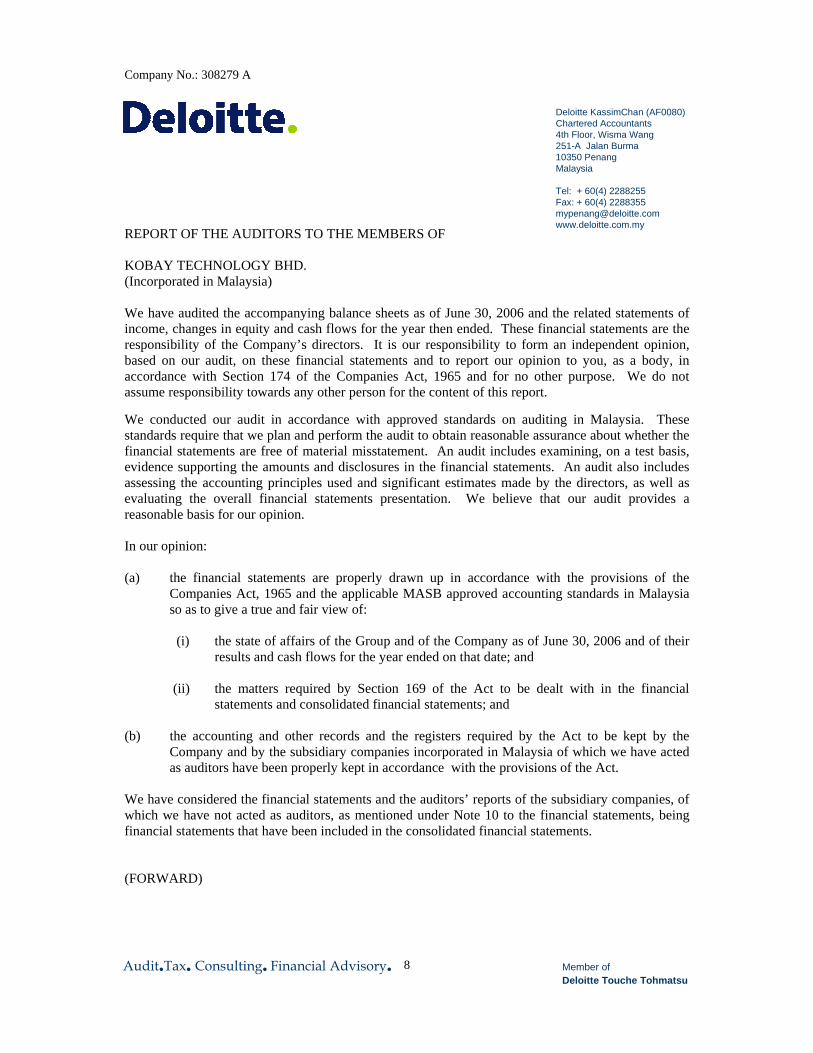
REPORT OF THE AUDITORS TO THE MEMBERS OF KOBAY TECHNOLOGY BHD. (Incorporated in Malaysia) We have audited the accompanying balance sheets as of June 30, 2006 and the related statements of income, changes in equity and cash flows for the year then ended. These financial statements are the responsibility of the Company’s directors. It is our responsibility to form an independent opinion, based on our audit, on these financial statements and to report our opinion to you, as a body, in accordance with Section 174 of the Companies Act, 1965 and for no other purpose. We do not assume responsibility towards any other person for the content of this report. We conducted our audit in accordance with approved standards on auditing in Malaysia. These standards require that we plan and perform the audit to obtain reasonable assurance about whether the financial statements are free of material misstatement. An audit includes examining, on a test basis, evidence supporting the amounts and disclosures in the financial statements. An audit also includes assessing the accounting principles used and significant estimates made by the directors, as well as evaluating the overall financial statements presentation. We believe that our audit provides a reasonable basis for our opinion. In our opinion: (a) the financial statements are properly drawn up in accordance with the provisions of the
Companies Act, 1965 and the applicable MASB approved accounting standards in Malaysia so as to give a true and fair view of:
(i) the state of affairs of the Group and of the Company as of June 30, 2006 and of their
results and cash flows for the year ended on that date; and (ii) the matters required by Section 169 of the Act to be dealt with in the financial
statements and consolidated financial statements; and (b) the accounting and other records and the registers required by the Act to be kept by the
Company and by the subsidiary companies incorporated in Malaysia of which we have acted as auditors have been properly kept in accordance with the provisions of the Act.
We have considered the financial statements and the auditors’ reports of the subsidiary companies, of which we have not acted as auditors, as mentioned under Note 10 to the financial statements, being financial statements that have been included in the consolidated financial statements. (FORWARD)
Deloitte KassimChan (AF0080) Chartered Accountants 4th Floor, Wisma Wang 251-A Jalan Burma 10350 Penang Malaysia Tel: + 60(4) 2288255 Fax: + 60(4) 2288355 [email protected] www.deloitte.com.my
Audit●Tax● Consulting● Financial Advisory● Member of Deloitte Touche Tohmatsu

Company No.: 308279 A
9

Company No.: 308279 A
10
KOBAY TECHNOLOGY BHD. (Incorporated in Malaysia) INCOME STATEMENTS FOR THE YEAR ENDED JUNE 30, 2006 The Group The Company Note 2006 2005 2006 2005 RM RM RM RM
Revenue 5 95,403,944 89,082,476 12,967,729 4,415,969
Cost of sales (79,688,093) (75,373,853) - -
Gross profit 15,715,851 13,708,623 12,967,729 4,415,969
Other operating income 1,549,391 281,051 7,524,365 6,086
Other operating expenses (3,159,801) (3,306,629) (2,103,192) -
Administrative and general expenses
(4,591,529) (4,670,659)
(2,428,228)
(2,394,800)
Distribution costs (2,706,872) (2,210,125) - -
Profit from operations 6,807,040 3,802,261 15,960,674 2,027,255
Finance costs (928,534) (647,613) - -
Share of profit/ (losses) of associated companies
800,524 (550,056)
-
-
Income from other investments 316,143 249,431 - -
Impairment loss of investment in associated companies
(1,669,531)
-
-
-
Impairment loss of investment in subsidiary companies
-
-
(13,032,959)
(675,956)
Profit before tax 6 5,325,642 2,854,023 2,927,715 1,351,299
Tax (expense)/ income 7 The Company and its
subsidiary companies
(749,534)
385,492
(1,922,252)
572,780 Share of tax of associated
companies
(421,028) (52,023) -
-
(1,170,562) 333,469 (1,922,252) 572,780
Profit after tax 4,155,080 3,187,492 1,005,463 1,924,079
Minority interests (262,146) (384,604) - -
Net profit for the year 3,892,934 2,802,888 1,005,463 1,924,079
Earnings per ordinary share Basic 8 5.78 sen 4.15 sen
The accompanying notes form an integral part of the financial statements.

Company No.: 308279 A
11
KOBAY TECHNOLOGY BHD. (Incorporated in Malaysia) BALANCE SHEETS AS OF JUNE 30, 2006
The Group The Company Note 2006 2005 2006 2005 RM RM RM RM NON-CURRENT ASSETS Property, plant and equipment 9 24,547,697 32,080,857 593,714 505,396 Investment in subsidiary
companies
10 -
-
21,360,081
34,487,169
Investment in associated companies
11
25,609,710
26,936,902
22,813,000
22,813,000
Other investments 12 3,645,421 934,038 3,129,781 141,000 Development costs 13 511,658 109,385 - - Deferred tax assets 14 11,000 19,000 - - Goodwill on consolidation 15 78,203 80,425 - - Total Non-current Assets 54,403,689 60,160,607 47,896,576 57,946,565 CURRENT ASSETS Inventories 16 22,371,449 18,220,081 - - Trade receivables 17 25,193,775 20,456,680 - - Finance lease receivables 18 - 5,585 - - Loan receivables 19 609,687 1,083,756 - - Other receivables and prepaid
expenses
20
1,269,404
1,099,803
275,171
262,566 Tax recoverable 1,670,935 878,003 1,206,969 540,687 Amount owing by subsidiary
companies
21 -
-
14,428,181
18,047,362
Amount owing by an associated company
22
10,000
115,900
-
-
Short-term deposits with licensed banks
23
23,219,902
18,956,072
20,323,941
15,487,592
Cash and bank balances 3,277,449 3,453,711 130,289 310,289 Total Current Assets 77,622,601 64,269,591 36,364,551 34,648,496 (FORWARD)

Company No.: 308279 A
12
KOBAY TECHNOLOGY BHD. (Incorporated in Malaysia) BALANCE SHEETS AS OF JUNE 30, 2006
The Group The Company Note 2006 2005 2006 2005 RM RM RM RM CURRENT LIABILITIES Trade payables 24 4,441,230 2,808,393 - - Other payables and accrued
expenses
25
5,607,067
3,015,960
270,547
244,146 Amount owing to subsidiary
companies
21 -
-
1,513,364
8,858,586
Amount owing to an associated company
22
-
1,550
-
-
Amount owing to a director of subsidiary company
26
40,400
80,400
-
-
Bank borrowings 27 15,569,394 13,910,900 - - Long-term loan 28 - 314,245 - - Tax liabilities 1,071,322 1,121,340 - -
Total Current Liabilities 26,729,413 21,252,788 1,783,911 9,102,732
NET CURRENT ASSETS 50,893,188 43,016,803 34,580,640 25,545,764 105,296,877 103,177,410 82,477,216 83,492,329
SHARE CAPITAL 29 68,080,750 68,080,750 68,080,750 68,080,750
LESS: 728,200 (2005: 728,200) TREASURY SHARES, AT COST
29
(888,447)
(888,447)
(888,447)
(888,447)
RESERVES 30 31,726,401 29,872,323 15,284,913 16,300,026
SHAREHOLDERS’ EQUITY 98,918,704 97,064,626 82,477,216 83,492,329
MINORITY INTERESTS 3,655,964 3,567,055 - -
DEFERRED TAX LIABILITIES
14
2,722,209
2,545,729
-
-
105,296,877 103,177,410 82,477,216 83,492,329
The accompanying notes form an integral part of the financial statements.

Company No.: 308279 A
13
KOBAY TECHNOLOGY BHD. (Incorporated in Malaysia) STATEMENTS OF CHANGES IN EQUITY FOR THE YEAR ENDED JUNE 30, 2006 The Group
Share Capital
Share Premium
Reserve on Consolidation
Translation Reserve
Treasury shares
Retained Profit
Total
RM RM RM RM RM RM RM Balance as of
July 1, 2004
68,080,750 1,680,086
1,609,111
53,968
(232,847)
25,876,658
97,067,726
Repurchase of
555,500 ordinary shares
-
-
-
-
(655,600)
-
(655,600) Net loss not
recognised in the income statements:
Exchange difference on translation of net assets of foreign subsidiary companies
-
-
-
(124,064)
-
-
(124,064) Net profit for the
year
-
- -
-
-
2,802,888
2,802,888
Dividend
(Note 31)
-
- -
-
-
(2,026,324) (2,026,324)
Balance as of
June 30, 2005
68,080,750 1,680,086
1,609,111
(70,096)
(888,447)
26,653,222
97,064,626
(FORWARD)

Company No.: 308279 A
14
KOBAY TECHNOLOGY BHD. (Incorporated in Malaysia) STATEMENTS OF CHANGES IN EQUITY FOR THE YEAR ENDED JUNE 30, 2006 The Group
Share Capital
Share Premium
Reserve on Consolidation
Translation Reserve
Treasury shares
Retained Profit
Total
RM RM RM RM RM RM RM Balance as of
June 30, 2005
68,080,750 1,680,086
1,609,111
(70,096)
(888,447)
26,653,222
97,064,626
Net loss not
recognised in the income statements:
Transfer of translation reserves to retained profit upon deemed disposal of a subsidiary company
-
-
-
14,635
-
(14,635)
-
Exchange difference on translation of net assets of foreign subsidiary companies
-
-
-
(18,280)
-
-
(18,280) - - - (3,645) - (14,635) (18,280) Net profit for the
year
-
- -
-
-
3,892,934
3,892,934
Dividend
(Note 31)
-
- -
-
-
(2,020,576) (2,020,576)
Balance as of
June 30, 2006
68,080,750 1,680,086
1,609,111
(73,741)
(888,447)
28,510,945
98,918,704
(FORWARD)
Company No.: 308279 A
15
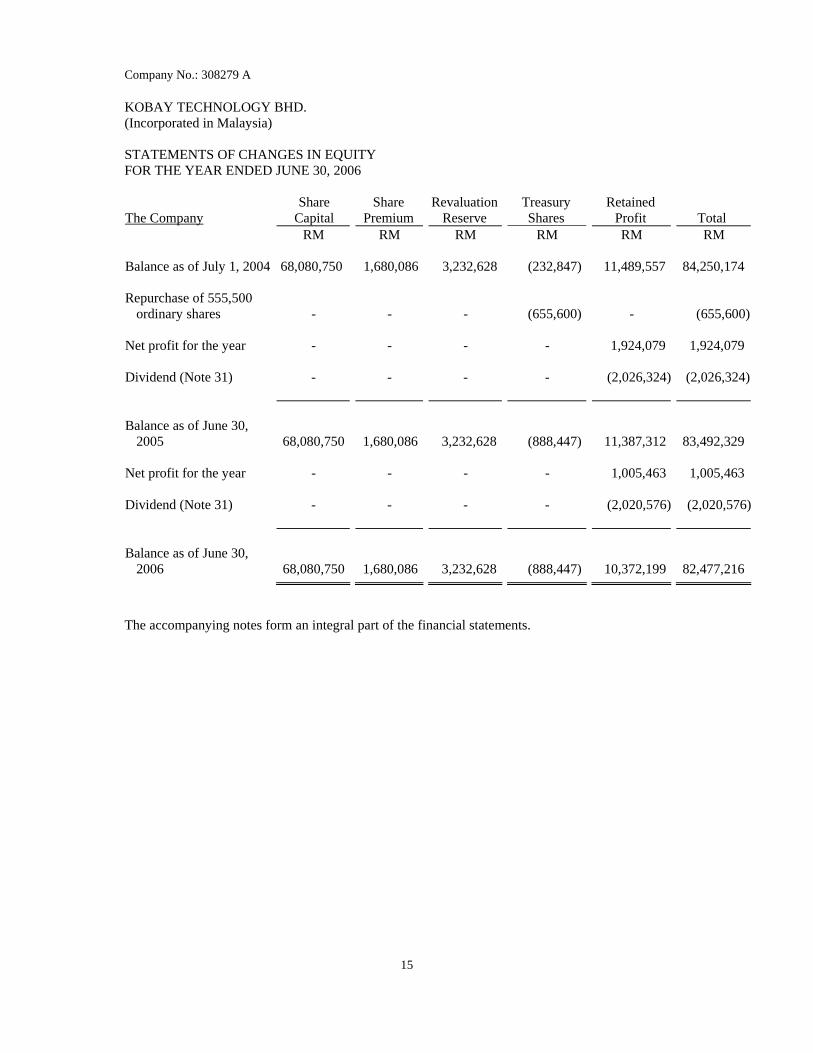
KOBAY TECHNOLOGY BHD. (Incorporated in Malaysia) STATEMENTS OF CHANGES IN EQUITY FOR THE YEAR ENDED JUNE 30, 2006 The Company
Share Capital
Share Premium
RevaluationReserve
Treasury Shares
Retained Profit
Total
RM RM RM RM RM RM Balance as of July 1, 2004 68,080,750 1,680,086 3,232,628 (232,847) 11,489,557 84,250,174 Repurchase of 555,500
ordinary shares
-
-
-
(655,600)
-
(655,600) Net profit for the year - - - - 1,924,079 1,924,079 Dividend (Note 31) - - - - (2,026,324) (2,026,324) Balance as of June 30,
2005
68,080,750 1,680,086 3,232,628
(888,447)
11,387,312
83,492,329 Net profit for the year - - - - 1,005,463 1,005,463 Dividend (Note 31) - - - - (2,020,576) (2,020,576) Balance as of June 30,
2006
68,080,750 1,680,086 3,232,628
(888,447)
10,372,199
82,477,216
The accompanying notes form an integral part of the financial statements.

Company No.: 308279 A
16
KOBAY TECHNOLOGY BHD. (Incorporated in Malaysia) CASH FLOW STATEMENTS FOR THE YEAR ENDED JUNE 30, 2006 The Group The Company 2006 2005 2006 2005 RM RM RM RM CASH FLOWS FROM OPERATING
ACTIVITIES
Profit before tax 5,325,642 2,854,023 2,927,715 1,351,299 Adjustments for:
Depreciation of property, plant and equipment
2,011,789
2,339,924
96,713
129,188
Impairment loss of investment in associated companies
1,669,531
-
-
-
Interest expenses 928,534 647,613 - - Property, plant and equipment written
off
341,261
2,685
52,657
- Allowance for doubtful debts 143,952 108,360 2,050,268 - Allowance for obsolete inventories 143,131 1,182,235 - - Bad debts written off 92,002 67,547 - - Amortisation of goodwill on
consolidation
4,757
4,757 -
-
Inventories written off 4,340 - - - Interest income (980,746) (795,398) (1,090,264) (810,480) Share of (profit)/ losses of associated
companies
(800,524)
550,056 -
-
(Gain)/ loss on disposal of property, plant and equipment
(285,500)
157,829
-
-
Allowance for slow moving inventories no longer required (253,298)
-
-
-
Unrealised gain on foreign exchange (17,447) (19,285) - - Gross dividend income (9,435) (13,425) (11,224,765) (2,838,639) Gain on disposal of other investments (8,639) (13,000) - - Allowance for doubtful debts no longer
required
(6,000) -
-
-
Impairment loss of investment in subsidiary companies
-
-
13,032,959
675,956
Waiver of debts owing to subsidiary company
-
-
(7,524,365)
-
Operating profit/ (loss) before working
capital changes
8,303,350
7,073,921
(1,679,082)
(1,492,676) (FORWARD)

Company No.: 308279 A
17
KOBAY TECHNOLOGY BHD. (Incorporated in Malaysia) CASH FLOW STATEMENTS FOR THE YEAR ENDED JUNE 30, 2006 The Group The Company 2006 2005 2006 2005 RM RM RM RM (Increase)/ Decrease in:
Inventories (4,045,541) (3,605,559) - - Trade receivables (4,949,602) 729,179 - - Finance lease receivables 5,585 6,815 - - Loan receivables 474,069 411,713 - - Other receivables and prepaid
expenses
(163,700)
243,351
(12,605) (11,645)
Amount owing by an associated company
105,900
(110,640)
-
-
Increase/ (Decrease) in: Trade payables 1,632,837 (1,499,174) - - Other payables and accrued
expenses
2,526,498 (650,821)
26,401
(102,491)Amount owing to an associated
company
(1,550) (591) -
-
Cash generated from/ (used in)
operations
3,887,846
2,598,194
(1,665,286)
(1,606,812)
Tax refunded 30,974 943,754 - 825,185 Tax paid (1,437,452) (1,002,507) - - Net cash generated from/ (used
in) operating activities
2,481,368
2,539,441
(1,665,286)
(781,627) (FORWARD)

Company No.: 308279 A
18
KOBAY TECHNOLOGY BHD. (Incorporated in Malaysia) CASH FLOW STATEMENTS FOR THE YEAR ENDED JUNE 30, 2006 The Group The Company Note 2006 2005 2006 2005 RM RM RM RM CASH FLOWS FROM
INVESTING ACTIVITIES
Proceeds from disposal of property, plant and equipment
6,572,389
25,239
33
-
Interest received 980,746 795,398 1,090,264 810,480 Proceeds from disposal of other
investments
363,859
196,887 -
-
Dividends received 7,909 13,425 8,636,231 2,350,690 Purchase of property, plant and
equipment
(1,101,451)
(4,467,203)
(237,721)
(7,822)Payment of capitalised
development costs
(398,606)
(109,385) -
-
Purchase of other investments (3,066,603) (259,468) (2,988,781) - Exchange difference on
translation of net assets of foreign subsidiary companies
(27,275)
(92,334)
-
-
Acquisition of subsidiary companies, net of cash and cash equivalents acquired
32
(1,660)
-
(1,800)
-
Decrease in amount owing by subsidiary companies
-
-
1,568,913
6,083,325
Dividend received from pre-acquisition profit of a subsidiary company
-
-
95,929
-
Purchase of additional shares in subsidiary companies
-
-
-
(1,175,000)
Net cash generated from/ (used
in) investing activities
3,329,308
(3,897,441)
8,163,068
8,061,673 (FORWARD)

Company No.: 308279 A
19
KOBAY TECHNOLOGY BHD. (Incorporated in Malaysia) CASH FLOW STATEMENTS FOR THE YEAR ENDED JUNE 30, 2006 The Group The Company Note 2006 2005 2006 2005 RM RM RM RM CASH FLOWS FROM
FINANCING ACTIVITIES
Increase in bank borrowings 1,658,494 342,360 - - Dividend paid (2,020,576) (2,026,324) (2,020,576) (2,026,324) Interest paid (870,701) (572,502) - - Repayment of long-term loans (314,245) (319,234) - - Dividends paid to minority
shareholders of subsidiary companies
(136,080) (167,760)
-
-
Fixed deposits (held as)/ released from security value
(50,724)
3,973
-
-
Decrease in amount owing to a director of subsidiary company
(40,000) (47,700)
-
-
Proceeds from issuance of shares to minority shareholders of subsidiary companies
-
825,000
Repurchase of treasury shares - (655,600) - (655,600) Repayment of hire-purchase - (36,564) - - Increase/ (Decrease) in amount
owing to subsidiary companies
-
-
179,143
(2,120,560)
Net cash used in financing activities
(1,773,832) (2,654,351)
(1,841,433)
(4,802,484)
NET INCREASE/ (DECREASE) IN CASH AND CASH EQUIVALENTS
4,036,844 (4,012,351)
4,656,349
2,477,562 CASH AND CASH
EQUIVALENTS AT BEGINNING OF YEAR
21,794,902
25,807,253
15,789,881
13,312,319
CASH AND CASH EQUIVALENTS AT END OF YEAR
32
25,831,746
21,794,902
20,446,230
15,789,881
The accompanying notes form an integral part of the financial statements.

Company No.: 308279 A
20
KOBAY TECHNOLOGY BHD. (Incorporated in Malaysia) NOTES TO THE FINANCIAL STATEMENTS JUNE 30, 2006 1. GENERAL INFORMATION The Company is principally involved in investment holding and providing management
services. The principal activities of the subsidiary companies are disclosed in Note 10. There have been no significant changes in the nature of the activities of the Group and of the Company during the financial year except that certain subsidiary companies have ceased their manufacturing activities during the financial year as disclosed in Note 10.
The Company is a public limited liability company, incorporated and domiciled in Malaysia,
and is listed on the Main Board of Bursa Malaysia Securities Berhad. The Company’s registered office and principal place of business are at Plot 30, Hilir Sungai
Kluang Satu, Bayan Lepas Industrial Park, Phase 4, 11900 Penang, Malaysia. The financial statements of the Group and of the Company were authorised for issue by the
Board of Directors in accordance with a resolution of the directors on October 9, 2006. 2. BASIS OF PREPARATION OF FINANCIAL STATEMENTS The financial statements of the Group and of the Company have been prepared in accordance
with the provisions of the Companies Act, 1965 and the applicable Malaysian Accounting Standards Board (“MASB”) approved accounting standards in Malaysia.
3. SIGNIFICANT ACCOUNTING POLICIES Basis of Accounting
The financial statements of the Group and of the Company have been prepared under the historical cost convention unless stated otherwise in the accounting policies mentioned below. Basis of Consolidation
The consolidated financial statements include the financial statements of the Company and all its subsidiary companies made up to the end of the financial year. All significant intercompany balances, transactions and resulting unrealised gains are eliminated on consolidation and the consolidated financial statements reflect external transactions only. Unrealised losses are eliminated on consolidation unless costs cannot be recovered.
The Group adopts the acquisition method of consolidation. On acquisition, the assets and liabilities of the relevant subsidiary companies are measured at their fair values at the date of acquisition. The interest of minority shareholders is stated at the minority’s proportion of the fair values of the assets and liabilities recognised.
The results of subsidiary companies acquired or disposed of during the financial year are included in the consolidated financial statements from the effective date of acquisition or up to the effective date of disposal.
Company No.: 308279 A
21
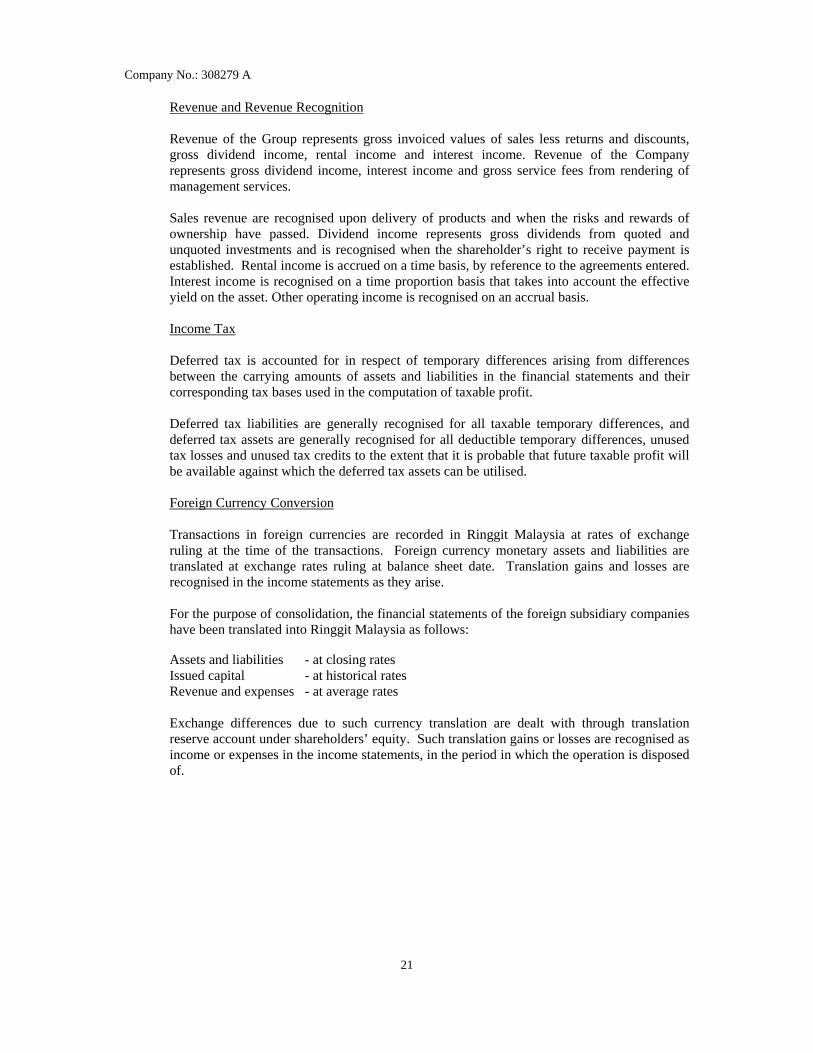
Revenue and Revenue Recognition Revenue of the Group represents gross invoiced values of sales less returns and discounts, gross dividend income, rental income and interest income. Revenue of the Company represents gross dividend income, interest income and gross service fees from rendering of management services. Sales revenue are recognised upon delivery of products and when the risks and rewards of ownership have passed. Dividend income represents gross dividends from quoted and unquoted investments and is recognised when the shareholder’s right to receive payment is established. Rental income is accrued on a time basis, by reference to the agreements entered. Interest income is recognised on a time proportion basis that takes into account the effective yield on the asset. Other operating income is recognised on an accrual basis.
Income Tax Deferred tax is accounted for in respect of temporary differences arising from differences between the carrying amounts of assets and liabilities in the financial statements and their corresponding tax bases used in the computation of taxable profit. Deferred tax liabilities are generally recognised for all taxable temporary differences, and deferred tax assets are generally recognised for all deductible temporary differences, unused tax losses and unused tax credits to the extent that it is probable that future taxable profit will be available against which the deferred tax assets can be utilised.
Foreign Currency Conversion
Transactions in foreign currencies are recorded in Ringgit Malaysia at rates of exchange ruling at the time of the transactions. Foreign currency monetary assets and liabilities are translated at exchange rates ruling at balance sheet date. Translation gains and losses are recognised in the income statements as they arise.
For the purpose of consolidation, the financial statements of the foreign subsidiary companies have been translated into Ringgit Malaysia as follows: Assets and liabilities - at closing rates Issued capital - at historical rates Revenue and expenses - at average rates Exchange differences due to such currency translation are dealt with through translation reserve account under shareholders’ equity. Such translation gains or losses are recognised as income or expenses in the income statements, in the period in which the operation is disposed of.

Company No.: 308279 A
22
The principal closing rates used in translation of foreign currency amounts and the financial statements of foreign entities are as follows:
2006 2005 RM RM 1 United States Dollar 3.60 3.80 1 Singapore Dollar 2.25 2.33 1 Euro 4.60 4.75 1 Philippines Peso 0.07 0.068 1 Thailand Baht 0.096 0.092 1 Renminbi 0.460 0.459 1 Japanese Yen 0.032 0.035 1 New Taiwan Dollar 0.111 Not applicable
Employee Benefits
i. Short-term benefits
Wages, salaries, bonuses and social contributions are recognised as expenses in the year in which the associated services are rendered by employees of the Group and of the Company. Short term accumulating compensated absences such as paid annual leave are recognised when services are rendered by employees that increase their entitlement to future compensated absences, and short-term non-accumulating compensated absences such as sick leave are recognised when the absences occur.
ii. Defined contribution plans
As required by law, companies in Malaysia make contributions to the state pension scheme, the employees’ provident fund. Such contributions are recognised as expenses in the income statements as incurred.
iii. Equity compensation benefits The Kobay Technology Bhd.’s Employees’ Share Option Scheme allows the Group’s
eligible employees to acquire shares of the Company. No compensation cost or obligation is recognised. When the options are exercised, equity is increased by the amount of the proceeds received.
Research and Development Costs Research and development expenditure is written off as an expense except that certain development expenditure relating to specific projects intended for commercial exploitation and for which there is a clear indication of the marketability of the products being developed, is carried forward. Such deferred development expenditure is amortised over the period in which benefits are expected to be derived commencing in the period in which related sales are first made.

Company No.: 308279 A
23
Property, Plant and Equipment Property, plant and equipment are stated at cost or valuation less accumulated depreciation.
Depreciation of property, plant and equipment except capital-in-progress which is not depreciated, is computed on the straight-line method in order to write off the cost of each asset to its residual value over its estimated useful life.
The annual depreciation rates are as follows: Leasehold land 1.17% - 2% Buildings 1.6% - 2% Factory machinery, moulds and equipment 9% - 20% Furniture, fittings and office equipment 10% - 20% Tools and accessories 10% Motor vehicles 10% - 20% Building improvement and renovation 5% - 20%
As of June 30, 2006, the unexpired lease periods of the long leasehold land and short leasehold land are 80 years, 48 years, 46 years, 45 years and 41 years respectively. The Group carried certain of its short leasehold land and buildings at revalued amounts and placed reliance on the transitional provisions of International Accounting Standards 16 (Revised) as adopted by the Malaysian Accounting Standards Board which provides exemption from the need to make regular revaluations for such assets. Effective from June 30, 1997, no further revaluations were carried out. The aggregate carrying value of such assets as of June 30, 2006 amounted to RM11,812,166 and this amount is depreciated over the remaining useful lives of the relevant assets. An increase in the carrying amount arising from revaluation of property, plant and equipment is credited to the revaluation reserve account as revaluation surplus. Any deficit arising from revaluation is charged against the revaluation reserve account to the extent of a previous surplus held in the revaluation reserve account for the same asset. In all other cases, a decrease in carrying amount is charged to income statements. An increase in revaluation directly related to a previous decrease in carrying amount for that same asset that was recognised as an expense, is credited to income statements to the extent that it offsets the previously recorded decrease. Gain or loss arising from the disposal of an asset is determined as the difference between the net disposal proceeds and the carrying amount of the asset, and is recognised in the income statements. On disposal of revalued assets or crystallisation of deferred tax liabilities on revalued assets, the amounts in revaluation reserve account relating to such assets are transferred to retained profit account. Impairment of Assets At each balance sheet date, the Group and the Company reviews the carrying amounts of assets to determine if there is any indication that those assets may be impaired. If any such indication exists, the asset’s recoverable amount, which is the higher of net selling price and value in use, is estimated.
Company No.: 308279 A
24
Whenever the carrying amount of an asset exceeds its recoverable amount, an impairment loss is recognised in the income statements, unless the asset is carried at revalued amount, in which case, the impairment loss is treated as a revaluation decrease. An impairment loss in respect of goodwill is not reversed unless the loss is caused by a specific external event of an exceptional nature that is not expected to recur and subsequent external events have occurred that reverse the effect of that event. In respect of other assets, an impairment loss is reversed if there has been a change in the estimate used to determine the recoverable amount. An impairment loss is only reversed to the extent that the asset’s carrying amount does not exceed the carrying amount that would have been determined, net of depreciation or amortisation, if no impairment loss had been recognised. A reversal is recognised in the income statements, unless it reverses an impairment loss on revalued assets, in which case, the reversal is treated as a revaluation increase.
Investment in Subsidiary Companies Subsidiary companies are those companies in which the Group has power to exercise control
over the financial and operating policies so as to obtain benefits from their activities. Investment in subsidiary companies, which is eliminated on consolidation, is stated at cost or
at 1997 valuation by the directors on the basis of net tangible asset values of the subsidiary companies as approved by the Securities Commission, less accumulated impairment losses. It was not the intention of the directors then to adopt a policy for revaluation of its long-term investment in subsidiary companies at a regular interval. Accordingly, the Company continues to state its investment in subsidiary companies at its 1997 valuation.
Gain or loss arising from the disposal of an investment is determined as the difference
between the estimated net disposal proceeds and the carrying amount of the investment, and is recognised in the income statements. On disposal of revalued investments, the amounts in revaluation reserve account relating to the investments disposed are transferred to retained profit account.
Investment in Associated Companies An associated company is a non-subsidiary company in which the Group holds not less than
20% of the equity voting rights as long-term investment and in which the Group is in a position to exercise significant influence in its management.
Investment in associated companies is stated at cost in the Company’s financial statements. Where there is an indication of impairment in the value of the asset, the carrying amount of the investment is assessed and written down immediately to its recoverable amount.
The Group’s investment in associated companies is accounted for under the equity method of
accounting based on the latest audited financial statements of the associated companies made up to June 30, 2006. Under this method of accounting, the Group’s interest in the post-acquisition profit and reserves of the associated companies is included in the consolidated results while dividend received is reflected as a reduction of the investment in the consolidated balance sheet.

Company No.: 308279 A
25
Unrealised profits and losses arising on transactions between the Group and its associated companies are eliminated to the extent of the Group’s equity interest in the relevant associated companies except where unrealised losses provide evidence of an impairment of the asset transferred.
Goodwill arising on the acquisition of associated companies is included within the carrying
amount of the associated companies and represents the excess of the cost of acquisition over the Group’s interest in the fair values of the identifiable net assets of associated companies at the date of acquisition.
Other Investments Investments in quoted shares, unquoted shares, structured products, bond and unit trusts are
stated at cost less allowance for diminution in value of investments to recognise any decline, other than a temporary decline, in the value of the investments. Goodwill/ Reserve on Consolidation Goodwill/ reserve arising on consolidation represents the difference between the cost of acquisition over the Group’s interest in the fair values of the identifiable net assets of the subsidiary companies at the date of acquisition. Goodwill is amortised on a straight line basis over a period of 25 years. Inventories Inventories of the Group are valued at the lower of cost and net realisable value. Net realisable value represents the estimated selling price in the ordinary course of business less selling and distribution costs and all other estimated costs to completion. Cost is determined on the first-in, first-out method. Cost of raw materials, consumables and trading goods consists of the purchase price plus cost of bringing the inventories to their present location and condition. Cost of work-in-progress and finished goods consists of cost of raw materials, direct labour and an appropriate proportion of manufacturing overheads. Receivables Receivables are stated at nominal value as reduced by the appropriate allowances for estimated irrecoverable amounts. Allowance for doubtful debts is made based on estimates of possible losses which may arise from non-collection of certain receivables accounts. Borrowings and Payables Borrowings and payables are stated at cost.
Borrowing Costs All interest and other costs incurred in connection with borrowings are expensed as incurred.

Company No.: 308279 A
26
Leasing Leases are classified as finance leases whenever the terms of the lease transfer substantially all the risks and rewards of ownership to the lessee. All other leases are classified as operating leases. Amounts due from lessees under finance leases are recorded as receivables at the amount of the Group’s net investment in the leases. Finance lease income is allocated to accounting periods so as to reflect a constant periodic rate of return on the Group’s net investment outstanding in respect of the leases. Rental income from operating leases is recognised on a straight-line basis over the term of the relevant lease. Assets held under finance leases are recognised as assets of the Group at their fair value at the date of acquisition or, if lower, at the present value of the minimum lease payments. The corresponding liability to the lessor is included in the balance sheets as finance lease obligation. Lease payments are apportioned between finance charges and reduction of the lease obligation so as to achieve a constant rate of interest on the remaining balance of the liability. Finance charges are charged directly against income statements. Rentals payable under operating leases are charged to income statements on a straight-line basis over the term of the relevant lease.
Hire-Purchase Property, plant and equipment acquired under hire-purchase arrangements are capitalised in the financial statements and the corresponding obligations are treated as liabilities. Finance charges are allocated to the income statements to give a constant periodic rate of interest on the remaining hire-purchase liabilities.
Share Capital Ordinary shares are recorded at the nominal value and proceeds in excess of the nominal value of shares issued, if any, are accounted for as share premium. Both ordinary shares and share premium are classified as equity. Cost incurred directly attributable to the issuance of the shares are accounted for as a deduction from share premium, otherwise the cost is charged to the income statements if there is insufficient share premium. Share Buybacks
Shares bought back are retained as treasury shares under the treasury stock method. Shares repurchased and held as treasury shares are accounted for at the cost of repurchase and set off against equity. Where treasury shares are reissued by re-sale in the open market, the difference between the sales consideration and the carrying amount of the treasury shares is shown as a movement in equity. Where treasury shares are distributed as share dividends to shareholders, the cost of the treasury shares is applied in the reduction of the share premium account or the distributable reserves, or both.

Company No.: 308279 A
27
Cash and Cash Equivalents Cash and cash equivalents consist of cash and bank balances, demand deposits and highly
liquid investments which are readily convertible to known amounts of cash and which are subject to an insignificant risk of changes in value.
Financial Instruments Financial instruments carried on the balance sheets include short-term deposits, cash and bank
balances, investments, receivables, payables and borrowings. The particular recognition methods adopted are disclosed in the individual accounting policy statements associated with each item.
Financial instruments are classified as liabilities or equity in accordance with the substance of
the contractual arrangement. Interests, dividends, gains and losses relating to a financial instrument classified as liability are reported as expense or income. Distributions to holders of financial instruments classified as equity are charged directly to equity. Financial instruments are offset when the Group and the Company have a legally enforceable right to set off the recognised amounts and intend either to settle on a net basis, or to realise the asset and settle the liability simultaneously.
Contingent Liabilities A contingent liability is disclosed, unless the possibility of an outflow of resources embodying economic benefits is remote.
4. STAFF COSTS
The Group The Company 2006 2005 2006 2005 RM RM RM RM
Staff costs:
Employees’ provident fund 1,091,441 1,021,963 191,284 186,282 Other staff costs 9,797,578 9,556,886 1,663,716 1,548,575
10,889,019 10,578,849 1,855,000 1,734,857
Number of directors and
employees at end of year:
Directors 19 16 8 8 Employees 302 291 21 21
Staff costs include directors’ remuneration, salaries, bonuses, contributions to employees’
provident fund and all other staff related expenses.
Company No.: 308279 A
28
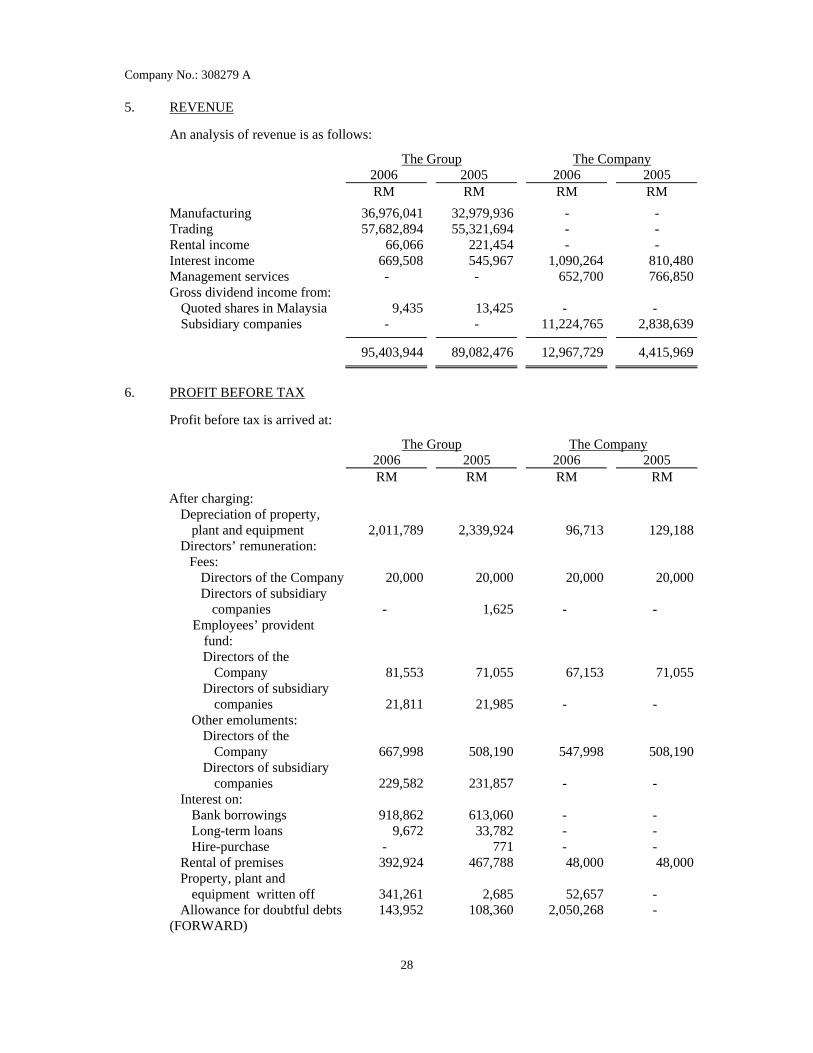
5. REVENUE An analysis of revenue is as follows:
The Group The Company 2006 2005 2006 2005
RM RM RM RM
Manufacturing 36,976,041 32,979,936 - - Trading 57,682,894 55,321,694 - - Rental income 66,066 221,454 - - Interest income 669,508 545,967 1,090,264 810,480Management services - - 652,700 766,850Gross dividend income from:
Quoted shares in Malaysia 9,435 13,425 - - Subsidiary companies - - 11,224,765 2,838,639
95,403,944 89,082,476 12,967,729 4,415,969
6. PROFIT BEFORE TAX Profit before tax is arrived at:
The Group The Company 2006 2005 2006 2005 RM RM RM RM
After charging: Depreciation of property,
plant and equipment 2,011,789
2,339,924
96,713 129,188Directors’ remuneration:
Fees: Directors of the Company 20,000 20,000 20,000 20,000Directors of subsidiary
companies -
1,625
- - Employees’ provident
fund:
Directors of the Company 81,553
71,055
67,153 71,055
Directors of subsidiary companies 21,811
21,985
-
-
Other emoluments: Directors of the
Company 667,998
508,190
547,998
508,190Directors of subsidiary
companies 229,582 231,857 -
-
Interest on: Bank borrowings 918,862 613,060 - - Long-term loans 9,672 33,782 - - Hire-purchase - 771 - -
Rental of premises 392,924 467,788 48,000 48,000Property, plant and
equipment written off 341,261
2,685
52,657
- Allowance for doubtful debts 143,952 108,360 2,050,268 -
(FORWARD)
Company No.: 308279 A
29
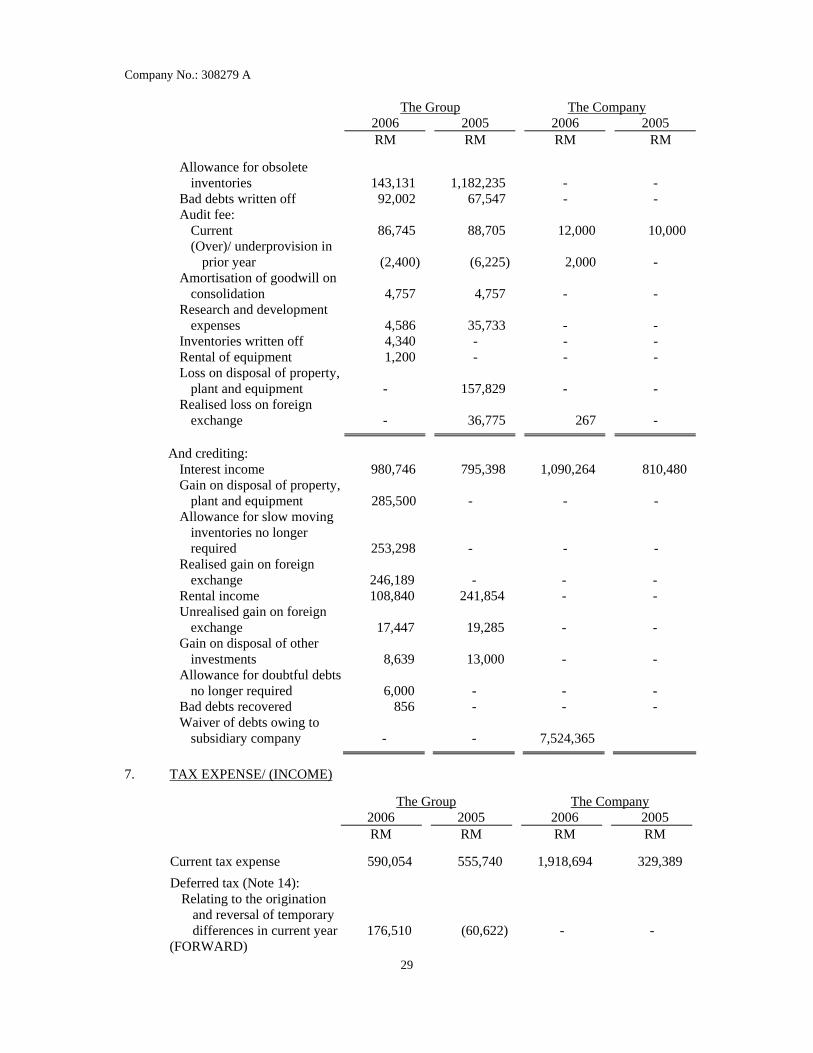
The Group The Company 2006 2005 2006 2005 RM RM RM RM Allowance for obsolete
inventories
143,131
1,182,235
- -
Bad debts written off 92,002 67,547 - - Audit fee:
Current 86,745 88,705 12,000 10,000 (Over)/ underprovision in
prior year (2,400)
(6,225) 2,000
-
Amortisation of goodwill on consolidation
4,757
4,757
-
-
Research and development expenses
4,586
35,733
-
-
Inventories written off 4,340 - - - Rental of equipment 1,200 - - - Loss on disposal of property,
plant and equipment -
157,829
-
-
Realised loss on foreign exchange
-
36,775
267
-
And crediting: Interest income 980,746 795,398 1,090,264 810,480 Gain on disposal of property,
plant and equipment
285,500 -
-
-
Allowance for slow moving inventories no longer required
253,298
-
-
-
Realised gain on foreign exchange
246,189 -
-
-
Rental income 108,840 241,854 - - Unrealised gain on foreign
exchange
17,447
19,285 -
-
Gain on disposal of other investments
8,639
13,000
-
-
Allowance for doubtful debts no longer required
6,000 -
-
-
Bad debts recovered 856 - - - Waiver of debts owing to
subsidiary company
- -
7,524,365
7. TAX EXPENSE/ (INCOME)
The Group The Company 2006 2005 2006 2005 RM RM RM RM Current tax expense 590,054 555,740 1,918,694 329,389
Deferred tax (Note 14): Relating to the origination
and reversal of temporary differences in current year
176,510
(60,622)
-
-
(FORWARD)

Company No.: 308279 A
30
The Group The Company 2006 2005 2006 2005 RM RM RM RM
(Over)/ underprovision in prior years
Current tax expense (25,000) (881,022) 3,558 (902,169)Deferred tax liabilities 7,970 412 - -
(17,030) (880,610) 3,558 (902,169)
749,534 (385,492) 1,922,252 (572,780)Share of tax expense of
associated companies
421,028
52,023
-
-
Tax expense/ (income) 1,170,562 (333,469) 1,922,252 (572,780)
The numerical reconciliations between tax expense/ (income) and the product of accounting profit multiplied by the applicable tax rate are as follows:
The Group The Company 2006 2005 2006 2005 RM RM RM RM
Accounting profit 5,325,642 2,854,023 2,927,715 1,351,299
Tax amount at the statutory
income tax rate of 28%
1,491,000
799,000
820,000
378,000
Tax effects on non-deductible/ (non-taxable) items:
Non-deductible expenses 3,262,804 356,391 4,266,694 216,389 Non-taxable income (3,325,501) (955,963) (2,564,000) (289,000)
Net deferred tax income not recognised
150,000
263,828
-
24,000
Utilisation of deferred tax assets previously not recognised (604,000)
-
(604,000)
-
Effect of different tax rates in subsidiary companies (84,952)
(37,487)
-
-
889,351 425,769 1,918,694 329,389 (Over)/ underprovision of
current tax expense in prior years:
Companies and subsidiaries (25,000) (881,022) 3,558 (902,169)Associated companies 298,053 (72,640) - -
Underprovision of deferred
tax liabilities in prior years:
Subsidiaries 7,970 412 - - Associated companies 188 194,012 - -
Tax expense/ (income) 1,170,562 (333,469) 1,922,252 (572,780)

Company No.: 308279 A
31
The applicable tax rate of 28% (2005: 28%) used in the above numerical reconciliations of tax of the Group and of the Company is determined based on the statutory income tax rate prevailing for the Company.
The estimated amount of tax savings included in net income for 2006 and 2005 as a result of the realisation of carryforward tax losses and unabsorbed tax capital allowances of the Group and of the Company are as follows: The Group and the Company 2006 2005 RM RM Carryforward tax losses 466,000 - Unabsorbed tax capital allowances 151,000 -
As of June 30, 2006, the approximate amount of carryforward tax losses and unabsorbed tax capital allowances of the Group and of the Company, for which no deferred tax assets are recognised in the financial statements, which are available for set off against future taxable income are as follows: The Group The Company 2006 2005 2006 2005 RM RM RM RM Carryforward tax losses 2,873,000 3,841,000 - 1,665,000 Unabsorbed tax capital
allowances
664,000
1,390,000
250,000
789,000
The carryforward tax losses and unabsorbed tax capital allowances are subject to agreement by the tax authorities.
8. EARNINGS PER ORDINARY SHARE
The Group 2006 2005 RM RM Net profit attributable to ordinary shareholders 3,892,934 2,802,888
Units Units Number of shares in issue as of July 1 68,080,750 68,080,750 Effect of repurchase of treasury shares (728,200) (523,842) Weighted average number of ordinary shares in issue 67,352,550 67,556,908
Basic earnings per ordinary share (sen) 5.78 4.15
The diluted earnings per ordinary share in 2006 and 2005 has not been presented as the effect of the assumed conversion of employees’ share option to ordinary shares would be anti-dilutive.

Company No.: 308279 A
32
9. PROPERTY, PLANT AND EQUIPMENT The Group
Cost or Valuation
Beginning
of year
Additions
Written-off/Disposals
Disposal of subsidiary company
Translation
reserve
End
of year RM RM RM RM RM RM 2006: At 1997 valuation:
Short leasehold land
6,095,000
-
-
-
-
6,095,000
Buildings 8,255,000 - - - - 8,255,000At cost:
Long leasehold land
608,286
- (240,000)
-
-
368,286
Short leasehold land
1,300,000
- (1,300,000)
-
-
-
Buildings 6,500,774 - (4,550,565) - - 1,950,209Factory
machinery, moulds and equipment
23,627,116 444,469 (1,102,860)
-
11,226
22,979,951Furniture, fittings
and office equipment
2,899,975 473,502 (515,615)
(12,870)
(24,310)
2,820,682Tools and
accessories
1,351,903 46,426 (339,396) -
-
1,058,933
Motor vehicles 828,445 12,717 (116,373) - 1,271 726,060Building
improvement and renovation
816,110 124,337 (167,084)
-
23,109
796,472Capital-in-
progress
127,220 -
-
-
-
127,220
52,409,829 1,101,451 (8,331,893) (12,870) 11,296 45,177,813
2005 45,910,145 6,767,203 (226,106) - (41,413) 52,409,829
Company No.: 308279 A
33
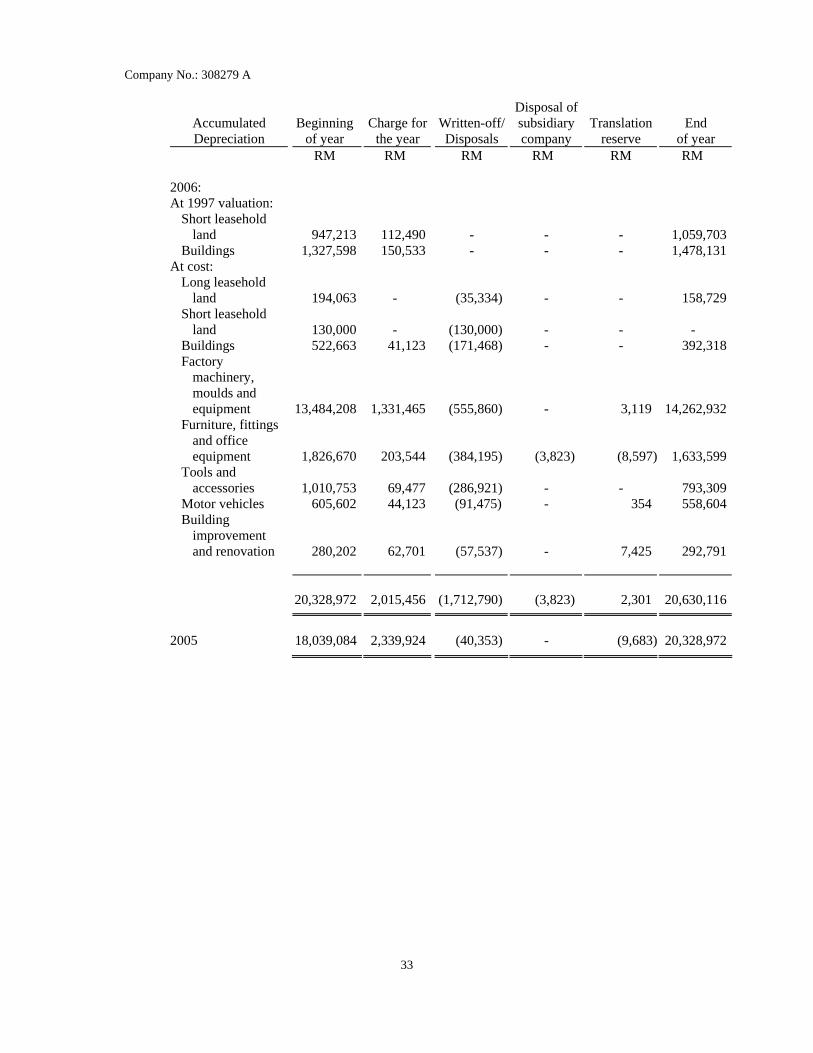
Accumulated Depreciation
Beginning
of year
Charge for
the year
Written-off/Disposals
Disposal of subsidiary company
Translation
reserve
End
of year RM RM RM RM RM RM 2006: At 1997 valuation:
Short leasehold land
947,213 112,490
-
-
- 1,059,703
Buildings 1,327,598 150,533 - - - 1,478,131At cost:
Long leasehold land
194,063
- (35,334)
-
- 158,729
Short leasehold land
130,000
- (130,000)
-
- -
Buildings 522,663 41,123 (171,468) - - 392,318Factory
machinery, moulds and equipment
13,484,208 1,331,465 (555,860)
-
3,119 14,262,932Furniture, fittings
and office equipment
1,826,670 203,544 (384,195)
(3,823)
(8,597) 1,633,599Tools and
accessories
1,010,753 69,477 (286,921) -
- 793,309
Motor vehicles 605,602 44,123 (91,475) - 354 558,604Building
improvement and renovation
280,202 62,701 (57,537)
-
7,425 292,791 20,328,972 2,015,456 (1,712,790) (3,823) 2,301 20,630,116
2005 18,039,084 2,339,924 (40,353) - (9,683) 20,328,972

Company No.: 308279 A
34
The Company
Cost
Beginning of year
Additions
Written-off/ Disposals
End of year
RM RM RM RM 2006:
Furniture and fittings 602,270 237,721 (161,126) 678,865 Tools and accessories 825 - - 825 Motor vehicles 542,168 - - 542,168 Renovation 43,735 - - 43,735
1,188,998 237,721 (161,126) 1,265,593
2005 1,181,176 7,822 - 1,188,998
Accumulated Depreciation
Beginning of year
Charge for the year
Written-off/ Disposals
End of year
RM RM RM RM 2006:
Furniture and fittings 311,631 54,427 (108,436) 257,622 Tools and accessories 730 83 - 813 Motor vehicles 362,161 37,830 - 399,991 Renovation 9,080 4,373 - 13,453
683,602 96,713 (108,436) 671,879
2005 554,414 129,188 - 683,602
The Group The Company 2006 2005 2006 2005
RM RM RM RM Net book value:
At 1997 valuation: Short leasehold land 5,035,297 5,147,787 - - Buildings 6,776,869 6,927,402 - -
At cost: Long leasehold land 209,557 414,223 - - Short leasehold land - 1,170,000 - - Buildings 1,557,891 5,978,111 - - Factory machinery,
moulds and equipment
8,717,019
10,142,908
-
- Furniture, fittings and
office equipment
1,187,083
1,073,305
421,243
290,639 Tools and accessories 265,624 341,150 12 95 Motor vehicles 167,456 222,843 142,177 180,007 Building improvement
and renovation
503,681
535,908
30,282
34,655 Capital-in-progress 127,220 127,220 - -
24,547,697 32,080,857 593,714 505,396
Company No.: 308279 A
35
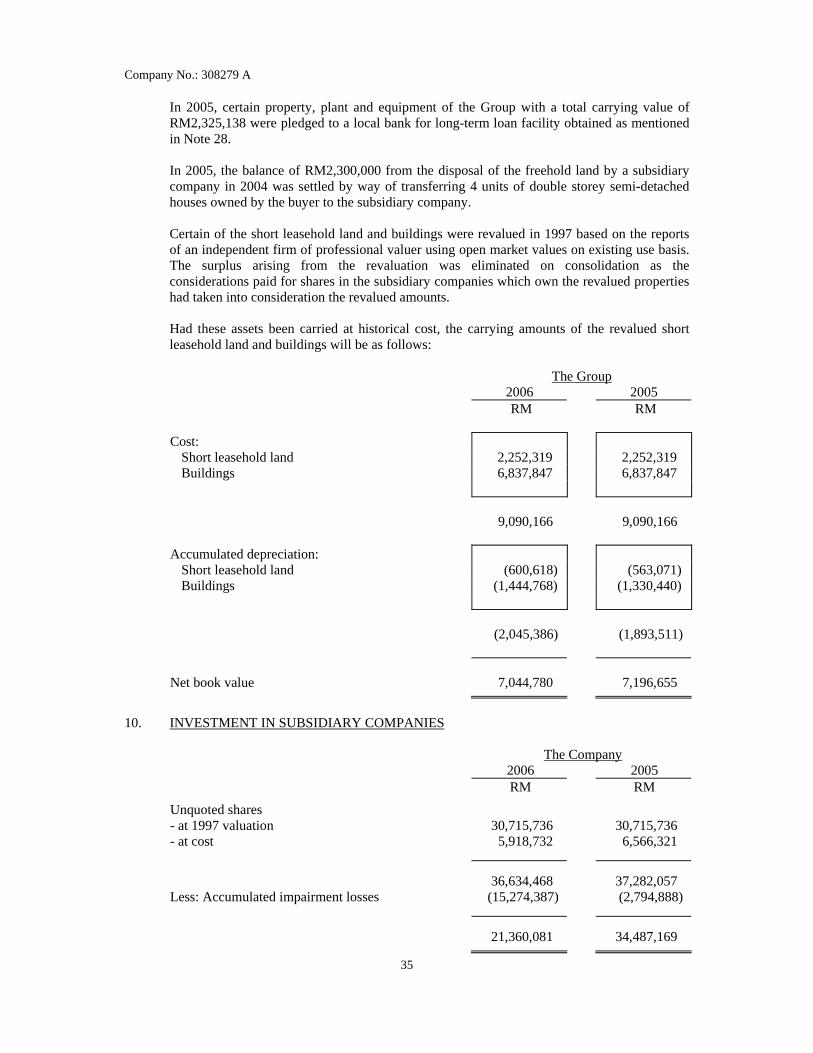
In 2005, certain property, plant and equipment of the Group with a total carrying value of RM2,325,138 were pledged to a local bank for long-term loan facility obtained as mentioned in Note 28. In 2005, the balance of RM2,300,000 from the disposal of the freehold land by a subsidiary company in 2004 was settled by way of transferring 4 units of double storey semi-detached houses owned by the buyer to the subsidiary company.
Certain of the short leasehold land and buildings were revalued in 1997 based on the reports of an independent firm of professional valuer using open market values on existing use basis. The surplus arising from the revaluation was eliminated on consolidation as the considerations paid for shares in the subsidiary companies which own the revalued properties had taken into consideration the revalued amounts.
Had these assets been carried at historical cost, the carrying amounts of the revalued short leasehold land and buildings will be as follows: The Group 2006 2005 RM RM Cost:
Short leasehold land 2,252,319 2,252,319 Buildings 6,837,847 6,837,847
9,090,166 9,090,166 Accumulated depreciation:
Short leasehold land (600,618) (563,071) Buildings (1,444,768) (1,330,440)
(2,045,386) (1,893,511) Net book value 7,044,780 7,196,655
10. INVESTMENT IN SUBSIDIARY COMPANIES The Company
2006 2005 RM RM
Unquoted shares - at 1997 valuation 30,715,736 30,715,736 - at cost 5,918,732 6,566,321 36,634,468 37,282,057 Less: Accumulated impairment losses (15,274,387) (2,794,888) 21,360,081 34,487,169

Company No.: 308279 A
36
Investment in certain subsidiary companies were revalued in 1997 by the directors to the net tangible asset values of the subsidiary companies as of June 30, 1996 and after incorporating the revaluation of landed properties of the subsidiary companies in connection with the initial offer for sales and public flotation of the Company’s shares on the Main Board of Bursa Malaysia Securities. It was not the intention of the directors then to adopt a policy for revaluation of its long-term investment in subsidiary companies at a regular interval. The Company continues to state its investment in subsidiary companies at its 1997 valuation.
The subsidiary companies are as follows:
Direct Subsidiary Companies
Place of Incorporation
Principal Activity
Effective Equity Interest
2006 2005 Kobay Assets Sdn.
Bhd. Malaysia Letting of properties 100% 100%
Megatool Precision
Sdn. Bhd. Malaysia Manufacture of high end steel and
carbide precision parts for tools, dies and moulds and precision tools, dies and moulds. However, the Company has ceased its manufacturing activity during the financial year and currently involve in supply of high end steel and carbide precision parts for tools, dies and moulds and precision tools, dies and moulds
100% 100%
Polytool Automation
Sdn. Bhd. Malaysia Design and manufacture
automated machines and automated machine parts. However, the Company has ceased its manufacturing activities in 2005 and since then did not carry out any further activities.
85% 85%
Polytool Integration
Sdn. Bhd. Malaysia Design and manufacture sawing
machines, vision and inspection machines/ systems, fluid/ epoxy dispensing machines and test handling machines
85% 85%
Kobay Tecnica Sdn.
Bhd. Malaysia Investment holding and providing
management services 61% 61%
A-Pac Multimedia
Sdn. Bhd. Malaysia Investment holding 60% 60%
Elite Paper Trading
Sdn. Bhd. Malaysia Paper trading 55% 55%

Company No.: 308279 A
37
Direct Subsidiary Companies
Place of Incorporation
Principal Activity
Effective Equity Interest
2006 2005
Polytool Industries Sdn. Bhd.*
Malaysia Manufacturing of carbide tooling parts and automated machines. However, in 2005, the Company has ceased its manufacturing activity.
100% 100%
Bend Weld
Engineering Sdn. Bhd.*
Malaysia Manufacturing of all types of metal works and equipment
100% 100%
Polytool Precision
Sdn. Bhd.* Malaysia Supply of industrial equipment,
machinery parts, precision tools, dies, moulds, automation equipment and parts for electrical, electronics and other industries; and all types of engineering part and components
100% 100%
Unitedprise Sdn. Bhd.*
Malaysia General trading 100% 100%
Polytool Technologies Sdn. Bhd.*
Malaysia Manufacturing of measuring devices, industrial equipment, machinery parts and tooling
100% 100%
Opar Holdings Sdn. Bhd.*
Malaysia Investment holding 100% 100%
Kewjaya Sdn. Bhd.* Malaysia Money lending and leasing 100% 100%
Polytool Metal Sdn. Bhd.*
Malaysia Manufacture and sales of cold forging parts
60% 60%
Polytool Systems Sdn. Bhd. (formerly known Paradigm Precision Industries Sdn. Bhd.) *
Malaysia Designing and developing software for automation solution
100% -
Megatool Precision (Suzhou) Co., Ltd.*
China Manufacture, designing, sale and after-sale service of precision mould and monotype precise tool and fittings
100% 100%
Polytool Industries (Thailand) Limited*
Thailand Manufacturing and assembly service of mould and die and jig and fixture. The Company had been struck off from the register of Civil and Commercial Code of Thailand on June 21, 2006
- 100%
Polytool Industries Phils., Inc.*
Philippines Manufacture of mould parts, trim, form die parts, jigs and fixtures. However, the Company has ceased operations and became dormant during the year.
100% 100%

Company No.: 308279 A
38
Indirect Subsidiary Companies
Place of Incorporation
Principal Activity
Effective Equity Interest
2006 2005 Subsidiary companies
of Kobay Tecnica Sdn. Bhd.:
Kobay Tecnica
Manufacturing Sdn. Bhd.
Malaysia Manufacture various types of computer numeric controlled machines
61% 61%
KT Machine Tools
Sdn. Bhd. Malaysia Servicing and trading of
machinery and machine tools. However, the Company has ceased operations and became dormant during the year. Currently, the Company plans to strike off the Company’s name under Section 308 of the Companies Act, 1965
42.70% 42.70%
* The financial statements of these subsidiary companies were audited by other firms of
auditors.
On March 28, 2006, the Company acquired 100% equity interest in Polytool Systems Sdn. Bhd. (formerly known as Paradigm Precision Industries Sdn. Bhd.) (“PS”) comprising 2 ordinary shares of RM1 each for a cash consideration of RM1,800.
Subsequent to year end, the Company’s equity interest in PS reduced from 100% to 85% by
virtue of the increase in the issued and paid up share capital of PS by way of its allotment of new shares to a director of a subsidiary company and third party. The effect of acquisition of Polytool Systems Sdn. Bhd. (formerly known Paradigm Precision Industries Sdn. Bhd.) on the financial results of the Group for 2006 is as follows: Post-acquisition results of subsidiary company acquired: The Group RM Operating costs 3,713 Decrease in Group profit attributable to shareholders 3,713
Company No.: 308279 A
39
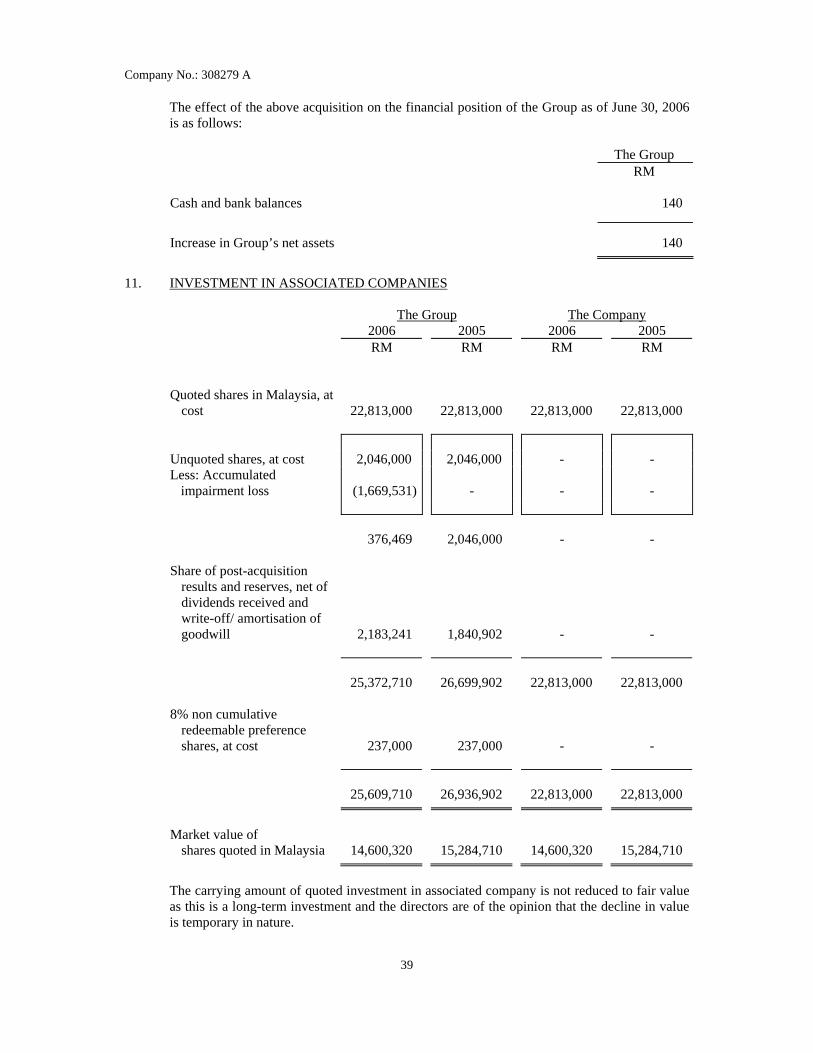
The effect of the above acquisition on the financial position of the Group as of June 30, 2006 is as follows: The Group RM Cash and bank balances 140 Increase in Group’s net assets 140
11. INVESTMENT IN ASSOCIATED COMPANIES
The Group The Company 2006 2005 2006 2005 RM RM RM RM Quoted shares in Malaysia, at
cost
22,813,000
22,813,000
22,813,000
22,813,000 Unquoted shares, at cost 2,046,000 2,046,000 - - Less: Accumulated
impairment loss
(1,669,531)
-
-
- 376,469 2,046,000 - - Share of post-acquisition
results and reserves, net of dividends received and write-off/ amortisation of goodwill
2,183,241
1,840,902
-
-
25,372,710 26,699,902 22,813,000 22,813,000 8% non cumulative
redeemable preference shares, at cost
237,000
237,000
-
-
25,609,710 26,936,902 22,813,000 22,813,000
Market value of
shares quoted in Malaysia 14,600,320 15,284,710 14,600,320 15,284,710
The carrying amount of quoted investment in associated company is not reduced to fair value as this is a long-term investment and the directors are of the opinion that the decline in value is temporary in nature.
Company No.: 308279 A
40
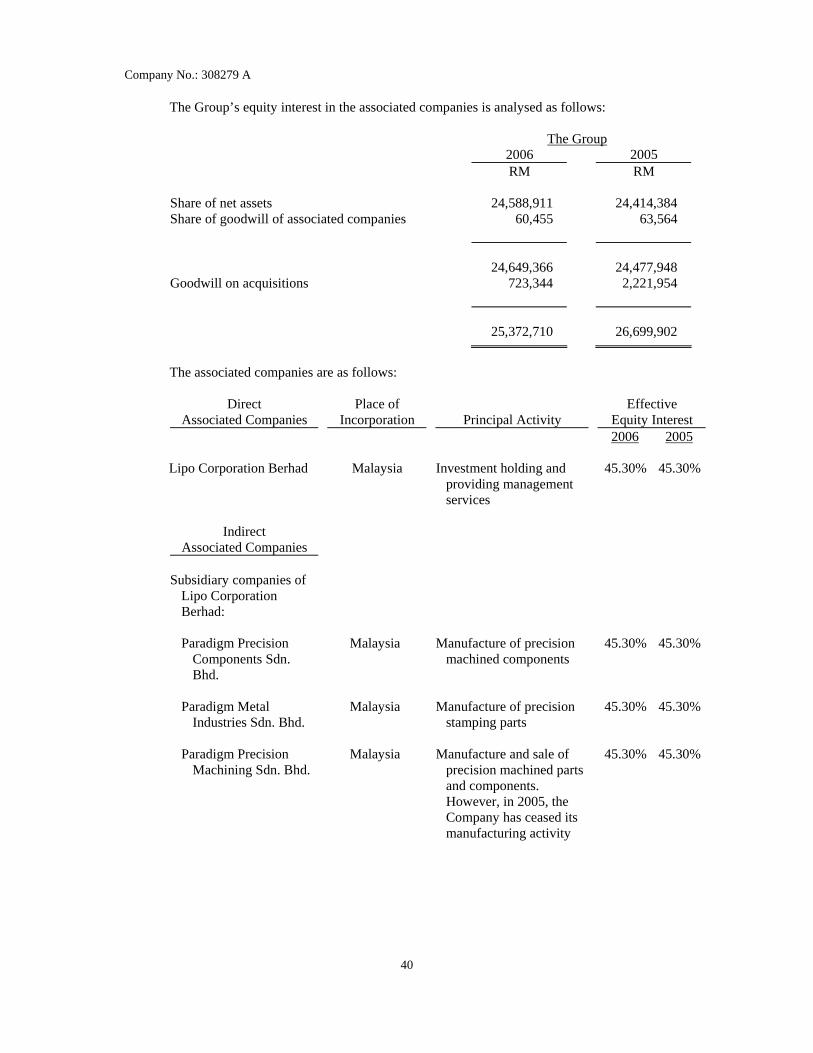
The Group’s equity interest in the associated companies is analysed as follows:
The Group 2006 2005 RM RM Share of net assets 24,588,911 24,414,384 Share of goodwill of associated companies 60,455 63,564 24,649,366 24,477,948 Goodwill on acquisitions 723,344 2,221,954 25,372,710 26,699,902
The associated companies are as follows:
Direct Associated Companies
Place of Incorporation
Principal Activity
Effective Equity Interest
2006 2005 Lipo Corporation Berhad Malaysia Investment holding and
providing management services
45.30% 45.30%
Indirect
Associated Companies
Subsidiary companies of
Lipo Corporation Berhad:
Paradigm Precision
Components Sdn. Bhd.
Malaysia Manufacture of precision machined components
45.30% 45.30%
Paradigm Metal
Industries Sdn. Bhd. Malaysia Manufacture of precision
stamping parts 45.30% 45.30%
Paradigm Precision
Machining Sdn. Bhd. Malaysia Manufacture and sale of
precision machined parts and components. However, in 2005, the Company has ceased its manufacturing activity
45.30% 45.30%

Company No.: 308279 A
41
Indirect Associated Companies
Place of Incorporation
Principal Activity
Effective Equity Interest
2006 2005
Lipo Resources Sdn. Bhd. Malaysia Investment holding 45.30% 45.30% Paradigm Precision
Components (Thailand) Ltd.
Thailand Manufacture of metal products attribute from machining
45.30% 45.30%
Lipo Precision Industry
(Suzhou) Co., Ltd. China Manufacture of precision
machined parts 45.30% 45.30%
Micro Surface Treatment Sdn. Bhd.
Malaysia Precision plating and surface treatment
39.86% 39.86%
Paradigm Precision
Industries Sdn. Bhd. Malaysia Dormant - 45.30%
Associated company of A-
Pac Multimedia Sdn. Bhd.:
Penang Network Services
Sdn. Bhd. Malaysia Provide a state-of-the-art
multimedia visual network via internet and/ or private network
35.88% 35.88%
Subsidiary companies of Penang Network Services Sdn. Bhd.:
Penang Network
Technologies Sdn. Bhd.
Malaysia Provider of system integration, internet value-added services and trading of related products
30.50% 30.50%
Moset Sdn. Bhd. Malaysia Provider of strategic on-
line marketplace 25.12% 25.12%
Global Electronic Trade
Technologies Sdn. Bhd.
Malaysia Provider of hosted Rosetta Net e-supply chain management services and solutions
35.88% 35.88%

Company No.: 308279 A
42
12. OTHER INVESTMENTS The Group The Company
2006 2005 2006 2005 RM RM RM RM At cost:
Investment in: Shares quoted in Malaysia 234,006 361,404 - - Unquoted shares 3,364,680 3,364,680 3,233,046 3,233,046 Bond 988,781 - 988,781 - Structured products 1,500,000 - 1,500,000 - Unit trusts 650,000 300,000 500,000 -
6,737,467 4,026,084 6,221,827 3,233,046 Less: Allowance for
diminution in value of investment in unquoted shares (3,092,046)
(3,092,046)
(3,092,046)
(3,092,046)
3,645,421 934,038 3,129,781 141,000
Market value of: Shares quoted in Malaysia 152,157 294,573 - - Bond 1,000,000 - 1,000,000 - Structured products 1,501,482 - 1,501,482 - Unit trusts 641,481 273,435 504,010 -
3,295,120 568,008 3,005,492 -
The Group and the Company invest in structured products which represent the interest rate range accrual investment. The principal amount of investment is protected if held to maturity after a period of two (2) years from the date of investment. All the structured products investments by the Group and the Company will reach their maturity in March 2008. The annual effective interest rate of the structured products is 5.15%.
The carrying amounts of investment in quoted shares and unit trusts of the Group are not reduced to fair value as these are long-term investments and the directors are of the opinion that the decline in value is temporary in nature.
13. DEVELOPMENT COSTS
The Group 2006 2005 RM RM At cost:
At beginning of year 109,385 109,385 Capitalised during the year 402,273 -
At end of year 511,658 109,385
Included in development costs incurred during the year is depreciation of property, plant and equipment of RM3,667 (2005: Nil).
Company No.: 308279 A
43
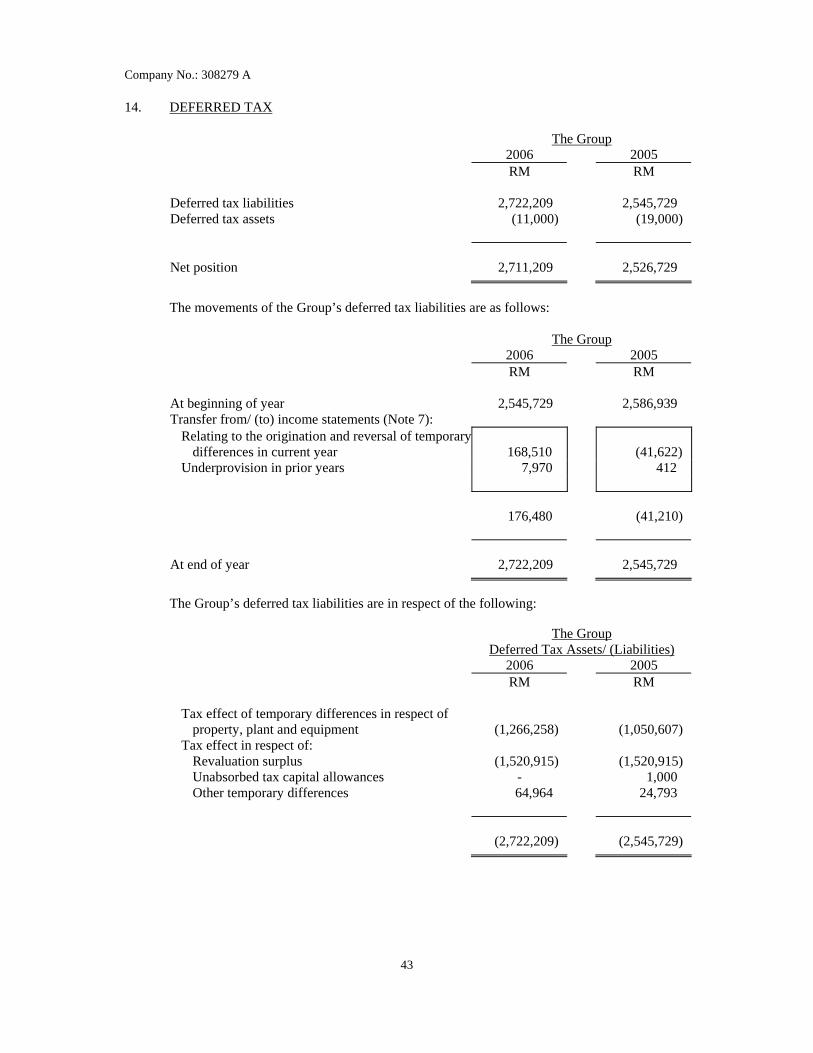
14. DEFERRED TAX
The Group 2006 2005 RM RM Deferred tax liabilities 2,722,209 2,545,729 Deferred tax assets (11,000) (19,000) Net position 2,711,209 2,526,729
The movements of the Group’s deferred tax liabilities are as follows:
The Group 2006 2005 RM RM At beginning of year 2,545,729 2,586,939 Transfer from/ (to) income statements (Note 7):
Relating to the origination and reversal of temporarydifferences in current year
168,510
(41,622)
Underprovision in prior years 7,970 412 176,480 (41,210) At end of year 2,722,209 2,545,729
The Group’s deferred tax liabilities are in respect of the following:
The Group Deferred Tax Assets/ (Liabilities) 2006 2005 RM RM
Tax effect of temporary differences in respect of property, plant and equipment
(1,266,258)
(1,050,607)
Tax effect in respect of: Revaluation surplus (1,520,915) (1,520,915) Unabsorbed tax capital allowances - 1,000 Other temporary differences 64,964 24,793
(2,722,209) (2,545,729)

Company No.: 308279 A
44
The movement of the Group’s deferred tax assets is as follows: The Group 2006 2005 RM RM At beginning of year (19,000) - Transfer from/ (to) income statements (Note 7):
Relating to the origination and reversal of temporary differences in current year
8,000
(19,000)
At end of year (11,000) (19,000)
The Group’s deferred tax assets are in respect of the following:
The Group Deferred Tax Assets/ (Liabilities) 2006 2005 RM RM Tax effect of temporary differences in respect of
property, plant and equipment
(36,000)
(27,000) Tax effect of other temporary differences 47,000 46,000 11,000 19,000
As mentioned in Note 3, deferred tax asset is recognised to the extent that it has become probable that future taxable profit will allow the deferred tax asset to be recovered. As of June 30, 2006, the amount of estimated net deferred tax assets of the Group and of the Company calculated at applicable tax rates which are not recognised in the financial statements, are as follows: Deferred Tax Assets/ (Liabilities) The Group The Company 2006 2005 2006 2005 RM RM RM RM Tax effect of temporary
differences in respect of property, plant and equipment
(22,000)
(139,000)
(70,000)
(83,000)Tax effect in respect of:
Carryforward tax losses 574,000 901,000 - 466,000 Unabsorbed tax capital
allowances
84,000
340,000
70,000
221,000 Other temporary differences 27,000 15,000 - -
663,000 1,117,000 - 604,000

Company No.: 308279 A
45
15. GOODWILL ON CONSOLIDATION
The Group 2006 2005 RM RM At cost:
At beginning of year 118,922 118,922 Goodwill on consolidation arising from the
acquisition of a subsidiary company 2,535
-
At end of year 121,457 118,922
Cumulative amortisation:
At beginning of year (38,497) (33,740) Amortisation during the year (4,757) (4,757) At end of year (43,254) (38,497)
78,203 80,425
16. INVENTORIES
The Group 2006 2005 RM RM At cost:
Raw materials 1,704,884 1,307,146 Work-in-progress 6,387,272 2,246,378 Finished goods 5,087,964 3,394,135 Trading goods 7,335,943 10,016,110 Consumables 50,767 73,637 Goods-in-transit 1,804,619 1,182,675
22,371,449 18,220,081
17. TRADE RECEIVABLES
The Group 2006 2005 RM RM Trade receivables 25,953,928 21,109,308 Less: Allowance for doubtful debts (760,153) (652,628)
25,193,775 20,456,680

Company No.: 308279 A
46
Trade receivables comprise amounts receivable for the sales of goods. The credit periods granted to customers of the Group range from 7 to 120 days (2005: 30 to 90 days). An allowance has been made for estimated irrecoverable amounts of RM760,153 (2005: RM652,628). The allowance has been determined by reference to past default experience.
Analysis of trade receivables by currencies: The Group
2006 2005 RM RM Ringgit Malaysia 21,279,761 18,726,938 United States Dollar 2,238,452 1,077,897 Renminbi 1,057,313 353,886 Euro 448,454 180,464 Singapore Dollar 159,930 - Philippines Peso 9,865 117,495
25,193,775 20,456,680
18. FINANCE LEASE RECEIVABLES
The Group
Minimum Lease Payments Present Value of Minimum
Lease Payments 2006 2005 2006 2005 RM RM RM RM Not later than 1 year - 5,825 - 5,585 Less: Unearned finance
income - (240)
-
-
Present value of minimum lease payments receivables
-
5,585
-
5,585
Analysed as:
The Group 2006 2005 RM RM
Not later than 1 year - 5,585
The Group enters into finance leasing arrangements for certain of its equipment. The average
term of finance leases entered into is 6 years. The effective interest rate on finance lease receivables is 10.2% (2005: 10.2%) per annum. Interest rate is fixed at the inception of the lease. All finance leases are on a fixed repayment basis and no arrangements have been entered into for contingent rental payment.

Company No.: 308279 A
47
19. LOAN RECEIVABLES
The loan receivables are repayable as follows: The Group 2006 2005 RM RM Not later than 1 year 644,580 1,165,825 Less: Unearned finance income (34,893) (82,069) Net investment in loan receivables 609,687 1,083,756
The net investment in loan receivables are repayable as follows:
The Group 2006 2005 RM RM Not later than 1 year 609,687 1,083,756
Included in net investment in loan receivables is an amount owing by a related party, Penang
Network Technologies Sdn. Bhd., a subsidiary company of associated company, Penang Network Services Sdn. Bhd. of RM131,205 (2005: RM150,000) which is unsecured, bears interest at a rate of 12% per annum and have no fixed term of repayment.
The interest rates of loan receivables range from 6% to 18% (2005: 6% to 18%) per annum. 20. OTHER RECEIVABLES AND PREPAID EXPENSES
The Group The Company 2006 2005 2006 2005 RM RM RM RM Other receivables 2,702,437 2,554,909 2,176,746 2,185,551 Less: Allowance for doubtful
debts (1,973,597)
(1,973,597)
(1,973,597) (1,973,597) 728,840 581,312 203,149 211,954 Refundable deposits 106,928 172,378 10,612 50,612 Prepaid expenses 376,839 346,113 6,000 - Interest receivable 56,797 - 55,410 - 1,269,404 1,099,803 275,171 262,566

Company No.: 308279 A
48
Analysis of other receivables by currencies:
The Group The Company 2006 2005 2006 2005
RM RM RM RM Ringgit Malaysia 513,099 434,954 203,149 211,954 Renminbi 197,743 128,519 - - Philippines Peso 17,998 12,584 - - United States Dollar - 4,751 - - Thailand Baht - 504 - - 728,840 581,312 203,149 211,954
21. AMOUNT OWING BY/ (TO) SUBSIDIARY COMPANIES The amount owing by/ (to) subsidiary companies are as follows:
The Company 2006 2005 RM RM Amount owing by subsidiary companies:
Kewjaya Sdn. Bhd. 6,815,499 3,444,098 Elite Paper Trading Sdn. Bhd. 3,640,303 6,655,098 A-Pac Multimedia Sdn. Bhd. 1,557,891 1,557,891 Opar Holdings Sdn. Bhd. 1,088,119 1,088,119 Polytool Integration Sdn. Bhd. 722,980 718,440 Megatool Precision (Suzhou) Co., Ltd. 642,799 633,875 Unitedprise Sdn. Bhd. 583,000 583,000 Polytool Precision Sdn. Bhd. 558,026 1,880,000 Polytool Industries Phils., Inc. 492,377 493,643 Polytool Metal Sdn. Bhd. 247,113 236,307 Kobay Assets Sdn. Bhd. 94,080 94,080 Polytool Technologies Sdn. Bhd. 23,675 421,318 Kobay Tecnica Manufacturing Sdn. Bhd. 9,000 - Polytool Systems Sdn. Bhd. 3,587 - Kobay Tecnica Sdn. Bhd. - 124,010 Polytool Industries (Thailand) Limited - 109,277 Megatool Precision Sdn. Bhd. - 8,206 16,478,449 18,047,362 Less: Allowance for doubtful debts (2,050,268) -
14,428,181 18,047,362

Company No.: 308279 A
49
The Company 2006 2005 RM RM Amount owing to subsidiary companies:
Polytool Industries Sdn. Bhd. 1,000,004 8,586,586 Polytool Automation Sdn. Bhd. 272,000 272,000 Megatool Precision Sdn. Bhd. 241,360 -
1,513,364 8,858,586
The amount owing by/ (to) subsidiary companies arose mainly from advances which are
unsecured, interest free and have no fixed term of repayment except for the amount owing by Kewjaya Sdn. Bhd. and Elite Paper Trading Sdn. Bhd. which bear interest at a rate of 6% per annum.
Analysis of amount owing by subsidiary companies by currencies:
The Company 2006 2005 RM RM
Ringgit Malaysia 13,293,005 16,810,567 Renminbi 642,799 633,875 Philippines Peso 492,377 493,643 Thailand Baht - 109,277
14,428,181 18,047,362
Significant transactions between the Company and its subsidiary companies during the
financial year and the outstanding balances arising from such transactions were as follows:
The Company
2006
Amount outstanding as of June 30, 2006
2005
Amount outstanding as of June 30, 2005
RM RM RM RM Gross dividends received/
receivable from:
Kobay Assets Sdn. Bhd. 3,145,000 - 1,001,200 - Bend Weld Engineering
Sdn. Bhd.
1,555,000
-
850,000
- Megatool Precision Sdn.
Bhd.
4,793,765
-
531,989
- Elite Paper Trading Sdn.
Bhd.
231,000
-
231,000
- Polytool Automation Sdn.
Bhd.
-
-
224,400
- Polytool Technologies Sdn.
Bhd.
1,500,000
-
-
-
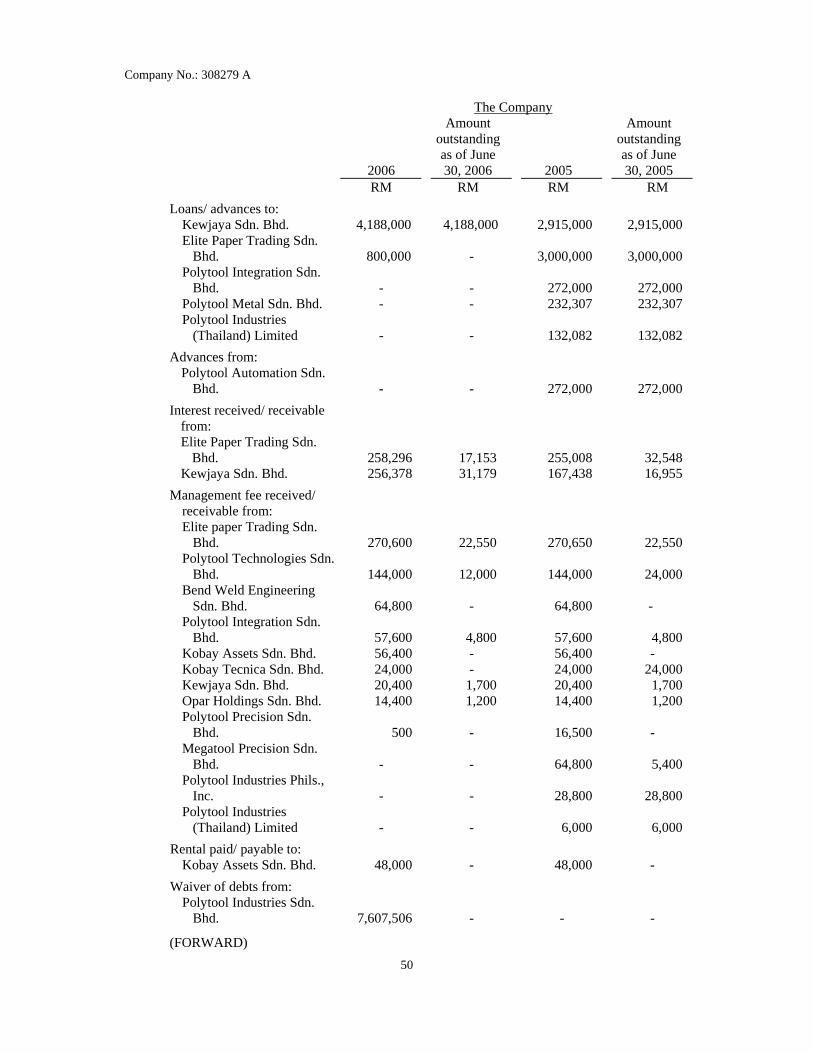
Company No.: 308279 A
50
The Company
2006
Amount outstanding as of June 30, 2006
2005
Amount outstanding as of June 30, 2005
RM RM RM RM
Loans/ advances to: Kewjaya Sdn. Bhd. 4,188,000 4,188,000 2,915,000 2,915,000 Elite Paper Trading Sdn.
Bhd.
800,000
-
3,000,000
3,000,000 Polytool Integration Sdn.
Bhd.
-
-
272,000
272,000 Polytool Metal Sdn. Bhd. - - 232,307 232,307 Polytool Industries
(Thailand) Limited
-
-
132,082
132,082
Advances from: Polytool Automation Sdn.
Bhd.
-
-
272,000
272,000
Interest received/ receivable from:
Elite Paper Trading Sdn. Bhd.
258,296
17,153
255,008
32,548
Kewjaya Sdn. Bhd. 256,378 31,179 167,438 16,955
Management fee received/ receivable from:
Elite paper Trading Sdn. Bhd.
270,600
22,550
270,650
22,550
Polytool Technologies Sdn. Bhd.
144,000
12,000
144,000
24,000
Bend Weld Engineering Sdn. Bhd.
64,800
-
64,800
-
Polytool Integration Sdn. Bhd.
57,600
4,800
57,600
4,800
Kobay Assets Sdn. Bhd. 56,400 - 56,400 - Kobay Tecnica Sdn. Bhd. 24,000 - 24,000 24,000 Kewjaya Sdn. Bhd. 20,400 1,700 20,400 1,700 Opar Holdings Sdn. Bhd. 14,400 1,200 14,400 1,200 Polytool Precision Sdn.
Bhd.
500 -
16,500
-
Megatool Precision Sdn. Bhd.
-
-
64,800
5,400
Polytool Industries Phils., Inc.
-
-
28,800
28,800
Polytool Industries (Thailand) Limited
-
-
6,000
6,000
Rental paid/ payable to: Kobay Assets Sdn. Bhd. 48,000 - 48,000 -
Waiver of debts from: Polytool Industries Sdn.
Bhd.
7,607,506 -
-
-
(FORWARD)

Company No.: 308279 A
51
The Company
2006
Amount outstanding as of June 30, 2006
2005
Amount outstanding as of June 30, 2005
RM RM RM RM Waiver of debts to:
Polytool Industries (Thailand) Limited
83,141
-
-
-
Allowance for doubtful debts for amount owing by:
A-Pac Multimedia Sdn. Bhd.
1,557,891
-
-
-
Polytool Industries (Philps.) Inc.
492,377
-
-
-
The above transactions have been entered into in the normal course of business and have been established under mutually agreed terms arranged with the subsidiary companies.
22. AMOUNT OWING BY/ (TO) AN ASSOCIATED COMPANY
The amount owing by an associated company, Penang Network Services Sdn. Bhd. arose mainly from advances which are unsecured, interest free and have no fixed term of repayment.
The amount owing by/ (to) an associated company, Lipo Corporation Berhad in 2005 arose mainly from trade transactions and advances which are unsecured, interest free and have no fixed term of repayment.
Significant transactions between the Group and the associated company during the financial year were as follows: The Group 2006 2005 RM RM Lipo Corporation Berhad
Sales of finished goods 151,124 115,900 Rental received/ receivable 48,000 48,000
The above transactions have been entered into in the normal course of business and have been established under mutually agreed terms arranged with the associated company.
23. SHORT-TERM DEPOSITS WITH LICENSED BANKS
Included in short-term deposits of the Group and of the Company are amounts of RM665,605 (2005: RM614,881) and RM8,000 (2005: RM8,000) respectively which are pledged to local banks for bank guarantee facilities obtained by the Group and by the Company.
The annual effective interest rates are as follows:
The Group The Company 2006 2005 2006 2005 % % % % Short-term deposits with
licensed banks
2.30 - 3.70
2.50 - 3.70
2.50 - 3.00
2.50 - 3.00
The short-term deposits with licensed banks are maturing within July 2006 to January 2007.

Company No.: 308279 A
52
24. TRADE PAYABLES Trade payables of the Group comprise amounts outstanding for trade purchases. The credit
periods granted to the Group for trade purchases range from 30 to 90 days (2005: 7 to 120 days).
Analysis of trade payables by currencies:
The Group 2006 2005
RM RM
Ringgit Malaysia 3,994,469 2,693,057 United States Dollar 217,631 - Renminbi 145,849 47,445 Japanese Yen 83,281 48,192 Philippines Peso - 16,474 Singapore Dollar - 1,956 Thailand Baht - 1,269
4,441,230 2,808,393
25. OTHER PAYABLES AND ACCRUED EXPENSES
The Group The Company 2006 2005 2006 2005 RM RM RM RM
Other payables 3,538,892 1,509,660 10,523 16,091 Accrued expenses 2,068,175 1,178,500 260,024 228,055 Deposits received - 327,800 - -
5,607,067 3,015,960 270,547 244,146
Other payables of the Group and of the Company comprise mainly amounts outstanding for ongoing costs.
Analysis of other payables and accrued expenses by currencies:
The Group The Company 2006 2005 2006 2005
RM RM RM RM
Ringgit Malaysia 3,932,403 2,898,311 270,547 244,146 Euro 770,519 - - - United States Dollar 553,410 - - - Renminbi 346,303 107,754 - - Philippines Peso 4,432 8,361 - - Thailand Baht - 1,534 - -
5,607,067 3,015,960 270,547 244,146
26. AMOUNT OWING TO A DIRECTOR OF SUBSIDIARY COMPANY The amount owing to a director of subsidiary company arose mainly from advances which are
unsecured, interest free and have no fixed term of repayment.

Company No.: 308279 A
53
27. BANK BORROWINGS
The Group 2006 2005 RM RM Unsecured:
Bankers’ acceptance 5,830,000 4,510,000 Trust receipts 9,739,394 9,400,900
15,569,394 13,910,900
The bankers’ acceptance and trust receipts are maturing within July 2006 to December 2006.
The Group has banking facilities obtained from local licensed banks which are covered by: i. corporate guarantee from the Company; ii. negative pledges over fixed and floating assets of a subsidiary company both present
and future; and iii. personal guarantees by a director of a subsidiary company. The bankers’ acceptance bears acceptance commission at rates ranging from 1.0% to 1.75% per annum above the prevailing interbank rate while the trust receipts bear interest at a rate of 1.75% per annum above the lending bank’s base lending rate. The effective interest rates are as follows: The Group 2006 2005 % %
Bankers’ acceptance 4.46 - 6.05 3.83 - 5.20 Trust receipts 6.30 - 7.75 4.75 - 5.53
28. LONG-TERM LOAN
The Group 2006 2005 RM RM Secured:
Amount outstanding - 314,245 Less: Portion due within one year - (314,245)
Non-current portion - -
In 2005, the long-term loan was secured by a legal charge on a subsidiary company’s short leasehold land and factory building and covered by a corporate guarantee from the Company. The long-term loan bears interest at a rate of 6.9% flat per annum effective October 1, 2002 and was repayable by 72 monthly installment of RM29,418 (inclusive of interest) each commencing April 2000. The effective interest rate of the long-term loan is 6.9% (2005: 6.9%).
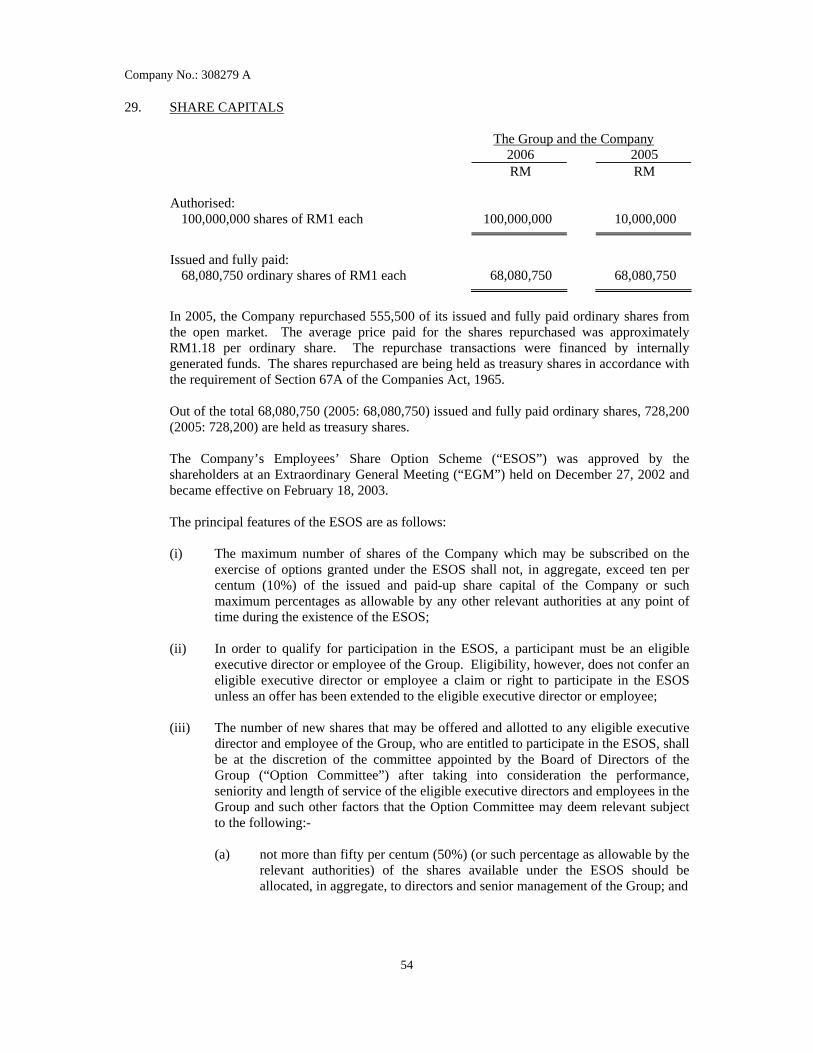
Company No.: 308279 A
54
29. SHARE CAPITALS
The Group and the Company 2006 2005 RM RM
Authorised: 100,000,000 shares of RM1 each 100,000,000 10,000,000
Issued and fully paid:
68,080,750 ordinary shares of RM1 each 68,080,750 68,080,750
In 2005, the Company repurchased 555,500 of its issued and fully paid ordinary shares from the open market. The average price paid for the shares repurchased was approximately RM1.18 per ordinary share. The repurchase transactions were financed by internally generated funds. The shares repurchased are being held as treasury shares in accordance with the requirement of Section 67A of the Companies Act, 1965. Out of the total 68,080,750 (2005: 68,080,750) issued and fully paid ordinary shares, 728,200 (2005: 728,200) are held as treasury shares. The Company’s Employees’ Share Option Scheme (“ESOS”) was approved by the shareholders at an Extraordinary General Meeting (“EGM”) held on December 27, 2002 and became effective on February 18, 2003.
The principal features of the ESOS are as follows:
(i) The maximum number of shares of the Company which may be subscribed on the
exercise of options granted under the ESOS shall not, in aggregate, exceed ten per centum (10%) of the issued and paid-up share capital of the Company or such maximum percentages as allowable by any other relevant authorities at any point of time during the existence of the ESOS;
(ii) In order to qualify for participation in the ESOS, a participant must be an eligible
executive director or employee of the Group. Eligibility, however, does not confer an eligible executive director or employee a claim or right to participate in the ESOS unless an offer has been extended to the eligible executive director or employee;
(iii) The number of new shares that may be offered and allotted to any eligible executive
director and employee of the Group, who are entitled to participate in the ESOS, shall be at the discretion of the committee appointed by the Board of Directors of the Group (“Option Committee”) after taking into consideration the performance, seniority and length of service of the eligible executive directors and employees in the Group and such other factors that the Option Committee may deem relevant subject to the following:-
(a) not more than fifty per centum (50%) (or such percentage as allowable by the
relevant authorities) of the shares available under the ESOS should be allocated, in aggregate, to directors and senior management of the Group; and

Company No.: 308279 A
55
(b) not more than ten per centum (10%) (or such percentage as allowable by the relevant authorities) of the shares available under the ESOS should be allocated to any individual director or employee who, either singly or collectively through his/her associates (as defined in the Companies Act, 1965), holds twenty per centum (20%) or more in the issued and paid-up share capital of the Company;
provided always that it is in accordance with any prevailing guidelines issued by the Securities Commission (“SC”) or any other relevant authorities as amended from time to time;
(iv) The ESOS shall continue to be in force for a period of ten (10) years and expiring on
February 17, 2013; (v) The price payable upon exercise of each of the option share granted under the ESOS
shall be set based on the 5-days weighted average market price of the Company’s shares, as quoted on the Bursa Malaysia Securities, immediately preceding the date the option is granted, with a discount of not more than ten per centum (10%), if deemed appropriate, or such lower or higher limit in accordance with any prevailing guidelines issued by the SC or any other relevant authorities as amended from time to time, or at the par value of each of the share of the Company, whichever is higher; and
(vi) The new shares to be allotted and issued upon exercise of any option shall upon
allotment rank pari passu in all respects with the existing issued and paid-up shares of the Company except that the new shares so allotted shall not be entitled to any dividend, rights, allotment or other distribution unless the shares so allotted have been credited into the relevant securities accounts maintained by Bursa Malaysia Depository Sdn. Bhd. before the entitlement date and will be subject to all the provisions of the Articles of Association of the Company relating to the transfer, transmission or otherwise of the shares of the Company.
The share options granted and exercised during the financial year are as follows:
No. of options over ordinary shares of RM1 each
Exercisable
from
Exercise price per ordinary
share
Balance as of
1.7.2005
Granted
Exercised
Lapsed
Balance as of
30.6.2006 RM February 18,
2003
1.20 4,296,000 - -
(269,000)
4,027,000
May 15, 2003 1.20 199,000 - - (20,000) 179,000
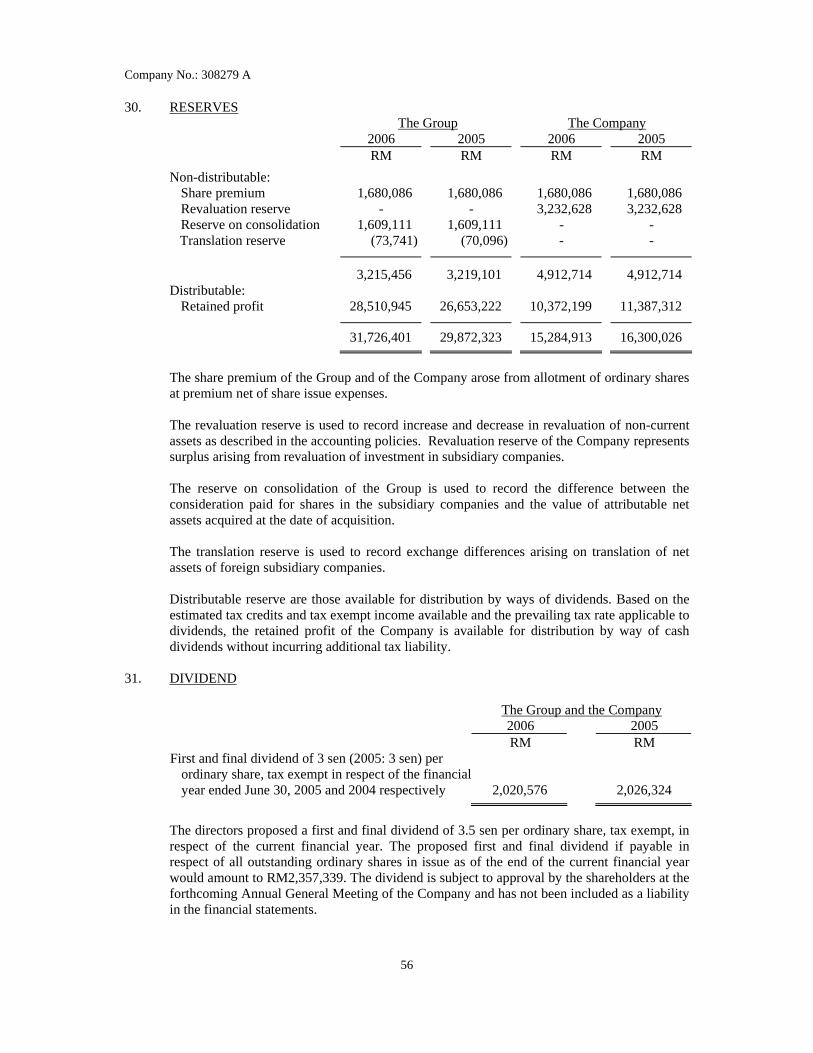
Company No.: 308279 A
56
30. RESERVES The Group The Company
2006 2005 2006 2005 RM RM RM RM
Non-distributable: Share premium 1,680,086 1,680,086 1,680,086 1,680,086 Revaluation reserve - - 3,232,628 3,232,628 Reserve on consolidation 1,609,111 1,609,111 - -
Translation reserve (73,741) (70,096) - -
3,215,456 3,219,101 4,912,714 4,912,714 Distributable:
Retained profit 28,510,945 26,653,222 10,372,199 11,387,312
31,726,401 29,872,323 15,284,913 16,300,026
The share premium of the Group and of the Company arose from allotment of ordinary shares at premium net of share issue expenses.
The revaluation reserve is used to record increase and decrease in revaluation of non-current assets as described in the accounting policies. Revaluation reserve of the Company represents surplus arising from revaluation of investment in subsidiary companies.
The reserve on consolidation of the Group is used to record the difference between the
consideration paid for shares in the subsidiary companies and the value of attributable net assets acquired at the date of acquisition.
The translation reserve is used to record exchange differences arising on translation of net
assets of foreign subsidiary companies. Distributable reserve are those available for distribution by ways of dividends. Based on the
estimated tax credits and tax exempt income available and the prevailing tax rate applicable to dividends, the retained profit of the Company is available for distribution by way of cash dividends without incurring additional tax liability.
31. DIVIDEND
The Group and the Company 2006 2005 RM RM First and final dividend of 3 sen (2005: 3 sen) per
ordinary share, tax exempt in respect of the financial year ended June 30, 2005 and 2004 respectively
2,020,576
2,026,324
The directors proposed a first and final dividend of 3.5 sen per ordinary share, tax exempt, in respect of the current financial year. The proposed first and final dividend if payable in respect of all outstanding ordinary shares in issue as of the end of the current financial year would amount to RM2,357,339. The dividend is subject to approval by the shareholders at the forthcoming Annual General Meeting of the Company and has not been included as a liability in the financial statements.

Company No.: 308279 A
57
32. CASH AND CASH EQUIVALENTS
Cash and cash equivalents included in the cash flow statements consist of the following balance sheets items: The Group The Company 2006 2005 2006 2005 RM RM RM RM Short-term deposits with
licensed banks
23,219,902
18,956,072
20,323,941
15,487,592 Cash and bank balances 3,277,449 3,453,711 130,289 310,289 26,497,351 22,409,783 20,454,230 15,797,881 Less: Short-term deposits held
as security value (665,605)
(614,881)
(8,000)
(8,000) 25,831,746 21,794,902 20,446,230 15,789,881
On March 28, 2006, the Company acquired a new subsidiary company. The effect of this acquisition on the financial position of the Group at date of acquisition is as follows: Unaudited
March 28, 2006 RM
Cash and bank balances 140 Accrued expenses (875)
Share of net liabilities acquired (735) Goodwill on consolidation 2,535 Total purchase consideration 1,800 Less: Cash and cash equivalents acquired (140) Cash flow on acquisition, net of cash and cash equivalents acquired (1,660)
On June 21, 2006, a wholly owned subsidiary company, Polytool Industries (Thailand)
Limited had been struck off from the register of Civil and Commercial Code of Thailand. On the event date, the Company deemed disposed of 100% equity interest in Polytool Industries (Thailand) Limited.
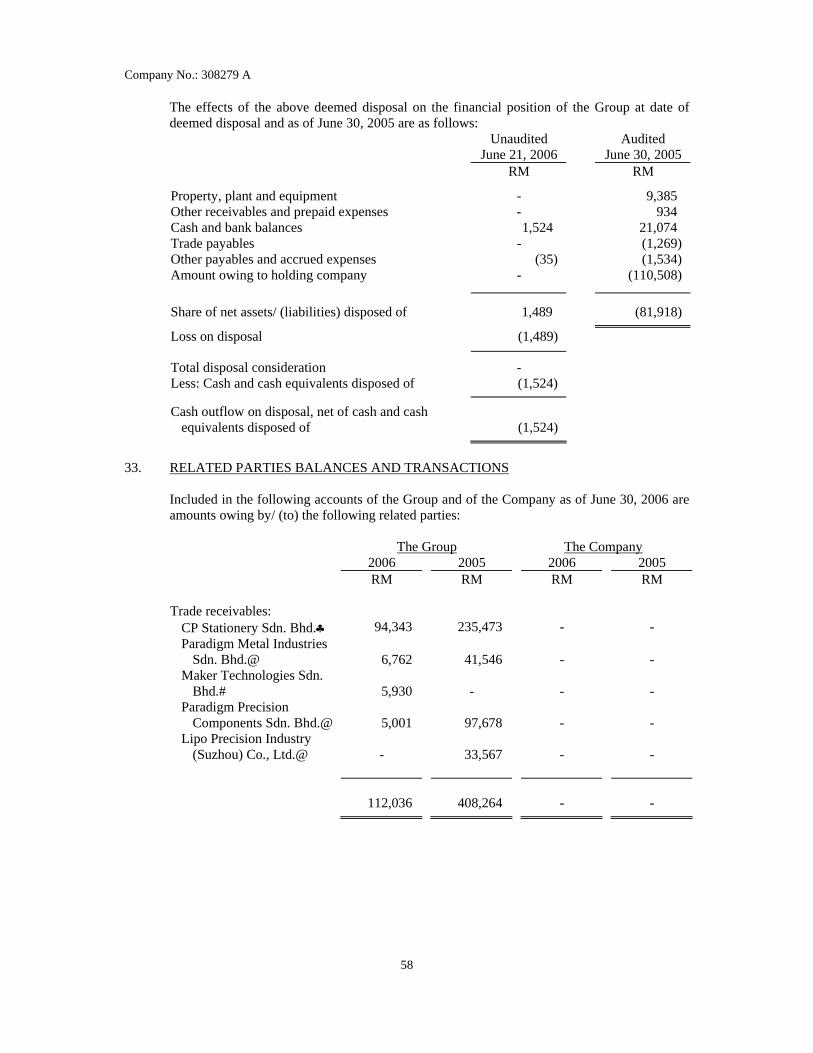
Company No.: 308279 A
58
The effects of the above deemed disposal on the financial position of the Group at date of deemed disposal and as of June 30, 2005 are as follows: Unaudited
June 21, 2006 Audited
June 30, 2005 RM RM
Property, plant and equipment - 9,385 Other receivables and prepaid expenses - 934 Cash and bank balances 1,524 21,074 Trade payables - (1,269) Other payables and accrued expenses (35) (1,534) Amount owing to holding company - (110,508)
Share of net assets/ (liabilities) disposed of 1,489 (81,918)
Loss on disposal (1,489)
Total disposal consideration - Less: Cash and cash equivalents disposed of (1,524)
Cash outflow on disposal, net of cash and cash equivalents disposed of
(1,524)
33. RELATED PARTIES BALANCES AND TRANSACTIONS Included in the following accounts of the Group and of the Company as of June 30, 2006 are
amounts owing by/ (to) the following related parties:
The Group The Company 2006 2005 2006 2005 RM RM RM RM Trade receivables:
CP Stationery Sdn. Bhd.♣ 94,343 235,473 - - Paradigm Metal Industries
Sdn. Bhd.@
6,762
41,546
-
- Maker Technologies Sdn.
Bhd.#
5,930
- -
-
Paradigm Precision Components Sdn. Bhd.@
5,001
97,678
-
-
Lipo Precision Industry (Suzhou) Co., Ltd.@
-
33,567
-
-
112,036 408,264 - -

Company No.: 308279 A
59
The Group The Company 2006 2005 2006 2005 RM RM RM RM Other receivables:
Lipo Precision Industry (Suzhou) Co., Ltd.@
43,494
13,994
26,158
13,994
Maker Technologies Sdn. Bhd.#
19,620
-
-
-
Paradigm Precision Components Sdn. Bhd.@
3,428
-
-
-
Paradigm Precision Components (Thailand) Ltd.@
966
18,904
966
18,904 67,508 32,898 27,124 32,898
The Group The Company 2006 2005 2006 2005 RM RM RM RM Trade payables:
Lipo Precision Industry (Suzhou) Co., Ltd.@
180,507
7,741
-
-
Paradigm Precision Components Sdn. Bhd.@
114,980
121,890
-
-
Maker Technologies Sdn. Bhd.#
41,664
24,850
-
-
Paradigm Metal Industries Sdn. Bhd.@
4,210
-
-
-
Micro Surface Treatment Sdn. Bhd.@
2,201
1,938
-
-
Rhythm Publishing House Sdn. Bhd. ♣
1,518
-
-
-
Rhythm MP Sdn. Bhd.♣ - 129,551 - - 345,080 285,970 - -

Company No.: 308279 A
60
The Group The Company 2006 2005 2006 2005 RM RM RM RM Other payables:
Paradigm Precision Components Sdn. Bhd.@
68,155
60,735
-
-
Penang Network Technologies Sdn. Bhd.+
22,832
150
-
-
Rhythm MP Sdn. Bhd.♣ - 4,781 - - Rhythm Publishing House
Sdn. Bhd.♣
-
561
-
- 90,987 66,227 - -
# Companies in which certain directors of subsidiary companies are also directors of
these companies @ Subsidiary companies of associated company, Lipo Corporation Berhad * Corporate shareholder of a subsidiary company, Elite Paper Trading Sdn. Bhd.
♣ Subsidiary companies of a corporate shareholder of a subsidiary company, Elite Paper Trading Sdn. Bhd.
+ Subsidiary companies of associated company, Penang Network Services Sdn. Bhd. Related party receivables/ payables arose mainly from trade transactions and advances which
are unsecured, interest free and have no fixed term of repayment. Significant transactions between the Group and its related parties during the financial year
were as follows:
The Group 2006 2005 RM RM Sales of trading goods
CP Stationery Sdn. Bhd. 1,034,583 967,511 Sales of finished goods
Paradigm Precision Components Sdn. Bhd. 279,066 572,582 Purchase of trading goods
Rhythm MP Sdn. Bhd. 36,028 698,836 Rhythm Punishing House Sdn. Bhd. 9,953 -
The directors of the Company are of the opinion that the above transactions have been entered into in the normal course of business and have been established under terms that are no less favourable than those arranged with independent third parties.

Company No.: 308279 A
61
34. SUBSEQUENT EVENTS
Subsequent to June 30, 2006, (i) the Company’s equity interest in Polytool Systems Sdn. Bhd. (formerly known as
Paradigm Precision Industries Sdn. Bhd.) (“PS”) reduced from 100% to 85% by virtue of the increase in the issued and paid-up share capital of PS by way of allotment of its new shares to a director of a subsidiary company and a third party.
(ii) the Company invested 60% equity interest in Unetsys Sdn. Bhd. comprising 60
ordinary shares of RM1 each for a cash consideration of RM60.
35. LEASE COMMITMENTS
As of June 30, 2006, the Group has an existing agreement with a corporate shareholder of a subsidiary company, Mega Publications Holding Sdn. Bhd. to rent a warehouse at a monthly rental of RM24,000 without any specific lease period. As of June 30, 2006, the Company has an existing agreement with its subsidiary company, Kobay Assets Sdn. Bhd. to rent part of the building at a monthly rental of RM4,000 without any specific lease period.
36. CAPITAL COMMITMENTS As of June 30, 2006, the capital expenditures contracted for in respect of property, plant and
equipment which have been authorised by the Group and the Company but not provided for in the financial statements are as follows:
The Group The Company 2006 2005 2006 2005 RM RM RM RM Contracted but not provided
for
-
347,000
-
160,000
37. CONTINGENT LIABILITIES – Unsecured
As of June 30, 2006, the Company is contingently liable for an amount of RM13,757,983 (2005: RM12,546,837) in respect of corporate guarantees given to certain local licensed banks and financial institution on credit facilities granted to and utilised by the subsidiary companies.

Company No.: 308279 A
62
38. SEGMENTAL INFORMATION
Business Segments
For management purposes, the Group is organised into the following operating divisions: - investment holdings (includes management services) - manufacturing (includes various machineries, equipment, tooling parts and
components) - trading - others (includes money lending, leasing and letting of properties)
Inter-segment sales are charged at cost plus a percentage profit mark-up.
Investment holdings
Manufacturing
Trading
Others
Elimination
Consolidated
RM RM RM RM RM RM 2006 Revenue
External sales 585,025 36,984,930 57,674,005 159,984 - 95,403,944Inter-segment sales
12,392,139
3,952,271
3,823
1,088,727 (17,436,960) -
Total revenue 12,977,164 40,937,201 57,677,828 1,248,711 (17,436,960) 95,403,944
Results Profit from
operations
15,961,119
5,844,627
2,155,914
(7,549,113)
(9,605,507) 6,807,040
Finance costs (928,534)Share of profit of
associated companies
-
-
-
-
800,524 800,524Income from other
investments
316,143Impairment loss of
investment in associated company
(1,669,531)
Profit before tax 5,325,642 Tax expense (1,170,562)
Profit after tax 4,155,080
Other information
Capital additions 237,721 852,391 4,570 6,769 - 1,101,451Depreciation and
amortisation
101,470
1,671,685
228
246,830
- 2,020,213Non-cash expenses
other than depreciation and amortisation
1,722,188
621,348
50,681
-
- 2,394,217

Company No.: 308279 A
63
Investment holdings
Manufacturing
Trading
Others
Elimination
Consolidated
RM RM RM RM RM RM Assets
Segment assets 25,494,087 41,376,376 24,612,812 13,251,370 - 104,734,645Investments in
associated companies
25,609,710
-
-
-
- 25,609,710Income tax assets 1,217,139 337,851 3,430 123,515 - 1,681,935
Consolidated total assets
52,320,936
41,714,227
24,616,242
13,374,885
- 132,026,290
Liabilities
Segment liabilities 702,912 8,847,646 415,758 122,381 - 10,088,697Borrowings - - 15,569,394 - - 15,569,394Income tax
liabilities
49
1,214,046
256
2,579,180
- 3,793,531
Consolidated total liabilities
702,961
10,061,692
15,985,408
2,701,561
- 29,451,622
2005 Revenue
External sales 401,459 32,979,936 55,321,694 379,387 - 89,082,476Inter-segment sales
4,027,935
1,848,798 14,768
891,009
(6,782,510) -
Total revenue 4,429,394 34,828,734 55,336,462 1,270,396 (6,782,510) 89,082,476
Results
Segment results 2,032,003 2,530,845 2,051,315 426,526 (3,238,428) 3,802,261
Finance costs (647,613)Share of profit of
associated companies
-
-
-
-
(550,056) (550,056)Income from other
investments
249,431
Profit before tax 2,854,023Tax income 333,469
Profit after tax 3,187,492
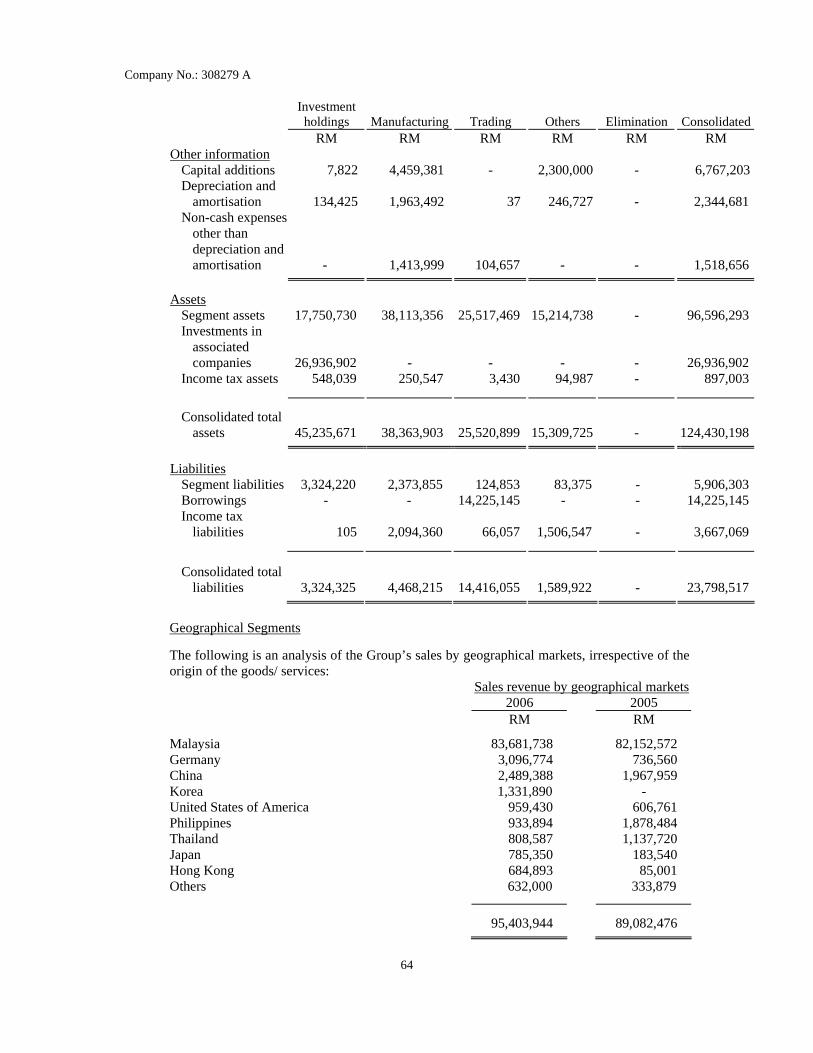
Company No.: 308279 A
64
Investment holdings
Manufacturing
Trading
Others
Elimination
Consolidated
RM RM RM RM RM RM Other information
Capital additions 7,822 4,459,381 - 2,300,000 - 6,767,203Depreciation and
amortisation
134,425
1,963,492
37
246,727
- 2,344,681Non-cash expenses
other than depreciation and amortisation
-
1,413,999
104,657
-
- 1,518,656
Assets Segment assets 17,750,730 38,113,356 25,517,469 15,214,738 - 96,596,293Investments in
associated companies
26,936,902
-
-
-
- 26,936,902Income tax assets 548,039 250,547 3,430 94,987 - 897,003
Consolidated total assets
45,235,671
38,363,903
25,520,899
15,309,725
- 124,430,198
Liabilities
Segment liabilities 3,324,220 2,373,855 124,853 83,375 - 5,906,303Borrowings - - 14,225,145 - - 14,225,145Income tax
liabilities
105
2,094,360
66,057
1,506,547
- 3,667,069 Consolidated total
liabilities
3,324,325
4,468,215
14,416,055
1,589,922
- 23,798,517
Geographical Segments
The following is an analysis of the Group’s sales by geographical markets, irrespective of the
origin of the goods/ services: Sales revenue by geographical markets 2006 2005 RM RM
Malaysia 83,681,738 82,152,572 Germany 3,096,774 736,560 China 2,489,388 1,967,959 Korea 1,331,890 - United States of America 959,430 606,761 Philippines 933,894 1,878,484 Thailand 808,587 1,137,720 Japan 785,350 183,540 Hong Kong 684,893 85,001 Others 632,000 333,879
95,403,944 89,082,476

Company No.: 308279 A
65
The following is an analysis of the carrying amounts of segment assets and capital additions by the geographical areas in which the assets are located:
Carrying amount of segment assets
Capital additions
2006 2005 2006 2005 RM RM RM RM Malaysia 102,036,936 94,010,017 884,177 6,643,727China 2,634,533 2,100,319 217,274 118,911Philippines 63,176 454,563 - 4,565Thailand - 31,394 - -
104,734,645 96,596,293 1,101,451 6,767,203
Inter-segment sales are charged at normal commercial terms that are no less favourable than those arranged with independent third parties.
39. FINANCIAL INSTRUMENTS
a. Financial Risk Management Objectives and Policies
The operations of the Group are subject to a variety of financial risks, including foreign currency risk, interest rate risk, market risk, credit risk, liquidity risk and cash flow risk. The Group has formulated a financial risk management framework whose principal objective is to minimise the Group’s exposures to risks and/ or costs associated with the financing, investing and operating activities of the Group. Various risk management policies are made and approved by the Board for observation in the day-to-day operations for the controlling and management of the risks associated with financial instruments. i. Foreign currency risk
The Group has exposure to foreign exchange risk as a result of transactions, receivables and payables in foreign currencies arising from normal operating activities. The Group does not speculate in foreign currencies.
ii. Interest rate risk
The Group’s exposures to changes in interest rates relates primarily to the Group’s finance lease receivables, loan receivables and short-term deposits with licensed banks, and financing through bank borrowings and long-term loan. The short-term deposits are placed with reputable banks. The Group does not use derivative financial instruments to hedge its risk.
iii. Market risk
The Group has in place policies to manage the Group’s exposures to fluctuation in the prices of the key raw materials used in the operations.

Company No.: 308279 A
66
iv. Credit risk
The Group is exposed to credit risk mainly from trade receivables. The Group extends credit to its customers based upon careful evaluation of the customers’ financial conditions and credit histories. The Group also ensures a number of customers so as to limit high credit concentration in a customer or customers from a particular market.
v. Liquidity risk The Group practises prudent liquidity risk management to minimise the mismatch of financial assets and liabilities and to maintain sufficient credit facilities for contingent funding requirement of working capital.
vi. Cash flow risk
The Group reviews its cash flow position regularly to manage its exposures to fluctuations in future cash flows associated with its monetary financial instruments.
b. Credit Risk The maximum credit risk associated with recognised financial assets is the carrying amount shown in the balance sheets. The Group has no significant concentration of credit risk, with exposure spread over a number of counterparties and customers.
c. Fair Values
The carrying amounts and the estimated fair values of the Group’s and the Company’s financial instruments as of June 30, 2006 are as follows:
Carrying Amount Fair Value 2006 2005 2006 2005
RM RM RM RM The Group Financial assets
Other investments Quoted shares 234,006 361,404 152,157 294,573Unquoted shares 272,634 272,634 * * Bond 988,781 - 1,000,000 - Structured products 1,500,000 - 1,501,482 - Unit trusts 650,000 300,000 641,481 273,435
The Company Financial assets
Other investments Unquoted shares 141,000 141,000 * * Bond 988,781 - 1,000,000 - Structured products 1,500,000 - 1,501,482 - Unit trusts 500,000 - 504,010 -
* It is not practical to estimate the fair values of unquoted investments. The directors consider that the carrying amounts of unquoted investments approximate their fair values.

Company No.: 308279 A
67
The carrying amounts of investments in quoted shares and unit trusts of the Group are not reduced to fair value as these are long-term investments and the directors of the Group are of the opinion that the decline in value is temporary in nature. The fair value of long-term loan approximate its carrying amount and is estimated using discounted cash flow analysis based on current borrowing rates for similar types of borrowing arrangements.
The fair values of other financial assets and other financial liabilities approximate
their carrying amounts because of the short maturity of these instruments.
It is not practical to estimate the fair values of contingent liabilities reliably due to the uncertainties of timing, costs or eventual outcome.

Company No.: 308279 A
68