kofi nyanteng introduction excel modelling
TRANSCRIPT

EXCEL
Yacar-Yacara Consults

What is Excel?
Microsoft Excel is a spreadsheet program written and distributed by Microsoft for computers using the Microsoft Windows operating system and for Apple Macintosh computers.

Uses of excel
Data analysis
Building models (Financial, Operational, Marketing, Etc)
Calculator
Graphical presentations
Excel Window Overview
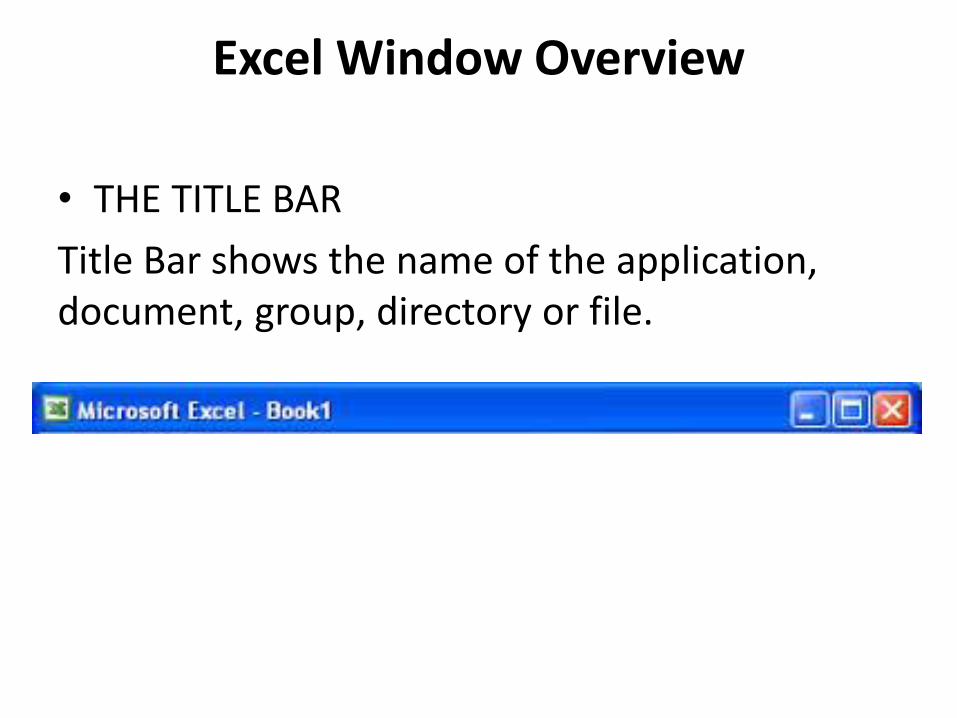
• THE TITLE BAR
Title Bar shows the name of the application, document, group, directory or file.

MENU MAR
Menu Bar contains the available menus from which you can choose commands.

STANDARD & FORMATTING BAR
Standard & Formatting Toolbar provide a quick method of working with various parts of the worksheet. Toolbars can be customized and multiple toolbars can be displayed at the same time.
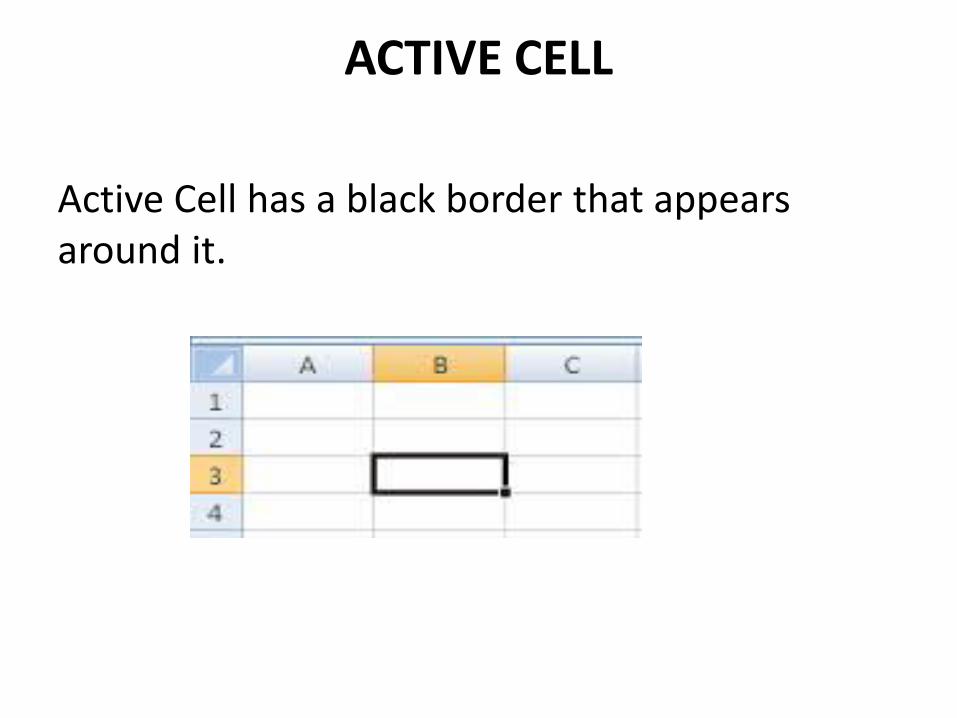
ACTIVE CELL
Active Cell has a black border that appears around it.

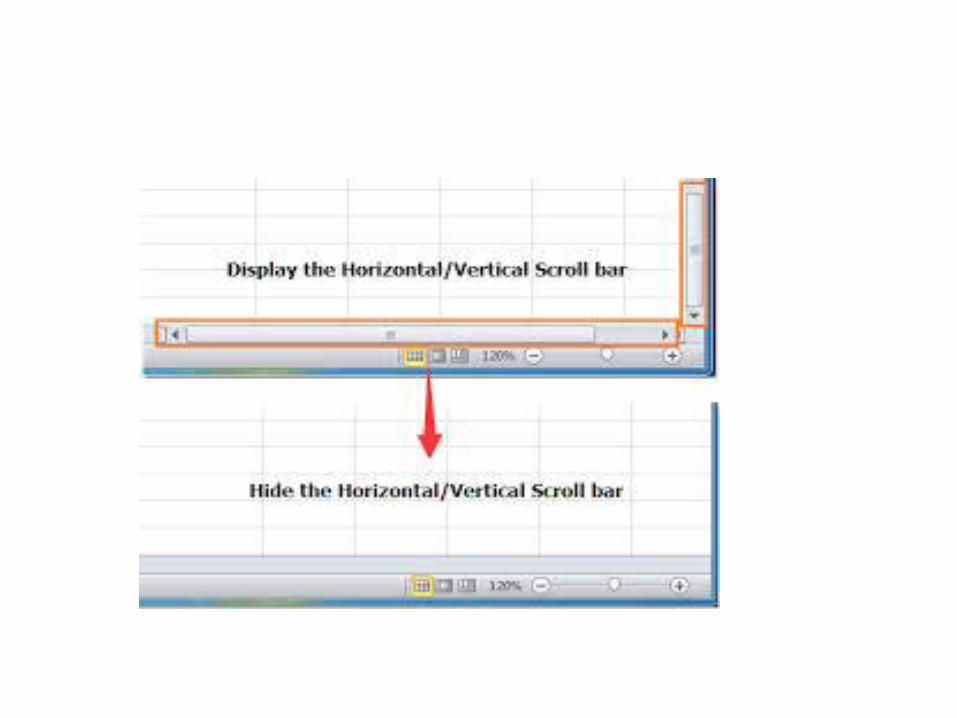
VERTICAL & HORIZONTAL SCROLL BARS
Vertical & Horizontal Scroll Bars enable you to move through a spreadsheet when the entire spreadsheet does not fit in the window or the allotted space. Click the scroll arrows with the mouse to move through the spreadsheet or to see one line at a time

Worksheet
• A worksheet contains rows and columns that intersect to form cells. A black border appears around the active cell.
Columns and Rows
• A column in Excel is a vertical arrangement of data, and a row in Excel is a horizontal arrangement of data. There are 16,384 columns and 1,048,576 rows available in a worksheet.
Selecting and de-selecting Cells
• To select one cell, click it. • To select a group of cells, be sure the mouse
pointer shows as the selection mouse pointer, click in the first cell and drag through to the last cell (first cell will show white and all others will be shaded).
• To de-select cells, click once in any cell – there will always be one cell active
• To select the entire worksheet, press Ctrl + A on the keyboard or click the blank area to the left of column A and just above row 1.

Selecting rows or columns
• To select one column (e.g. column A), click on the A (above the cells) – the entire column shows selected.
• To select one row (e.g. row 1), click on the 1 (to the left of the cells) – the entire row is selected.
• To select multiple columns click the letter for one column and drag right or left to include other columns
• To select multiple rows click the number for one row and drag down or up to include other rows

Freezing Rows or Columns
When you need to keep the top row or left column in view as you work with a large amount of data, you can Freeze it so it’s always visible on the screen.
1. Go to View/Freeze Panes
2. Select either Freeze Top Row (freezes row 1) or Freeze
3. First Column (freezes column A)
4. To unfreeze, select Unfreeze Panes

Protecting Worksheets
On the Menu Tab,
• Click on review
• Click on Protect Sheet
• Select protect worksheets and contents of locked cells
• Define the scope of protection by ticking and un-ticking the options
• Type your password (Note: You will not be able to do anything when you forget your password)
• Re-enter the password and click Ok.
• Click Ok

Protecting Workbooks
• On the Menu Tab,
• Click on file
• Click on Protect Workbook
• Select encrypt with password
• Type your password (Note: You will not be able to do anything when you forget your password)
• Re-enter the password and click Ok.
• Click Ok

• http://www.excel-easy.com/vba/examples/protect-macro.html

Yacar-Yacara Consults

FUNCTIONS

Functions by categories
• Information
• Financial
• Date and Time
• Financial
• Text
• Logical
• Database
• Engineering
• Maths and Arithmetic
• Statistics
• Lookup and references
YACAR-YACARA CONSULTS: Financial Modelling (Intermediate)

TEXT FUNCTIONS
CONCATENATE Joins together two or more text strings
LEFT Returns a specified number of characters from the start of a supplied text string
RIGHT Returns a specified number of characters from the end of a supplied text string
REPT Returns a string consisting of a supplied text string, repeated a specified number of times
LOWER Converts all characters in a supplied text string to lower case
PROPER Converts all characters in a supplied text string to proper case (i.e. letters that do not follow another letter are upper case and all other characters are lower case)
UPPER Converts all characters in a supplied text string to upper case
YACAR-YACARA CONSULTS: Financial Modelling (Intermediate)

INFORMATION FUNCTIONS
CELL Returns information about the formatting, location, or
contents of a cell
INFO Returns information about the current operating
environment
ISBLANK Returns TRUE if the value is blank
ISERROR Returns TRUE if the value is any error value
ISEVEN Returns TRUE if the number is even
ISLOGICAL Returns TRUE if the value is a logical value
YACAR-YACARA CONSULTS: Financial Modelling (Intermediate)

ISNA Returns TRUE if the value is the #N/A error value
ISNONTEXT Returns TRUE if the value is not text
ISNUMBER Returns TRUE if the value is a number
ISODD Returns TRUE if the number is odd
ISTEXT Returns TRUE if the value is text
YACAR-YACARA CONSULTS: Financial Modelling (Intermediate)

DATE & TIME FUNCTIONS
DATE Returns a date, from a user-supplied year, month and day
TIME Returns a time, from a user-supplied hour, minute and second
TODAY Returns today's date
HOUR Returns the hour part of a user-supplied time
MINUTE Returns the minute part of a user-supplied time
SECOND Returns the seconds part of a user-supplied time
WEEKNUM Returns an integer representing the week number (from 1 to 53) of the year from a user-supplied date
NOW Returns the serial number of the current date and time
YACAR-YACARA CONSULTS: Financial Modelling (Intermediate)

MATHS & STATS FUNCTIONS
SUM Returns the sum of a supplied list of numbers
SUMIF Adds the cells in a supplied range, that satisfy a given criteria
COUNT Counts how many numbers are in the list of arguments
COUNTBLANK Counts the number of blank cells within a range
COUNTIF Counts the number of cells within a range that meet the given criteria
SQRT Returns the positive square root of a given number
YACAR-YACARA CONSULTS: Financial Modelling (Intermediate)

STATISTICAL FUNCTIONS COUNT Counts how many numbers are in the list of arguments
COUNTBLANK Counts the number of blank cells within a range
COUNTIF Counts the number of cells within a range that meet the given criteria
SQRT Returns the positive square root of a given number
MAX Returns the maximum value in a list of arguments
MIN Returns the minimum value in a list of arguments
MEDIAN Returns the median of the given numbers
MODE Returns the most common value in a data set
AVERAGE Returns the average of its arguments
AVERAGEIF Returns the average (arithmetic mean) of all the cells in a range that meet a given criteria
YACAR-YACARA CONSULTS: Financial Modelling (Intermediate)

LOGICAL FUNCTIONS
FALSE Returns the logical value FALSE
IF Specifies a logical test to perform
NOT Reverses the logic of its argument
TRUE Returns the logical value TRUE
YACAR-YACARA CONSULTS: Financial Modelling (Intermediate)

LOGICAL FUNCTIONS
RULES OF LOGICAL FUNCTIONS
<= for less than or equal to
>= for greater than or equal to
= equal to
-= for not equal to
YACAR-YACARA CONSULTS: Financial Modelling (Intermediate)
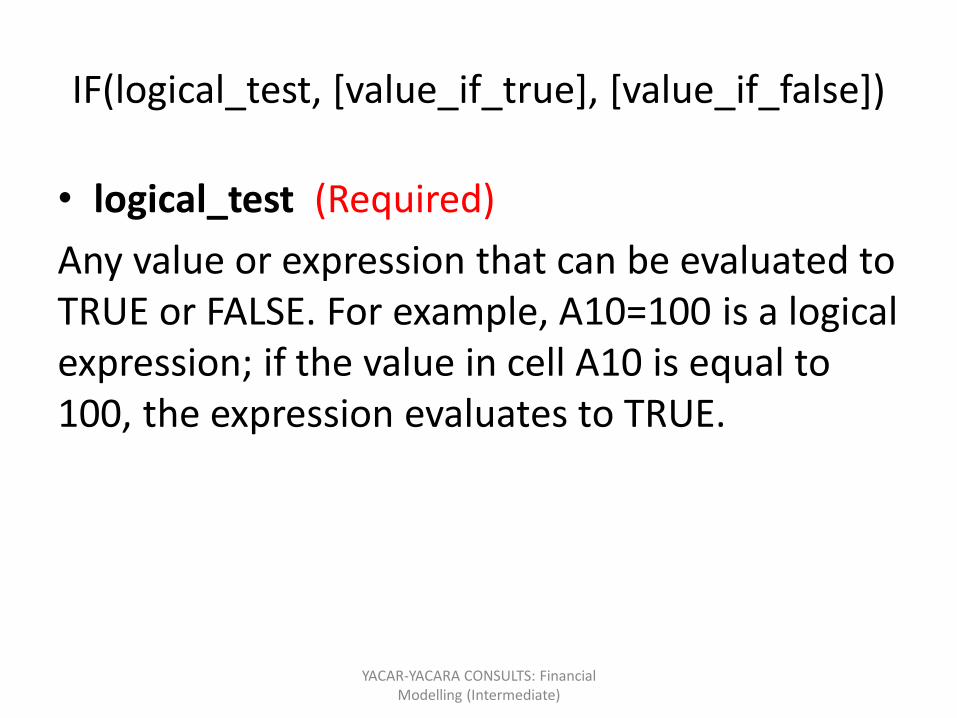
IF(logical_test, [value_if_true], [value_if_false])
• logical_test (Required)
Any value or expression that can be evaluated to TRUE or FALSE. For example, A10=100 is a logical expression; if the value in cell A10 is equal to 100, the expression evaluates to TRUE.
YACAR-YACARA CONSULTS: Financial Modelling (Intermediate)
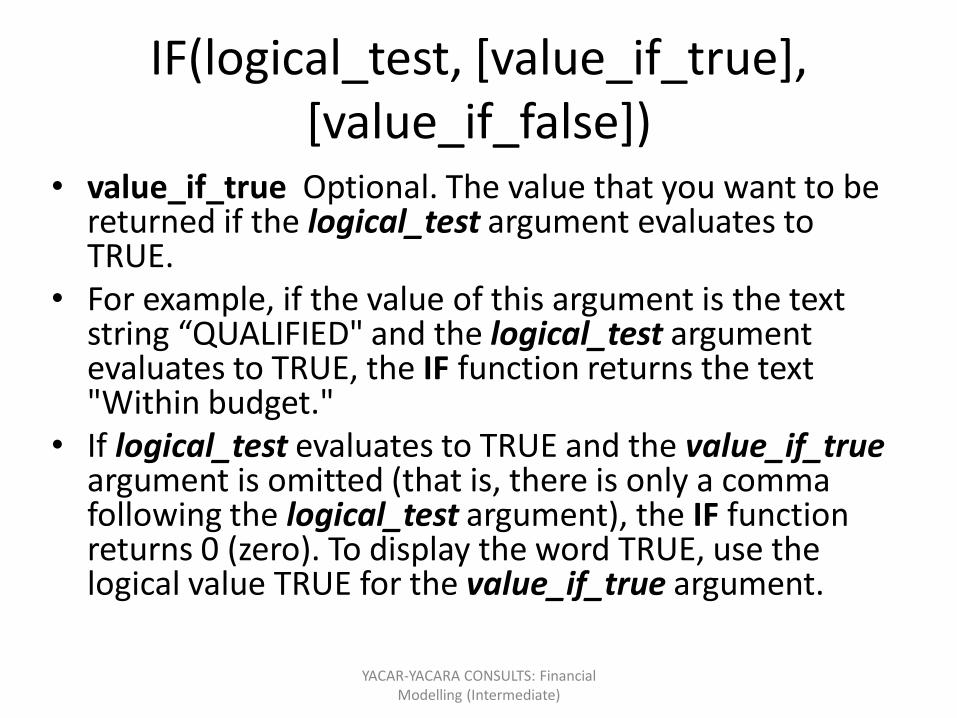
IF(logical_test, [value_if_true], [value_if_false])
• value_if_true Optional. The value that you want to be returned if the logical_test argument evaluates to TRUE.
• For example, if the value of this argument is the text string “QUALIFIED" and the logical_test argument evaluates to TRUE, the IF function returns the text "Within budget."
• If logical_test evaluates to TRUE and the value_if_true argument is omitted (that is, there is only a comma following the logical_test argument), the IF function returns 0 (zero). To display the word TRUE, use the logical value TRUE for the value_if_true argument.
YACAR-YACARA CONSULTS: Financial Modelling (Intermediate)

EG.
• =IF(H2<22,“FAILED",“PASSED") =IF(B2<25,"fail",IF(B2=25,"pass",IF(B2>25,"excel")))
YACAR-YACARA CONSULTS: Financial Modelling (Intermediate)