kone annual report · 2004-11-25 · the kone group consists of the finnish parent company, kone...
TRANSCRIPT

KONE Corporation Annual Report 1995
To parent company shareholders
A N N U A L G E N E R A L M E E T I N G
The Annual General Meeting of KONE Corporation will be held at the Hotel
Kalastajatorppa, Helsinki, on Thursday, February 29, 1996 at 11:00 a.m.
Shareholders wishing to participate in the business of the meeting are to
have their KONE shareholdings registered on the KONE shareholder list at the
Central Share Registry of Finland no later than Monday, February 19, 1996 and
notify the Head Office by telephone (+358 0 475 4215) or in writing (KONE
Corporation, P.O. Box 8, FIN-0033l Helsinki) no later than February 26th.
A shareholder may attend and vote at the meeting in person or by proxy.
However, in accordance with Finnish practice, the company does not send forms of
proxy to its shareholders. Shareholders wishing to vote by proxy should submit
their own forms of proxy to the company.
A N N O U N C E M E N T S T O S H A R E H O L D E R S
In accordance with the Articles of Association, announcements to shareholders are
published in at least two daily Helsinki newspapers chosen by the Board of
Directors.
F I N A N C I A L R E P O R T I N G
KONE Corporation will publish the following financial reports during 1996:
- Annual Report: in Finnish, Swedish, English, German, French, Russian and
Chinese.
- Interim Report (June 7) covering January-April operations: in Finnish, Swedish and
English.
- Interim Report (October 10) covering January-August operations: in Finnish,
Swedish and English.
These reports are mailed directly to all registered shareholders of the
parent company.
This Annual Report is
available in English, French,
German, Swedish, Finnish,
Russian and Chinese from:
KONE Corporation,
Corporate Communications,
P.O. Box 8,
FIN-00331 Helsinki, Finland.
Telephone +358 0 475 4348.
Telefax +358 0 475 4496.
P A Y M E N T O F D I V I D E N D S
The Board of Directors’ proposal for distribution of profits can be found on page 41.
Only those who have been registered as share owners at the Central Share Registry
by the March 5, 1996 date of record of dividend distribution are entitled to
dividends. The date proposed by the Board of Directors for payment of dividends is
March 8, 1996.
Those shareholders whose stock certificates have not yet been transferred
to the paperless book entry securities system by March 5, 1996 will receive their
dividends only after the transfer has been completed.

KONE Corporation Annual Report 1995
T O P A R E N T C O M P A N Y S H A R E H O L D E R S I I
T H E K O N E G R O U P 2
H I G H L I G H T S 3
K E Y F I G U R E S 3
B O A R D O F D I R E C T O R S A N D A U D I T O R S 4
M E S S A G E F R O M T H E P R E S I D E N T 5
C O R P O R A T E M A N A G E M E N T A N D A R E A D I R E C T O R S 6
R E V I E W B Y M A R K E T A R E A 7
R E P O R T O N O P E R A T I O N S 1 3
S A L E S A N D P E R S O N N E L B Y C O U N T R Y 1 4
P R I N C I P L E S O F D R A W I N G U P A C C O U N T S 2 2
C O N S O L I D A T E D S T A T E M E N T O F I N C O M E 2 3
C O N S O L I D A T E D B A L A N C E S H E E T 2 4
C O N S O L I D A T E D S T A T E M E N T O F C A S H F L O W S 2 6
N O T E S O N T H E C O N S O L I D A T E D
F I N A N C I A L S T A T E M E N T S 2 7
R E V I E W 1 9 9 1 - 1 9 9 5 3 0
C A L C U L A T I O N O F K E Y F I G U R E S 3 0
P A R E N T C O M P A N Y : S T A T E M E N T O F I N C O M E 3 1
P A R E N T C O M P A N Y : B A L A N C E S H E E T 3 2
P A R E N T C O M P A N Y : S T A T E M E N T O F C A S H F L O W S 3 4
N O T E S O N T H E P A R E N T C O M P A N Y
F I N A N C I A L S T A T E M E N T S 3 5
B O A R D O F D I R E C T O R S ' P R O P O S A L T O
T H E A N N U A L G E N E R A L M E E T I N G 4 1
A U D I T O R S ' R E P O R T 4 1
P A R E N T C O M P A N Y S H A R E S A N D S H A R E H O L D E R S 4 2
A D D R E S S E S 4 5

The KONE Group
The KONE Group consists of the Finnish parent company, KONE Corporation, and
those subsidiaries in which its direct or indirect interest exceeded 50% at the end of
1995. There are 160 such companies in 41 countries.
The parent company was established in 1910. Its shares have been quoted
on the Helsinki Stock Exchange since 1967.
KONE's main business is the manufacture, installation, modernization and
maintenance of elevators and escalators. KONE products are manufactured in several
countries in Europe, North and South America and Asia. To carry out broad-based
field operations, an extensive installation and aftersales service organization is
maintained in key market areas around the world.
KONE offers customers in the vertical transportation field products and
services designed to sustain and increase the value and usefulness of their property.
Customers include planners, developers, builders and owners of public and private
buildings.
KONE strives for reliability in its products and services, quality in its
employees' performance, longevity in its customer relationships, and profitability in
its business dealings. The business activities of local KONE units all over the world
are based on these shared values.
Sales by
Business Sector 1995
Sales by Market
1995
48 %
14 %
29 %
53 %
4 %4 %10 %39 %
FIM million New elevators and escalators 3,686 Modernization 1,294 Maintenance 4,543
FIM million European Union 5,066 Rest of Europe 358 North America 2,772 Asia & Australia 954 Other countries 373
Employees by
Market 1995
23 %
11 %
6 % 4 %
56 %
European Union 11,752 Rest of Europe 794 North America 4,836 Asia & Australia 2,241 Other countries 1,246
2

(Figures for 1994 in the table below have been adjusted to correspond to corrected information as explained on
page 27.)
1995 1994
Sales Mmk* 9,523 7,638
Sales outside Finland " 9,184 7,244
Sales in Finland " 339 394
Exports from Finland " 860 828
Orders received " 6,635 5,281
Order book as of 31st Dec. " 5,742 5,874
Income before taxes " 1861) 288
Net income " 671) 143
Total assets " 7,542 7,844
Number of employees as of 31st Dec. 20,869 21,553
*Mmk = Millions of Finnish markkas; FIM 100 = US $22.80 (as of 31st Dec 1995).1) Includes extraordinary losses of FIM 15.7 million.
Highlights
● E X C E P T I O N A L E V E N T S A N D R E O R G A N I Z A T I O N C O S T S W E A K E N R E S U L T
● E L E V A T O R D E M A N D A N D P R I C E L E V E L S I N E U R O P E R E M A I N L O W
● S L I G H T G R O W T H I N D E M A N D I N N O R T H A M E R I C A
● M O N T G O M E R Y - K O N E A C H I E V E S P R O F I T T A R G E T S
● A S I A N O R D E R S I N C R E A S E B Y O N E T H I R D
● N O M A J O R C H A N G E S I N M A R K E T S H A R E
● P R O D U C T R A N G E R E N E W A L A N D C O N C E N T R A T I O N O F M A N U F A C T U R I N G
● B E T T E R R E S U L T I N 1 9 9 6
Key Figures*
(Figures for 1992-1994 have been adjusted to correspond to corrected information as explained on page 27.)
1995 1994 1993 1992 1991
Return on equity % 3.5 5.8 5.0 12.0 12.3
Return on capital employed % 11.3 12.5 12.5 15.3 16.2
Total equity/total assets % 30.8 31.2 31.5 26.4 26.8
Earnings/share, FIM 13.67 23.60 20.40 45.22 41.52
Equity/share, FIM 383 403 421 395 360
Price/earnings, B share 26.6 22.9 27.9 9.5 8.7
Gearing 46 53 45 81 86
*The principles for calculating key figures can be found on page 30.
3

Board of Directors
Antti Herlin, 40
Farmer
Member of the Board 1991-
Ilkka Herlin, 37
Ph.D.
Member of the Board 1990-
Auditors
Liisa Mononen,
Authorized Public Accountant
SVH Coopers & Lybrand Oy,
Authorized Public Accountants
Deputies
Antti Helenius,
Authorized Public Accountant
Tauno Haataja,
Authorized Public Accountant
Jaakko Lassila, 68
Ph.D.
Member of the Board 1978-
Anssi Soila, 47
President 1995-
Deputy Member of the Board 1995-
Pekka Herlin, 63
D.Sc. (Econ.) H.C.
Chairman & C.E.O. 1987-
President & C.E.O. 1964-1986
Member of the Board 1954-
Gerhard Wendt, 61
Ph.D.
President 1989-1994
Member of the Board 1979-
4

The world in which we work is subject to a continuous proconsequence, we must also constantly renew both our wa
Message from the President
Anssi Soila
cess of change. As ays of working and the focus
of our business efforts in order to respond rapidly enough and in the most effectivepossible ways to the ever-changing requirements of the market.
In our product development, production and widespread field operations,our fundamental starting points are our customers' requirements and our ability tosatisfy those requirements comprehensively on an ongoing basis. Our task is todevelop the quality of our products, services and operations while constantlyassuring our profitability, which is largely based on customer satisfaction.
During the year under review, our result was weakened by exceptionalevents. Faulty reporting, which had been going on for some time, was uncovered inItaly. Its impact on recent years' results was substantial. This situation has beencorrected, and structural changes to improve profitability have been initiated in ourItalian organization. In addition, KONE's internal auditing procedures have beenstrengthened.
Among the positive accomplishments of the past year have been ourretention of market share, Montgomery KONE's achievement of its profit targets andthe successful integration of Montgomery into the KONE organization, and on-schedule progress made in the development of new products. As a result of theevents in Italy and more extensive structural changes than were originally planned,KONE's result for the year was poor. Despite this temporary disappointment, theBoard of Directors has decided to propose to the Annual General Meeting thatdividends once again be maintained at the same level as in recent years.
We begin the new year with new and powerful resources. We will bebringing to the market innovative solutions in all our operational sectors. In ourlargest market area, Europe, the new elevator business is undergoing a thoroughreorganization. The number of existing product families is being reducedsubstantially as a step toward European-wide products. Manufacturing is beingconcentrated in fewer production centers capable of attaining higher volumes.Installation-site productivity is being improved through the implementation ofconsistent installation methods. The combined impact of all these efforts will be adecisive improvement in our competitiveness.
Our direction is clear. Both our product ranges and our organization areundergoing structural changes consistent with the goals set for them. Theharmonization of our business processes is progressing, and the long-range projectto integrate our worldwide information technology systems begun last year iscontinuing. Our quality improvement efforts are boring deeper into the foundations ofour everyday work. Through all these efforts we are building a new and lasting basisfor future strength.
We have successfully maintained our market share in a turbulent businessenvironment, thanks to the know-how and dedication of our personnel. By continuingthe market-driven development of our products and services, we assure thesatisfaction of our customers. That is the path toward growth and success in thefuture.
Anssi Soila
President
5
Corporate management
team (l-r): Pekka
Kemppainen, Pekka
Paalanne, Klaus Cawén,
Anssi Soila, Jussi Itävuori,
Eric Maziol and Aimo
Rajahalme.
Corporate Management and Area Directors
Chauvarie Pecchioli
Corporate Management
President:
ANSSI SOILA
Senior Vice Presidents:
KLAUS CAWÉN, General Counsel & Acquisitions
JUSSI ITÄVUORI, Human Resources & Quality
PEKKA KEMPPAINEN, Technology
ERIC MAZIOL, Marketing & Field Operations
PEKKA PAALANNE, Corporate Control & Information Systems
AIMO RAJAHALME, Finance & Treasury
Area Directors
SOUTHERN EUROPE &LATIN AMERICAJ-P. Chauvarie, Paris
ITALYRoberto Pecchioli, Milan
CENTRAL EUROPEJ-W. Hoving, Amsterdam
NORTHERN & EASTERN EUROPET-E. Sandelin, Helsinki
NORTH AMERICAHeimo Mäkinen, Moline (IL), U.S.A.
ASIA-PACIFICNeil Padden, Hong Kong
Component DivisionLauri Björklund, Brussels
6
Padden
Mäkinen
Björklund
Hoving
E U R O P E
The construction industry within the European Union experienced no significant
growth during the year under review. There was exceptionally little housing
construction, which represents about one fourth of all construction business. The
main reasons for the dearth in new housing construction were the large budgetary
deficits in the public sector, high real interest rates, and high unemployment levels in
many EU countries. Elevator price levels remain low.
Renovation work has turned out to be the largest and fastest growing sector
of the construction industry, approaching one third of the industry's total volume. In
contrast to expectations, however, elevator modernization business did not surpass
the previous year's totals. Overcapacity in commercial real estate continues to
impede growth in many EU countries. Nevertheless, KONE was able to use its
industrialized modernization products to win important orders and strengthen its
position in European modernization markets.
The tight economic situation and strong pressure to reduce costs were
reflected in increasing price competition in the maintenance sector. KONE has
responded to this tougher competition with measures to improve the effectiveness of
predictive maintenance and the productivity of maintenance efforts without
compromising the quality and availabilty of KONE services.
The building industry's decline in northern Europe, which continued during
the entire first half of the 1990s, has finally bottomed out. Investment in new housing
construction remains, however, at a low level. In Sweden, for example, construction
activity is at its lowest level since 1920. The modernization market showed some
slight improvement at the end of 1994 but turned downward again during 1995.
In Great Britain and Central Europe, new elevator demand has been
stagnant. The slight economic growth that Germany enjoyed at the beginning of 1995
weakened everywhere except in Berlin toward the end of the year. The countries of
eastern Central Europe, where growth continued at an average 6% annual pace, are
preparing for significant infrastructure investments which are expected to lead
gradually to new housing construction and renovation of existing buildings.
As part of the reorganization of KONE's elevator production during the year
under review, the Peterborough Factory in England and the Thorn Factory in the
Netherlands were closed. In addition, it was decided to close the Hannover Door
Factory in Germany and the Prague Factory in the Czech Republic as well as
discontinue the manufacturing of electronic equipment and several mechanical
components at the Liège Factory in Belgium.
Government indebtedness, high unemployment, and shaken public
confidence in the ability of politicians to change the direction of the economy kept
investment at low levels in France, Spain and Italy. Air and rail infrastructure
development projects are responsible for the largest orders received in France
(Paris Metro) and Italy (Milan Metro and Malpensa Airport expansion). No growth is
expected in the short run in either new elevator or modernization demand.
KONE is the leading supplier of elevators imported into the former Soviet
Union with over 350 units installed in 1995. Among the most significant references
were Gasprom (61 elevators), the Russian Parliament (22 elevators) and the Kremlin
Review by Market Area
7

(12 elevators) in Moscow and the Hotel Pribaltiskaya in St. Petersburg. Maintenance
business also continued its steady growth with KONE assuming 100% ownership of
service companies in Moscow and St. Petersburg.
KONE has a recognized position in Europe as a quality elevator supplier.
Representative examples of superior European installations completed during the
year include the Rembrandt Tower in Amsterdam, 99 Bishopsgate in London and the
Finntower in Warsaw.
No growth is expected in either the new elevator or modernization markets
in Europe in 1996. This stagnation will lead to increasing price competition. KONE's
response is to introduce more cost-effective products to the market, decrease the
number of product families, and streamline production processes.
N O R T H A N D S O U T H A M E R I C A
During 1995, the elevator business in North America was characterized by a relative
paucity of construction activity compared to earlier periods of economic growth and
the tightening of competition in all business sectors. Economic growth in the United
States stood at 3%, which was the same figure recorded for growth in construction
industry activity. The greatest increase occurred in public sector renovation work
while easy access to funding and low interest rates maintained investment readiness
in the private sector.
In the United States the focus in commercial construction shifted from urban
centers to the suburbs, where buildings tend to be lower. This development fed
increased demand for hydraulic elevators. Thanks to the introduction of a new, more
cost-effective hydraulic elevator range to the U.S. market at the same time,
Montgomery KONE increased its volume of hydraulic elevator orders over the
previous year's figures.
The most important delivery of 1995 consisted of 249 elevators, escalators
and autowalks for the new Denver International Airport. Other significant orders
included those for the Olympic Stadium in Atlanta (10 elevators, 5 escalators), the
Universal City Parking Complex in Orlando (13 elevators, 38 escalators), the Silver
Legacy Casino in Reno (32 elevators, 10 escalators), the United Airlines Terminal
Extension in Los Angeles (5 elevators, 6 escalators, 1 autowalk) and the Ronald
Reagan Federal Building and U.S. Courthouse in Santa Ana (14 elevators, two
escalators).
Demand for elevator and escalator modernizations increased somewhat
during 1995, but price levels remained low. The integration of KONE and
Montgomery resources strengthened the company's position as a leader in the U.S.
market. Among the many important orders received, it is worth mentioning the Lurie
Companies complex in Chicago (29 high-rise elevators), the A.S. Celebrezze
Federal Office Building in Cleveland (27 elevators, 2 escalators), Maxus Energy in
Dallas (18 high-rise elevators) and the U.S. Post Office in Philadelphia (12 elevators).
The growth in service business was slow, affected by the low level of
deliveries in recent years and increased price competition. Montgomery KONE has
an excellent name as a service provider. For example, it was the first elevator
8
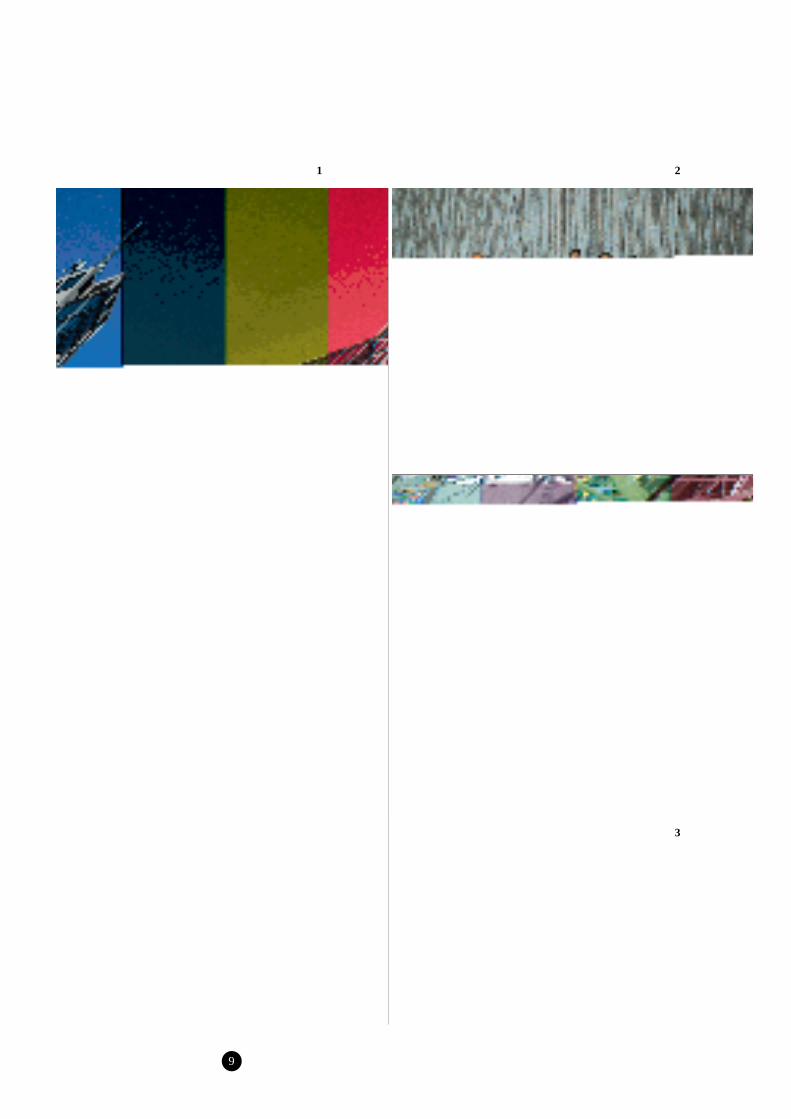
1 The Netherlands' tallest
building, the 35-story
Rembrandt Tower in
Amsterdam, to which
KONE supplied 12
elevators and two
escalators, was completed
in July. The elevators have
a top speed of 5.0 m/s.
2 Eighteen employee
representatives from
KONE companies in twelve
European countries and
five representatives of
KONE management signed
an agreement on employee
consultation and
communication in June.
Shown signing the
document are president
Anssi Soila (right) and
employee representative
Giovanni Vitali of Italy.
3 Denver International
Airport opened to the
public in February, but
preparations for the
delivery of its elevators
and escalators began back
in 1992. Montgomery
KONE supplied a total of
249 elevators, escalators
and autowalks to the new
facility.
1 2
3
9

21
company to win a Sears "Partners in Progress" award for quality service. This strong
reputation, along with the introduction to the market of new service methods such as
those based on remote monitoring, strengthens the company's position in an
increasingly tough competitive environment. Significant new maintenance
agreements include those for the new Denver International Airport's 263 units, 190
units at Ohio State University in Columbus, 97 units at the Johns Hopkins Medical
Center in Baltimore and 41 units at Queens Medical Center in Honolulu.
Armor KONE and Montgomery Elevator were integrated during the year
under review into an organization with branches (56) and sub-branches in 160
locations throughout the United States. Thanks to the new products introduced to the
market and measures taken to strengthen profitability, this organization will maintain
its market position as both a provider of maintenance and modernization services
and a supplier of new vertical transportation equipment. Demand for new elevators is
expected to grow by 3% during 1996 as Federal budget cuts reduce government
spending for construction but stimulate building in the private sector.
In Canada, building activity remained at a low level in 1995, and
developments are expected to continue along the same lines in 1996.
The most significant KONE delivery to Latin America in 1995 was the
installation of 34 high-rise elevators in Phase II of the DINE project in Mexico City.
Central and South American economies continued to suffer from market perturbation
created by massive devaluations at the end of 1994. An especially negative impact
10

1 Special elevators
destined for Moscow's
Kremlin, with splendid
interiors designed to blend
in with their luxurious
surroundings, were
readied for delivery at the
end of the year from the
Hyvinkää Factory. The unit
pictured here will serve the
Russian president's
administrative offices.
2 KONE's annual
management meeting,
held in Montreal in June,
drew 250 participants from
subsidiaries and
associated companies in 28
countries. The heads of
winning units in the Ride
Comfort Competition were
rewarded with colorful
Native American
headdresses.
was felt by the elevator markets of Mexico and Venezuela. Brazil, which represents
approximately one half of South America's total markets, is implementing its own
program of economic stabilization. During 1996, the whole area's demand for new
elevators is expected to remain at the same level as during the previous couple of
years. The trend in price levels is toward a slight decline except in Brazil.
A S I A A N D A U S T R A L I A
There were significant differences in elevator demand from country to country in
Southeast Asia compared with the previous year. A breakthrough occurred in Japan
with the opening of the market to KONE hydraulic elevators and escalators.
In China, demand was dampened by governmental efforts to cool off an
overheated economy. Markets in Hong Kong and Singapore remained stable
although price developments in Hong Kong exhibited a slight decline. In Taiwan,
both demand and price dropped sharply.
The growth in construction activity predicted for Indonesia in 1995 did not
materialize. In 1996, as well, growth is expected to remain low as both office and
housing sector construction demand is declining. On the other hand, strong growth
continues in Malaysia, where KONE obtained a record volume of new orders.
Demand is also expected to continue growing in the Philippines, especially in the
Manila region.
Toward the end of the year several important orders for deliveries to Kuala
Lumpur in Malaysia were received: Twin Towers (30 elevators), Matrade (23
elevators, 6 escalators) and Phileo Damansara (72 elevators). Other significant orders
from Asian customers included 53 elevators for the Taiwan National Defense Medical
Center and 26 elevators and four escalators for the U Chu Liang Tower office
complex in Bangkok.
In India, the market situation has already been improving for two years even
though the approaching 1996 elections slowed the development of real estate
markets, especially in the western part of the country. During 1996, the elevator
market is expected to pick up again.
Competition in Asia continues to become tougher as customers demand the
highest possible quality. KONE is meeting this challenge by strengthening its quality
improvement processes, introducing new mid-range elevators to the market, and
investing in personnel training. The prospects for growth and profitability in the
service sector are particularly good.
In Australia and New Zealand, the growth in elevator and escalator demand
continued and price levels improved, especially in the shopping and recreation
center and residential construction sectors. Although office construction remained
weak, it is expected to pick up during 1996. The Olympic Games, to be held in
Sydney in the year 2000, are expected to stimulate increased demand in the hotel
sector.
In the Middle East, demand remained at the 1994 level. The focal point in
construction shifted from the public to the private sector as competition in the region
increased.
11


MLC Centre, Sydney. This
67-story tower's 25
elevators were completely
modernized during 1989-
1993. Elevator speeds
range from 3.0 to 7.0 m/s.
Existing drive and control
systems were replaced
with KONE TMS 900
controls and SCD static
converter drives.
KONE's sales during the year under review totaled FIM 9,523 million, compared to
FIM 7,638 million for the previous year. The entire sales figure for 1995 was
generated by the elevator and escalator business (elevator and escalator sales for
1994 totaled FIM 7,440 million); the last remaining units not involved in vertical
transportation - KONE Instruments Corporation and the KONE Steel Foundry
Corporation - were sold during the year. The increase in sales totals for 1995 is
attributable to the integration of figures from Montgomery KONE Inc. of the United
States, which added approximately FIM 2,000 million to KONE's total turnover.
The value of new orders received totaled FIM 6,635 million, compared to
FIM 5,281 million in 1994 (elevator and escalator orders in 1994: FIM 5,060 million).
New orders increased by more than 30% with the inclusion of Montgomery KONE
Inc.'s figures accounting for more than 85% of the increase.
KONE's order book at the end of the year under review stood at FIM 5,742
million. The order book figure for the end of 1994 was FIM 5,874 million (elevator and
escalator orders: FIM 5,851 million). Both the 1994 and 1995 figures include
Montgomery KONE Inc.'s orders in hand.
At the end of 1995, it became clear that fundamental errors had been made
for several years in the reporting of KONE's Italian companies' operations. As a result,
it was necessary to correct over- and undervaluations in certain items in the Balance
Sheet. Rectified results for the previous years are shown in the Notes on the
Consolidated Financial Statements on page 27. Overstated assets and understated
liabilities from the previous years have been deducted from retained earnings.
KONE's 1995 income after taxes was FIM 67 million. Contributing to this
result were costs related to the reorganization of production and administration, 1995
provisions made for continuation of this program during 1996, and the additional
provisions necessitated by the corrective actions program undertaken in Italy at the
end of 1995.
Operating income before depreciation totaled FIM 693 million (corrected
figure for 1994: FIM 671 million) and operating income FIM 274 million (corrected
1994: FIM 326 million). Income after financing items was FIM 202 million. Net income
was FIM 67 million (corrected 1994: FIM 143 million). Earnings per share stood at
FIM 13.67 (corrected 1994: FIM 23.60).
KONE Corporation's Board of Directors proposes to the Annual General
Meeting that, despite the temporarily weakened result, dividends of FIM 9 per A-
series share and FIM 10 per B-series share be declared for 1995.
Report on Operations
P R O D U C T S A N D M A R K E T S
Elevator, escalator and modernization orders exclusive of maintenance business
totaled FIM 6,635 million in 1995, which was more than 30% higher than the FIM
5,060 million figure for the previous year. The inclusion of Montgomery KONE Inc.'s
figures accounted for nearly 85% of this growth.
Practically speaking, the volume of modernization orders did not grow
during the year under review. New elevator and escalator orders produced what
real growth there was.
13

Sales and Personnel by Country
Sales 1995 FIM million Number of employees
USA 2,672 4,365
France 1,218 2,331
Finland 1,206 1,704
Italy 1,079 2,604
Germany 785 972
Sweden 534 888
Belgium 448 780
Netherlands 421 638
United Kingdom 378 837
Austria 334 476
Australia 333 680
Hong Kong 294 534
Canada 220 471
Denmark 150 260
Brazil 146 615
Norway 130 193
Spain 100 262
Taiwan 53 121
Singapore 50 76
Czech Republic 48 344
Malaysia 41 88
Mexico 39 319
India 31 668
Turkey 19 122
Venezuela 17 168
Japan 13 2
Others 29 351
Total 10,788 20,869
Intracorporate sales (1,265)
THE KONE GROUP 9,523
In Northern Europe, new orders remained at a low level. Only special
industrial projects and an increase in market share in Norway produced a little
growth.
In Central and Southern Europe, new elevator and modernization demand
either declined or, at best, remained at the previous year's level. Anticipated growth
in eastern Central European markets has not yet begun to materialize.
Sales targets were surpassed in North America. Montgomery KONE's market
share in the United States is approximately 20%.
In the Far East, new orders in 1995 exceeded the previous year's volume by
almost one third, but fluctuations from country to country were strong.
Various market conditions and future prospects are explored in greater
detail in the Review by Market Area on pages 7-11.
14

1991
1992
1993
1994
1995
FIM million
10000
8000
6000
4000
2000
Sales 1991–1995
Other KONE Elevators
1991
1992
1993
1994
1995
FIM million
9000
7200
5400
3600
1800
Orders received 1991–1995
Other KONE Elevators
1991
1992
1993
1994
1995
FIM million
7000
5600
4200
2800
1400
Order book 1991–1995
Other KONE Elevators
S A L E S
KONE's net sales for 1995 totaled FIM 9,523 million, compared to FIM 7,638 million
(elevator business: FIM 7,440 million) for the previous year. The growth in business
volume was 28%, which is the same size as the contribution made by the addition of
Montgomery KONE Inc.'s figures to KONE's totals. Montgomery KONE Inc.'s sales
figures for December, 1994 (the company was acquired November 30, 1994) are
also included in KONE's 1995 sales figures.
New elevator and escalator deliveries worth FIM 3,686 million were
completed in 1995, compared with FIM 2,829 million in 1994, representing growth of
more than 30%. New elevator and escalator sales accounted for 39% of KONE's total
turnover.
Maintenance and modernization business sales development was also
positive. Sales for 1995 totaled FIM 5,837 million, compared to FIM 4,611 million for
the previous year, representing growth of approximately 26%. The total number of
elevators and escalators under maintenance contract increased by about 10,000 from
the end of 1994, when it was 415,000 (including Montgomery KONE Inc.'s service
base), to approximately 425,000 at the end of 1995. Maintenance and modernization
business was responsible for 61% of KONE's turnover.
The distribution by market area of KONE's consolidated sales figures in FIM
millions was as follows (to maintain comparability, 1994 figures for business units sold
during 1995 have not been included):
1995 1994
European Union* 5,066 4,321
Rest of Europe 358 1,245
North America 2,772 775
Asia and Australia 954 786
Other Areas 373 313
Total 9,523 7,440
*New member countries in 1995: Austria, Finland and Sweden.
Sales figures and personnel by country are detailed on page 14 of this
Annual Report.
Europe accounted for 57% of the sales total, North America for 29%, and
Asia, Australia and other areas for 14%.
Sales recorded by the parent company, KONE Corporation, totaled FIM
1,204 million. Its exports from Finland were valued at FIM 860 million.
F I N A N C E , F I N A N C I A L R E S U L T , A N D C O N S O L I D A T E D
B A L A N C E S H E E T
KONE's financial result is derived exclusively from its elevator and escalator
business. The non-elevator business units sold during 1995 do not appear in KONE's
figures except as extraordinary expenses. Montgomery KONE Inc.'s figures in the
Consolidated Statement of Income cover the 13-month period beginning December
1, 1994.
15


Two Peachtree Tower,
Atlanta, Georgia.
Montgomery KONE
modernized the 23
elevators in this 41-story
office tower during 1994-
96. Elevator speeds range
from 2.5 to 5.0 m/s. The
upgrade included new
control systems, doors and
door operators.
1991
1992
1993
1994
1995
FIM million
450
360
270
180
90
Financial result 1991–1995
Income after financing items Net income
1991
1992
1993
1994
1995
%
5
4
3
2
1
Income after financing items as % of turnover 1991–1995
%
1991
1992
1993
1994
1995
80
64
48
32
16
Gearing 1991–1995
A special audit conducted during the autumn in Italy confirmed that
fundamental errors had been made over a period of years in KONE's Italian
subsidiaries' accounts. Non-existent work had been added to the reports of the value
of work in progress and receivables that did not exist had been added to the
accounts receivable. In addition, accounts payable and accruals were not fully
reported. As a consequence, the shareholders' equity figure in the 1994
Consolidated Balance Sheet at the end of the year was approximately FIM 170 million
too high. Because these errors concern past years, they have been entered as
deductions from retained earnings. The corrected Consolidated Statements of
Income from 1992-94 are presented in the Notes on the Consolidated Financial
Statement as is the impact on shareholders' equity. KONE's key figures have also
been adjusted to correspond to the rectified Consolidated Financial Statement.
Even though the previous years' reporting errors by the Italian subsidiaries
have been entered as deductions from shareholders' equity, KONE's income after
taxes for 1995 remained poor.
During the year under review, the Thorn Factory in the Netherlands and the
Peterborough Factory in England were closed. Component production in Kista,
Sweden was discontinued altogether as was the manufacture of certain components
in Liège, Belgium; Hannover, Germany; and Moline, Illinois, in the United States. The
decision was also made to end production at the Prague Factory in the Czech
Republic. Costs already created by the rationalization of production and
administration as well as provisions made for the continuation of these programs
weakened the 1995 result.
Exceptional measures were designed to clean up KONE's Italian operations.
These operations are currently producing losses, but the possibility exists for rapid
improvement of profitability. Costs resulting from rationalization plans have been
deducted from the 1995 result.
The figures for 1994 in the Consolidated Statement of Income, shown for
purposes of comparison, have not been corrected. In the paragraphs below, several
key figures for 1995 are shown with comparable 1994 figures that have been
corrected (as reported in greater detail in the Notes on the Consolidated Financial
Statements) in parentheses.
Operating income before depreciation was FIM 693 million (FIM 671 million),
which was 7.3% of turnover. Operating income totaled FIM 274 million (FIM 326
million). Net income was FIM 67 million (FIM 143 million) and earnings per share
FIM 13.67 (FIM 23.60).
Consolidated total assets on December 31, 1995 were FIM 7,542 million.
KONE's assets employed totaled FIM 3,317 million, consisting of FIM 166 million in
net working capital and FIM 3,214 million in fixed assets. Shareholders' equity was
FIM 2,313 million and interest-bearing net debt was FIM 1,067 million (1,288 million).
In accordance with KONE's financial policy, loans by subsidiaries are made
in each country's own currency. Equities in foreign subsidiaries have been partially
hedged according to equity-hedging policy through long-term swaps, forward
contracts and option strategies. All sales contracts are hedged, and estimated
currency requirements are selectively covered for the next 6-12 month period. The
major share of KONE's loans have floating interest rates. Interest risks are reduced
17

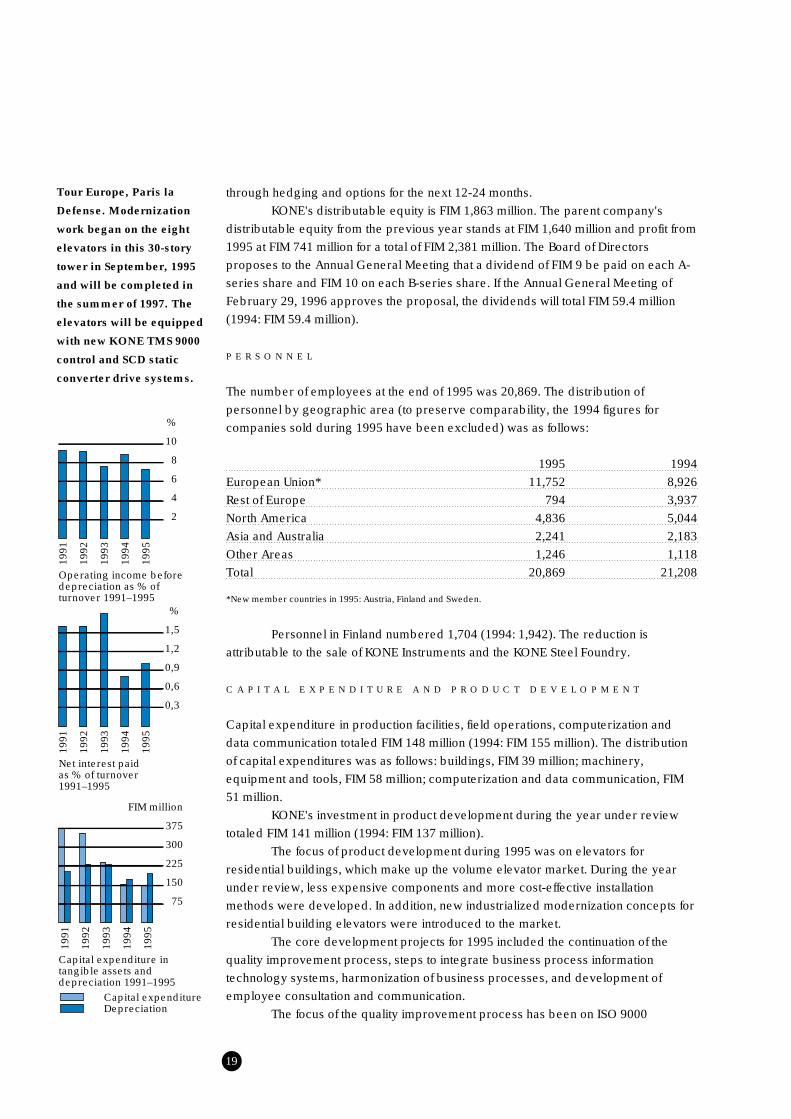
Tour Europe, Paris la
Defense. Modernization
work began on the eight
elevators in this 30-story
tower in September, 1995
and will be completed in
the summer of 1997. The
elevators will be equipped
with new KONE TMS 9000
control and SCD static
converter drive systems.
1991
1992
1993
1994
1995
%
10
8
6
4
2
Operating income before depreciation as % of turnover 1991–1995
1991
1992
1993
1994
1995
%
1,5
1,2
0,9
0,6
0,3
Net interest paid as % of turnover 1991–1995
1991
1992
1993
1994
1995
FIM million
375
300
225
150
75
Capital expenditure in tangible assets and depreciation 1991–1995
Capital expenditure Depreciation
through hedging and options for the next 12-24 months.
KONE's distributable equity is FIM 1,863 million. The parent company's
distributable equity from the previous year stands at FIM 1,640 million and profit from
1995 at FIM 741 million for a total of FIM 2,381 million. The Board of Directors
proposes to the Annual General Meeting that a dividend of FIM 9 be paid on each A-
series share and FIM 10 on each B-series share. If the Annual General Meeting of
February 29, 1996 approves the proposal, the dividends will total FIM 59.4 million
(1994: FIM 59.4 million).
P E R S O N N E L
The number of employees at the end of 1995 was 20,869. The distribution of
personnel by geographic area (to preserve comparability, the 1994 figures for
companies sold during 1995 have been excluded) was as follows:
1995 1994
European Union* 11,752 8,926
Rest of Europe 794 3,937
North America 4,836 5,044
Asia and Australia 2,241 2,183
Other Areas 1,246 1,118
Total 20,869 21,208
*New member countries in 1995: Austria, Finland and Sweden.
Personnel in Finland numbered 1,704 (1994: 1,942). The reduction is
attributable to the sale of KONE Instruments and the KONE Steel Foundry.
C A P I T A L E X P E N D I T U R E A N D P R O D U C T D E V E L O P M E N T
Capital expenditure in production facilities, field operations, computerization and
data communication totaled FIM 148 million (1994: FIM 155 million). The distribution
of capital expenditures was as follows: buildings, FIM 39 million; machinery,
equipment and tools, FIM 58 million; computerization and data communication, FIM
51 million.
KONE's investment in product development during the year under review
totaled FIM 141 million (1994: FIM 137 million).
The focus of product development during 1995 was on elevators for
residential buildings, which make up the volume elevator market. During the year
under review, less expensive components and more cost-effective installation
methods were developed. In addition, new industrialized modernization concepts for
residential building elevators were introduced to the market.
The core development projects for 1995 included the continuation of the
quality improvement process, steps to integrate business process information
technology systems, harmonization of business processes, and development of
employee consultation and communication.
The focus of the quality improvement process has been on ISO 9000
19


99 Bishopsgate, London.
This office tower located in
the City of London was
completely renovated in
1995 following a 1993
bombing. KONE supplied a
total of 17 elevators of
which 10 represent KONE
9000 technology at speeds
of 3.0 - 6.0 m/s.
1991
1992
1993
1994
1995
%
30
24
18
12
6
Total equity/total assets 1991–1995
1991
1992
1993
1994
1995
%
15
12
9
6
3
Return on equity 1991–1995
1991
1992
1993
1994
1995
%
15
12
9
6
3
Return on capital employed 1991–1995
certification, which provides a solid basis for continued development of work
processes. Upgrading KONE's information technology systems will, over the long
run, standardize the organization's worldwide data handling and communication
processes. Development of KONE's business processes is directed toward
improving cost-effectiveness and increasing customer satisfaction.
An agreement on employee consultation and communication consistent with
EU directives in this area was signed early in the summer by KONE management and
employee representatives from KONE companies within the European Union.
O U T L O O K
No significant growth is expected in our main market area, Europe. Obstacles to the
revival of the housing construction market are government budget deficits, high real
interest rates and high unemployment rates. Prices remain stagnant, and tough
competition is forcing us to raise our own cost efficiency through more competitive
products and business processes. KONE is responding to this challenge with
numerous development projects.
KONE's current activities in North America are proving to be competitive.
Former KONE business units have been integrated into Montgomery KONE Inc.,
market share has been retained, and profitability corresponds to the goals that have
been set.
The various national markets in the Far East are going through powerful
changes. KONE has been able to expand in Asia, where approximately half of all new
elevators and escalators in the world are being installed. The value of new orders
received in 1995 in this part of the world surpassed the previous year's figure by
30%. KONE's market shares in the Far East still remain small, but efforts continue to
increase them. Gaining a foothold in very competitive markets takes years and
requires continuous investment.
The order book for new equipment and modernizations (excluding service
business) at the end of 1995 stood at FIM 5,742 million (1994, including only elevator
business: FIM 5,851 million). This represents more than a year's worth of deliveries.
The number of elevators and escalators under service contract has grown
steadily. At the end of 1995 KONE had 425,000 units in service, representing a
growth of approximately 10,000 units from the previous year.
Competition in maintenance markets continued to tighten. Nevertheless,
KONE has been able to keep its maintenance profitability at a steady level by
improving internal productivity.
Both the one-time disappointment from KONE's Italian operations and the
ongoing recession in many markets, which called for intensifying cost-cutting
measures, weighed heavily on business activities in 1995. The Italian operation can
rapidly be made profitable again, but the general market situation will require us to
make continued efforts to maintain competitiveness.
KONE's 1996 result will be clearly better than that achieved during the year
under review. However, the targets set for improved profitability will not be achieved
by the projects and restructuring efforts already underway until 1997 and 1998.
21

PRINCIPLES OF CONSOLIDATION
The consolidated accounts include the parent company andthose companies in which the parent company held directly orindirectly more than 50 % of the voting power at the end of theyear. Subsidiaries acquired during the financial year have beenincluded in the consolidated financial statements from the date ofacquisition. Holdings in housing and real estate companieswhose consolidation is not relevant to providing a true and fairview of KONE's net income and financial position have not beenincluded in the consolidated financial statements.
Investments in associated companies have beenaccounted for in the consolidated financial statements under theequity method. An associated company is a company in whichthe group holds 20-50 % of the voting power and has aparticipating interest of at least 20%.
Investments in other companies are stated at cost. Thebook value of investments has been reduced, where necessary,to estimated net realizable value.
Intracorporate transactions have been eliminated in theconsolidated financial statements.
Intracorporate shareholdings have been eliminated bydeducting the amount of each subsidiary's equity at the time ofacquisition from the acquisition cost of its shares. The differencebetween a subsidiary's acquisition cost and its equity at the timeof acquisition has been entered as goodwill. The value ofelevator and escalator maintenance contracts acquired is alsoincluded as goodwill.
The KONE group's share of the profit or loss of anassociated company is shown in the Consolidated Statement ofIncome as a separate item. The depreciation of goodwill fromthe acquisition of the shares of associated companies is includedin KONE's goodwill depreciation. The dividends received fromthe associated companies are not included in the ConsolidatedStatement of Income. The KONE group's share of the associatedcompanies' shareholders' equity at the date of acquisition,adjusted by changes in the associated companies' equity afterthe date of acquisition, is shown in the Balance Sheet under"shares and participating interests". Goodwill from theacquisition of the shares of associated companies is shownunder goodwill.
In certain countries, tax legislation allows allocations tobe made to untaxed reserves. These allocations are not subjectto taxation on condition that the corresponding deductions havealso been made in the accounts. In the consolidated financialstatements, the yearly allocations - reserves as well as thedifference between the depreciation according to plan anddepreciation accepted by tax laws - have been added to netincome, excluding the change in the calculative deferred taxliability. The deferred tax liability is determined from theaccumulation of untaxed reserves. The accumulation of untaxedreserves, excluding the calculative deferred tax liability, isincluded in the shareholders' equity in the Consolidated BalanceSheet. Accumulated deferred tax liability is shown as a separateliability item in the Consolidated Balance Sheet.
The taxes shown in the Consolidated Statement ofIncome include revenue-based taxes to be paid on the basis oflocal tax legislation as well as the effect of the yearly change inthe deferred tax liability, determined from the untaxed reservesby using the current tax rate. Tax credits related tointracorporate dividends or dividends from the associatedcompanies have been deducted from taxes in the ConsolidatedStatement of Income.
Minority shares are shown as a separate item in theConsolidated Statement of Income and Balance Sheet. Theminority share in the Statement of Income is calculated from theincome before allocation to untaxed reserves but after taxesadjusted by the change in the calculative deferred tax liability.The minority share in the Balance Sheet is calculated from thesum of shareholders' equity and accumulation of untaxedreserves, of which the calculative deferred tax liability has beendeducted.
The financial statements of foreign subsidiaries havebeen converted into Finnish markkas at the rates current on thelast day of the year. Translation differences resulting fromconverting the shareholders' equity of foreign subsidiaries havebeen included as a separate item in shareholders' equity.
Accounting principles
FOREIGN CURRENCY ITEMS
Foreign exchange items and derivatives made to cover foreignexchange and interest rate risks have been valued at theDecember 31 rates. The changes in value of foreign currencyitems have been included in the Statement of Income as interestor exchange rate differences according to the periodizing of thehedged item. The exchange rate differences resulting fromderivatives and foreign currency loans which are designated ashedges on net investments in foreign subsidiaries have beenmatched against the translation differences and entered undershareholders' equity in the Balance Sheet.
DEBITING PRINCIPLE
The sale of products is debited at the time when they have beenhanded over to the customer and the sale of services when theyhave been carried out.
RESEARCH AND DEVELOPMENT COSTS
Research and development costs are charged to income duringthe year in which they are incurred.
PENSION SETTLEMENTS AND COSTS
Pensions are generally handled for KONE companies by outsidepension insurance companies. Pension costs and changes inpension obligations are charged to the Statement of Income.
LEASING
Leasing charges are entered as rental costs in the Statement ofIncome. Remaining leasing contract charges are entered insection 17 of Notes on the Consolidated Financial Statementsunder "Contingent liabilities and pledged assets".
EXTRAORDINARY ITEMS
One-time items of significance that arise from other thanordinary activities are shown under "Extraordinary items".
VALUATION AND DEPRECIATION OF FIXED ASSETS
Fixed assets are stated at cost. In addition, certain land andbuildings can be stated at revalued amounts. A predeterminedplan is used in carrying out depreciation of fixed assets.Depreciation is based on the estimated useful economic life ofvarious assets as follows:- Buildings 5-40 years- Machinery and equipment 4-10 years- Goodwill 5-20 years- Other long-term expenses 4-5 years
Depreciation of goodwill is generally carried out over five years.When considerable goodwill is created by the acquisition of asubsidiary or creation of an associated company which results inKONE's acquiring significant market share, the depreciationperiod can be greater than five but no more than twenty years.
INVENTORIES
Inventories are valued at no more than the likely sales priceaccording to FIFO principles. Raw materials and supplies,however, are valued at standard costs. Semi-manufactures havebeen valued at variable production costs. Work in progressincludes direct labor and material costs as of 31st December, aswell as a proportion of indirect costs related to production andinstallation of orders included in work in progress.
PROVISION FOR LIABILITIES AND CHARGES
Future expenses to which companies have committedthemselves and which will produce no future income arecharged against income as a provision for liabilities and charges.The same concerns those future losses which seem certain to berealized.
22

1995 % 1994 %
SALES 9,523,242 7,661,665
Cost and expenses Note 1 (8,830,024) (6,875,755)
Depreciation Note 2 (419,076) (345,149)
OPERATING INCOME 274,142 2.9 440,761 5.8
Share of associated companies' net income 15,759 24,582
Financing income and expenses Note 3 (87,773) (62,612)
INCOME AFTER FINANCING ITEMS 202,128 2.1 402,731 5.3
Extraordinary items (15,719) —
INCOME BEFORE TAXES 186,409 2.0 402,731 5.3
Taxes Note 4 (118,272) (142,079)
Minority share (1,223) (3,125)
NET INCOME 66,914 0.7 257,527 3.4
Consolidated Statement of Income (FIM '000)
Rectified Statements of Income for 1992, 1993 and 1994 are shown in the Notes on the Consolidated Financial
Statements.
23

ASSETS 31.12.1995 31.12.1994
FIXED ASSETS AND
OTHER LONG-TERM INVESTMENTS
Intangible assets
Goodwill Note 5 1,717,382 1,879,847
Other long-term expenditures Note 6 102,190 122,800
1,819,572 2,002,647
Tangible assets
Land Note 7 147,757 161,560
Buildings Note 8 615,133 622,152
Machinery and equipment Note 9 517,928 665,965
Shares and participating interests Note 10 95,518 94,458
Advance payments 18,322 9,260
1,394,658 1,553,395
TOTAL FIXED ASSETS AND
OTHER LONG-TERM INVESTMENTS 3,214,230 3,556,042
CURRENT ASSETS
Inventories
Raw materials, supplies and semi-manufactured goods 402,464 495,211
Work in progress 1,571,912 1,744,836
Advance payments 24,753 22,783
Advance payments received (1,244,356) (1,477,163)
754,773 785,667
Receivables
Accounts receivable 2,092,358 2,082,521
Loans receivable 22,954 127,567
Deferred assets 602,067 538,512
Other receivables 68,285 59,364
Note 11 2,785,664 2,807,964
Short-term investments Note 12 432,089 599,452
Cash and deposits 355,148 195,989
787,237 795,441
TOTAL CURRENT ASSETS 4,327,674 4,389,072
7,541,904 7,945,114
Consolidated Balance Sheet (FIM '000)
24
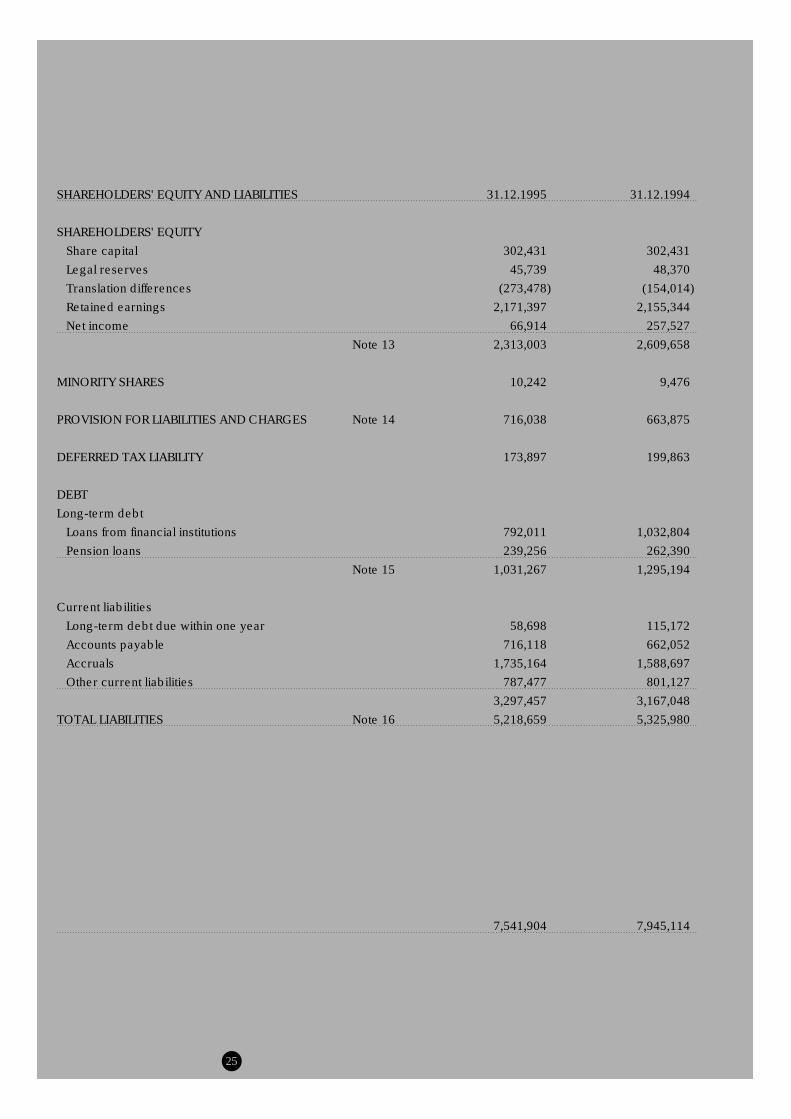
SHAREHOLDERS' EQUITY AND LIABILITIES 31.12.1995 31.12.1994
SHAREHOLDERS' EQUITY
Share capital 302,431 302,431
Legal reserves 45,739 48,370
Translation differences (273,478) (154,014)
Retained earnings 2,171,397 2,155,344
Net income 66,914 257,527
Note 13 2,313,003 2,609,658
MINORITY SHARES 10,242 9,476
PROVISION FOR LIABILITIES AND CHARGES Note 14 716,038 663,875
DEFERRED TAX LIABILITY 173,897 199,863
DEBT
Long-term debt
Loans from financial institutions 792,011 1,032,804
Pension loans 239,256 262,390
Note 15 1,031,267 1,295,194
Current liabilities
Long-term debt due within one year 58,698 115,172
Accounts payable 716,118 662,052
Accruals 1,735,164 1,588,697
Other current liabilities 787,477 801,127
3,297,457 3,167,048
TOTAL LIABILITIES Note 16 5,218,659 5,325,980
7,541,904 7,945,114
25

Consolidated Statement of Cash Flows (FIM million)
1995 1994
Cash receipt from customers 9,455 7,529
Cash paid to suppliers and employees (8,823) (6,595)
Cash flow from financial items (85) (80)
Cash flow from taxes and other items (196) (178)
CASH FLOW FROM OPERATING ACTIVITIES 351 676
Capital expenditure (207) (183)
Proceeds from sale of fixed assets 36 41
Fixed assets of new subsidiaries (2) (1169)
Fixed assets of sold subsidiaries 27 384
CASH FLOW FROM INVESTING ACTIVITIES (146) (927)
CASH FLOW AFTER INVESTING ACTIVITIES 205 (251)
Change in current creditors (net) 47 (92)
Change in long-term debt (net) (262) 133
Dividends paid (59) (59)
Other financing activities 237 186
CASH FLOW FROM FINANCING ACTIVITIES (37) 168
CHANGE IN NET CASH 168 (83)
Cash and bank as of 31st December 355 196
Exchange difference 9 32
Cash and bank as of 1st January 196 311
CHANGE IN NET CASH 168 (83)
RECONCILIATION OF NET INCOME TO CASH FLOW FROM OPERATING ACTIVITIES
NET INCOME 67 257
Depreciation 419 345
Other adjustments 1 3
INCOME BEFORE CHANGE IN WORKING CAPITAL 487 605
Change in receivables (266) 11
Change in payables 75 46
Change in inventories 55 14
CASH FLOW FROM OPERATING ACTIVITIES 351 676
In drawing up the Cash-flow Statement, the impact of variations in exchange rates has been eliminated by adjusting the beginning
balance to reflect the exchange rates prevailing at the time of the closing of the books for the period under review.
26
Notes on the Consolidated Financial Statement
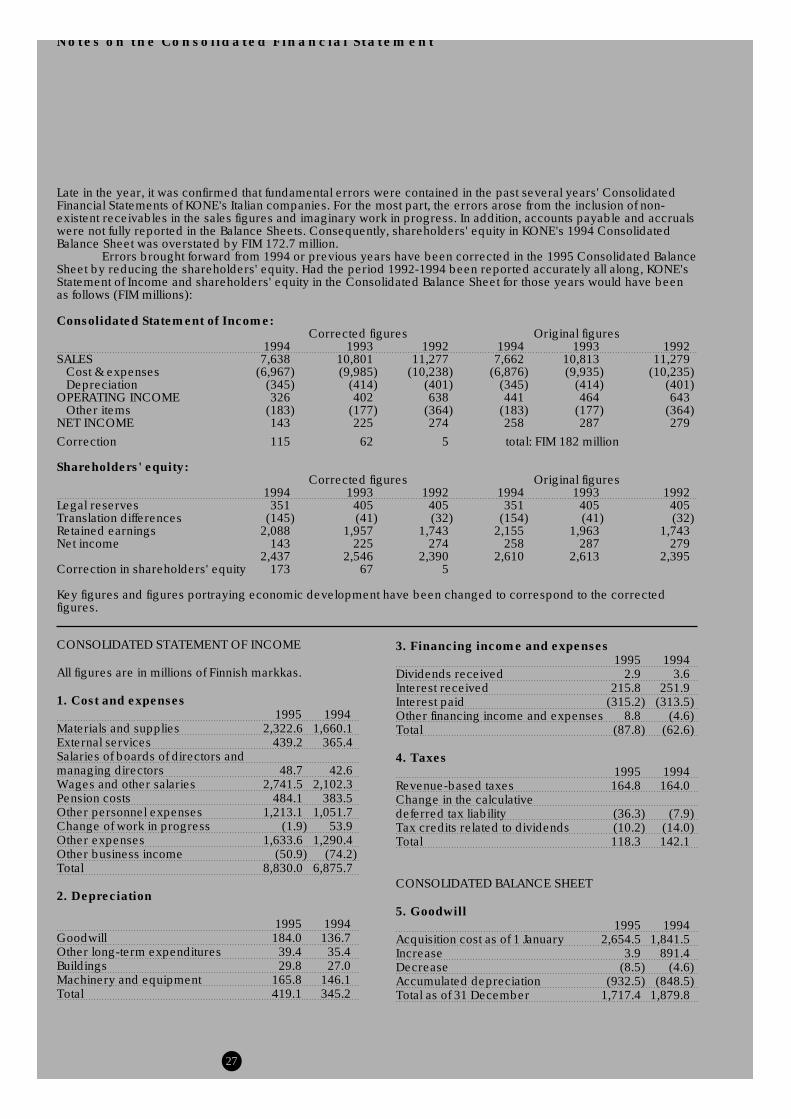
Late in the year, it was confirmed that fundamental errors were contained in the past several years' ConsolidatedFinancial Statements of KONE's Italian companies. For the most part, the errors arose from the inclusion of non-existent receivables in the sales figures and imaginary work in progress. In addition, accounts payable and accrualswere not fully reported in the Balance Sheets. Consequently, shareholders' equity in KONE's 1994 ConsolidatedBalance Sheet was overstated by FIM 172.7 million.
Errors brought forward from 1994 or previous years have been corrected in the 1995 Consolidated BalanceSheet by reducing the shareholders' equity. Had the period 1992-1994 been reported accurately all along, KONE'sStatement of Income and shareholders' equity in the Consolidated Balance Sheet for those years would have beenas follows (FIM millions):
Consolidated Statement of Income:Corrected figures Original figures
1994 1993 1992 1994 1993 1992SALES 7,638 10,801 11,277 7,662 10,813 11,279
Cost & expenses (6,967) (9,985) (10,238) (6,876) (9,935) (10,235)Depreciation (345) (414) (401) (345) (414) (401)
OPERATING INCOME 326 402 638 441 464 643Other items (183) (177) (364) (183) (177) (364)
NET INCOME 143 225 274 258 287 279
Correction 115 62 5 total: FIM 182 million
Shareholders' equity:Corrected figures Original figures
1994 1993 1992 1994 1993 1992Legal reserves 351 405 405 351 405 405Translation differences (145) (41) (32) (154) (41) (32)Retained earnings 2,088 1,957 1,743 2,155 1,963 1,743Net income 143 225 274 258 287 279
2,437 2,546 2,390 2,610 2,613 2,395Correction in shareholders' equity 173 67 5
Key figures and figures portraying economic development have been changed to correspond to the correctedfigures.
CONSOLIDATED STATEMENT OF INCOME
All figures are in millions of Finnish markkas.
1. Cost and expenses1995 1994
Materials and supplies 2,322.6 1,660.1External services 439.2 365.4Salaries of boards of directors andmanaging directors 48.7 42.6Wages and other salaries 2,741.5 2,102.3Pension costs 484.1 383.5Other personnel expenses 1,213.1 1,051.7Change of work in progress (1.9) 53.9Other expenses 1,633.6 1,290.4Other business income (50.9) (74.2)Total 8,830.0 6,875.7
2. Depreciation
1995 1994Goodwill 184.0 136.7Other long-term expenditures 39.4 35.4Buildings 29.8 27.0Machinery and equipment 165.8 146.1Total 419.1 345.2
27
3. Financing income and expenses1995 1994
Dividends received 2.9 3.6Interest received 215.8 251.9Interest paid (315.2) (313.5)Other financing income and expenses 8.8 (4.6)Total (87.8) (62.6)
4. Taxes1995 1994
Revenue-based taxes 164.8 164.0Change in the calculative deferred tax liability (36.3) (7.9)Tax credits related to dividends (10.2) (14.0)Total 118.3 142.1
CONSOLIDATED BALANCE SHEET
5. Goodwill1995 1994
Acquisition cost as of 1 January 2,654.5 1,841.5Increase 3.9 891.4Decrease (8.5) (4.6)Accumulated depreciation (932.5) (848.5)Total as of 31 December 1,717.4 1,879.8

6. Other long-term expenditures1995 1994
Acquisition cost as of 1 January 216.5 183.9Increase 23.8 60.6Decrease (0.6) (4.8)Accumulated depreciation (137.5) (116.9)Total as of 31 December 102.2 122.8
7. Land1995 1994
Acquisition cost as of 1 January 144.7 133.9Accumulated revaluation 4.9 4.9Increase 0.4 38.2Decrease (2.2) (15.4)Total as of 31 December 147.8 161.6
8. Buildings1995 1994
Acquisition cost as of 1 January 845.4 803.0Accumulated revaluation 75.4 93.7Increase 36.6 143.3Decrease (6.0) (27.4)Accumulated depreciation (336.3) (390.5)Total as of 31 December 615.1 622.1
9. Machinery and equipment1995 1994
Acquisition cost as of 1 January 1,572.8 1,718.8Increase 111.2 191.1Decrease (41.1) (113.5)Accumulated depreciation (1,124.9)(1,130.4)Total as of 31 December 517.9 666.0
10. Shares and participating interests1995 1994
Total as of 1 January 94.5 96.0Change in the share in associated companies 5.9 (1.5)Increase 13.5 13.0Decrease (18.4) (13.0)Total as of 31 December 95.5 94.5
The asset value of the shares in associatedcompanies consists of the Group's proportion of theassociated companies' shareholders' equity at theacquisition date, adjusted by any variation in the asso-ciated companies' shareholders' equity after theacquisition.
11. Receivables
Receivables falling due after one year:1995 1994
Accounts receivable 1.7 2.8Loans receivable 21.9 98.9Deferred assets 11.7 11.7Other receivables 62.3 59.4Total 97.6 172.8
Receivables from associated companies:1995 1994
Advance payments - 2.7Accounts receivable 10.1 12.0Loans receivable 1.0 104.4Deferred assets 13.5 33.2Total 24.6 152.3
12. Short-term investments1995 1994
Short-term deposits 68.9 206.7Bonds 286.8 309.6Commercial papers - 9.5Other 76.4 73.7Total 432.1 599.5
13. Shareholders' equity and its changes
Share Legal Transl. Retained. Net in- Totalcapital reserves diff. earnings come for equity
the yearAs of 1 January 302.4 48.4 (154.0) 2,412.8 2,609.7Translation differences (128.9) (128.9)Dividend (59.4) (59.4)Revaluations (2.7) (2.7)Previous years' rectification 9.4 (182.1) (172.7)Net income for the year 66.9 66.9As of 31 December 302.4 45.7 (273.5) 2,171.3 66.9 2,313.0
The previous years' rectification stems fromerrors in the accounts of KONE's Italian companiesleading up to and including 1994.
The accumulation of untaxed reserves,
excluding the calculative deferred tax liability, isincluded in retained earnings and totaled FIM 375.0million (443.3). Accumulated untaxed reserves are notdistributable equity.
28

14. Provision for liabilities and charges
1995 1994Provision for guarantees 54.6 56.6Provision for general andproduct liability claims 261.2 230.2Provision for business reorganizing 126.2 85.0Provision for loss contracts 60.0 68.4Other provisions 214.0 223.7Total 716.0 663.9
15. Long-term debt
Long-term debt falls due as follows:FIM mill. %
1997 309.8 30.01998 120.5 11.71999 395.4 38.32000 18.2 1.8Later 187.4 18.2
16. Liabilities owed to associated companies
1995 1994Accounts payable 9.2 20.4Other current liabilities 5.1 7.6Total 14.3 28.0
29
18. Derivatives
The value of contingent liability derivatives made tocover currency and interest risks was as follows:
1995 1994Forward contracts 2,952.2 2,096.8Interest rate agreements 445.3 180.0Currency options 717.7 496.5Interest options 653.8 871.7Currency swaps 1,009.9 908.7Interest rate swaps 49.0 200.0Total 5,827.9 4,753.7
17. Contingent liabilities and pledged assets
Group Parent company1995 1994 1995 1994
Assets pledged to secure loansGroup and parent company 129.8 159.3 106.0 119.6Subsidiaries - - 13.0 1.0Others 0.8 - 0.8 -
Pledged assets 353.2 347.4 235.0 241.0Guarantees
Subsidiaries - - 2,008.2 2,061.0Associated companies 22.8 27.2 22.8 27.2Others 40.3 357.9 22.7 283.9
Leasing liabilitiesFalling due in the next year 81.3 65.1 3.7 1.8Falling due after 1 year 155.0 100.1 5.7 2.5
Other liabilities - 7.9 - -Total 783.2 1,064.9 2,417.9 2,738.0

Review 1991 - 1995
1995 1994 1993 1992 1991
Net sales FIM mill. 9523 7638 10801 11277 10045
Depreciation " 419 345 414 401 359
Extraordinary items " (16) - 102 - 15
Net income " 67 143 225 273 266
Fixed assets " 3214 3556 3339 3548 3114
Inventories " 1999 2197 2514 2433 2095
Advance payments " 1244 1477 1908 1604 1409
Liquid assets " 3573 3568 4227 4739 4382
Capital expenditure " 148 155 281 429 458
Share capital " 302 302 302 302 302
Other shareholders' equity " 2011 2135 2244 2087 1869
Minority shares " 10 9 30 20 17
Provision for liability and charges " 716 664 448 395 350
Deferred tax liability " 174 200 249 262 241
Long-term debt " 1031 1295 1238 1381 1180
Current liabilities " 3297 3238 3662 4674 4223
Total assets " 7542 7844 8172 9122 8182
Order book as of 31st Dec. " 5742 5874 6384 6822 6038
Number of employees as of 31st Dec. 20869 21553 20710 21426 22284
Figures for 1992-1994 have been adjusted to correspond to corrected information as explained on page 27.
Calculation of Key Figures
net income - extraordinary items + minority share
Return on equity (%) = 100 x –––––––––––––––––––––––––––––––––––––––equity + minority share
(average of figures for the financial year)
income after financing items+ interest + other financing costs
Return on capital employed % = 100 x –––––––––––––––––––––––––––––––––––––––total assets - non-interest-bearing debt
(average of figures for the financial year)
shareholders' equity + minority sharesTotal equity/total assets % = 100 x –––––––––––––––––––––––––––––––––––––––
total assets
net income - extraordinary itemsEarnings/share = –––––––––––––––––––––––––––––––––––––––––
number of shares (issue adjusted)
shareholders' equityEquity/share = –––––––––––––––––––––––––––––––––––––––––
number of shares (issue adjusted)
market value of parent company share 31/12Price/earnings = –––––––––––––––––––––––––––––––––––––––––
earnings/share
interest-bearing debt - liquid assets - loans receivable
Gearing = 100 x ––––––––––––––––––––––––––––––––––––––––shareholders' equity + minority shares
Market value of all = number of shares multiplied by market valueoutstanding shares of B shares as of 31/12.
30

1995 % 1994 %
SALES Note 1 1,203,895 1,303,851
Cost and expenses Note 2 (1,172,673) (1,170,407)
Change in inventories (44,809) (183,716)
Depreciation Note 3 (32,601) (35,405)
OPERATING LOSS (46,188) (3.8) (85,677) (6.6)
Financing income and expenses Note 4 693,333 204,927
INCOME AFTER FINANCING ITEMS 647,145 53.8 119,250 9.1
Extraordinary items Note 5 25,196 81,848
INCOME BEFORE TAXES AND ALLOCATIONS 672,341 55.8 201,098 15.4
Depreciation difference Note 6 20,344 (1,270)
Allocations to untaxed reserves Note 7 68,758 19,666
Taxes (20,686) (24,018)
NET INCOME 740,757 61.5 195,476 15.0
Parent Company: Statement of Income (FIM '000)
31

Parent Company: Balance Sheet (FIM '000)
ASSETS 31.12.1995 31.12.1994
FIXED ASSETS AND OTHER
LONG-TERM INVESTMENTS
Intangible assets
Intangibles Note 8 151,250 0
Other long-term expenditures Note 9 4,079 3,952
155,329 3,952
Tangible assets
Land Note 10 9,181 9,252
Buildings Note 11 84,344 79,617
Machinery and equipment Note 12 98,684 105,653
Shares in subsidiaries Note 13 2,222,098 2,081,052
Other stocks and shares Note 14 34,526 42,791
2,448,833 2,318,365
TOTAL FIXED ASSETS AND OTHER
LONG-TERM INVESTMENTS 2,604,162 2,322,317
CURRENT ASSETS
Inventories
Raw materials, supplies and semi-manufactured goods 36,301 31,253
Work in progress 139,219 189,076
Advance payments 1,046 659
176,566 220,988
Receivables Note 15
Accounts receivable 241,951 248,578
Loans receivable 950,577 792,968
Deferred assets 100,357 109,460
1,292,885 1,151,006
Short-term investments Note 16 296,678 277,586
Cash and deposits 32,634 6,718
329,312 284,304
TOTAL CURRENT ASSETS 1,798,763 1,656,298
4,402,925 3,978,615
32

SHAREHOLDERS' EQUITY AND LIABILITIES 31.12.1995 31.12.1994
SHAREHOLDERS' EQUITY
Share capital 302,431 302,431
Legal reserves 12,945 12,945
Retained earnings 1,640,006 1,503,947
Net income 740,757 195,476
Note 17 2,696,139 2,014,799
UNTAXED RESERVES Note 18 207,809 296,911
PROVISION FOR LIABILITIES AND CHARGES Note 19 17,276 13,862
DEBT Note 20
Long-term debt Note 21
Loans from financial institutions 18,272 334,000
Pension loans 237,997 255,912
Other long-term debt 631,770 205,493
888,039 795,405
Current liabilities
Loans from financial institutions 8,309 58,232
Pension loans 17,914 19,824
Advances received 112,648 203,847
Accounts payable 302,546 127,266
Accruals 106,046 143,755
Other current liabilities 46,199 304,714
593,662 857,638
TOTAL DEBT 1,481,701 1,653,043
4,402,925 3,978,615
33

Parent Company: Statement of Cash Flows (FIM million)
1995 1994
Cash receipt from customers 1,122 1,361
Cash paid to suppliers and employees (1,021) (1,079)
Cash flow from financial items 697 201
Cash flow from taxes and other items - (41)
CASH FLOW FROM OPERATING ACTIVITIES 798 442
Capital expenditure (338) (1,677)
Proceeds from sale of fixed assets 23 1,046
CASH FLOW FROM INVESTING ACTIVITIES (315) (631)
CASH FLOW AFTER INVESTING ACTIVITIES 483 (189)
Change in current creditors (net) (311) 207
Change in long-term debt (net) 93 189
Dividends paid (59) (59)
Other financing activities (180) (169)
CASH FLOW FROM FINANCING ACTIVITIES (457) 168
CHANGE IN NET CASH 26 (21)
Cash and bank as of 31st December 32 6
Cash and bank as of 1st January 6 27
CHANGE IN NET CASH 26 (21)
RECONCILIATION OF NET INCOME TO CASH FLOW FROM OPERATING ACTIVITIES
NET INCOME 741 195
Depreciation 33 36
Other adjustments (89) (104)
INCOME BEFORE CHANGE IN WORKING CAPITAL 685 127
Change in receivables 18 38
Change in payables 50 93
Change in inventories 45 184
CASH FLOW FROM OPERATING ACTIVITIES 798 442
34

All figures are in millions of Finnish markkas. Figuresin parentheses in the text refer to the preceding year.
STATEMENT OF INCOME
1. Sales
Sales to subsidiaries totaled FIM 611.3 million (518.9)corresponding to a share of 51 % (40%) of net sales.
2. Cost and Expenses
Cost and expenses were spread as follows:1995 1994
Materials and supplies 495.3 503.5External services 61.0 81.7Salaries of board of directors andmanaging director 3.3 2.0Wages and other salaries 212.5 209.4Pension expenses 44.5 52.7Other personnel expenses including vacation pay 86.3 86.0Other expenses 280.3 263.6Other business income (10.5) (28.5)Total 1,172.7 1,170.4
Fringe benefits amounted to FIM 4.5 million(4.7). The Statement of Income includes a FIM 3.4million increase in the provision for liabilities andcharges in 1995. The average number of employeesduring the year was 1,574 (1,603).
3. Depreciation
1995 1994Other long-term expenditures 1.4 1.7Buildings 3.0 3.0Machinery and equipment 27.7 29.7Shares and partnerships 0.5 1.0Total 32.6 35.4
4. Financing Income and Expenses1995 1994
Dividends received from subsidiaries 684.4 145.1Other dividends received 1.0 38.3Interest received from subsidiaries 55.7 27.4Other interest received 43.1 54.3Interest paid to subsidiaries (41.3) (16.2)Other interest paid (43.7) (42.9)Other financing income and expenses (5.9) (1.1)Total 693.3 204.9
Notes on the Parent Company Financial Statements
5. Extraordina
Capital gains Group contribuGroup contribuOther expenseTotal
6. Depreciatio
Buildings Machinery andOther intangiblTotal
7. Allocations
Allocation to retransition perioAllocation to reAllocation to rein acquisition cTotal
BALANCE SHE
8. Intangible
Acquisition cosIntracorporate Decrease Accumulated dTotal as of 31 D
35
ry Items
1995 19943.7 65.9
tions received 22.8 16.7 tions granted (0.6) (0.8)s (0.7) -
25.2 81.8
n Difference1995 1994
0.8 (24.0) equipment 19.5 25.4e assets - (2.7)
20.3 (1.3)
to Untaxed Reserves
1995 1994serve for d 63.1 10.0serve for guarantees 2.3 6.3serve for change osts 3.3 3.4
68.7 19.7
ET
Assets
1995 1994t as of 1 January - -increase 151.2 -
- -epreciation - -ecember 151.2 -

9. Other Long-term Expenditures
1995 1994Acquisition cost as of 1 January 8.9 16.6Increase 1.5 4.0Decrease - (2.8)Accumulated depreciation (6.3) (13.8)Total as of 31 December 4.1 4.0
10. Land
1995 1994Acquisition cost as of 1 January 4.3 11.9Accumulated revaluation 4.9 10.0Increase - -Decrease - (12.7)Total as of 31 December 9.2 9.2
11. Buildings
1995 1994Acquisition cost as of 1 January 86.1 198.8Accumulated revaluation 69.6 154.0Increase 8.6 0.3Decrease (0.8) (86.6)Accumulated depreciation (79.2) (186.9)Total as of 31 December 84.3 79.6
12. Machinery and Equipment
1995 1994Acquisition cost as of 1 January 299.3 619.1Increase 24.2 21.1Decrease (3.5) (71.5)Accumulated depreciation (221.3) (463.0)Total as of 31 December 98.7 105.7
13. Shares in Subsidiaries
1995 1994Total as of 1 January 2,081.0 1,647.5Increase 147.7 1,650.2Decrease (6.6)(1,228.7)Transfer from other shares - 12.0Total as of 31 December 2,222.1 2,081.0
14. Other Stocks and Shares
1995 1994Total as of 1 January 42.8 56.8Increase 4.6 1.2Decrease (12.4) (2.2)Transfer to shares in subsidiaries - (12.0) Depreciation (0.5) (1.0)Total as of 31 December 34.5 42.8
15. Receivables
Receivables falling due after one year:
1995 1994Accounts receivable - 0.7Loans receivable 19.6 6.8Deferred assets 11.7 11.7Total 31.3 19.2
Receivables from group companies:
1995 1994Accounts receivable 177.2 190.7Loans receivable 929.7 782.0Deferred assets 23.7 22.8Total 1,130.6 995.5
Receivables from associated companies:
1995 1994Accounts receivable 4.9 0.7Loans receivable 1.0 0.4Total 5.9 1.1
16. Short-term Investments
1995 1994Bonds 286.8 256.2Other investments 9.9 21.4Total 296.7 277.6
36

17. Shareholders' Equity and Its Changes
Share Legal Retained Net income Totalcapital reserves earnings for the equity
yearAs of 1 January 302.4 13.0 1,699.4 2,014.8Dividend (59.4) (59.4)Net income for the year 740.7 740.7As of 31 December 302.4 13.0 1,640.0 740.7 2,696.1
Legal reserves are held as reserve funds. The totalnumber of shares is 6,048,612 with a nominal value ofFIM 50 each. A total of 2,250 shares with a nominalvalue of FIM 112,500 has been redeemed for thecompany, leaving the shareholders 6,046,362 sharesof which 1,045,482 are "A" shares and 5,000,880 are "B"shares.
18. Untaxed Reserves
18.1 Cumulative depreciation differences
1995 1994Other long-term expenditures 2.8 2.7Buildings (19.4) (18.7)Machinery and equipment 85.3 105.1Total 68.7 89.1
18.2. Other untaxed reserves
1995 1994Reserve for transition period 134.0 197.1Reserve for guarantees 5.1 7.4Reserve for change in acquisition costs - 3.3Total 139.1 207.8
19. Provision for Liabilities and Charges
1995 1994Provision for guarantees 7.9 5.8Other provisions 9.4 8.0Total 17.3 13.8
37
20. Liabilities Owed to Group and AssociatedCompanies
Liabilities owed to group companies:
1995 1994Other long-term debt 631.8 205.5Advances received 16.1 23.9Accounts payable 227.8 67.4Accruals 2.4 13.1Other short-term liabilities - 286.0Total 878.1 595.9
Liabilities owed to associated companies:
1995 1994Advances received 0.4 0.8Accounts payable 1.1 6.6Accruals - 0.8Total 1.5 8.2
21. Long-term debt
Long-term debt falling due after five years:
1995 1994Loans from financial institutions 3.9 5.4Pension loans 178.0 191.4Total 181.9 196.8

22. Group Subsidiaries and Associated Companies as of December 31, 1995
Book Shareholding (%) Net incomevalue Parent Group for the year(FIM ‘000) company (FIM ‘000)
22.1. SUBSIDIARIES
Shares in subsidiaries held by the parent company
NL KONE B.V. 901,856 47.5 100.0 227,087NL Komont Investment B.V. 421,261 31.6 100.0 21,351AU KONE Elevators Pty Ltd. 355,243 30.0 100.0 26,453BE KONE Belgium S.A. 43,023 99.9 99.9 5,497BE KONE International S.A. 796,026 90.9 100.0 78,694BR KONE Participacoes e Importacoes Ltda 41,254 99.9 100.0 0HK KONE Far East Limited 2,617 99.9 100.0 2,804IN KONE Elevator India Ltd. 14,226 70.0 70.0 1,525GB KONE (UK) Ltd. 33,634 100.0 100.0 -5,251IT KONE Italia S.p.A. 589,990 0.5 100.0 5,891AT KONE Sowitsch AG 6,793 90.0 100.0 22,031CA KONE Holdings (Canada) Inc. 59,918 100.0 100.0 1,259NO KONE Aksjeselskap 15,502 100.0 100.0 666FR Société Francaise des Ascenseurs KONE 39,129 95.0 99.9 112,803FR KONE France S.A. 214 99.8 99.8 0SE KONE AB 108,614 100.0 100.0 24,773SE Måsbo AB 52,792 100.0 100.0 425FI Antinkoski Oy 11,176 100.0 100.0 775FI Hissi-Ala Oy 4,726 100.0 100.0 120FI Kone Elevators Oy 15 100.0 100.0 1,643FI Kone Finance Oy 285,993 100.0 100.0 0FI Ruukintien Instrumentti- ja Anturitekniikka Oy 15,000 100.0 100.0 -23,564FI KOy Natus 14,021 100.0 100.0 54FI KOy Heves 400 100.0 100.0 0FI Laumek Oy 65,000 100.0 100.0 -83TR KONE Asansor Sanayi ve Ticaret A.S. 12,602 55.4 85.4 -688VE Kone Ascensores C.A. 2,442 100.0 100.0 -3,886JP KONE Japan Co. Ltd 313 100.0 100.0 -34
Book Groupvalue shareholding (%)
Other subsidiary shares
NL Compressor Schippers B.V. 3,208 100.0NL Kone Liften B.V. 189,083 100.0NL KONE Nederland N.V. 21,587 100.0NL KONE Starlift B.V. 315,705 100.0AU KONE Elevators (A/NZ) Pty Ltd. 3,247 100.0AU KONE Holdings (Australia) Limited 82,112 100.0BE ARW Liften, n.v. 5,187 100.0BE KONE Elevators Enterprises S.A. 1,555 100.0BE KONE Elevators (Europe) S.A. 186 100.0BE Marelli Technical Service S.A. 622 99.6
BE Techical Services S.A. 2,964 99.9BE Legros-Mons S.A. 2,816 100.0ES KONE Elevadores, S.A. 222,264 100.0HK KONE Elevator (HK) Limited 8,320 100.0GB Bennie Lifts Ltd. 51,218 100.0GB Elecomp Ltd 81 100.0GB Ellis & McDougall Lifts Ltd. 8,655 100.0GB Leonard Lifts Ltd. 35,377 100.0IT Aster S.r.l. 2,486 100.0IT Bassetti Elevatori S.p.A 11,000 100.0
IT Elecomp S.r.l. 55 100.0IT Fiam S.p.A. 86,708 100.0IT Kone Elevators Overseas S.r.l. 3,097 100.0IT Kone Italia Servizi S.r.l. 59,986 100.0IT Kone Universal S.r.l. 14,108 100.0IT Sabiem S.p.A. 60,500 100.0IT Sime S.r.l. 272 100.0IT Slimpa S.p.A. 2,877 100.0CA Drolet Kone Elevators Inc. 3,196 100.0
CA Montgomery KONE Elevator Co. Ltd. 46,097 100.0MX Elevadores KONE-Sabiem S.A. de C.V. 16,602 100.0
38
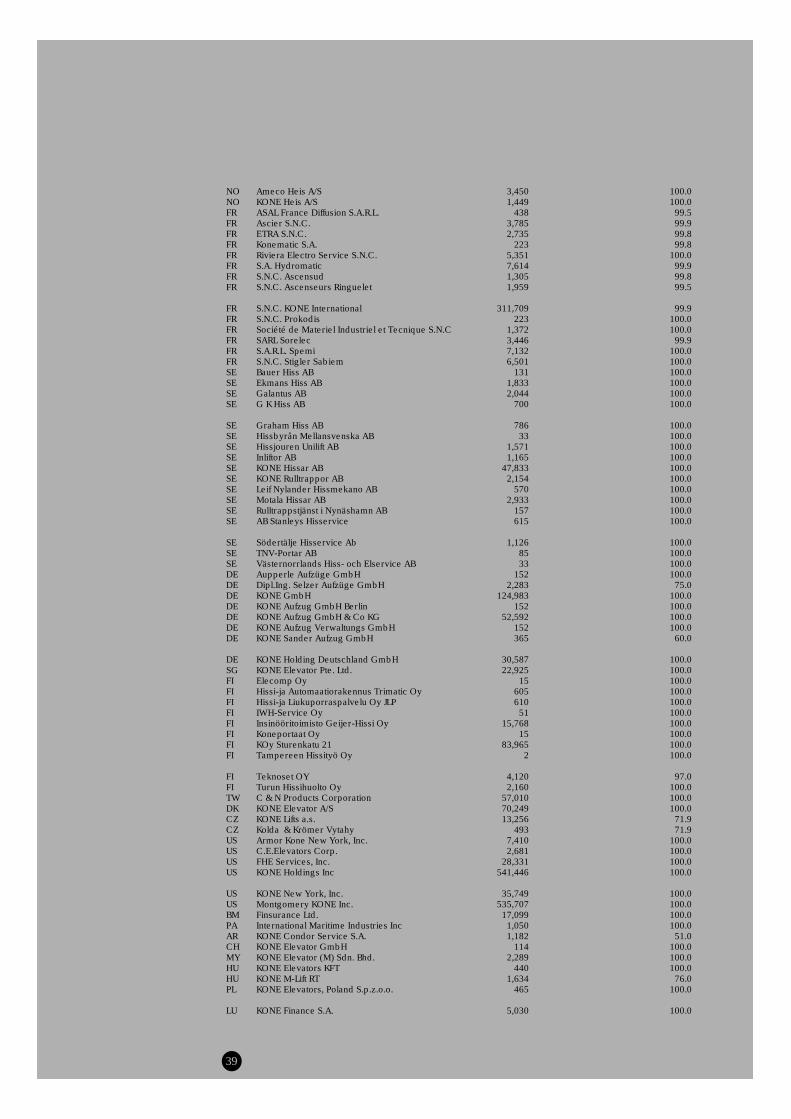
NO Ameco Heis A/S 3,450 100.0NO KONE Heis A/S 1,449 100.0FR ASAL France Diffusion S.A.R.L. 438 99.5FR Ascier S.N.C. 3,785 99.9FR ETRA S.N.C. 2,735 99.8FR Konematic S.A. 223 99.8FR Riviera Electro Service S.N.C. 5,351 100.0FR S.A. Hydromatic 7,614 99.9FR S.N.C. Ascensud 1,305 99.8FR S.N.C. Ascenseurs Ringuelet 1,959 99.5
FR S.N.C. KONE International 311,709 99.9FR S.N.C. Prokodis 223 100.0FR Société de Materiel Industriel et Tecnique S.N.C 1,372 100.0FR SARL Sorelec 3,446 99.9FR S.A.R.L. Spemi 7,132 100.0FR S.N.C. Stigler Sabiem 6,501 100.0SE Bauer Hiss AB 131 100.0SE Ekmans Hiss AB 1,833 100.0SE Galantus AB 2,044 100.0SE G K Hiss AB 700 100.0
SE Graham Hiss AB 786 100.0SE Hissbyrån Mellansvenska AB 33 100.0SE Hissjouren Unilift AB 1,571 100.0SE Inliftor AB 1,165 100.0SE KONE Hissar AB 47,833 100.0SE KONE Rulltrappor AB 2,154 100.0SE Leif Nylander Hissmekano AB 570 100.0SE Motala Hissar AB 2,933 100.0SE Rulltrappstjänst i Nynäshamn AB 157 100.0SE AB Stanleys Hisservice 615 100.0
SE Södertälje Hisservice Ab 1,126 100.0SE TNV-Portar AB 85 100.0SE Västernorrlands Hiss- och Elservice AB 33 100.0DE Aupperle Aufzüge GmbH 152 100.0DE Dipl.Ing. Selzer Aufzüge GmbH 2,283 75.0DE KONE GmbH 124,983 100.0DE KONE Aufzug GmbH Berlin 152 100.0DE KONE Aufzug GmbH & Co KG 52,592 100.0DE KONE Aufzug Verwaltungs GmbH 152 100.0DE KONE Sander Aufzug GmbH 365 60.0
DE KONE Holding Deutschland GmbH 30,587 100.0SG KONE Elevator Pte. Ltd. 22,925 100.0FI Elecomp Oy 15 100.0FI Hissi-ja Automaatiorakennus Trimatic Oy 605 100.0FI Hissi-ja Liukuporraspalvelu Oy JLP 610 100.0FI IWH-Service Oy 51 100.0FI Insinööritoimisto Geijer-Hissi Oy 15,768 100.0FI Koneportaat Oy 15 100.0FI KOy Sturenkatu 21 83,965 100.0FI Tampereen Hissityö Oy 2 100.0
FI Teknoset OY 4,120 97.0FI Turun Hissihuolto Oy 2,160 100.0TW C & N Products Corporation 57,010 100.0DK KONE Elevator A/S 70,249 100.0CZ KONE Lifts a.s. 13,256 71.9CZ Kolda & Krömer Vytahy 493 71.9US Armor Kone New York, Inc. 7,410 100.0US C.E.Elevators Corp. 2,681 100.0US FHE Services, Inc. 28,331 100.0US KONE Holdings Inc 541,446 100.0
US KONE New York, Inc. 35,749 100.0US Montgomery KONE Inc. 535,707 100.0BM Finsurance Ltd. 17,099 100.0PA International Maritime Industries Inc 1,050 100.0AR KONE Condor Service S.A. 1,182 51.0CH KONE Elevator GmbH 114 100.0MY KONE Elevator (M) Sdn. Bhd. 2,289 100.0HU KONE Elevators KFT 440 100.0HU KONE M-Lift RT 1,634 76.0PL KONE Elevators, Poland S.p.z.o.o. 465 100.0
LU KONE Finance S.A. 5,030 100.0
39
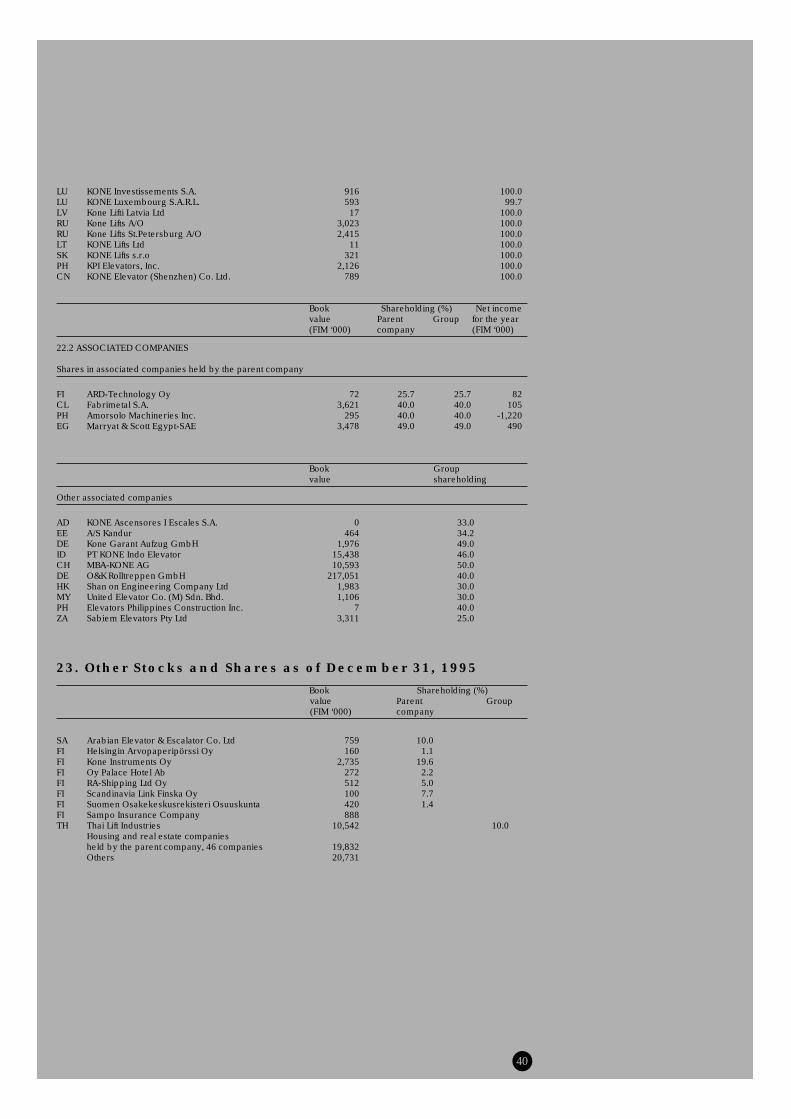
LU KONE Investissements S.A. 916 100.0LU KONE Luxembourg S.A.R.L. 593 99.7LV Kone Lifti Latvia Ltd 17 100.0RU Kone Lifts A/O 3,023 100.0RU Kone Lifts St.Petersburg A/O 2,415 100.0LT KONE Lifts Ltd 11 100.0SK KONE Lifts s.r.o 321 100.0PH KPI Elevators, Inc. 2,126 100.0CN KONE Elevator (Shenzhen) Co. Ltd. 789 100.0
Book Shareholding (%) Net incomevalue Parent Group for the year(FIM ‘000) company (FIM ‘000)
22.2 ASSOCIATED COMPANIES
Shares in associated companies held by the parent company
FI ARD-Technology Oy 72 25.7 25.7 82CL Fabrimetal S.A. 3,621 40.0 40.0 105PH Amorsolo Machineries Inc. 295 40.0 40.0 -1,220EG Marryat & Scott Egypt-SAE 3,478 49.0 49.0 490
Book Groupvalue shareholding
Other associated companies
AD KONE Ascensores I Escales S.A. 0 33.0EE A/S Kandur 464 34.2DE Kone Garant Aufzug GmbH 1,976 49.0ID PT KONE Indo Elevator 15,438 46.0CH MBA-KONE AG 10,593 50.0DE O&K Rolltreppen GmbH 217,051 40.0HK Shan on Engineering Company Ltd 1,983 30.0MY United Elevator Co. (M) Sdn. Bhd. 1,106 30.0PH Elevators Philippines Construction Inc. 7 40.0ZA Sabiem Elevators Pty Ltd 3,311 25.0
23. Other Stocks and Shares as of December 31, 1995
Book Shareholding (%)value Parent Group(FIM ‘000) company
SA Arabian Elevator & Escalator Co. Ltd 759 10.0FI Helsingin Arvopaperipörssi Oy 160 1.1FI Kone Instruments Oy 2,735 19.6FI Oy Palace Hotel Ab 272 2.2FI RA-Shipping Ltd Oy 512 5.0FI Scandinavia Link Finska Oy 100 7.7FI Suomen Osakekeskusrekisteri Osuuskunta 420 1.4FI Sampo Insurance Company 888TH Thai Lift Industries 10,542 10.0
Housing and real estate companiesheld by the parent company, 46 companies 19,832Others 20,731
40

Board of Directors’ proposal to theAnnual General Meeting
The KONE group of companies' distributable equity is
FIM 1,863.3 million. The parent company's
distributable equity from the previous year is FIM
1,640,006,002.89 and profit from 1995 is FIM
740,757,283.24 for a total of FIM 2,380,763,286.13.
The Board of Directors proposes to the
Meeting that a dividend of FIM 9 be paid on each of the
1,045,482 A shares, and FIM 10 on each of the
5,000,880 B shares, for a total of FIM 59,418,138. The
Board of Directors further proposes that the rest (FIM
2,321,345,148.13) be retained and carried forward.
It is also proposed that the dividends for 1995
be payable as from 8 March, 1996.
Those shareholders whose stock certificates
have not yet been transferred to the paperless book
entry securities system by March 5, 1996 will receive
their dividends only after the transfer has been
completed.
41
Report of the Auditors
To the shareholders of Kone Corporation
We have audited the accounts, the financial statementsand the corporate governance of Kone Corporation forthe financial year 1995. The financial statementsprepared by the Board of Directors and the ManagingDirector include, both for the group and the parentcompany, a report on operations, an income statement,a balance sheet and notes to the accounts. Based onour audit we express an opinion on these financialstatements and on corporate governance.
We have conducted the audit in accordancewith Finnish Standards on Auditing. Those standardsrequire that we perform the audit to obtain reasonableassurance whether the financial statements are free ofmaterial misstatement. An audit includes examining ona test basis evidence supporting the amounts anddisclosures in the financial statements, assessing theaccounting principles used as well as evaluating theoverall financial statement presentation.
In our opinion the financial statements havebeen prepared in accordance with the Accounting Actand other rules and regulations relevant to thepreparation of financial statements, and give a true andfair view of Kone Corporation's and the Group ofCompanies' results and financial position. The financialstatements can be approved and the members of theBoard of Directors and the Managing Director of theparent company can be discharged from liability forthe financial year audited by us. The proposal of theBoard of Directors concerning the disposal of the profitfor the year is in compliance with the Companies' Act.
We have reviewed the interim reportspublished during the financial year. In our opinion theyhave been properly prepared.
As stated in the Group accounts, the losses ofthe Italian subsidiaries relating to errors made in prioryears have been reported by adjusting the openingbalance of retained earnings. Additional pro formainformation has been presented in the notes to theGroup accounts.
Helsinki, 9th February 1996
SVH Coopers & Lybrand Oy
Authorised Public Accountants
Liisa Mononen Jukka Ala-Mello
Authorised Public Authorised Public
Accountant Accountant
Helsinki, 9th February, 1996
Pekka Herlin Antti Herlin Ilkka Herlin
Jaakko Lassila Gerhard Wendt
Anssi Soila
President

Shares and Shareholders
SHARES AND THEIR RIGHTS
The authorized and issued share capital of KONECorporation is FIM 302,430,600 representing6,048,612 shares with a nominal value of FIM 50 each.
Each A share is assigned one vote, as is eachblock of 10 B shares, with the proviso that eachshareholder is entitled to at least one vote.
In accordance with the Articles of Association,the holders of B shares are entitled to a dividendwhich is a minimum FIM 1.00 and a maximum FIM2.50 higher than the dividend paid to the holders of Ashares.
BOARD OF DIRECTORS’ AUTHORITY CONCERNINGSHARE CAPITAL, CONVERTIBLE BONDS AND STOCKOPTIONS
Prior to the closing of the books for 1995, KONECorporation's Board of Directors had no existingauthority to raise share capital or issue convertiblebonds or stock options, nor had the Corporationissued stock options or convertible bonds prior to theclosing of the books.
SHARE REGISTER
A list of the Corporation's shares and their owners ismaintained in the Central Share Registry. Registeredshareholders by category as of December 31, 1995were as follows:
% of Ownership % of Votes
100 Companies 16.90 50.31200 Financial institutions 46.13 25.11300 Public institutions 3.48 1.36400 Non-profit institutions 4.78 6.44500 Individuals 11.37 10.01600 Foreign 17.34 6.77Total 100.00 100.00
Foreign owned shares registered in the nameof a Finnish nominee are included under the category"Foreign". Such shares totaled 1,044,119 as ofDecember 31, 1995 (17.3% of shares and 6.8% ofvotes).
The figures in the chart do not include theshares which had not been transferred to thepaperless book entry securities system as ofDecember 31, 1995 (2,408 or 0.04% of shares and0.02% of votes).
The share list can be examined at the CentralShare Registry, Piispanportti 12 A, FIN-02240 Espoo.Copies of the list can be obtained for a fee from KONECorporation's Head Office by calling +358 0 475 4215,fax +358 0 475 4309.
STOCK EXCHANGE
KONE Corporation B shares are quoted on theHelsinki Stock Exchange. During the year underreview, 1,509,093 shares were traded, compared with1,339,592 the previous year. Turnover from thetrading totaled FIM 725 million in 1995 and FIM 795million in 1994. The highest share price during theyear was FIM 560, the lowest was FIM 295, and theprice on the last trading day was FIM 363.
LARGEST SHAREHOLDERS AS OF DECEMBER 31,1995
Number % of shares % of votesof shares
Security Trading Oy 1,408,039 23.3 16.2Holding Manutas Oy 766,496 12.7 48.7Pohjola Insurance Company 518,875 8.6 3.4The KONE Foundation 181,598 3.0 5.7Life Insurance Company Suomi 170,300 2.8 1.1Ilmarinen Pension Insurance 170,000 2.8 1.1Herlin, Pekka 124,579 2.1 6.4Municipal Pension Insurance 114,950 1.9 0.7National DepositInsurance Fund 90,023 1.5 0.6The KONE Pension Fund 85,273 1.4 0.6
SHAREHOLDINGS IN KONE CORPORATION AS OFDECEMBER 31, 1995
Shares Number of Number of Percentage Percentageowners shares of owners of shares
1-10 1,039 7,042 20.0% 0.1%11-100 3,069 137,721 59.1% 2.3%101-1000 954 295,246 18.4% 4.9%1001-10000 91 265,337 1.8% 4,4%10001-100000 28 846,325 0.5% 14.0%100001- 10 4,492,283 0.2% 74.3%Total 5,191 6,043,954 100.0% 100.0%
Shares which had not been transferredto the paperless book entry securities system 2,408 0.04 %
The figures for number of owners in this tableinclude those Finnish nominees who have registeredforeign-owned shares in their names.
TOTAL SHAREHOLDING BY THE PRESIDENT ANDTHE MEMBERS OF THE BOARD OF DIRECTORS ASOF DECEMBER 31, 1995:
1995 1994Number of shares 139,426 139,426Percentage of shares 2.3 2.3Percentage of votes 6.5 6.5
42

REVIEW 1991-1995
1995 1994 1993 1992 1991Share capital, FIM million 302.4 302.4 302.4 302.4 302.4
Number of shares as of 31/12,1000 pcs, issue adjusted
A share 1,045 1,045 1,045 1,045 1,045B share 5,001 5,001 5,001 5,001 5,001
Total 6,046 6,046 6,046 6,046 6,046
Market value of alloutstanding shares, FIM million 2,195 3,265 3,446 2,610 2,164
Earnings/share, FIM 13.67 23.60 20.40 45.22 41.52Equity/share, FIM 383 403 421 395 360Price/earnings, B share 26.6 22.9 27.9 9.5 8.7
Market value/share, B share, FIMHighest 560 705 591 455 545Lowest 295 502 432 340 351As of 31/12 363 540 570 430 362
DividendA share, FIM 9.00* 9.00 9.00 9.00 9.00B share, FIM 10.00* 10.00 10.00 10.00 10.00
*Board's proposal
1991
1992
1993
1994
1995
1000x
1750
1400
1050
700
350
B shares traded 1991–1995
1991
1992
1993
1994
1995
FIM
600
480
360
240
120
*At the Helsinki Stock Exchange market rate
on December 31 st.
Market value* of B share 1991–1995
43
1991
1992
1993
1994
1995
FIM million
3500
2800
2100
1400
700
Market value* of all out- standing shares 1991–1995
1991
1992
1993
1994
1995
FIM
45
36
27
18
9
Earnings/share 1991–1995
1991
1992
1993
1994
1995
FIM
450
360
270
180
90
Equity/share 1991–1995
1991
1992
1993
1994
1995
FIM
10
8
6
4
2
Dividend/B share 1991–1995

44

Place Ville-Marie,
Montreal. This 46-story
office building’s 32
elevators plus eight more
in a lower-rise building in
the same complex were
modernized between 1988
and 1991. Elevator speeds
range from 2.5 to 6.0 m/s.
KONE installed TMS 9000
controls and Dynaglide
SCD drive systems.
Addresses
KONE Corporation, subsidiary and joint venture companies and regional offices:(The number following the country name is the country code for use in dialing international telephonecalls.)
■ Subsidiary ▼ Joint Venture ▲ Regional Office ● Other
■
■
■
■
■
HEAD OFFICE
KONE CorporationKartanontie 1P.O. Box 8FIN-00331 Helsinki☎ +358 0 4751Tfx +358 0 475 4309
EUROPE
AUSTRIA (43-):
KONE Sowitsch AGForchheimergasse 34Postfach 140A-1231 Wien☎ (0)1 863 67-0Tfx (0)1 863 67-221Harald Lyon
BELGIUM (32-):
KONE Belgium S.A.Rue de Bruxelles, 174B-4340 Awans☎ (0)41 39 92 11Tfx (0)41 39 92 22Jean-Pierre Chauvarie
KONE International S.A.Avenue E. Van Nieuwenhuyse, 6B-1160 Brussels☎ (0)2 67 69 211Tfx (0)2 67 69 391
CZECH REPUBLIC (42-):
KONE Lifts a.s.Pod sancemi 196CS-18074 Prague 9☎ (0)2 66 00 41 11Tfx (0)2 68 44 919Veikko Sainio
DENMARK (45-):
KONE Elevator A/SLygten 37DK-2400 Copenhagen NV☎ 35 87 80 00Tfx 35 87 80 01Bjarne Lynge Pedersen
45
ESTONIA (372-):
▼ AS KandurMustamäe tee 4EE 0006 Tallinn☎ (2)6 564 173Tfx (2)6 564 174Arvo Kost
FINLAND (358-):
● KONE Corporate OfficesMunkkiniemen puistotie 25P.O. Box 8FIN-00331 Helsinki☎ (9)0 4751Tfx (9)0 475 4496Tx (57) 122848 kone fi
● EleCompP.O. Box 8Munkkiniemen puistotie 25FIN-00331 Helsinki☎ (9)0 475 4429Tfx (9)0 475 3097Carl-Göran Karlsson
● KONE ElevatorsComponent Division M3NKuumolankatu 1P.O. Box 670FIN-05801 Hyvinkää☎ (9)14 4751Tfx (9)14 475 3290Teppo Raitis
● KONE Elevators Export andJoint Venture OperationsMunkkiniemen puistotie 25P.O. Box 8FIN-00331 Helsinki☎ (9)0 4751Tfx (9)0 475 4319Tx (57) 122848 kone fiKari Malmström
● KONE Elevators FinlandSturenkatu 21P.O. Box 51FIN-00511 Helsinki☎ (9)0 47551Tfx (9)0 475 5751Raine-Peter Joutsen
● KONE ElevatorsHigh Rise CenterKuumolankatu 1P.O. Box 675FIN-05801 Hyvinkää☎ (9)14 4751Tfx (9)14 475 2570Risto Kontturi
▲ KONE Elevators Northern &Eastern EuropeMunkkiniemen puistotie 25P.O. Box 8FIN-00331 Helsinki☎ (9)0 4751Tfx (9)0 475 4546Tx (57) 122848 kone fiTor-Erik Sandelin
■ KONE Finance CorporationMunkkiniemen puistotie 25P.O. Box 8FIN-00331 Helsinki☎ (9)0 4751Tfx (9)0 475 4432Helga Lavonen-Ronkainen
FRANCE (33-):
▲ KONE ElevatorsSouthern Europe& Latin AmericaCentre d'Affaires Objectif 22, rue Louis ArmandF-92661 Asnières Cedex☎ 1 41 32 12 90Tfx 1 41 32 12 80Jean-Pierre Chauvarie
■ Société Française desAscenseurs KONÉCentre d'Affaires Objectif 22, rue Louis ArmandF-92661 Asnières Cedex☎ 1 41 32 12 50Tfx 1 47 93 51 81Michel Chartron
GERMANY (49-):
■ KONE Aufzug GmbH & Co KGKölner Strasse 4D-60327 Frankfurt/Main 1(PF 111137, D-60046 Frank-furt/Main)☎ (0)69 75801-0Tfx (0)69 758 01 231Manfred Eiden

▲
▼ O&K Rolltreppen GmbHNierenhofer Strasse 10D-45525 Hattingen☎ (0)2324 205 00Tfx (0)2324 205 215Tx (41) 8229971 okh dHorst Marks
HUNGARY (36-):
■ KONE Elevators Ltd.Bajnok u. 1. fsz. 3H-1063 Budapest☎ (0)1 112 2880Tfx (0)1 269 0164Tomas Permetei
■ KONE M-Lift Rt.Felka u. 4. fsz.2H-1136 Budapest☎ (0)1 149 8676Tfx (0)1 149 5125Gabor Vashegyi
ITALY (39-):
■ Bassetti Elevatori S.p.A.A. Vespucci, 10I-20016 Pero (Milano)☎ (0)2 339 201Tfx (0)2 381 004 34Giovanni Varisco
■ Fiam S.p.A.Via Figino, 41I-20016 Pero (Milano)☎ (0)2 339 231Tfx (0)2 339 0752Tx (43) 33 00 89 fiam p iEttore Bianciardi
● KONE ElevatorsComponent Division M3SVia Figino, 41I-20016 Pero (Milano)☎ (0)2 339 231Tfx (0)2 339 102 75Franco Bergamini
■ KONE Elevators Overseas S.r.l.Via Emilia Ponente, 129I-40133 Bologna☎ (0)51 6470 111Tfx (0)51 311 854Franco Lercari
■ KONE Italia S.p.A.Via Figino, 41I-20016 Pero (Milano)☎ (0)2 339 231Tfx (0)2 3391 0278Tx (43) 330089 fiam p iRoberto Pecchioli
■ KONE Italia Servizi S.r.l.Via Figino, 45I-20016 Pero (Milano)☎ (0)2 380 531Tfx (0)2 380 53 300Paolo Mazza
■ Sabiem S.p.A.Via Emilia Ponente 129I-40133 Bologna(P.O. Box 3164, I-40100Bologna)☎ (0)51 6470 111Tfx (0)51 311 645Tx (43) 510046 sabiem iGino Farina
LATVIA (371-):
■ KONE Lifti Latvija SIADzêrbenes iela 27 aLV-1006 Riga☎ (0)2 554 268Tfx (0)2 558 798Andrejs Livanovics
LUXEMBOURG (352-):
■ KONE Luxembourg S.a.r.l.128, rue du KiemL-8030 Strassen☎ (0)4 55 160Tfx (0)4 55 029Victor Daenen
NETHERLANDS (31-):
▲ KONE Elevators Central EuropeWestvlietweg 62NL-2267 AC Leidschendam(P.O. Box 11, NL-2270 AAVoorburg)☎ (0)70 371 81 91Tfx (0)70 386 24 14Jan-Willem Hoving
■ KONE Starlift B.V.Westvlietweg 62NL-2267 AC Leidschendam(P.O. Box 11, NL-2270 AAVoorburg)☎ (0)70 371 81 91Tfx (0)70 386 76 72Jan-Willem Hoving
NORWAY (47-):
■ Ameco Heis A/SStangeveien 111P.O. Box 160N-2301 Hamar☎ 62 53 30 00Tfx 62 53 15 40Paal Lien
■ KONE Heis A/SFrysjaveien 40N-0884 Oslo(P.O. Box 163 Kjelsås,N-0411 Oslo)☎ 22 23 31 88Tfx 22 18 12 94Paal Lien
POLAND (48-):
■ KONE Elevators Poland Sp.zo.o.Ul. Cybernetyki 1302-677 Warsaw☎ (0)22 43 78 96Tfx (0)22 43 78 96Juha Mennander
RUSSIA (7-):
■ A/O KONE LiftsUl. Giljarovskogo, 4129090 Moscow☎ 095 208 85 78Tfx 095 208 32 88Jukka Kylmälä
■ A/O KONE Lifts St. PetersburgUl. Belostrovskaya, 28197342 St. Petersburg☎ 812 246 90 75Tfx 812 242 22 27Veikko Holmström
▲ KONE Representative OfficeChistyi Pereulok 11/7119034 Moscow☎ 095 241 05 66Tfx 095 230 24 22Tx (64) 413003 kone suJonas Åberg
SLOVAKIA (42-):
■ KONE Lifts s.r.o.Puchovská 1683505 Bratislava☎ (0)7 289 784/7 287 381Tfx (0)7 284 536Lubos Lopatka
SPAIN (34-):
■ KONE Elevadores, S.A.Pº Castellana 173, 4º Dcha28046 Madrid☎ (9)1 57 14 480Tfx (9)1 57 12 480Sergio Neira
SWEDEN (46-):
■ KONE Hissar ABHaukadalsgatan 3S-164 96 Kista☎ (0)8 752 35 00Tfx (0)8 751 23 80Mats Norin
SWITZERLAND (41-):
■ KONE Elevator GmbHRathausstrasse 1CH-6340 Baar☎ (0)42 31 44 35Tfx (0)42 31 71 53Tx (45) 865415 elev chErnst A. Brandenberg
▼ MBA-KONE AGKriesbachstrasse 42CH-8600 Dübendorf☎ (0)1 802 32 32Tfx (0)1 820 00 73Heinz Büttler
TURKEY (90-):
■ KONE Asansör Sanayive Ticaret A.S.Bulgurlu Cad 3281190 Kisikli, ÜsküdarIstanbul☎ (0)216 326 18 48Tfx (0)216 339 31 79Aybars Ertun
UKRAINE (380-):
▲ KONE Representative OfficeUl. Akademika Koroleva,2-a, kv 162252148 Kiev☎ 044 477 6788Tfx 044 477 6788Erkki Mäkelä
46
UNITED KINGDOM (44-):
■ Ellis & McDougall Lifts Ltd.86, Broad StreetGlasgow G40 2PX☎ (0)141 554 7604Tfx (0)141 554 6762Kenneth McDougall
■ KONE Lifts Ltd.168-170 Wellington Road SouthHounslow, Middlesex TW4 5JN☎ (0)181 572 8000Tfx (0)181 572 8389William H. Orchard
NORTH AMERICA
CANADA (1-):
■ Ascenseurs Drolet KONÉ Inc.1730, Ave. NewtonQuebec, Quebec G1P 4J4☎ 418 877 2183Tfx 418 877 1493Pierre Laforte
■ Montgomery KONEElevator Co. Ltd.80 Horner AvenueToronto, Ontario M8Z 4X8☎ 416 252 6151Tfx 416 252 3624David McFadden
U.S.A. (1-):
■ FHE Services, Inc.47-36 36th StreetLong Island City,NY 11101-1800☎ 718 361 7200Tfx 718 361 0074John M. Kijak
▲ KONE Elevators North AmericaOne Montgomery CourtMoline, IL 61265☎ 309 757 1410Tfx 309 757 5623Heimo Mäkinen
■ Montgomery KONE Inc.One Montgomery CourtMoline, IL 61265☎ 309 764 6771Tfx 309 757 1469/1474/5623Heimo Mäkinen
■ Moline Accessories Company325 19th StreetMoline, IL 61265-1395☎ 309 762 6888Tfx 309 762 7475John Mann
LATIN AMERICA
ARGENTINA (54-):
■ KONE Condor Service S.A.Ciudad de la Paz 1231426 Capital FederalBuenos Aires☎ 1 771 67 88Tfx 1 777 90 40Antonio Luiz Pettine
BRAZIL (55-):
■ KONE Elevadores LtdaAv. Dr. Joao Batista de SouzaSoares, 4009Jardim Colonia Paraiso12236-660 Sao José dosCampos - SP☎ (0)123 31 29 66Tfx (0)123 31 94 95Wagner Barbosa
CHILE (562-):
▼ Fabrimetal S.A.San Gerardo, 1125Recoleta, Santiago☎ 621 6052Tfx 621 8935Rodolfo Schaub
MEXICO (52-):
■ ElevadoresKONE-Sabiem S.A. de C.V.Calle Clavel No. 227Col. Atlampa, DelegaciónCuauhtémoc06450 México, D.F.☎ (0)5 541 16 70Tfx (0)5 541 51 28Roberto Demaria
47
VENEZUELA (58-):
■ KONE Ascensores C.A.4ta. Transversal de HorizonteAvenida Romulo GallegosCaracas 1060 A(Apartado de Correos 60093,Chacao, Caracas)☎ (0)2 238 45 61Tfx (0)2 238 37 85Orlando Alcantara
ASIA
CHINA (86-):
■ KONE Elevator(Shenzhen) Co. Ltd.Room 1608-CShenzhen Tian AnInternational BuildingSouth Renmin Road518005 Shenzhen☎ 755 229 5251Tfx 755 229 9097Guo Jin Zhi James
HONG KONG (852-):
▲ KONE Elevators Asia Pacific9/F Tower II,Cheung Sha Wan Plaza833 Cheung Sha Wan RoadKowloon☎ 2 786 6699Tfx 2 786 3293Neil J. Padden
■ KONE Elevator (H.K.) Ltd.9/F Tower II,Cheung Sha Wan Plaza833 Cheung Sha Wan RoadKowloon☎ 2 786 6500Tfx 2 786 3125Tx (802) 36274 kone hxDavid Fryers
INDIA (91-):
■ KONE Elevator India Ltd.50 Vanagaram Road,AyanambakkamMadras 602 102☎ (0)44 625 7419Tfx (0)44 625 7235Tx (81) 4122023 beko inA. Sankarakrishnan
INDONESIA (62-):
▼ PT. KONE Indo ElevatorJl. Berbek Industri I/23Waru-Sidoarjo 61256,East Java☎ 31 849 1946Tfx 31 849 1950Matti Hyytiäinen
JAPAN (81-):
■ KONE Japan Co. Ltd.Yz Building 7F4-4-12 Iidabashi, Chiyoda-ku,Tokyo 102☎ (0)3 3237 9500Tfx (0)3 3237 9355Yasuyuki Oda
MALAYSIA (60-):
■ KONE Elevator (M) Sdn. Bhd.122-124, 3rd Floor,Taman Sri SetapakJalan Gombak53000 Kuala Lumpur☎ (0)3 42 42 855Tfx (0)3 42 48 842A.K. Tan
PHILIPPINES (63-):
■ KPI Elevators, Inc.Suite 903, King's Court 12129 Pasong Tamo corner delaRosa StreetMakati City 1231(P.O. Box 3555,Makati Central PostOffice, Metro Manila)☎ (0)2 811 29 29Tfx (0)2 811 24 66Steve Ponman
SAUDI ARABIA (966-):
▼ Arabian Elevator &Escalator Co. Ltd.(P.O. Box 14326, Jeddah 21424)Villa No.36, Near Sands HotelAl-Andalus StreetJeddah☎ (0)2 660 88 06Tfx (0)2 661 03 73Tx (495) 607431 areeco sjFahad I. Mira

Gra
phi
c d
esig
n V
ulka
ani /
Pas
te-u
p P
aino
juss
it O
y /
Prin
ted
in F
inla
nd b
y Pu
naM
usta
199
6.
SINGAPORE (65-):
■ KONE Elevator Pte. Ltd.510, Thomson Road#09-02 SLF BuildingSingapore 1129☎ 258 56 22Tfx 258 87 34Johnson See
TAIWAN R.O.C. (886-):
■ KONE ElevatorsC&N Products Corporation3rd FloorNo. 7 Sec. 2 Nanking East Rd.Taipei☎ (0)2 563 11 30Tfx (0)2 563 77 01Randall Leu
THAILAND (66-):
▼ Thai Lift IndustriesPublic Co. Ltd.254 Klongprapa RoadKhweang Bangsue,Khet BangsueBangkok 10800☎ (0)2 585 4600Tfx (0)2 587 4795Yuth Tuangtong
UNITED ARAB EMIRATES (971-):
▲ KONE Middle EastGIBCA Ltd., KONE Lift Division(P.O. Box 21474, Dubai)B.M.T.C. Bldg, 1st FloorMurraqabat Road, Port SaidDubai☎ (0)4 69 31 98Tfx (0)4 68 17 87Paavo Pelkonen
AFRICA
EGYPT (20-):
▼ Marryat & Scott Egypt S.A.E.(P.O. Box 104 Dokki, Cairo 2)20 Abu Bakr El Seddki St/DokkiMohandessin, Cairo 2☎ (0)2 337 32 26Tfx (0)2 335 56 34Tx (91) 92198 ramse unMostafa El Nahas
SOUTH AFRICA (27-):
▼ Sabiem Elevators (Pty) Ltd.Cor Hilliard & Earp Streets,OphirtonJohannesburg 2091☎ 11-493 75 39Tfx 11-493 77 08Jack Ligeti
OCEANIA
AUSTRALIA (61-):
■ KONE Elevators Pty. Ltd.Level 2, 60 Pacific HighwaySt. Leonards, NSW 2065☎ (0)2 99 06 98 00Tfx (0)2 99 06 42 29Trevor Nink
NEW ZEALAND (64-):
● KONE Elevators Pty. Ltd.,N.Z. Region81 Union StreetAuckland☎ (0)9 303 9600Tfx (0)9 309 3882Martin Shepherd
4
City Hall, Kuala Lumpur.
This 31-story building’s
six passenger elevators
were completely
modernized during 1994.
The elevators have speeds
of 5.0 m/s. Included in the
modernization were the
installation of TMS 9000
controls and V3F variable
frequency drives.
Back cover: Raffles Hotel,
Singapore. This legendary
hotel was thoroughly
refurbished between 1989
and 1991. KONE supplied
13 elevators and four
escalators to the
restoration project.
8

49
K O N E C O R P O R A T I O N P . O . B O X 8 F I N - 0 0 3 3 1 H E L S I N K I F I N L A N D