kone q2 · kone q2 interim report ... last year we launched a new global volume elevator offering,...
TRANSCRIPT
KONE Q2INTERIM REPORTFOR JANUARY–JUNE 2013
New KONE UltraRope™ technology raises tall buildings to new heights.The innovative KONE UltraRope™ will revolutionize the way tall buildings are designed and built. Due to its durable, lightweight carbon fiber core and special high-friction coating, it opens a new era in high-rise construction.

2Q2
KONE’s Q2: Continued strong progress on a broad basis
April–June 2013 In April–June 2013, orders received totaled EUR 1,638 (4–6/2012: 1,513) million. Orders received grew by
8.2% at historical exchange rates and by 8.7% at comparable exchange rates.
Net sales grew by 14.1% to EUR 1,762 (1,544) million. At comparable exchange rates the growth was 14.8%.
Operating income was EUR 242.8 (210.3) million or 13.8% (13.6%) of net sales (4–6/2012 figures exclude a one-time cost of EUR 37.3 million related to the support function development and cost adjustment pro-grams).
Cash flow from operations (before financing items and taxes) was EUR 325.4 (196.2) million.
KONE specifies its outlook for 2013. KONE’s net sales is estimated to grow by 9–11% at comparable exchange rates as compared to 2012. The operating income (EBIT) is expected to be in the range of EUR 890–920 million, assuming that translation exchange rates do not materially deviate from the situation of the beginning of 2013. KONE previously estimated its net sales to grow by 7–10% at comparable exchange rates as compared to 2012. The previous operating income (EBIT) outlook was EUR 870–920 million, assum-ing that translation exchange rates do not materially deviate from the situation of the beginning of 2013.
January–June 2013 In January–June 2013, orders received totaled EUR 3,351 (1–6/2012: 2,879) million. Orders received grew
by 16.4% at historical exchange rates and by 16.3% at comparable exchange rates. The order book stood at EUR 5,874 (Dec 31, 2012: 5,050) million at the end of June 2013.
Net sales grew by 13.5% to EUR 3,160 (2,785) million. At comparable exchange rates the growth was 13.7%.
Operating income was EUR 403.2 (344.9) million or 12.8% (12.4%) of net sales (1–6/2012 figures exclude a one-time cost of EUR 37.3 million related to the support function development and cost adjustment pro-grams).
Cash flow from operations (before financing items and taxes) was EUR 623.2 (448.4) million.
KEY FIGURES
Comparative figures for 2012 have been restated according to the revised IAS 19 `Employee Benefits´. For further information please see pages 21 and 22.
4–6/2013 4–6/2012 1–6/2013 1–6/2012 1–12/2012
Orders received MEUR 1,638.2 1,513.4 3,350.6 2,879.3 5,496.2
Order book MEUR 5,874.4 5,305.3 5,874.4 5,305.3 5,050.1
Sales MEUR 1,761.7 1,544.1 3,160.4 2,785.4 6,276.8
Operating income (EBIT) MEUR 242.8 210.3 1) 403.2 344.9 1) 828.7 1)
Operating income (EBIT) % 13.8 13.6 1) 12.8 12.4 1) 13.2 1)
EBITA MEUR 247.9 218.9 1) 413.1 362.2 1) 861.5 1)
EBITA % 14.1 14.2 1) 13.1 13.0 1) 13.7 1)
Cash flow from operations
(before financing items and taxes) MEUR 325.4 196.2 623.2 448.4 1,070.8
Net income MEUR 193.7 134.0 319.5 243.5 611.0
Total comprehensive income MEUR 206.4 155.3 349.4 249.9 591.7
Basic earnings per share EUR 0.74 0.52 1.23 0.94 2.35
Interest-bearing net debt MEUR -613.3 -612.4 -613.3 -612.4 -574.0
Total equity/total assets % 41.4 47.9 41.4 47.9 47.1
Gearing % -35.3 -32.8 -35.3 -32.8 -31.3
1) Excluding a MEUR 37.3 one-time cost related to the support function development and cost adjustment programs.
3Q2
KONE’s January–June 2013 review
Matti Alahuhta, President & CEO, in conjunction with the review:
“Our business progress continued to be strong in the second quarter of the year. Orders received grew by 8% to EUR 1,638 million, which is KONE’s second highest quarterly order level ever, right after the exception-ally high order intake of the first quarter of this year. I am also very pleased with the continued slight margin improvement of our orders received in a highly competitive market environment. Sales grew by 14% with particularly strong growth in the new equipment business. Growth was strongest in Asia-Pacific. Operating income grew by 16% to EUR 243 million. Cash flow was very strong at EUR 325 million.
We have worked very actively to be able to further differentiate from our competition with our product and service offerings. Last year we launched a new global volume elevator offering, and the latest inspiring result of our R&D work is the KONE UltraRope™ hoisting technology introduced during the second quarter. This innovative technology brings significant benefits for elevator solutions to buildings higher than 150 meters. It decreases the required space and energy as well as the life-cycle costs, and on the other hand makes the life-cycle longer. It also makes the installation faster, and additionally reduces elevator downtime caused by building sway. KONE UltraRope™ has already received the Council of Tall Buildings and Urban Habitat 2013 Innovation Award.
I would like to take this opportunity to again thank all of our people for their continued good work in all areas of our business. The good spirit within the company and the desire to learn and develop our competitiveness have continuously improved.
Our operating environment developed in line with our expectations in the second quarter. The growth in China slowed down somewhat from the first quarter’s level as we expected but the market growth rate was above 10%, and our expectation is that in 2013 the new equipment market in China will grow by 10–15%. Our long-term view on the market in China also remains favorable, although we believe that its development is transitioning from the very fast growth phase of the past years towards a phase of more moderate growth. Also other markets in Asia-Pacific developed positively during the quarter. In North America, market growth contin-ued. Europe remains challenging, and very few new equipment markets in Europe are experiencing growth. In addition to the weakness in Europe, the pricing environment continues to intensify in many countries around the world in both the new equipment and service markets.
We continue to actively develop KONE in the long-term in this globally diverse market situation. We build new strengths in our development programs all the time, we develop the quality and productivity of all of our operations, and we invest increasingly in the development of our personnel as we strive for catching the full potential of growth opportunities.”

4Q2
Q2/2013Q4/2012Q2/2012
-337
-439
-574
Q2/2013Q4/2012Q2/2012 Q2/201320122011
Q2/201320122011
725
829
403
Q2/201320122011
820
623
Q2/201320122011
185210
196130
325243
Key Figures
EMEA Americas Asia-Pacific EMEA Americas Asia-Pacific New equipment Service
Sales by business Sales by area Personnel by area
3) Including financing and tax items1) Operating profit excluding one-off items
2) Cash flow from operations before financing items and taxes
Working capital3 (MEUR)EBIT1 (MEUR) Cash flow2 (MEUR)
Order book (MEUR) Sales (MEUR)Orders received (MEUR)
5,0505,305
5,225
6,277
4,465
5,496
3,351
3,160
1,2261,513
1,5441,286
1,638
1,762
1,071
52% (47%)
(33%) (38%)
(51%) (48%)
(16%) (14%)
(53%) 46% 47%48%
16% 14%
38% 39%
+16%
+8%
+14%
5,874
+16%
EBIT, cash flow and working capital for 2012 have been restated according to revised IAS 19.
Jun 30, 2013 (December 31, 2012)1–6/2013 (1–6/2012)1–6/2013 (1–6/2012)
5Q2
Accounting PrinciplesKONE Corporation’s Interim Report for January–June 2013 has been prepared in line with IAS 34, `Interim Financial Report-ing´. KONE has applied the same accounting principles in the preparation of this Interim Report as in its Financial State-ments for 2012, published on January 24, 2013. Additionally, the effective changes in the IAS/IFRS standards during 2013 have been adopted.
KONE has applied the revised IAS 19 `Employee Benefits´ from January 1, 2013. According to the revised standard, actuarial gains and losses relating to defined benefit obliga-tions are recognized as they occur. This has increased KONE’s reported employee benefit liability. Net interest cost has replaced interest expense and expected return on plan assets. This change has had no material impact on KONE’s reported net income in 2012.
As a part of the application of the revised IAS 19, KONE has changed the presentation of expenses relating to defined benefit obligations; service cost is presented in employment expenses while net interest is presented in financing expenses. Previously all expenses relating to employee benefits were reported in employment expenses. KONE has also reclassified its employee benefit liability as part of interest-bearing net debt. Previously it was presented as part of working capital.
The comparative figures for 2012 have been restated accordingly. For more information on the IAS 19 restatement impact, please see pages 21 and 22.
Other changes in IAS/IFRS standards have no material impact on the Interim Report. The information presented in this Interim Report has not been audited.
April–June 2013 review
Operating environment in April–June In the second quarter of 2013, the new equipment market in Asia-Pacific continued to grow rapidly, although growth slowed down clearly from the previous quarter’s rate. In other regions, market development remained largely unchanged. New equipment demand in the EMEA region declined slightly in Central and North Europe but remained at a relatively good level, and declined further in South Europe. Market growth continued in North America. The major projects segment grew driven by high activity levels in China and Southeast Asia. The global modernization market was relatively stable, although with regional variation. Maintenance markets grew in most countries, although at low rates in countries where new equipment activity has been weak over the past years. Price competition remained very intense, particularly in regions where the overall market was at a low level.
In the EMEA region, the new equipment market in Central and North Europe declined slightly, but remained at a rela-tively good level. The residential segment grew, but the office and infrastructure segments were at a clearly lower level com-pared to the previous year. New equipment demand grew in Germany and was stable in Switzerland, Austria and the Nor-
dic countries. The market grew in Russia. In South Europe, new equipment demand continued to decline with the most negative development in the residential segment. The market declined further in both Italy and France. Market decline con-tinued also in Spain, but the market showed some first signs of the decline leveling off. The market grew in Turkey and in the Middle East, where demand remained strong in Saudi Ara-bia and recovery continued in Qatar and in the United Arab Emirates. The modernization market declined in most coun-tries in Central and North Europe and continued to decline in South Europe. The maintenance market grew, although with significant variation between countries. Price competition in the maintenance markets remained very intense in many countries, particularly in South Europe.
In the Americas region, new equipment demand contin-ued to grow. In the United States, the recovery of new equip-ment demand was primarily driven by the residential and office segments. In Canada and Mexico, the new equipment market was stable. Modernization activity in North America grew. The maintenance market grew, but price competition remained intense, particularly in the non-residential seg-ments.
In the Asia-Pacific region, the new equipment market con-tinued to grow. The market in China grew rapidly compared to the second quarter of 2012, although with a clearly lower growth rate than in the first quarter of 2013. All residential segments grew with the fastest growth in lower-tier cities. In large cities, the residential segments other than affordable housing continued to be adversely impacted by Chinese gov-ernment measures aimed at managing the development of housing prices. The commercial segment continued to grow, and some growth was seen also in the infrastructure segment with positive development in metro and airport activity. In India, market growth continued driven by the residential and infrastructure segments, although growth was constrained by general economic uncertainty. In Australia, new equipment demand turned to growth with positive development in all segments, and some growth was seen also in modernization. The Southeast Asian markets continued to grow with fast-est growth in Indonesia. Maintenance markets in Asia-Pacific continued to grow. The pricing environment was challenging in all markets and price competition intensified further in the new equipment market in China.
Financial performance in April–JuneOrders received grew by 8.2% as compared to April–June 2012, and totaled EUR 1,638 (4–6/2012: 1,513) million. At comparable exchange rates, KONE’s orders received increased by 8.7%. The margins of orders received continued to slightly improve.
New equipment orders received grew significantly. The growth rate was the fastest in the volume business, while orders received in major projects were at a lower level than in the second quarter of 2012. Modernization orders received
KONE’s January–June 2013 review
6Q2
KONE’s January–June 2013 review
declined slightly. KONE does not include maintenance con-tracts in orders received.
Orders received grew significantly in Asia-Pacific, with the highest growth rates in China, Indonesia and Malaysia. Orders received were stable in the EMEA region with decline in Central and North Europe and in South Europe but growth in the Middle East. The most positive development was seen in the Middle East, Great Britain, Germany and Russia. KONE’s order intake grew slightly in the Americas with growth in the United States and Mexico.
KONE’s net sales grew by 14.1% as compared to April–June 2012, and totaled EUR 1,762 (4–6/2012: 1,544) million. At comparable exchange rates KONE’s net sales growth was 14.8%. Net sales grew in all geographic regions.
New equipment sales accounted for EUR 980.6 (784.8) million and represented an increase of 24.9% over the com-parison period. At comparable exchange rates, new equip-ment sales grew by 25.2%.
Service (maintenance and modernization) sales grew by 2.9% and totaled EUR 781.1 (759.3) million. At comparable exchange rates, the increase was 4.0%. Maintenance sales continued to grow at the earlier good growth rate while mod-ernization sales declined slightly.
KONE’s operating income for the April–June 2013 period totaled EUR 242.8 (210.3) million or 13.8% (13.6%) of net sales (4–6/2012 figures exclude a one-time cost of EUR 37.3 million related to the support function development and cost adjustment programs). The growth in operating income was a result of continued strong new equipment sales growth in Asia-Pacific, China in particular. The positive development in the service businesses also contributed to the growth in oper-ating income. The relative operating income was burdened by the significant growth of the share of new equipment sales of total sales, a high level of deliveries of projects that were booked as orders received with lower margins in 2010 and 2011, particularly in North America, and intense price compe-tition. In addition, KONE continued to increase fixed costs in areas that support the growth of the business, in particular in Asia-Pacific as well as process development and IT.
Cash flow from operations before financing items and taxes in April–June 2013 was EUR 325.4 (196.2) million. The strong growth in cash flow was a result of the improvement in operating income, an increase in accounts payable as well as a
slightly better rotation of accounts receivable and inventories compared to April–June 2012.
January–June 2013 review
Orders received and Order book in January–JuneDuring January–June 2013, the new equipment market declined slightly in Central and North Europe but remained at a relatively good level, whereas the market situation in South Europe weakened further. Market recovery contin-ued in the Americas. The market in Asia-Pacific continued to grow. The Chinese market grew rapidly, although the growth rate slowed down as expected in the second quarter of the year. The global modernization market was relatively stable, although with clear regional variation. The maintenance mar-ket continued to grow. The pricing environment was chal-lenging in all businesses, in particular in markets suffering from a prolonged weakness in the new equipment market.
Orders received grew by 16.4% as compared to January–June 2012, and totaled EUR 3,351 (1–6/2012: 2,879) million. At comparable exchange rates, KONE’s orders received grew by 16.3%. KONE does not include maintenance contracts in orders received.
The order book grew from the end of 2012 by 16.3% and stood at a record high level of EUR 5,874 (Dec 31, 2012: 5,050) million at the end of June 2013. At comparable exchange rates, the increase was 17.3%. The margin of the order book remained at a healthy level. The orders received margin improved slightly.
In the EMEA region, orders received declined slightly as compared to January–June 2012. New equipment orders received declined slightly. The best development was seen in Denmark, the Great Britain, and Russia, and the biggest declines in Finland, Sweden, Turkey, Spain, and France. KONE’s modernization order intake in the EMEA region declined somewhat as compared to January–June 2012. Mod-ernization orders received grew significantly in Germany and in Great Britain, but declined in most other markets.
In the Americas, KONE’s orders received grew very strongly compared to January–June 2012. New equipment orders grew slightly in North America, with strong growth in Canada and Mexico compensating for a decline in the United States.
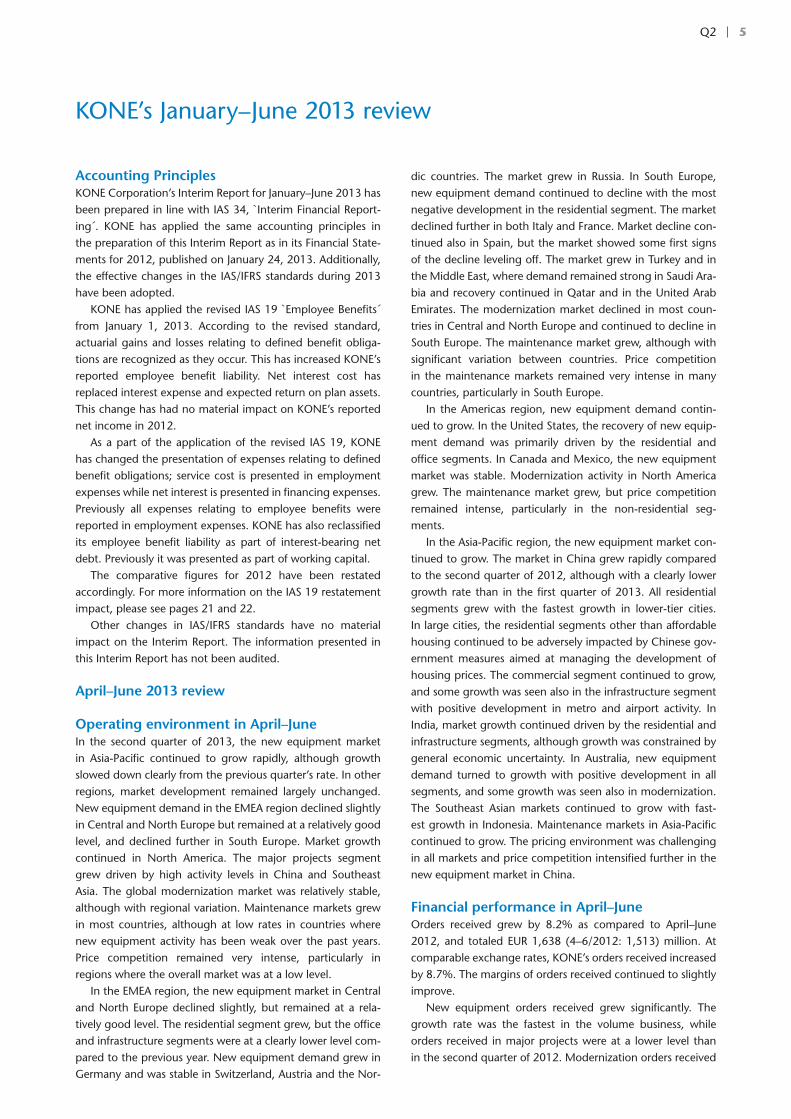
SALES BY GEOGRAPHICAL REGIONS, MEUR
4–6/2013 % 4–6/2012 % 1–6/2013 % 1–6/2012 % 1–12/2012 %
EMEA 1) 761.6 43 758.1 49 1,455.2 46 1,418.7 51 3,094.0 49
Americas 251.2 14 233.6 15 499.7 16 438.6 16 999.0 16
Asia-Pacific 748.9 43 552.4 36 1,205.5 38 928.1 33 2,183.8 35
Total 1,761.7 1,544.1 3,160.4 2,785.4 6,276.8
1) EMEA = Europe, Middle East, Africa
7Q2
In the United States, major project orders received declined but orders received in the volume business developed well. The modernization order intake grew very strongly, driven largely by major projects.
In Asia-Pacific, orders received grew strongly as compared to the first half of 2012. New equipment orders received grew in China, Southeast Asia and India, with China having the highest growth rate. Modernization orders received grew very strongly.
Net salesKONE’s net sales grew by 13.5% as compared to January–June 2012, and totaled EUR 3,160 (1–6/2012: 2,785) million. At comparable exchange rates, KONE’s net sales grew by 13.7%.
New equipment sales accounted for EUR 1,630 (1,318) million and represented an increase of 23.7% over the com-parison period. At comparable exchange rates, new equip-ment sales grew by 23.5%.
Service (maintenance and modernization) sales increased by 4.3% and totaled EUR 1,531 (1,468) million. At compara-ble exchange rates, the increase was 4.8%. Both maintenance and modernization sales grew, maintenance sales at a higher rate than modernization sales.
The share of new equipment sales was 52% (47%) and the share of service sales 48% (53%) of total sales.
Sales in the EMEA region grew slightly as compared to January–June 2012. New equipment and modernization sales declined, while maintenance sales grew.
Sales in the Americas grew significantly as compared to the first half of 2012. Sales grew in all businesses.
Sales in Asia-Pacific grew very strongly as compared to January–June 2012. New equipment and maintenance sales grew, and modernization sales was stable.
The geographical distribution of net sales was 46% (51%) EMEA, 16% (16%) Americas and 38% (33%) Asia-Pacific.
Financial resultKONE’s operating income (EBIT) grew and reached EUR 403.2 (1–6/2012: 344.9) million or 12.8% (12.4%) of net sales (1–6/2012 figures exclude a one-time cost of EUR 37.3 million related to the support function development and cost adjust-ment programs). The growth in operating income was a result of continued strong sales growth in Asia-Pacific, China in par-ticular, and positive development in the service business. The relative operating income was burdened by the significant growth of the share of new equipment sales of total sales, a high level of deliveries of projects that were booked as orders received with lower margins in 2010 and 2011, particularly in North America, and intense price competition. In addition, KONE continued to increase fixed costs in areas that support the growth of the business, in particular in Asia-Pacific as well as process development and IT.
Net financing items were EUR 8.5 (6.7) million. KONE’s income before taxes was EUR 412.8 (316.7) million. Taxes totaled EUR 93.3 (73.2) million, taking into account taxes pro-
portionate to the amount estimated for the financial year. This represents an estimated effective tax rate of 23.5% for the full financial year. Net income for the period under review was EUR 319.5 (243.5) million.
Earnings per share was EUR 1.23 (0.94).
Consolidated statement of financial position and Cash flowKONE’s financial position was very strong during the report-ing period. Cash flow generated from operations (before financing items and taxes) in January–June 2013 was EUR 623.2 (1–6/2012: 448.4) million. The primary drivers of the strong cash flow were the growth in operating income and an improvement in net working capital. The improve-ment in net working capital was largely due to an improved ratio of advance payments received relative to inventories, a slight improvement in the rotation of accounts receivable and inventories as well as an increase in accounts payable. At the end of June 2013, net working capital was EUR -574.0 (December 31, 2012: -439.3) million, including financing items and taxes.
Interest-bearing net debt at the end of June 2013 was EUR -613.3 (December 31, 2012: -574.0) million. KONE’s cash and cash equivalents together with current deposits exceeded EUR 1 billion at the end of the reporting period. Interest-bear-ing liabilities were EUR 521.0 (304.7) million, including a net pension liability of EUR 168.6 (192.7) million and short-term loans of EUR 247.8 (12.8) million. Gearing was -35.3%, com-pared with -31.3% at the end of 2012. KONE’s total equity/total assets ratio was 41.4% at the end of June (December 31, 2012: 47.1%).
Equity per share was EUR 6.69 (7.07).
Capital expenditure and acquisitionsKONE’s capital expenditure, including acquisitions, totaled EUR 59.7 (1–6/2012: 71.0) million. Capital expenditure, excluding acquisitions, was mainly related to facilities and equipment in R&D, IT and production. Acquisitions accounted for EUR 22.9 (19.2) million of this figure.
During January–June 2013, KONE acquired the San Fran-cisco-based business of Empire Elevator Corporation, an eleva-tor maintenance company, in the United States. In addition, KONE completed a number of small acquisitions of mainte-nance companies in Europe during the reporting period. The acquisitions completed during the reporting period do not individually or as a whole have a material impact on the result or financial position of KONE.
Research and developmentResearch and development expenses totaled EUR 46.4 (1–6/2012: 42.6) million, representing 1.5% (1.5%) of net sales. R&D expenses include the development of new product and service concepts and the further development of exist-ing solutions and services. KONE’s elevators and escalators are based on industry-leading energy efficient technology.
KONE’s January–June 2013 review

8Q2
KONE’s customers and end users are at the center of its research and development efforts. In accordance with its vision of delivering the best People Flow™ experience, KONE focuses on understanding the needs of its customers and the users of its solutions in order to ease people flow in buildings and improve user experience. One of KONE’s five develop-ment programs, Innovative Solutions for People Flow, is tar-geted to developing innovative products for an increasingly urbanizing world with a focus on eco-efficiency, ride comfort, and visual design.
During the reporting period, KONE launched the KONE UltraRope™, a new high-rise elevator technology that enables future elevator travel height of one kilometer – twice the dis-tance currently feasible. This technology eliminates the disad-vantages of conventional steel rope and opens up numerous possibilities in high-rise building design. The new technol-ogy brings KONE benefit already for buildings higher than 150 meters. Comprising of a carbon fiber core and a unique high-friction coating, this rope is extremely light. This allows for a significant reduction in elevator energy consumption, improves space efficiency and reduces installation time. KONE UltraRope™ is extremely strong, resistant to wear and abra-sion and has a long lifetime. Elevator downtime caused by building sway is also reduced as carbon fiber resonates at a completely different frequency than conventional building materials. All of this adds up to significantly increased eco-efficiency, durability, and reliability.
KONE also continued to enhance and extend other parts of its equipment and service offering during the reporting period, particularly the volume elevator offering in Europe and North America and the modernization solutions in Asia-Pacific.
PersonnelThe objective of KONE’s personnel strategy is to help the company meet its business targets. The main goals of the strategy are to further secure the availability, engagement, motivation and continuous development of its personnel. All of KONE’s activities are guided by ethical principles. The personnel’s rights and responsibilities include the right to a safe and healthy working environment, personal well-being as well as the prohibition of any kind of discrimination.
KONE defined Employee Engagement as one of its five development programs at the beginning of 2011, and launched action plans focusing on the further development of leadership capabilities, on providing growth and develop-ment opportunities for KONE employees, and on ensuring well-being and safety at work.
During the reporting period, KONE started the roll-out of the new “Managing KONE” business program targeted for branch managers and other general managers of the busi-ness. The delivery of existing training programs continued as planned. A new web-based collaboration platform was launched to enable easier and faster sharing of information and to facilitate co-creation processes.
During January–June 2013, the results of KONE’s eighth annual employee survey were communicated and action plans made on the identified improvement areas. The overall results showed a significant further improvement in employee engagement, and a positive development in all survey dimen-sions. Various wellness programs continued and training material was published to support individual development planning in connection with the up-coming mid-year reviews. The second Global Safety Week was held in May in all KONE units with actions related to employee and end-user safety.
KONE had 40,910 (December 31, 2012: 39,851) employ-ees at the end of June 2013. The average number of employ-ees was 40,363 (1–6/2012: 37,901).
The geographical distribution of KONE employees was 47% (December 31, 2012: 48%) in EMEA, 14% (14%) in the Americas and 39% (38%) in Asia-Pacific.
EnvironmentKONE’s aim is to be the eco-efficiency leader in its industry. The focus in the development of eco-efficient solutions is on further improving energy-saving stand-by and hoisting solu-tions for elevators. The most significant environmental impact of KONE’s business globally relates to the amount of electric-ity used by KONE equipment in their lifetime. This underlines the importance of energy-efficient innovations for elevators and escalators.
KONE has set ambitious targets for 2011–2013 focusing on reducing greenhouse emissions from KONE’s own operations. The most significant impact on KONE’s carbon footprint from its own operations relates to the company’s car fleet, electric-ity consumption, and logistics. KONE also continues to focus on the environmental aspects of its supply chain network.
During the reporting period, KONE announced KONE UltraRope™, a completely new elevator hoisting technology for high-rise buildings that enables significant reductions in elevator energy consumption. Read more about KONE Ultra-Rope™ under Research and development.
KONE also published its Corporate Responsibility Report 2012 during the reporting period. The report follows the B application level of the Global Reporting Initiative guidelines. The reported greenhouse gas emissions in 2012 have been assured by an objective third party.
Other eventsIn 2007 a decision was issued by the European Commission concerning alleged local anticompetitive practices before early 2004 in Germany, Luxembourg, Belgium and the Neth-erlands by leading elevator and escalator companies, includ-ing KONE’s local subsidiaries. Also, the Austrian Cartel Court issued in 2007 a decision concerning anticompetitive prac-tices that had taken place before mid-2004 in local Austrian markets by leading elevator and escalator companies, includ-ing KONE’s local subsidiary. As announced by KONE earlier, a number of civil damage claims by certain companies and public entities, relating to the two 2007 decisions, are pend-
KONE’s January–June 2013 review
9Q2
ing in related countries. The claims have been made against various companies concerned by the decisions, including certain KONE companies. All claims are independent and are progressing procedurally at different stages, with some pro-cesses having ended favorably for KONE. The total capital amount claimed jointly and severally from all of the defen-dants together was EUR 267 million at the end of June (March 31, 2013: EUR 288 million). KONE’s position is that the claims are without merit. No provision has been made.
Risk managementKONE is exposed to risks that may arise from its operations or changes in the business environment. The risk factors described below can potentially have an adverse effect on KONE’s business operations and financial position, and as a result the value of the company. Other risks, which are cur-rently either unknown or considered immaterial to KONE may, however, become material in the future.
A weakening of the global economic environment could result in a deterioration of the global new equipment markets. A disruption in the growth of the construction market in Asia, in China in particular, could result in a decline of the eleva-tor and escalator market. A sharper than expected decrease in the new equipment market in Europe or a disruption in the recovery of the new equipment market in North America could lead to increasingly intensified price competition in both the new equipment and service businesses. All of the above-mentioned factors could lead to a decrease in orders received, cancellations of agreed deliveries, delays in the com-mencement of projects, further intensified price competition, and, as a result, a negative effect on KONE’s profitability. To counteract the pressures resulting from a weakening of the overall economic environment and its impact on the elevator and escalator markets, KONE strives to continuously develop its overall competitiveness.
The continued uncertain global economic environment also exposes KONE to counterparty risks in respect of financial institutions and customers. Exposure to the counterparty risks related to financial institutions arises through the significant amounts of liquid funds deposited into financial institutions. In order to diversify the financial credit risk KONE deposits its funds into several banks and invests a part of its liquidity into highly liquid money market funds. KONE also manages its counterparty risk by accepting only counterparties with high creditworthiness. The size of each counterparty limit reflects the creditworthiness of the counterparty and KONE constantly evaluates such limits.
KONE is also exposed to risks related to the liquidity and payment schedules of its customers, which may lead to credit losses. To mitigate this risk, defined rules for tendering, lev-els of approval authority, and credit control have been estab-lished. The risks related to accounts receivable are minimized also through the use of advance payments, documentary credits and guarantees in KONE’s payment terms. KONE’s customer base consists of a large number of customers in sev-
eral market areas, with no individual customer representing a material share of KONE’s sales.
KONE operates internationally and is thus exposed to risks arising from foreign exchange rate fluctuations related to cur-rency flows from revenues and expenses, as well as from the translation of income statement and statement of financial position items of foreign subsidiaries into euros. The KONE Treasury is responsible for the centralized management of financial risks in accordance with the KONE Treasury Policy approved by the Board of Directors. For further information regarding financial risks, please refer to note 2 in the consoli-dated Financial Statements for 2012.
KONE’s business activities are dependent on the uninter-rupted operation, quality and reliability of sourcing channels, production plants, logistics processes, and IT systems. A signif-icant part of KONE’s component suppliers and supply capac-ity is located in China. The risks related to the supply chain are controlled by analyzing and improving the fault tolerance of processes, diligent forecasting, close cooperation with KONE’s suppliers and by increasing the readiness for transferring the manufacturing of critical components from one production line or supplier to another. KONE actively monitors the opera-tions and financial strength of its key suppliers. The aim is also to secure the availability of alternative sourcing channels for critical components and services. Additionally, KONE has a global property damage and business interruption insurance program in place.
KONE’s operations utilize information technology exten-sively. This may expose KONE to information security viola-tions, misuse of systems and/or data, viruses, malwares and to such malfunctions, which can result in system failures or dis-ruptions in processes and therefore impact KONE’s business. Clear roles and responsibilities have been defined to manage IT security risks to ensure that adequate security is inbuilt within the IT management processes according to security policies, principles and guidelines.
Changes in raw material and component prices are reflected directly in the production costs of elevators, escala-tors and automatic doors, and may therefore have an impact on KONE’s profitability. In order to reduce the impact of material and sourcing price fluctuation KONE aims to enter into fixed-price contracts with its major suppliers for a sig-nificant part of its raw material and component purchases. Because the maintenance business deploys a significant fleet of service vehicles, fuel price fluctuations have an effect on maintenance costs.
KONE operates in certain markets with high growth rates, where there are challenges in terms of the availability of skilled technicians. This could lead to delays in deliveries and increases in costs, which in turn could have an adverse impact on the profitability of the company. KONE manages this risk through proactive project and resource planning in order to ensure that the necessary resources are available.
A significant part of KONE’s costs relate to field operations such as maintenance and installation, which are highly labor-
KONE’s January–June 2013 review
10Q2
intensive. KONE’s profit development could be adversely affected if its productivity improvement targets were not met. These risks are managed through proactive planning and forecasting processes, the constant development of pricing processes and productivity as well as through the outsourcing of certain activities.
KONE introduces new technology and further develops its existing products on a regular basis. The execution of new technology or product releases and the large supplier base involves risks related to the uninterrupted functioning of the delivery chain, product liability and quality. To mitigate such risks, KONE follows defined design, manufacturing and instal-lation processes. Strict quality control processes are also in place in the product and solution development and delivery chain.
Decisions of the Annual General MeetingKONE Corporation’s Annual General Meeting was held in Hel-sinki on February 25, 2013. The meeting approved the finan-cial statements and discharged the responsible parties from liability for the January 1–December 31, 2012 financial period.
The number of Members of the Board of Directors was confirmed as eight. Re-elected as Members of the Board were Shinichiro Akiba, Matti Alahuhta, Anne Brunila, Antti Herlin, Jussi Herlin, Sirkka Hämäläinen-Lindfors, Juhani Kaskeala and Sirpa Pietikäinen and as new Deputy Member of the Board was elected Iiris Herlin.
At its meeting held after the General Meeting, the Board of Directors elected from among its members Antti Herlin as its Chair and Sirkka Hämäläinen-Lindfors as Vice Chair.
Antti Herlin was elected as Chairman and Sirkka Hämäläinen-Lindfors, Anne Brunila and Jussi Herlin as mem-bers of the Audit Committee. Sirkka Hämäläinen-Lindfors and Anne Brunila are independent of both the company and of significant shareholders and Jussi Herlin is independent of the company.
Antti Herlin was elected as Chairman and Jussi Herlin and Juhani Kaskeala as members of the Nomination and Compen-sation Committee. Juhani Kaskeala is independent of both the company and of significant shareholders.
The General Meeting confirmed an annual compensation of EUR 54,000 for the Chairman of the Board, EUR 44,000 for the Vice Chairman, EUR 33,000 for Board Members and EUR 16,500 for Deputy Board Member. In addition, a compensa-tion of EUR 500 was approved for attendance at Board and Committee meetings.
The General Meeting approved the authorization for the Board of Directors to repurchase KONE’s own shares. Alto-gether no more than 25,570,000 shares may be repurchased, of which no more than 3,810,000 may be class A shares and 21,760,000 class B shares. The minimum and maximum con-sideration for the shares to be purchased is determined for both class A and class B shares on the basis of the trading price for class B shares determined on the NASDAQ OMX Helsinki Ltd. on the time of purchase. The authorization shall
remain in effect for a period of one year from the date of deci-sion of the General Meeting.
Authorized public accountants PricewaterhouseCoopers Oy and Heikki Lassila were re-nominated as the Company’s auditors.
The General Meeting approved dividends of EUR 1.745 for each of the 38,104,356 class A shares and EUR 1.75 for the 218,191,425 outstanding class B shares. The date of record for dividend distribution was February 28, 2013, and the divi-dends were paid on March 7, 2013.
Share capital and Market capitalizationThe Annual General Meeting in 2010 authorized the Board of Directors to decide on the issuance of options and other spe-cial rights entitling to shares. The authorization is limited to a maximum of 3,810,000 class A shares and 21,760,000 class B shares. The authorization concerns both the issuance of new shares as well as the transfer of treasury shares, and the issu-ance of shares and of special rights entitling to shares may be carried out in deviation from the shareholders’ pre-emptive rights (directed share issue). The authorization will remain in effect for a period of five years from the date of the decision of the General Meeting.
In 2010, KONE granted a conditional option program. The 2010 stock options were listed on the NASDAQ OMX Helsinki Ltd on April 2, 2013. The total number of stock options was 3,000,000 and 896,000 of them are held by KONE Corpora-tion’s subsidiary. On June 30, 2013 the number of options outstanding was 1,973,400. Each option entitles its holder to subscribe for one (1) new class B share at the price of, from February 26, 2013, EUR 29.45 per share. The share subscrip-tion period for the stock option 2010 is April 1, 2013–April 30, 2015.
In 2013, KONE granted a conditional option program. Stock options 2013 are granted according to the decision of the Board of Directors on January 24, 2013 to approximately 480 key employees and the decision was based on the autho-rization received from the Shareholders Meeting on March 1, 2010. A maximum total of 750,000 options are granted. The original share subscription price for the option was EUR 58.25 per share and it is further reduced in situations mentioned in the terms, for example with dividends distributed before the subscription of the shares. The effective subscription price as per June 30, 2013 was EUR 56.50. Each option entitles its holder to subscribe for one (1) new or an existing company’s own class B KONE share. The share subscription period for the stock options 2013 will be April 1, 2015–April 30, 2017. The share subscription period begins only if the financial perfor-mance of the KONE Group for the financial years 2013–2014, based on the total consideration of the Board of Directors, is equal to or better than the average performance of the key competitors of KONE.
On June 30, 2013, KONE’s share capital was EUR 65,166,680.00, comprising 222,562,364 listed class B shares and 38,104,356 unlisted class A shares.
KONE’s January–June 2013 review
11Q2
KONE’s market capitalization was EUR 15,668 million on June 30, 2013, disregarding own shares in the Group’s pos-session.
Market capitalization is calculated on the basis of both the listed B shares and the unlisted A shares excluding treasury shares. Class A shares are valued at the closing price of the class B shares at the end of the reporting period.
Shares in KONE’s possessionOn the basis of the Annual General Meeting’s authorization, KONE Corporation’s Board of Directors decided to commence the possible repurchasing of shares at the earliest on March 5, 2013.
During January–June 2013, KONE used its previous autho-rization to repurchase own shares in January, and bought back in total 80,000 of its own class B shares. In April, 210,890 class B shares in the company’s possession were assigned to the share-based incentive plan. At the end of June, the Group had 4,029,449 class B shares in its possession. The shares in the Group’s possession represent 1.8% of the total number of class B shares. This corresponds to 0.7% of the total voting rights.
Shares traded on the NASDAQ OMX Helsinki Ltd.The NASDAQ OMX Helsinki Ltd. traded 49.2 million KONE Corporation’s class B shares in January–June 2013, equivalent to a turnover of EUR 3,098 million. The daily average trading volume was 399,979 shares (1–6/2012: 525,722). The share price on June 30, 2013 was EUR 61.05. The volume weighted average share price during the period was EUR 63.03. The highest quotation during the period under review was EUR 72.10 and the lowest EUR 56.25. In addition to the NASDAQ OMX Helsinki Stock Exchange, KONE’s class B share is traded also on various alternative trading platforms. The volume of KONE’s B shares traded on the NASDAQ OMX Helsinki Stock Exchange represented approximately 29% of the total vol-ume of KONE’s class B shares traded in January–June 2013 (source: Fidessa Fragmentation Index, www.fragmentation.fidessa.com).
The number of registered shareholders was 31,690 at the beginning of the review period and 35,193 at its end. The number of private households holding shares totaled 32,313 at the end of the period, which corresponds to approximately 12.7% of the listed B shares.
According to the nominee registers, 46.7% of the listed class B shares were owned by foreign shareholders on June 30, 2012. Other foreign ownership at the end of the period totaled 6.5%. Thus a total of 53.2% of KONE’s listed class B shares were owned by international investors, corresponding to approximately 19.6% of the total votes in the company.
Market outlook 2013In new equipment, the market in Asia-Pacific is expected to grow clearly in 2013. The new equipment market in China is expected to grow by 10–15% in 2013. The market in Central and North Europe is expected to decline slightly, and the mar-ket in South Europe to further decline from an already weak level. The market in North America is expected to continue to grow.
The modernization market is expected to be at about the same level as in 2012 or decline slightly.
The maintenance market is expected to continue to develop rather well in most countries.
Business outlook 2013KONE specifies its outlook for 2013.
KONE’s net sales is estimated to grow by 9–11% at compa-rable exchange rates as compared to 2012.
The operating income (EBIT) is expected to be in the range of EUR 890–920 million, assuming that translation exchange rates do not materially deviate from the situation of the begin-ning of 2013.
Previous business outlook KONE’s net sales is estimated to grow by 7–10% at comparable exchange rates as compared to 2012.
The operating income (EBIT) is expected to be in the range of EUR 870–920 million, assuming that translation exchange rates do not materially deviate from the situation of the beginning of 2013.
Helsinki, July 19, 2013
KONE Corporation’s Board of Directors
KONE’s January–June 2013 review

12Q2
MEUR 4–6/2013 % 4–6/2012 % 1–6/2013 % 1–6/2012 % 1–12/2012 %Sales 1,761.7 1,544.1 3,160.4 2,785.4 6,276.8
Costs and expenses -1,499.5 -1,312.4 -2,718.8 -2,397.5 -5,362.1Depreciation and amortization -19.4 -21.4 -38.4 -43.0 -86.0One-time cost - -37.3 - -37.3 -37.3
Operating income 242.8 13.8 173.0 11.2 403.2 12.8 307.6 11.0 791.4 12.6Share of associated companies' net income 0.9 2.1 1.1 2.4 4.3Financing income 7.9 5.5 14.5 15.4 42.9Financing expenses -3.2 -5.0 -6.0 -8.7 -34.3
Income before taxes 248.4 14.1 175.6 11.4 412.8 13.1 316.7 11.4 804.3 12.8Taxes -54.7 -41.6 -93.3 -73.2 -193.3
Net income 193.7 11.0 134.0 8.7 319.5 10.1 243.5 8.7 611.0 9.7
Net income attributable to:Shareholders of the parent company 191.3 132.0 315.7 240.6 601.1Non-controlling interests 2.4 2.0 3.8 2.9 9.9
Total 193.7 134.0 319.5 243.5 611.0
Earnings per share for profit attributable to the shareholders of the parent company, EUR
Basic earnings per share, EUR 0.74 0.52 1.23 0.94 2.35Diluted earnings per share, EUR 0.74 0.52 1.23 0.94 2.34
Consolidated statement of comprehensive income
MEUR 4–6/2013 4–6/2012 1–6/2013 1–6/2012 1–12/2012Net income 193.7 134.0 319.5 243.5 611.0
Other comprehensive income, net of tax:
Translation differences -19.8 37.8 3.3 23.0 -9.4Hedging of foreign subsidiaries 2.3 -6.5 -0.2 -4.8 1.3Cash flow hedges 9.7 -6.8 10.1 -5.4 1.5Remeasurements of employee benefits 20.5 -3.2 16.7 -6.4 -12.7
Other comprehensive income, net of tax 12.7 21.3 29.9 6.4 -19.3
Total comprehensive income 206.4 155.3 349.4 249.9 591.7
Total comprehensive income attributable to:
Shareholders of the parent company 204.0 153.3 345.6 247.0 581.8Non-controlling interests 2.4 2.0 3.8 2.9 9.9
Total 206.4 155.3 349.4 249.9 591.7
Comparative figures for 2012 have been restated according to the revised IAS 19 `Employee Benefits´, for more information please see pages 21 and 22.
Consolidated statement of income
13Q2
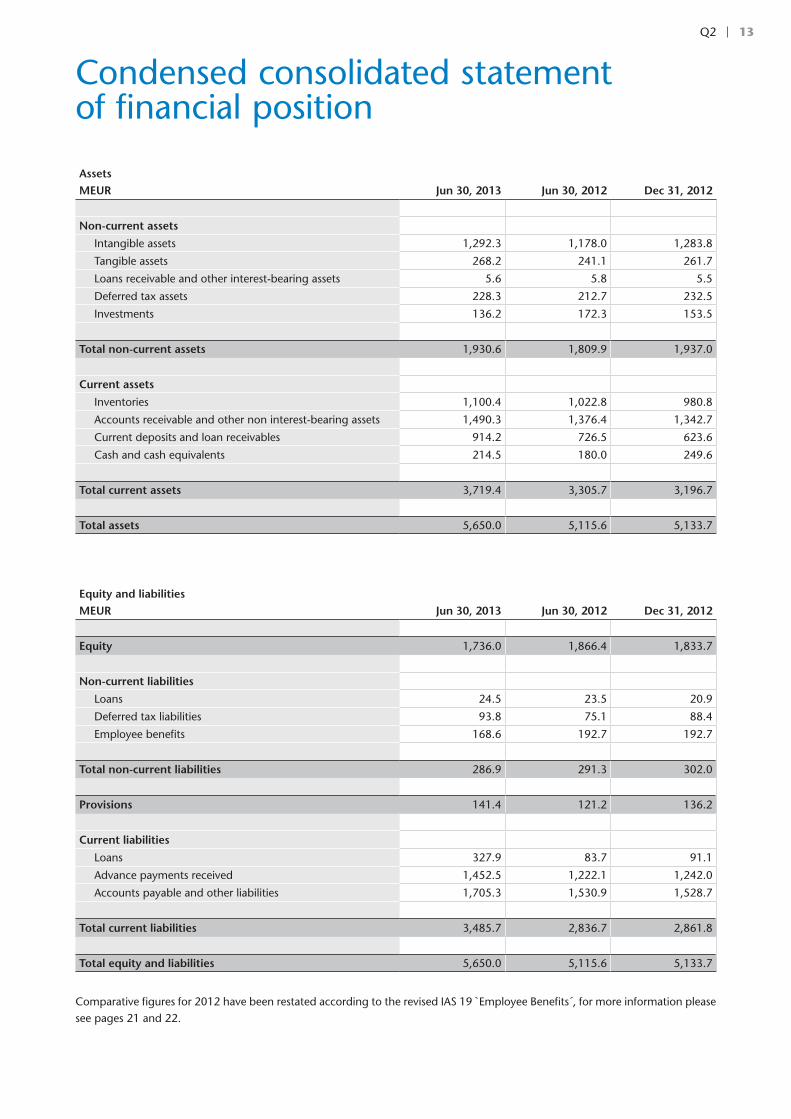
Condensed consolidated statement of financial position
Assets MEUR Jun 30, 2013 Jun 30, 2012 Dec 31, 2012
Non-current assets
Intangible assets 1,292.3 1,178.0 1,283.8
Tangible assets 268.2 241.1 261.7
Loans receivable and other interest-bearing assets 5.6 5.8 5.5
Deferred tax assets 228.3 212.7 232.5
Investments 136.2 172.3 153.5
Total non-current assets 1,930.6 1,809.9 1,937.0
Current assets
Inventories 1,100.4 1,022.8 980.8
Accounts receivable and other non interest-bearing assets 1,490.3 1,376.4 1,342.7
Current deposits and loan receivables 914.2 726.5 623.6
Cash and cash equivalents 214.5 180.0 249.6
Total current assets 3,719.4 3,305.7 3,196.7
Total assets 5,650.0 5,115.6 5,133.7
Equity and liabilities MEUR Jun 30, 2013 Jun 30, 2012 Dec 31, 2012
Equity 1,736.0 1,866.4 1,833.7
Non-current liabilities
Loans 24.5 23.5 20.9
Deferred tax liabilities 93.8 75.1 88.4
Employee benefits 168.6 192.7 192.7
Total non-current liabilities 286.9 291.3 302.0
Provisions 141.4 121.2 136.2
Current liabilities
Loans 327.9 83.7 91.1
Advance payments received 1,452.5 1,222.1 1,242.0
Accounts payable and other liabilities 1,705.3 1,530.9 1,528.7
Total current liabilities 3,485.7 2,836.7 2,861.8
Total equity and liabilities 5,650.0 5,115.6 5,133.7
Comparative figures for 2012 have been restated according to the revised IAS 19 `Employee Benefits´, for more information please see pages 21 and 22.
14Q2
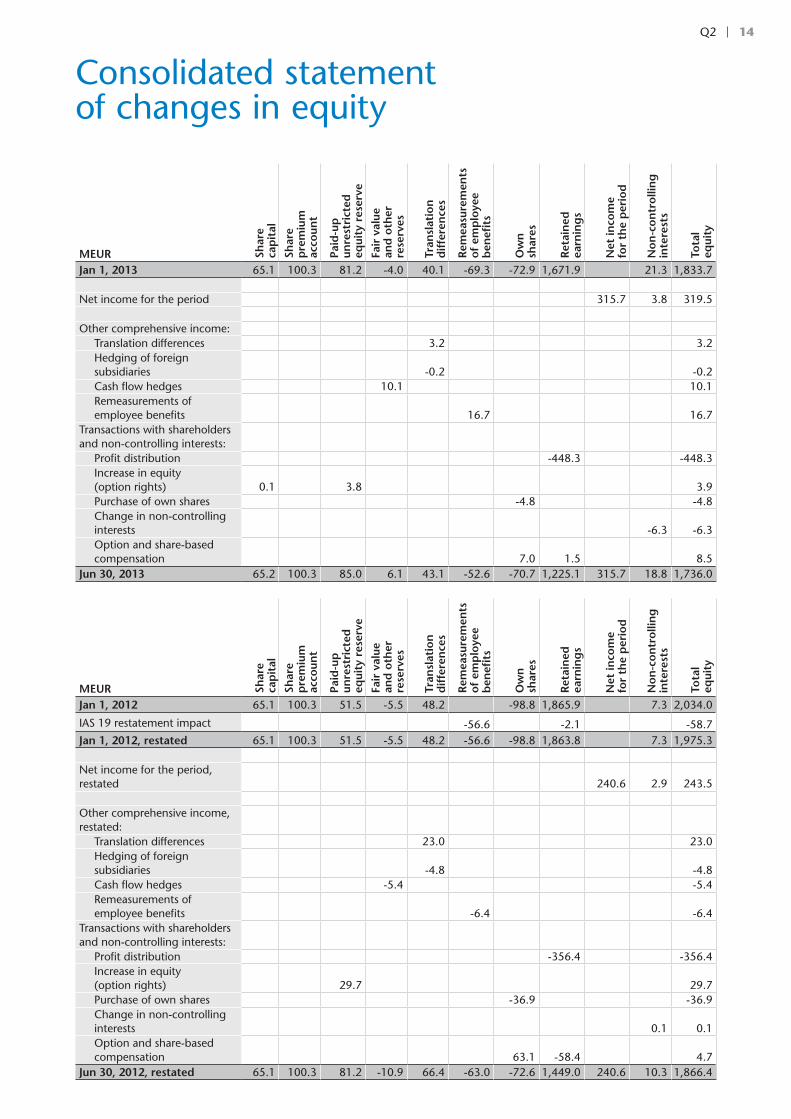
Consolidated statement of changes in equity
MEUR Shar
e ca
pit
al
Shar
e
pre
miu
m
acco
unt
Paid
-up
un
rest
rict
ed
equi
ty r
eser
ve
Fair
val
ue
and
oth
er
rese
rves
Tran
slat
ion
d
iffe
ren
ces
Rem
easu
rem
ents
o
f em
plo
yee
ben
efits
Ow
n
shar
es
Ret
ain
ed
earn
ing
s
Net
inco
me
fo
r th
e p
erio
d
No
n-c
on
tro
llin
g
inte
rest
s
Tota
l eq
uity
Jan 1, 2013 65.1 100.3 81.2 -4.0 40.1 -69.3 -72.9 1,671.9 21.3 1,833.7
Net income for the period 315.7 3.8 319.5
Other comprehensive income:Translation differences 3.2 3.2Hedging of foreign subsidiaries -0.2 -0.2Cash flow hedges 10.1 10.1Remeasurements of employee benefits 16.7 16.7
Transactions with shareholders and non-controlling interests:
Profit distribution -448.3 -448.3Increase in equity (option rights) 0.1 3.8 3.9Purchase of own shares -4.8 -4.8Change in non-controlling interests -6.3 -6.3Option and share-based compensation 7.0 1.5 8.5
Jun 30, 2013 65.2 100.3 85.0 6.1 43.1 -52.6 -70.7 1,225.1 315.7 18.8 1,736.0
MEUR Shar
e ca
pit
al
Shar
e
pre
miu
m
acco
unt
Paid
-up
un
rest
rict
ed
equi
ty r
eser
ve
Fair
val
ue
and
oth
er
rese
rves
Tran
slat
ion
d
iffe
ren
ces
Rem
easu
rem
ents
o
f em
plo
yee
ben
efits
Ow
n
shar
es
Ret
ain
ed
earn
ing
s
Net
inco
me
fo
r th
e p
erio
d
No
n-c
on
tro
llin
g
inte
rest
s
Tota
l eq
uity
Jan 1, 2012 65.1 100.3 51.5 -5.5 48.2 -98.8 1,865.9 7.3 2,034.0
IAS 19 restatement impact -56.6 -2.1 -58.7Jan 1, 2012, restated 65.1 100.3 51.5 -5.5 48.2 -56.6 -98.8 1,863.8 7.3 1,975.3
Net income for the period, restated 240.6 2.9 243.5
Other comprehensive income, restated:
Translation differences 23.0 23.0Hedging of foreign subsidiaries -4.8 -4.8Cash flow hedges -5.4 -5.4Remeasurements of employee benefits -6.4 -6.4
Transactions with shareholders and non-controlling interests:
Profit distribution -356.4 -356.4Increase in equity (option rights) 29.7 29.7Purchase of own shares -36.9 -36.9Change in non-controlling interests 0.1 0.1Option and share-based compensation 63.1 -58.4 4.7
Jun 30, 2012, restated 65.1 100.3 81.2 -10.9 66.4 -63.0 -72.6 1,449.0 240.6 10.3 1,866.4
15Q2
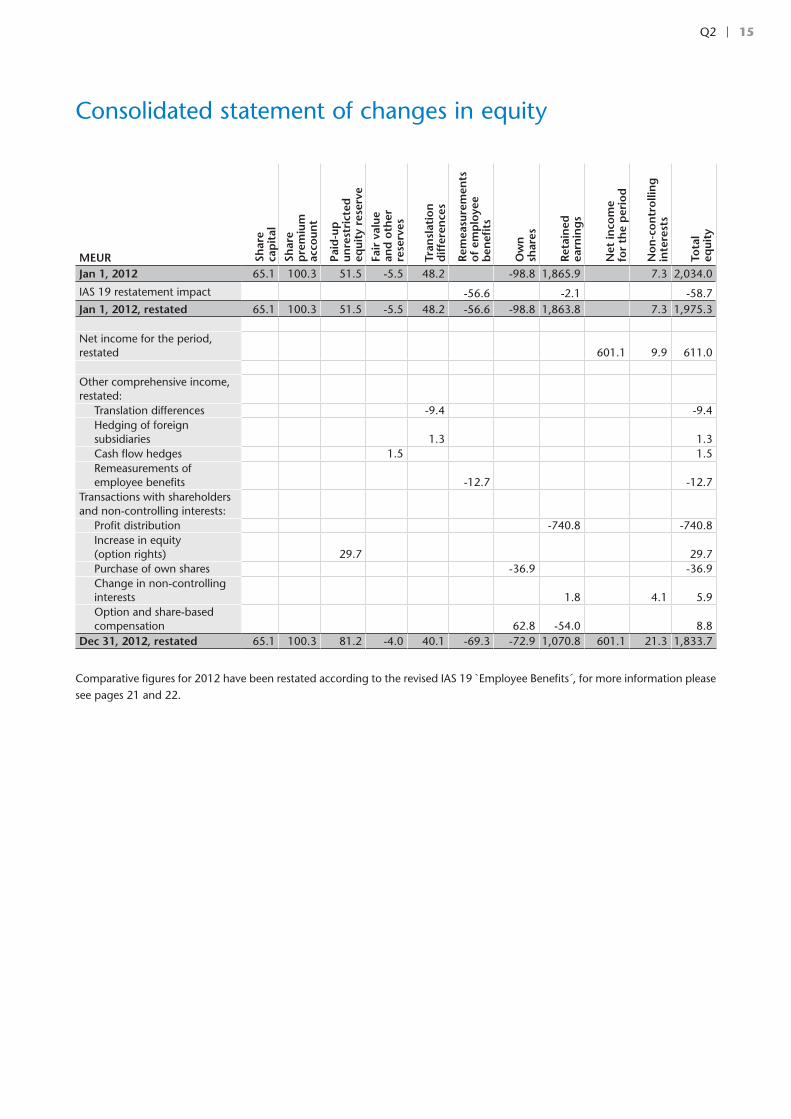
Consolidated statement of changes in equity
MEUR Shar
e ca
pit
al
Shar
e
pre
miu
m
acco
unt
Paid
-up
un
rest
rict
ed
equi
ty r
eser
ve
Fair
val
ue
and
oth
er
rese
rves
Tran
slat
ion
d
iffe
ren
ces
Rem
easu
rem
ents
o
f em
plo
yee
ben
efits
Ow
n
shar
es
Ret
ain
ed
earn
ing
s
Net
inco
me
fo
r th
e p
erio
d
No
n-c
on
tro
llin
g
inte
rest
s
Tota
l eq
uity
Jan 1, 2012 65.1 100.3 51.5 -5.5 48.2 -98.8 1,865.9 7.3 2,034.0
IAS 19 restatement impact -56.6 -2.1 -58.7Jan 1, 2012, restated 65.1 100.3 51.5 -5.5 48.2 -56.6 -98.8 1,863.8 7.3 1,975.3
Net income for the period, restated 601.1 9.9 611.0
Other comprehensive income, restated:
Translation differences -9.4 -9.4Hedging of foreign subsidiaries 1.3 1.3Cash flow hedges 1.5 1.5Remeasurements of employee benefits -12.7 -12.7
Transactions with shareholders and non-controlling interests:
Profit distribution -740.8 -740.8Increase in equity (option rights) 29.7 29.7Purchase of own shares -36.9 -36.9Change in non-controlling interests 1.8 4.1 5.9Option and share-based compensation 62.8 -54.0 8.8
Dec 31, 2012, restated 65.1 100.3 81.2 -4.0 40.1 -69.3 -72.9 1,070.8 601.1 21.3 1,833.7
Comparative figures for 2012 have been restated according to the revised IAS 19 `Employee Benefits´, for more information please see pages 21 and 22.

16Q2
MEUR 4–6/2013 4–6/2012 1–6/2013 1–6/2012 1–12/2012
Operating income 242.8 173.0 403.2 307.6 791.4
Change in working capital before
financial items and taxes 63.2 1.8 181.6 97.8 193.4
Depreciation and amortization 19.4 21.4 38.4 43.0 86.0
Cash flow from operations before
financing items and taxes 325.4 196.2 623.2 448.4 1,070.8
Cash flow from financing items and taxes -52.6 -49.8 -85.3 -51.0 -128.7
Cash flow from operating activities 272.8 146.4 537.9 397.4 942.1
Cash flow from investing activities -32.4 -44.5 -64.7 -65.0 -220.2
Cash flow after investing activities 240.4 101.9 473.2 332.4 721.9
Purchase of own shares - - -4.8 -36.9 -36.9
Increase in equity (option rights) 3.8 29.7 3.8 29.7 29.7
Profit distribution -31.5 -24.6 -448.3 -356.4 -740.8
Change in deposits and loans receivable, net -102.5 -140.2 -279.3 -33.9 59.3
Change in loans payable and other interest-bearing debt -80.2 11.9 229.2 6.6 -16.8
Changes in non-controlling interests -6.6 - -6.6 - -1.5
Cash flow from financing activities -217.0 -123.2 -506.0 -390.9 -707.0
Change in cash and cash equivalents 23.4 -21.3 -32.8 -58.5 14.9
Cash and cash equivalents at end of period 214.5 180.0 214.5 180.0 249.6
Translation difference 6.3 -5.9 2.3 -4.5 -0.7
Cash and cash equivalents
at beginning of period 197.4 195.4 249.6 234.0 234.0
Change in cash and cash equivalents 23.4 -21.3 -32.8 -58.5 14.9
CHANGE IN INTEREST-BEARING NET DEBT
MEUR 4–6/2013 4–6/2012 1–6/2013 1–6/2012 1–12/2012
Interest-bearing net debt at beginning of period -406.5 -489.8 -574.0 -646.0 -646.0
Interest-bearing net debt at end of period -613.3 -612.4 -613.3 -612.4 -574.0
Change in interest-bearing net debt -206.8 -122.6 -39.3 33.6 72.0
Comparative figures for 2012 have been restated according to the revised IAS 19 `Employee Benefits´, for more information please see pages 21 and 22.
Condensed consolidated statement of cash flows
17Q2
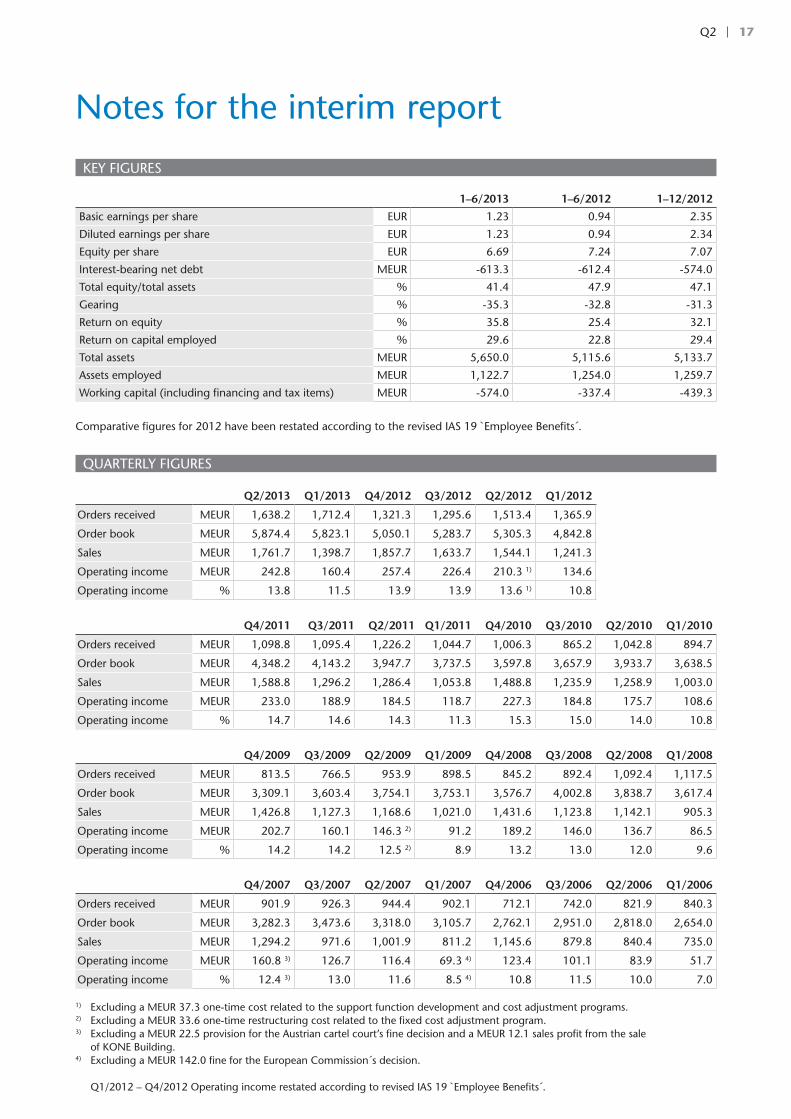
KEY FIGURES
1–6/2013 1–6/2012 1–12/2012
Basic earnings per share EUR 1.23 0.94 2.35
Diluted earnings per share EUR 1.23 0.94 2.34
Equity per share EUR 6.69 7.24 7.07
Interest-bearing net debt MEUR -613.3 -612.4 -574.0
Total equity/total assets % 41.4 47.9 47.1
Gearing % -35.3 -32.8 -31.3
Return on equity % 35.8 25.4 32.1
Return on capital employed % 29.6 22.8 29.4
Total assets MEUR 5,650.0 5,115.6 5,133.7
Assets employed MEUR 1,122.7 1,254.0 1,259.7
Working capital (including financing and tax items) MEUR -574.0 -337.4 -439.3
Comparative figures for 2012 have been restated according to the revised IAS 19 `Employee Benefits´.
QUARTERLY FIGURES
Q2/2013 Q1/2013 Q4/2012 Q3/2012 Q2/2012 Q1/2012
Orders received MEUR 1,638.2 1,712.4 1,321.3 1,295.6 1,513.4 1,365.9
Order book MEUR 5,874.4 5,823.1 5,050.1 5,283.7 5,305.3 4,842.8
Sales MEUR 1,761.7 1,398.7 1,857.7 1,633.7 1,544.1 1,241.3
Operating income MEUR 242.8 160.4 257.4 226.4 210.3 1) 134.6
Operating income % 13.8 11.5 13.9 13.9 13.6 1) 10.8
Q4/2011 Q3/2011 Q2/2011 Q1/2011 Q4/2010 Q3/2010 Q2/2010 Q1/2010
Orders received MEUR 1,098.8 1,095.4 1,226.2 1,044.7 1,006.3 865.2 1,042.8 894.7
Order book MEUR 4,348.2 4,143.2 3,947.7 3,737.5 3,597.8 3,657.9 3,933.7 3,638.5
Sales MEUR 1,588.8 1,296.2 1,286.4 1,053.8 1,488.8 1,235.9 1,258.9 1,003.0
Operating income MEUR 233.0 188.9 184.5 118.7 227.3 184.8 175.7 108.6
Operating income % 14.7 14.6 14.3 11.3 15.3 15.0 14.0 10.8
Q4/2009 Q3/2009 Q2/2009 Q1/2009 Q4/2008 Q3/2008 Q2/2008 Q1/2008
Orders received MEUR 813.5 766.5 953.9 898.5 845.2 892.4 1,092.4 1,117.5
Order book MEUR 3,309.1 3,603.4 3,754.1 3,753.1 3,576.7 4,002.8 3,838.7 3,617.4
Sales MEUR 1,426.8 1,127.3 1,168.6 1,021.0 1,431.6 1,123.8 1,142.1 905.3
Operating income MEUR 202.7 160.1 146.3 2) 91.2 189.2 146.0 136.7 86.5
Operating income % 14.2 14.2 12.5 2) 8.9 13.2 13.0 12.0 9.6
Q4/2007 Q3/2007 Q2/2007 Q1/2007 Q4/2006 Q3/2006 Q2/2006 Q1/2006
Orders received MEUR 901.9 926.3 944.4 902.1 712.1 742.0 821.9 840.3
Order book MEUR 3,282.3 3,473.6 3,318.0 3,105.7 2,762.1 2,951.0 2,818.0 2,654.0
Sales MEUR 1,294.2 971.6 1,001.9 811.2 1,145.6 879.8 840.4 735.0
Operating income MEUR 160.8 3) 126.7 116.4 69.3 4) 123.4 101.1 83.9 51.7
Operating income % 12.4 3) 13.0 11.6 8.5 4) 10.8 11.5 10.0 7.0
1) Excluding a MEUR 37.3 one-time cost related to the support function development and cost adjustment programs.2) Excluding a MEUR 33.6 one-time restructuring cost related to the fixed cost adjustment program.3) Excluding a MEUR 22.5 provision for the Austrian cartel court’s fine decision and a MEUR 12.1 sales profit from the sale
of KONE Building.4) Excluding a MEUR 142.0 fine for the European Commission´s decision.
Q1/2012 – Q4/2012 Operating income restated according to revised IAS 19 `Employee Benefits´.
Notes for the interim report
18Q2
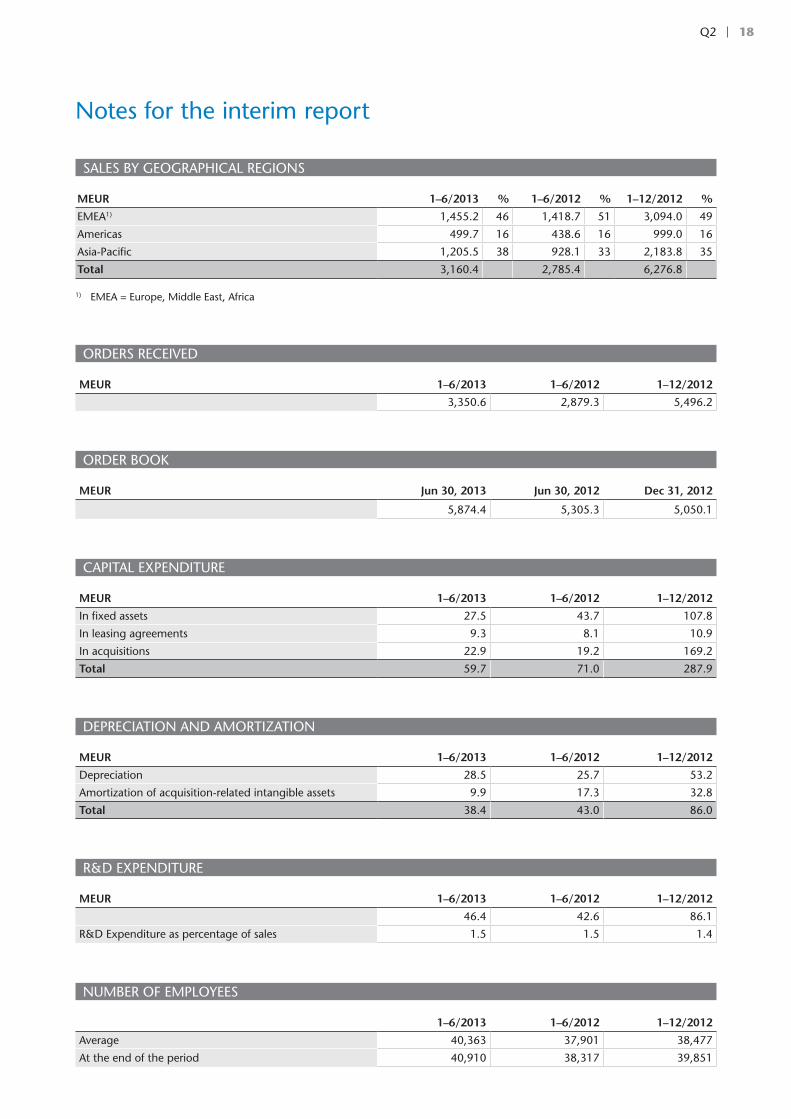
SALES BY GEOGRAPHICAL REGIONS
MEUR 1–6/2013 % 1–6/2012 % 1–12/2012 %
EMEA1) 1,455.2 46 1,418.7 51 3,094.0 49
Americas 499.7 16 438.6 16 999.0 16
Asia-Pacific 1,205.5 38 928.1 33 2,183.8 35
Total 3,160.4 2,785.4 6,276.8
1) EMEA = Europe, Middle East, Africa
ORDERS RECEIVED
MEUR 1–6/2013 1–6/2012 1–12/2012
3,350.6 2,879.3 5,496.2
ORDER BOOK
MEUR Jun 30, 2013 Jun 30, 2012 Dec 31, 2012
5,874.4 5,305.3 5,050.1
CAPITAL EXPENDITURE
MEUR 1–6/2013 1–6/2012 1–12/2012
In fixed assets 27.5 43.7 107.8
In leasing agreements 9.3 8.1 10.9
In acquisitions 22.9 19.2 169.2
Total 59.7 71.0 287.9
DEPRECIATION AND AMORTIZATION
MEUR 1–6/2013 1–6/2012 1–12/2012
Depreciation 28.5 25.7 53.2
Amortization of acquisition-related intangible assets 9.9 17.3 32.8
Total 38.4 43.0 86.0
R&D EXPENDITURE
MEUR 1–6/2013 1–6/2012 1–12/2012
46.4 42.6 86.1
R&D Expenditure as percentage of sales 1.5 1.5 1.4
NUMBER OF EMPLOYEES
1–6/2013 1–6/2012 1–12/2012
Average 40,363 37,901 38,477
At the end of the period 40,910 38,317 39,851
Notes for the interim report
19Q2
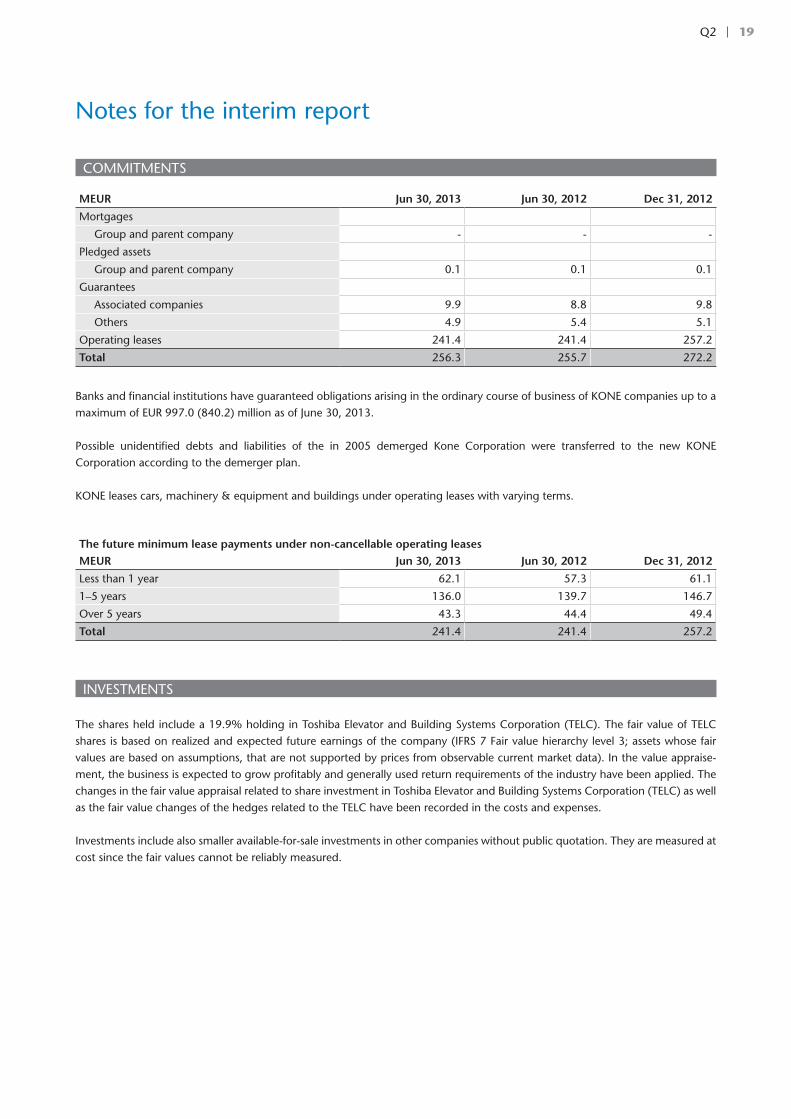
COMMITMENTS
MEUR Jun 30, 2013 Jun 30, 2012 Dec 31, 2012
Mortgages
Group and parent company - - -
Pledged assets
Group and parent company 0.1 0.1 0.1
Guarantees
Associated companies 9.9 8.8 9.8
Others 4.9 5.4 5.1
Operating leases 241.4 241.4 257.2
Total 256.3 255.7 272.2
Banks and financial institutions have guaranteed obligations arising in the ordinary course of business of KONE companies up to a maximum of EUR 997.0 (840.2) million as of June 30, 2013.
Possible unidentified debts and liabilities of the in 2005 demerged Kone Corporation were transferred to the new KONE Corporation according to the demerger plan.
KONE leases cars, machinery & equipment and buildings under operating leases with varying terms.
The future minimum lease payments under non-cancellable operating leasesMEUR Jun 30, 2013 Jun 30, 2012 Dec 31, 2012
Less than 1 year 62.1 57.3 61.1
1–5 years 136.0 139.7 146.7
Over 5 years 43.3 44.4 49.4
Total 241.4 241.4 257.2
INVESTMENTS
The shares held include a 19.9% holding in Toshiba Elevator and Building Systems Corporation (TELC). The fair value of TELC shares is based on realized and expected future earnings of the company (IFRS 7 Fair value hierarchy level 3; assets whose fair values are based on assumptions, that are not supported by prices from observable current market data). In the value appraise-ment, the business is expected to grow profitably and generally used return requirements of the industry have been applied. The changes in the fair value appraisal related to share investment in Toshiba Elevator and Building Systems Corporation (TELC) as well as the fair value changes of the hedges related to the TELC have been recorded in the costs and expenses.
Investments include also smaller available-for-sale investments in other companies without public quotation. They are measured at cost since the fair values cannot be reliably measured.
Notes for the interim report
20Q2
Notes for the interim report
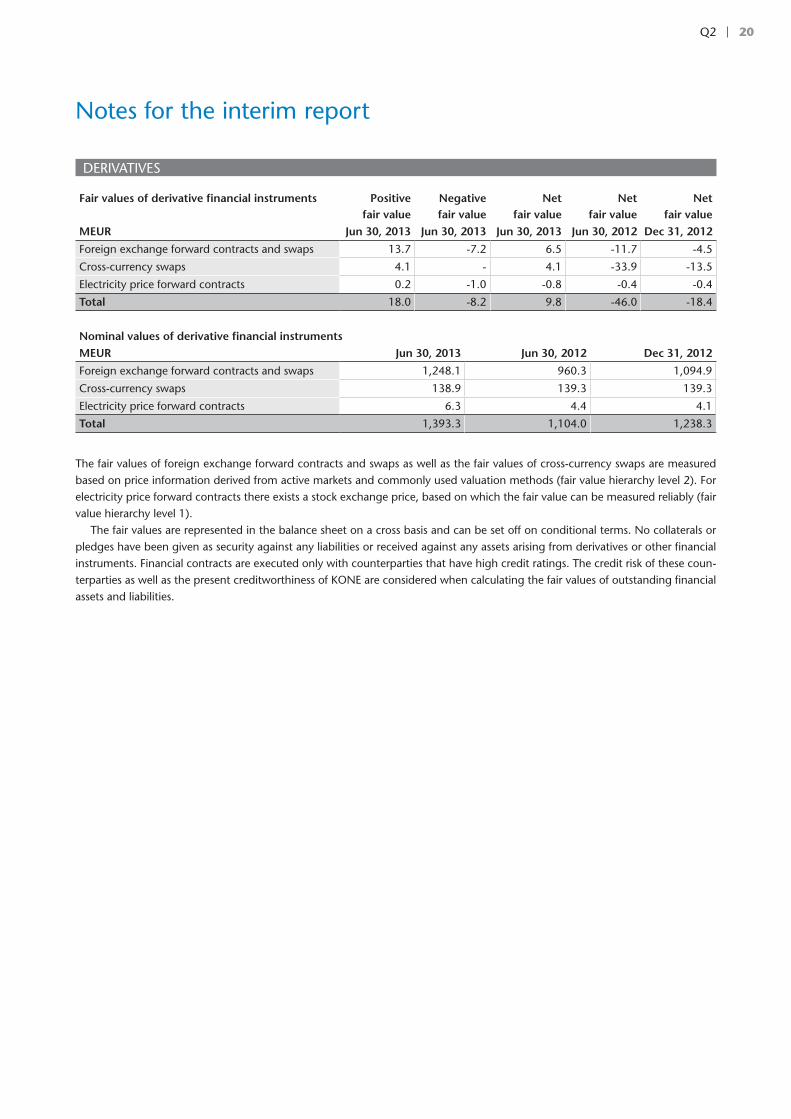
DERIVATIVES
Fair values of derivative financial instruments Positivefair value
Negativefair value
Netfair value
Netfair value
Netfair value
MEUR Jun 30, 2013 Jun 30, 2013 Jun 30, 2013 Jun 30, 2012 Dec 31, 2012
Foreign exchange forward contracts and swaps 13.7 -7.2 6.5 -11.7 -4.5
Cross-currency swaps 4.1 - 4.1 -33.9 -13.5
Electricity price forward contracts 0.2 -1.0 -0.8 -0.4 -0.4
Total 18.0 -8.2 9.8 -46.0 -18.4
Nominal values of derivative financial instrumentsMEUR Jun 30, 2013 Jun 30, 2012 Dec 31, 2012
Foreign exchange forward contracts and swaps 1,248.1 960.3 1,094.9
Cross-currency swaps 138.9 139.3 139.3
Electricity price forward contracts 6.3 4.4 4.1
Total 1,393.3 1,104.0 1,238.3
The fair values of foreign exchange forward contracts and swaps as well as the fair values of cross-currency swaps are measured based on price information derived from active markets and commonly used valuation methods (fair value hierarchy level 2). For electricity price forward contracts there exists a stock exchange price, based on which the fair value can be measured reliably (fair value hierarchy level 1).
The fair values are represented in the balance sheet on a cross basis and can be set off on conditional terms. No collaterals or pledges have been given as security against any liabilities or received against any assets arising from derivatives or other financial instruments. Financial contracts are executed only with counterparties that have high credit ratings. The credit risk of these coun-terparties as well as the present creditworthiness of KONE are considered when calculating the fair values of outstanding financial assets and liabilities.

21Q2
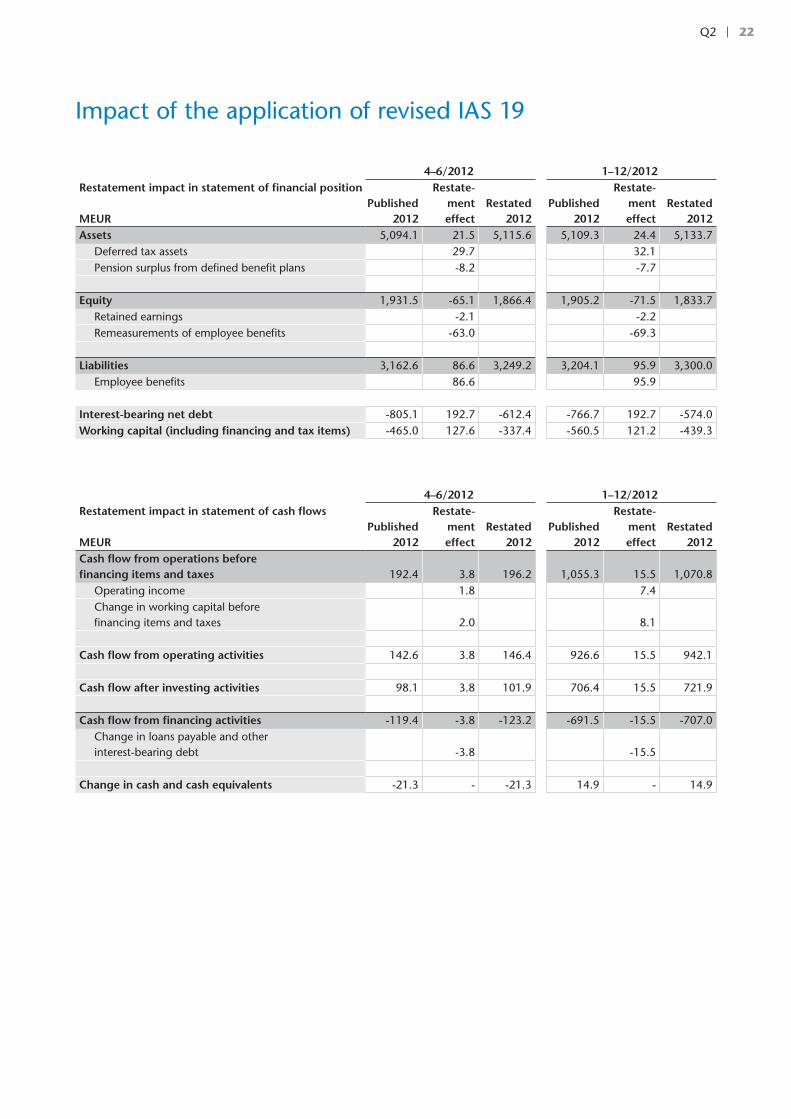
Impact of the application of revised IAS 19
The revised IAS 19 `Employee Benefits´ standard was published in 2011 and became effective as of January 1, 2013. KONE has restated its comparative figures for 2012 according to the amended standard.
According to the revised standard, actuarial gains and losses relating to defined benefit obligations are recognized as they occur. This has increased KONE’s reported employee benefit liability. Net interest cost has replaced interest expense and expected return on plan assets. This change has had no material impact on KONE’s reported net income in 2012.
As a part of the application of the revised IAS 19, KONE has changed the presentation of expenses relating to defined benefit obligations; cost relating to work performed during the period (service cost) is presented in employment expenses, while net interest is presented in financing expenses. Previously all expenses relating to employee benefits were reported in employment expenses. KONE has also reclassified its employee benefit liability as part of interest-bearing net debt. Previously it was presented as part of working capital.
The tables on pages 21–22 show the impact of the restatement on KONE’s financial figures 4–6/2012 and 1–12/2012.
4–6/2012 1–12/2012Restatement impact in statement of income MEUR
Published2012
Restate-menteffect
Restated2012
Published2012
Restate-menteffect
Restated2012
Sales 1,544.1 1,544.1 6,276.8 6,276.8Costs and expenses -1,314.2 1.8 -1,312.4 -5,369.5 7.4 -5,362.1Depreciation and amortization -21.4 -21.4 -86.0 -86.0One-time cost -37.3 -37.3 -37.3 -37.3
Operating income 171.2 1.8 173.0 784.0 7.4 791.4Share of associated companies' net income 2.1 2.1 4.3 4.3Financing income 5.5 5.5 42.9 42.9Financing expenses -3.2 -1.8 -5.0 -26.8 -7.5 -34.3
Income before taxes 175.6 0.0 175.6 804.4 -0.1 804.3Taxes -41.6 -41.6 -193.3 -193.3
Net income 134.0 0.0 134.0 611.1 -0.1 611.0
Net income attributable to:Shareholders of the parent company 132.0 0.0 132.0 601.2 -0.1 601.1Non-controlling interests 2.0 2.0 9.9 9.9
Total 134.0 0.0 134.0 611.1 -0.1 611.0
Earnings per share for profit attributable to the shareholders of the parent company, EUR
Basic earnings per share, EUR 0.52 0.52 2.35 2.35Diluted earnings per share, EUR 0.52 0.52 2.34 2.34
22Q2
Impact of the application of revised IAS 19
4–6/2012 1–12/2012Restatement impact in statement of financial position MEUR
Published2012
Restate-menteffect
Restated2012
Published2012
Restate-menteffect
Restated2012
Assets 5,094.1 21.5 5,115.6 5,109.3 24.4 5,133.7Deferred tax assets 29.7 32.1Pension surplus from defined benefit plans -8.2 -7.7
Equity 1,931.5 -65.1 1,866.4 1,905.2 -71.5 1,833.7Retained earnings -2.1 -2.2Remeasurements of employee benefits -63.0 -69.3
Liabilities 3,162.6 86.6 3,249.2 3,204.1 95.9 3,300.0Employee benefits 86.6 95.9
Interest-bearing net debt -805.1 192.7 -612.4 -766.7 192.7 -574.0Working capital (including financing and tax items) -465.0 127.6 -337.4 -560.5 121.2 -439.3
4–6/2012 1–12/2012Restatement impact in statement of cash flows MEUR
Published2012
Restate-menteffect
Restated2012
Published2012
Restate-menteffect
Restated2012
Cash flow from operations before financing items and taxes 192.4 3.8 196.2 1,055.3 15.5 1,070.8
Operating income 1.8 7.4Change in working capital before financing items and taxes 2.0 8.1
Cash flow from operating activities 142.6 3.8 146.4 926.6 15.5 942.1
Cash flow after investing activities 98.1 3.8 101.9 706.4 15.5 721.9
Cash flow from financing activities -119.4 -3.8 -123.2 -691.5 -15.5 -707.0Change in loans payable and other interest-bearing debt -3.8 -15.5
Change in cash and cash equivalents -21.3 - -21.3 14.9 - 14.9

23Q2
Jun 30, 2013 Class A shares Class B shares Total
Number of shares 38,104,356 222,562,364 260,666,720
Own shares in possession 1) 4,029,449
Share capital, EUR 65,166,680
Market capitalization, MEUR 15,668
Number of B shares traded (millions), 1–6/2013 49.2
Value of B shares traded, MEUR, 1–6/2013 3,098
Number of shareholders 3 35,193 35,193
Close High Low
Class B share price, EUR, Jan–Jun 2013 61.05 72.10 56.25
1) During January–June 2013, KONE used its authorization to repurchase own shares in January, and bought back in total 80,000 of its own class B shares. In April, 210,890 class B shares in the company’s possession were assigned to the share-based incentive plan.
Shares and shareholders
KONE Corporation
Corporate OfficesKeilasatama 3P.O. Box 7FI-02151 Espoo, FinlandTel. +358 (0)204 751Fax +358 (0)204 75 4496
www.kone.com
For further information please contact:Henrik EhrnroothCFOTel. +358 (0)204 75 4260
Karla LindahlDirector, Investor RelationsTel. +358 (0)204 75 4441
KONE is one of the global leaders in the elevator and escalator industry. The company has been committed to under-standing the needs of its customers for the past century, providing industry-leading elevators, escalators and automatic building doors as well as innovative solutions for modernization and maintenance. The company’s objective is to offer the best People Flow™ experience by developing and delivering solutions that enable people to move smoothly, safely, comfortably and without waiting in buildings in an increasingly urbanizing environment. In 2012, KONE had annual net sales of EUR 6.3 billion and approximately 40,000 employees. KONE class B shares are listed on the NASDAQ OMX Helsinki Ltd in Finland. www.kone.com
This bulletin contains forward-looking statements that are based on the current expectations, known factors, decisions and plans of the management of KONE. Although the management believes that the expectations reflected in such forward-looking statements are reasonable, no assurance can be given that such expectations will prove to be correct. Accordingly, results could differ materially from those implied in the forward-looking statements as a result of, among other factors, changes in economic, market and competitive conditions, changes in the regulatory environment and other government actions as well as fluctuations in exchange rates.