korea western power co., ltd. rating review presentation to standard & poor’s 26 july 2007
TRANSCRIPT

Korea Western Power Co., Ltd.Korea Western Power Co., Ltd.
Rating Review Presentation toRating Review Presentation toStandard & Poor’sStandard & Poor’s
26 July 2007 26 July 2007

2Rating Review Presentation to Standard & Poor’s
Company OverviewCompany Overview
OperationsOperations
Financial ManagementFinancial Management
Concluding Remarks Concluding Remarks
Table of Contents

3Rating Review Presentation to Standard & Poor’s
Introduction to KOWEPO
1. Applied FX rate : KRW 920/USD 2. 1H 2007 financial figures are provisional figures
Inception Inception Inception Inception Spun off from KEPCO in April 2, 2001 Spun off from KEPCO in April 2, 2001
OwnershipOwnershipOwnershipOwnership 100% owned by KEPCO (54% owned by Korean Government) 100% owned by KEPCO (54% owned by Korean Government)
Generation Generation CapacityCapacity
Generation Generation CapacityCapacity 9,585.3 MW (Operation: 8,380.1 MW, Under Construction: 1,205.2 MW) 9,585.3 MW (Operation: 8,380.1 MW, Under Construction: 1,205.2 MW)
Total AssetsTotal AssetsTotal AssetsTotal Assets 1H 2007 : KRW 3,720 bn (USD 4.1 bn)
FY2006 : KRW 3,708 bn (USD 4.0 bn)
1H 2007 : KRW 3,720 bn (USD 4.1 bn)
FY2006 : KRW 3,708 bn (USD 4.0 bn)
Total Total RevenueRevenue
Total Total RevenueRevenue
1H 2007 : KRW 1,535 bn (USD 1.7 bn)
FY2006 : KRW 2,424 bn (USD 2.6 bn)
1H 2007 : KRW 1,535 bn (USD 1.7 bn)
FY2006 : KRW 2,424 bn (USD 2.6 bn)
Net IncomeNet IncomeNet IncomeNet Income 1H 2007 : KRW 118 bn (USD 128.8 mn)
FY2006 : KRW 160 bn (USD 173.9 mn)
1H 2007 : KRW 118 bn (USD 128.8 mn)
FY2006 : KRW 160 bn (USD 173.9 mn)
Credit Credit RatingsRatings
Credit Credit RatingsRatings S&P : A- (stable) / Moody’s : A1 (stable) S&P : A- (stable) / Moody’s : A1 (stable)

4Rating Review Presentation to Standard & Poor’s
Operation Overview
Note: T/P denotes “Thermal Power Plant”, C/C denotes “Combined Cycle”, P/S denotes “Pumped Storage”
Base load, intermediate load, and peak load account for 42%, 17% and 41% respectively in terms of generation capacity in operation
Over 85% of capacity is located in or near the Seoul and Gyeonggi metropolitan areas
– Seoul and Gyeonggi metropolitan areas comprise approximately 40% of total national demand
Generation Capacity by Type of Plant(1H 2007)
1,400MW
0
500
1,000
1,500
2,000
2,500
3,000
3,500
4,000
4,500
Base Load Intermediate Load Peak Load
In Operation Under Construction
Taean T/P(3,500 MW)
Pyeongtaek T/P(1,400 MW)
4,180MW4,000MW
Taean T/P (500 MW)
Seoincheon C/C
(1,800 MW)
Samrangjin P/S (600 MW)
CheongsongP/S (600 MW)
PyeongtaekC/C (480 MW)
Location of Plant Complex
TaeanPyeongtaek
Gunsan(under construction)
Cheongsong
CoalLNGBC OilPumped Storage
Seoincheon
Samrangjin
Seoul Metropolitan Area
GunsanC/C (700 MW)

5Rating Review Presentation to Standard & Poor’s
Power Plant Facilities in Operation
Plant TypeFuel Type
Number of Units
Unit Capacity
(MW)
Total Capacity
(MW)Year of Establishment
Taean
(Chungnam)
Thermal Bituminous 7 500 3,500#1:’95.6, #2:’95.12, #3:’97.3, #4:’97.8
#5:’01.10, #6:’02.5, #7:’07.2
Solar - 1 0.1 0.1 ’05.8
Pyeongtaek
(Gyeonggi)
Thermal BC Oil 4 350 1,400 #1:’80.4, #2:’80.6, #3:’83.5, #4:’83.8
Combined
CycleLNG
4
1
80
160
320
160
GT:’92.6
ST:’94.6
Seoincheon
(Incheon)
Combined
CycleLNG
8
8
150
75
1,200
600
GT:’92.6
ST:’92.11
Samrangjin
(Gyeongnam)
Pumped
Storage- 2 300 600 #1:’85.11, #2:’85.12
Cheongsong
(Gyeongbuk)
Pumped
Storage- 2 300 600 #1:’06.9, #2:’06.12
Total 37 8,380.1
KOWEPO operates 37 generation units with total generation capacity of 8,380.1MW in 5 different sites

6Rating Review Presentation to Standard & Poor’s
Strategy – Develop Growth Engine
Plant TypeGeneration
capacity (MW)
Expected completion of Construction
Remarks
Under Construction
Taean #8 Thermal 500 Aug 2007 -
Gunsan Combined Cycle 700 Nov 2009 -
New Plants
Taean IGCC (Integrated Gasification
Combined Cycle)300 Sep 2015 -
Equity Investments
Garorim Tidal Power 480 Dec 2012
Consortium with Posco E&C, Daewoo E&C, Lotte E&C
Project financing KOWEPO to be in charge of operation and
maintenance
Godeok Combined Cycle 700 June 2011
Consortium with SK E&C, SK E&S Project financing KOWEPO to be in charge of operation and
maintenance
Yangju Combined Cycle 1,400 Dec 2013
Consortium with Daelim Industry Project financing KOWEPO to be in charge of operation and
maintenance
KOWEPO plans to maintain its leading market position and superior operating performance promoting growth with new plant constructions

7Rating Review Presentation to Standard & Poor’s
Strategy – Diversify Revenue Sources
Plant TypeGeneration
capacity (MW)
Remarks
New Business
Community Energy System
- 923Gcal/h
Plan to use Seoincheon C/C’s stream and waste heat Consortium with Lotte E&C, Incheon City Gas and Kenertec Expected to begin providing heat from Jan 2008
Overseas Project
Laos Hydro Power 372
Consortium with SK E&C / Project financing BOOT (Build, Own, Operate, Transfer) MOU agreement between the government of Laos and domestic consortium KOWEPO to be in charge of operation and maintenance
IndonesiaThermal Power
400
Consortium with Hanwha and Koresia / Project financing BOOT (Build, Own, Operate, Transfer) MOU agreement between the government of Sumatra and Koresia KOWEPO to be in charge of operation and maintenance
New/Renewable Energy
Samrangjin Solar Power 3,000kW Expected to complete construction in Dec. 2008
TaeanSmall Hydro
Power2,200kW Expected to complete construction in Sep. 2007
KOWEPO will diversify its revenue sources by investing in new business, overseas project, and new/renewable energy

8Rating Review Presentation to Standard & Poor’s
Company OverviewCompany Overview
OperationsOperations
Financial ManagementFinancial Management
Concluding Remarks Concluding Remarks
Table of Contents

9Rating Review Presentation to Standard & Poor’s
KOWEPO8,38012.6%
KOSEP7,19810.8%
KOMIPO8,50112.7%
KOSPO7,75111.6%
EWP9,00113.5%
KHNP18,25227.4%
Others7,59011.4%
KOWEPO’s Market Position
Sales Volume Market Share (1H 2007)Generation Capacity Market Share (1H 2007)
Total Generation Capacity66,673 MW
Total Electricity Sales183,259 GWh
(MW) (GWh) Others4,8762.6%
KHNP67,56636.9%
EWP21,56611.8%
KOSPO24,79313.5%
KOMIPO19,91610.9%
KOSEP21,31211.6%
KOWEPO23,22912.7%

10Rating Review Presentation to Standard & Poor’s
Operational Efficiency
Thermal efficiency and utilization rate have been relatively stable over the years.
In the 1H 2007, the utilization rate has substantially increased due to the completion of Taean #7 and the increased utilization rate of Pyeongtaek power plant
Utilization Rate Thermal Efficiency
40.8
41.4 41.341.1
40.8
40.240.5
40.8
40.3
37.0
38.0
39.0
40.0
41.0
42.0
2003 2004 2005 2006 2007
(%)
Full year 1H
59.7
60.7
59.6
64.9
59.259.1 59.3
57.6
58.6
52.0
54.0
56.0
58.0
60.0
62.0
64.0
66.0
2003 2004 2005 2006 2007
(%)
Full year 1H

11Rating Review Presentation to Standard & Poor’s
Long-Term Supply Contracts
Bituminous
Supplier Country Contract Amount (1,000 ton/year)
Terms
Xstrata Australia 1,100 ‘01.04 ~ ‘09.12Ensham Australia 500 ‘04.01 ~ ‘08.12Peabody Australia 240 ‘05.01 ~ ‘07.12Centennial Australia 500 ‘04.07 ~ ‘10.06BHP-Billiton Australia 500 ‘95.01 ~ ‘07.12Resouce Pacific Australia 250 ‘07.01 ~ ‘09.12Flame Australia 500 ‘07.01 ~ ‘09.12ECM Australia 375 ‘07.01 ~ ‘09.12
Australia - Sub-total 3,965 (47%) SCIEGC China 1,000 ‘99.04 ~ ‘07.07CCIEC China 500 ‘96.01 ~ ‘07.07SHENHUA China 960 ‘01.07 ~ ‘09.06Minmetals China 180 ‘06.04 ~ ‘09.03China - Sub-total 2,640 (31%) Indominco Indonesia 500 ‘03.10 ~ ‘09.12
ABK Indonesia 500 ‘04.10 ~ ‘07.12
Tanito Harum Indonesia 200 ‘05.01 ~ ‘07.12
Peabody Indonesia 325 ‘06.04 ~ ‘09.03
ECM Indonesia 300 ‘06.04 ~ ‘09.03
Indonesia - Sub-total 1,825 (22%) 8,430 (100%)
Fuel Oil Type Supplier Contract amount TermsB.C oil (Sulfa 2.5%) SK Corp. 279,000 ㎘ ‘07.07 ~ 12Kerosene for boiler SK Incheon Oil 3,511 ㎘ ‘07.07 ~ 12
LNG Supplier Contract amount (1,000 ton/year)
Terms
LNG KOGAS 1,490 ‘07 – ‘26 (20year)
KOWEPO enters into long-term supply contracts to:
– Control the costs of bituminous coal, oil and LNG amid the rising prices
– Assure an adequate supply of the raw materials for a smooth operation
Bituminous Coal Contracts

12Rating Review Presentation to Standard & Poor’s
Company OverviewCompany Overview
OperationsOperations
Financial ManagementFinancial Management
Concluding Remarks Concluding Remarks
Table of Contents

13Rating Review Presentation to Standard & Poor’s
Capital Structure (1H 2007)
Capital Structure
2,976
3,262
3,708 3,720
1,351
3,038
2,3692,3022,198
2,0601,988
1,406
1,064916
1,050
0
1,000
2,000
3,000
4,000
2003 2004 2005 2006 1H 2007(K
RW
bill
ion
)
Total assets
Total shareholders' equity
Total Liability
AssetsAssetsAssetsAssets KRW 3,720 billion
– Fixed Assets/Total Assets Ratio : 89.4%
KRW 3,720 billion – Fixed Assets/Total Assets
Ratio : 89.4%
LiabilityLiabilityLiabilityLiability KRW 1,351 billion
– Liability-to-Equity Ratio : 57.0%
KRW 1,351 billion– Liability-to-Equity Ratio :
57.0%
ShareholdeShareholders’ Equityrs’ Equity
ShareholdeShareholders’ Equityrs’ Equity
KRW 2,369 billion– Stake is wholly owned by
KEPCO
KRW 2,369 billion– Stake is wholly owned by
KEPCO
RevenueRevenueRevenueRevenue KRW 1,535 billion KRW 1,535 billion
EBITEBITEBITEBIT KRW 177 billion
– Net Income : KRW 118 billion
KRW 177 billion – Net Income : KRW 118
billion

14Rating Review Presentation to Standard & Poor’s
Financial Performance
Sales revenue shows a stable growth rate since 2004 EBIT continues to remain stable since 2004 but in the second half of 2006, EBIT declined due to
temporary price cut in CP of base load facilities EBIT is expected to improve going forward due to the CBP market improvement and operation
of Taean #7 and 8
EBITRevenue
2,057.72,227.0
2,424.1
1,534.8
2,134.4
1,235.01,101.3
997.81,058.1
0
500
1,000
1,500
2,000
2,500
3,000
2003 2004 2005 2006 2007
(KR
W b
illio
n)
Full year 1H
260.8 255.7226.4
177.3
428.9
179.9160.9
139.7
213.7
0
100
200
300
400
500
2003 2004 2005 2006 2007
(KR
W b
illio
n)
Full year 1H

15Rating Review Presentation to Standard & Poor’s
Healthy Coverage and Leverage Ratio
Coverage ratios have been stable and relatively strong due to KOWEPO’s proactive debt restructuring efforts
KOWEPO has acquired the right to use connecting line to transmission facilities of KEPCO in 2007, in which KOWEPO is making installment payments to KEPCO for the usage of the facilities. However, it is fully compensated by capacity payment. Therefore, any increase in leverage ratio from this does not mean KOWEPO’s financial status deteriorates
LeverageCoverage
7.0
5.7
8.3
5.7
6.8
1.1 1.3 1.5
2.21.6
0
3
6
9
2003 2004 2005 2006 1H 2007
(Tim
es)
EBIT/Gross interest expense Debt/EBITDA
39.3
31.933.7
43.641.7
29.430.4
25.224.228.2
0
10
20
30
40
50
2003 2004 2005 2006 1H 2007
(%)
Debt/equity Debt/capital

16Rating Review Presentation to Standard & Poor’s
Peer Comparison (FY2006)
Revenue
2,424.1
2,069.8
2,508.5
3,308.3
2,575.4
0
500
1,000
1,500
2,000
2,500
3,000
3,500
KOWEPO KOSEP KOMI PO KOSPO EWP
(KR
W b
illio
n)
EBIT Net Income
EBIT Margin ROE Leverage
226.4
148.2
201.6
283.0
94.7
0
50
100
150
200
250
300
KOWEPO KOSEP KOMI PO KOSPO EWP
(KR
W b
illio
n)
159.6
77.8
168.6
207.7
45.7
0
50
100
150
200
250
KOWEPO KOSEP KOMI PO KOSPO EWP
(KR
W b
illio
n)
9.3
7.2
8.08.6
3.7
0
2
4
6
8
10
KOWEPO KOSEP KOMIPO KOSPO EWP
(%)
7.1
3.9
7.1
9.0
1.8
0
2
4
6
8
10
KOWEPO KOSEP KOMIPO KOSPO EWP
(%)
43.6
79.1
30.1 31.9
57.5
30.4
44.2
23.1 24.2
36.5
0
20
40
60
80
100
KOWEPO KOSEP KOMIPO KOSPO EWP
(%)
Debt/Equity Debt/Capital
17Rating Review Presentation to Standard & Poor’s
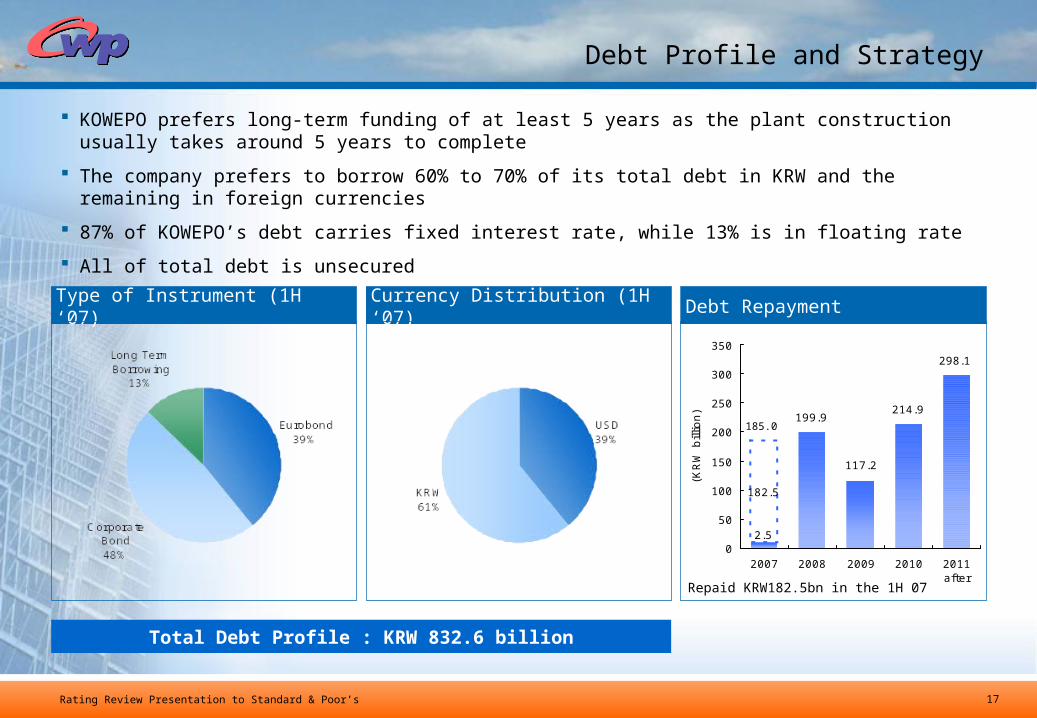
Debt Profile and Strategy
KOWEPO prefers long-term funding of at least 5 years as the plant construction usually takes around 5 years to complete
The company prefers to borrow 60% to 70% of its total debt in KRW and the remaining in foreign currencies
87% of KOWEPO’s debt carries fixed interest rate, while 13% is in floating rate
All of total debt is unsecured
Type of Instrument (1H ‘07) Currency Distribution (1H ‘07) Debt Repayment
199.9
117.2
214.9
298.1
2.5
182.5
0
50
100
150
200
250
300
350
2007 2008 2009 2010 2011after
(KR
W b
illio
n)
Total Debt Profile : KRW 832.6 billion
Repaid KRW182.5bn in the 1H 07
185.0

18Rating Review Presentation to Standard & Poor’s
Company OverviewCompany Overview
OperationsOperations
Financial ManagementFinancial Management
Concluding Remarks Concluding Remarks
Table of Contents
19Rating Review Presentation to Standard & Poor’s
Concluding Remarks
Improving economic fundamentals with structural improvements in South Korea and eased political tensions from North Korea
Healthy operating environment provided by favourable industry conditions
Continued supportive regulatory frame work and the expected well-paced, gradual approach in industry restructuring
Maintains one of the leading positions in terms of Management Appraisal of Gencos by KEPCO.
Strong financial performance and debt servicing ability supported by stable, recurring revenue and cash flow
Robust capital structure and strong financial flexibility to support the capex plan