kpi performance - tesco · pdf filekpi performance key: we met our annual target ... kpi...
TRANSCRIPT
KPI PERFORMANCE
Key:
We met our annual target
We missed our annual target
This document shows how we have performed against our Key Performance Indicators as a Group and in
our operating markets
You can find out more about our corporate responsibility strategy and how we manage our performance in
our Corporate Responsibility Review 2012 (www.tescoplc.com/crreview)
We manage our business using a balanced scorecard - the Steering Wheel. It has five segments -
Community, Operations, People, Finance and Customer. The Community segment of the Steering Wheel
covers our five Community Promises. We have Key Performance Indicators for each Community Promise
and set targets each year as a Group and in our operating markets to assess our performance against
them.
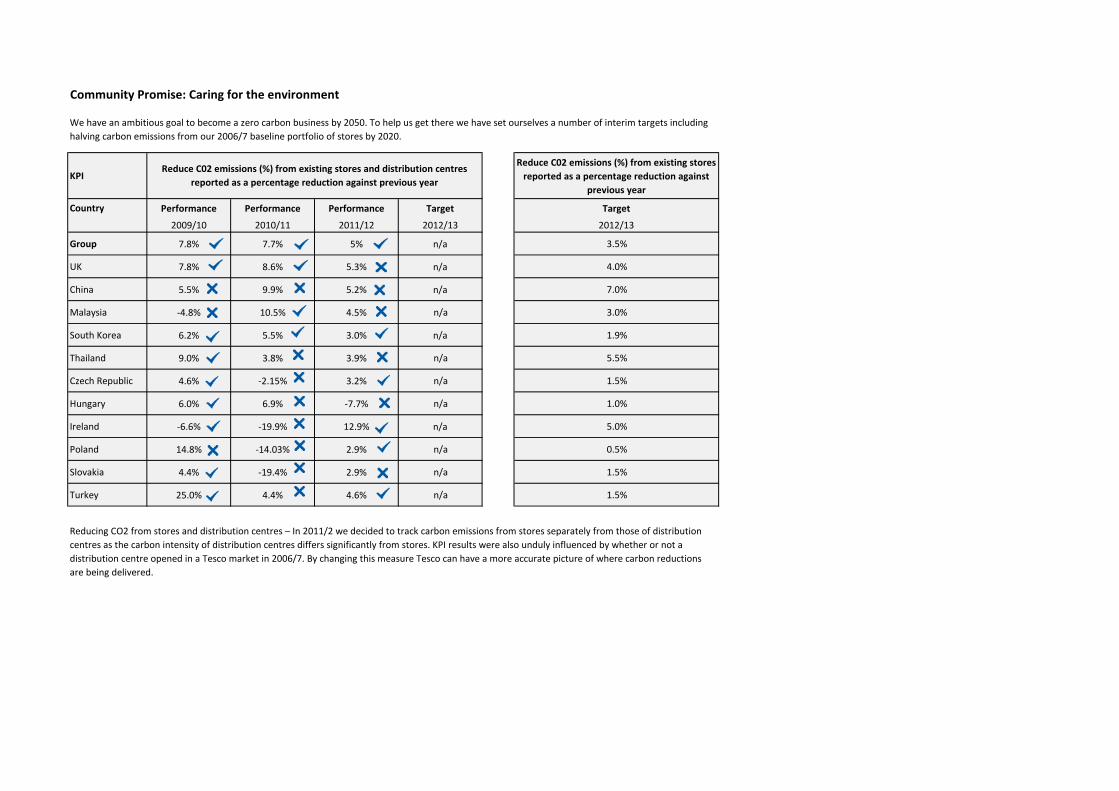
Community Promise: Caring for the environment
KPI
Reduce C02 emissions (%) from existing stores
reported as a percentage reduction against
previous year
Country Performance Performance Performance Target Target
2009/10 2010/11 2011/12 2012/13 2012/13
Group 7.8% 7.7% 5% n/a 3.5%
UK 7.8% 8.6% 5.3% n/a 4.0%
China 5.5% 9.9% 5.2% n/a 7.0%
Malaysia -4.8% 10.5% 4.5% n/a 3.0%
South Korea 6.2% 5.5% 3.0% n/a 1.9%
Thailand 9.0% 3.8% 3.9% n/a 5.5%
Czech Republic 4.6% -2.15% 3.2% n/a 1.5%
Hungary 6.0% 6.9% -7.7% n/a 1.0%
Ireland -6.6% -19.9% 12.9% n/a 5.0%
Poland 14.8% -14.03% 2.9% n/a 0.5%
Slovakia 4.4% -19.4% 2.9% n/a 1.5%
Turkey 25.0% 4.4% 4.6% n/a 1.5%
Reduce C02 emissions (%) from existing stores and distribution centres
reported as a percentage reduction against previous year
Reducing CO2 from stores and distribution centres – In 2011/2 we decided to track carbon emissions from stores separately from those of distribution
centres as the carbon intensity of distribution centres differs significantly from stores. KPI results were also unduly influenced by whether or not a
distribution centre opened in a Tesco market in 2006/7. By changing this measure Tesco can have a more accurate picture of where carbon reductions
are being delivered.
We have an ambitious goal to become a zero carbon business by 2050. To help us get there we have set ourselves a number of interim targets including
halving carbon emissions from our 2006/7 baseline portfolio of stores by 2020.
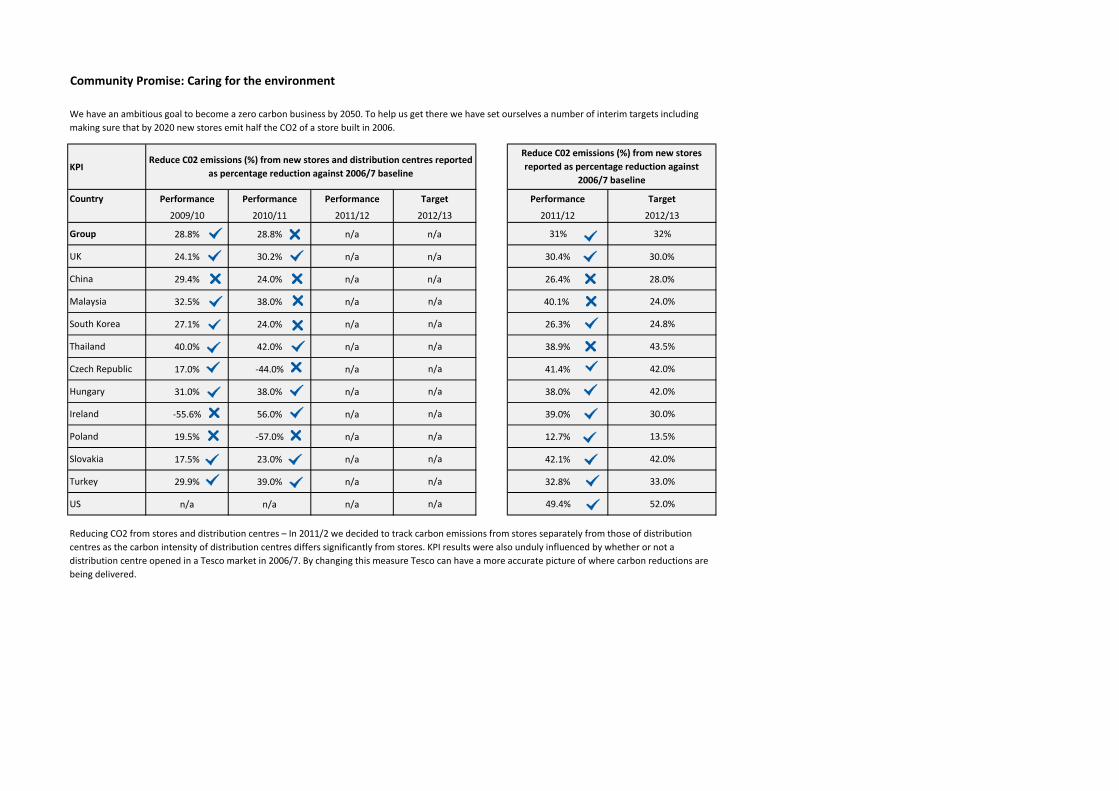
Community Promise: Caring for the environment
KPI
Country Performance Performance Performance Target Performance Target
2009/10 2010/11 2011/12 2012/13 2011/12 2012/13
Group 28.8% 28.8% n/a n/a 31% 32%
UK 24.1% 30.2% n/a n/a 30.4% 30.0%
China 29.4% 24.0% n/a n/a 26.4% 28.0%
Malaysia 32.5% 38.0% n/a n/a 40.1% 24.0%
South Korea 27.1% 24.0% n/a n/a 26.3% 24.8%
Thailand 40.0% 42.0% n/a n/a 38.9% 43.5%
Czech Republic 17.0% -44.0% n/a n/a 41.4% 42.0%
Hungary 31.0% 38.0% n/a n/a 38.0% 42.0%
Ireland -55.6% 56.0% n/a n/a 39.0% 30.0%
Poland 19.5% -57.0% n/a n/a 12.7% 13.5%
Slovakia 17.5% 23.0% n/a n/a 42.1% 42.0%
Turkey 29.9% 39.0% n/a n/a 32.8% 33.0%
US n/a n/a n/a n/a 49.4% 52.0%
Reduce C02 emissions (%) from new stores and distribution centres reported
as percentage reduction against 2006/7 baseline
Reducing CO2 from stores and distribution centres – In 2011/2 we decided to track carbon emissions from stores separately from those of distribution
centres as the carbon intensity of distribution centres differs significantly from stores. KPI results were also unduly influenced by whether or not a
distribution centre opened in a Tesco market in 2006/7. By changing this measure Tesco can have a more accurate picture of where carbon reductions are
being delivered.
Reduce C02 emissions (%) from new stores
reported as percentage reduction against
2006/7 baseline
We have an ambitious goal to become a zero carbon business by 2050. To help us get there we have set ourselves a number of interim targets including
making sure that by 2020 new stores emit half the CO2 of a store built in 2006.

Community Promise: Caring for the environment
KPI
Country Performance Performance Performance Target
2009/10 2010/11 2011/12 2012/13
Group 6.4% 7.4% 10% 3%
UK 8.5% 12.0% 12.8% 4.0%
China -29.5% 1.0% -5.7% 3.5%
Malaysia -2.7% 12.0% 16.9% 7.3%
South Korea 25.0% 8.3% 10.8% 7.7%
Thailand -5.6% -30.0% -15.4% -8.6%
Czech Republic 7.4% 17.0% 7.4% 3.0%
Hungary 8.6% 3.0% 12.4% 3.0%
Ireland 38.6% 37.0% 0.6% 3.8%
Poland 11.6% -10.0% 2.7% 8.0%
Slovakia -3.0% 11.0% 12.9% 3.0%
Turkey -14.1% -4.0% -15.5% -10.8%
US n/a n/a -21.9% -9.5%
We have an ambitious goal to become a zero carbon business by 2050. To help us get there we
have set ourselves a number of interim targets including reducing the carbon emissions per case
of goods delivered by 25% by 2020 against a baseline of 2011/12.
Reduce the amount of CO2 emitted in our distribution network to deliver a
case of goods reported as a percentage reduction against previous year

Community Promise: Actively Supporting Local Communities
KPI
Country Performance Performance Performance Target
2009/10 2010/11 2011/12 2012/13
Group £7.4m £10.0m £10.1m £13.5m
UK £5.4m £7.2m £6.4m £10m
China £31,663 £64,751 £120,000 £110,700
Malaysia £98,460 £146,486 £315,000 £225,600
South Korea £157,423 £315,760 £542,000 £573,000
Thailand £260,000 £419,408 £440,000 £533,200
Czech Republic £241,400 £28,107 £334,000 £351,900
Hungary £45,178 £205,534 £225,000 £200,900
Ireland £672,872 £807,823 £824,000 £520,400
Poland £53,456 £220,346 £244,000 £253,070
Slovakia £271,800 £258,163 £249,000 £277,500
Turkey £173,606 £250,032 £330,000 £420,800
US n/a n/a n/a n/a
Staff & customer fundraising
In difficult economic times supporting communities becomes even more important. In 2011/12
we donated over £74.5 million to charities and good causes through direct donations, gifts in
kind, staff time and management costs.
We also supported staff and customer fundraising events to raise over £10 million as a Group.

Community Promise: Providing customers with healthy choices
KPI
2009/10 2010/11 2011/12 2012/13
Group 6.2m 7.2m 8.7m 9.3m
UK 2.6m 2.55m 2.9m 2.5m
China 21,972 38,075 105,000 123,300
Malaysia 11,154 16,593 14,750 10,000
South Korea 319,918 378,208 491,000 502,900
Thailand 3.2m 4.2m 5.1m 6m
Czech Republic 4,500 9,400 11,000 11,000
Hungary 5,518 6,180 7,800 8,000
Ireland n/a n/a 3,100 2,100
Poland n/a 5,121 6,150 3,420
Slovakia 4,530 8,300 12,600 14,000
Turkey 12,207 29,054 126,000 110,300
US n/a n/a n/a n/a
Our customers want us to help them make choices that are better for them and their families.
We make sure that our products are clearly labelled with nutritional information and we are
developing healthy ranges across the Group. We also recognise that a healthy life is not just
about healthy eating, so we invest in programmes to encourage our customers to get active.
Staff & customers active
Number of people

Community Promise: Creating good jobs and careers
KPI
Country Performance Performance Performance Target
2009/10 2010/11 2011/12 2012/13
Group 6% 6.2% 5.9% 6.0%
UK 1 in 27 1 in 30 1 in 43 1 in 43
China 10.0% 10.0% 12.9% 10.0%
Malaysia 11.0% 11.7% 12.5% 13.0%
South Korea 7.1% 9.6% 12.7% 8.9%
Thailand 5.3% 17.6% 12.7% 10.0%
Czech Republic 11.2% 10.0% 11.6% 10.0%
Hungary 9.8% 10.0% 8.7% 8.8%
Ireland n/a n/a 3.4% 3.0%
Poland 7.0% 8.0% 11.6% 10.0%
Slovakia 17.6% 13.0% 12.2% 10.0%
Turkey 19% 7% 11% 13.0%
US n/a n/a 11.2% 10.0%
Staff being trained for their next job
Our people are our greatest asset. We are committed to spotting and developing talent so that
our staff, wherever they work, can fulfil their potential. In 2011/12, 5.9% of our people were
being trained for their next job through official training programmes like our 'Options' and
'advanced leadership' programmes.
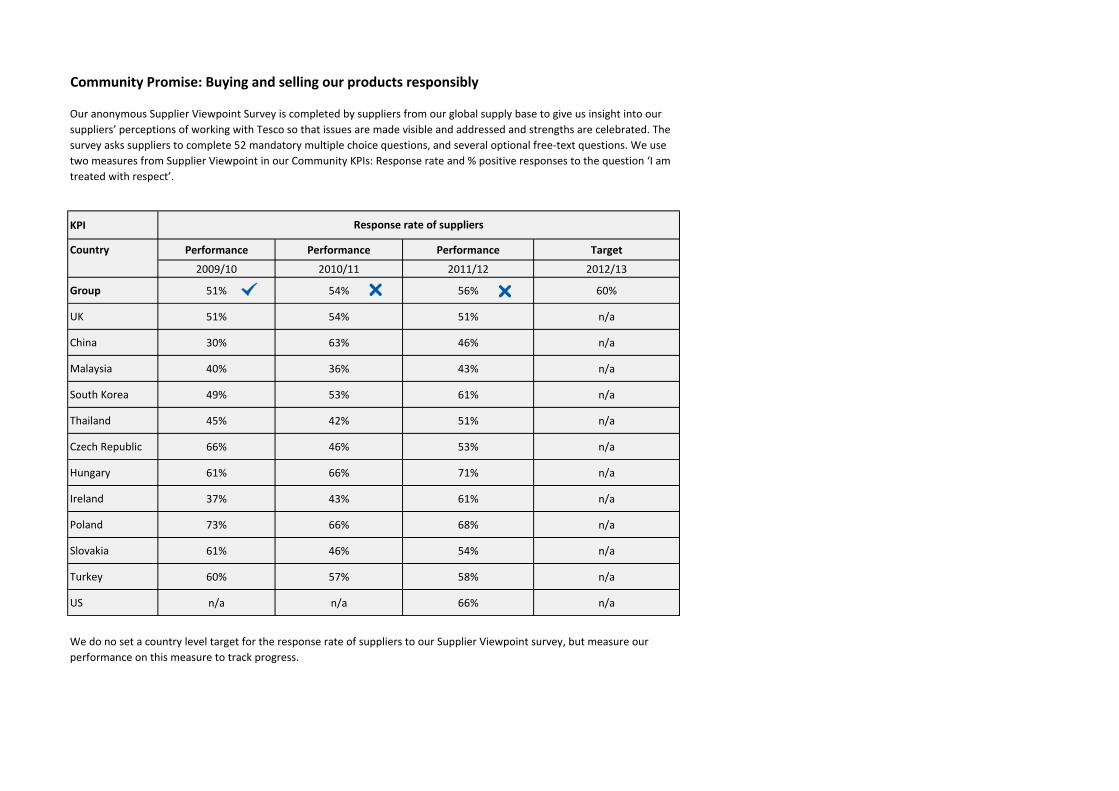
Community Promise: Buying and selling our products responsibly
KPI
Country Performance Performance Performance Target
2009/10 2010/11 2011/12 2012/13
Group 51% 54% 56% 60%
UK 51% 54% 51% n/a
China 30% 63% 46% n/a
Malaysia 40% 36% 43% n/a
South Korea 49% 53% 61% n/a
Thailand 45% 42% 51% n/a
Czech Republic 66% 46% 53% n/a
Hungary 61% 66% 71% n/a
Ireland 37% 43% 61% n/a
Poland 73% 66% 68% n/a
Slovakia 61% 46% 54% n/a
Turkey 60% 57% 58% n/a
US n/a n/a 66% n/a
Response rate of suppliers
We do no set a country level target for the response rate of suppliers to our Supplier Viewpoint survey, but measure our
performance on this measure to track progress.
Our anonymous Supplier Viewpoint Survey is completed by suppliers from our global supply base to give us insight into our
suppliers’ perceptions of working with Tesco so that issues are made visible and addressed and strengths are celebrated. The
survey asks suppliers to complete 52 mandatory multiple choice questions, and several optional free-text questions. We use
two measures from Supplier Viewpoint in our Community KPIs: Response rate and % positive responses to the question ‘I am
treated with respect’.

Community Promise: Buying and selling our products responsibly
KPI
Country Performance Performance Performance Target Performance Target
2009/10 2010/11 2011/12 2012/13 2011/12 2012/13
Group 80% 82% n/a n/a 74% 74%
UK 81% 83% n/a n/a 78% 75%
China 71% 81% n/a n/a 61% 65%
Malaysia 75% 74% n/a n/a 53% 58%
South Korea 85% 86% n/a n/a 58% 70%
Thailand 77% 78% n/a n/a 65% 70%
Czech Republic 74% 68% n/a n/a 68% 63%
Hungary 65% 81% n/a n/a 82% 78%
Ireland 78% 80% n/a n/a 75% 72%
Poland 88% 85% n/a n/a 79% 70%
Slovakia 74% 76% n/a n/a 78% 80%
Turkey 74% 75% n/a n/a 77% 79%
US n/a n/a n/a n/a 93% 85%
In 2011/12 we replaced the KPI measure on the % of positive responses for all questions in the Supplier Viewpoint survey with a more relevant measure
that focuses on whether we act responsibly and fairly in our dealings with suppliers. From 2011/12 we measured our performance for the % of responses
to the specific question ‘I am treated with respect’.
Supplier Viewpoint: % of positive responses for all questionsSupplier Viewpoint: % of positive responses to
the question 'I am treated with respect'
Our anonymous Supplier Viewpoint Survey is completed by suppliers from our global supply base to give us insight into our suppliers’ perceptions of
working with Tesco so that we are aware of any issues and can address them.
The survey asks suppliers to complete 52 multiple choice questions, and several optional free-text questions.
We use two measures from Supplier Viewpoint in our Community KPIs: Response rate and % positive responses to the question ‘I am treated with
respect’.