kpmg forensic integrity survey 2005–2006 · the kpmg integrity survey 2005–2006 results are...
TRANSCRIPT
KPMG FORENSIC
Integrity Survey2005–2006
ADVISORY

KPMG Forensic Leadership Message
I am pleased to share with you the results of our Integrity Survey 2005–2006, which takes
a behind-the-scenes look at corporate fraud and misconduct in the post-Sarbanes-Oxley era.
Since our Integrity Survey 2000, we’ve witnessed corporate scandals and the subsequent
passage of new regulations. This 2005–2006 survey reveals the perceptions of more than
4,000 employees nationally of what has changed in five years—and what has not.
Our key findings:
� Nearly three out of four employees nationally—74 percent—reported that they had observed
misconduct in the prior 12-month period, with half of employees reporting that what they
had observed could cause “a significant loss of public trust if discovered.” These results are
virtually unchanged from employee observations in 2000.
� Although the level of observed misconduct has remained constant, employees reported that
the conditions that facilitate management’s ability to prevent, detect, and respond to fraud
and misconduct have improved since 2000. For example, pressure to engage in misconduct
is down, and confidence in reporting concerns to management is up.
� Employees who work in companies with comprehensive ethics and compliance programs
reported more favorable results across the board than those employees who work in
companies without such programs. For instance, employees who work in companies with
programs reported fewer observations of misconduct and higher levels of confidence in
management’s commitment to integrity.
This survey examines risks of fraud and misconduct that include, and are broader than, the
financial reporting aspects addressed by Sarbanes-Oxley legislation. We hope this helps to
provide a wider perspective as you consider your organization’s exposure to fraud and miscon-
duct risks and the effectiveness of programs and controls you rely on to mitigate them. By
sharing the results of this survey, all of us at KPMG hope to help reaffirm and raise awareness
of the importance of the principles of leadership, integrity, and ethics in business.
Richard H. GirgentiAmericas Partner in ChargeKPMG Forensic
Contents
Executive Summary 1
Overall Results 2
Prevalence and Nature of Misconduct 2
Preventing Misconduct 6
Detecting Misconduct 6
Responding to Misconduct 8
Perceived Tone and Culture 9
Comparison of 2000 and 2005 Data 11
Impact of Ethics and Compliance Programs 13
Program Elements 13
Correlation 14
Prevalence of Misconduct 14
Preventing Misconduct 15
Detecting Misconduct 16
Responding to Misconduct 17
Perceived Tone and Culture 18
Meeting the Regulatory Challenge 20
Sarbanes-Oxley Act of 2002 (Section 404) 20
Corporate Governance Listing Standards 20
U.S. Sentencing Guidelines Criteria 20
Department of Justice Prosecution Policy 21
Director and Officer Liability 22
The Corporate Response 22
Background and Methodology 23
Respondent Demographics 24
Frequently Asked Questions 26
The KPMG Integrity Survey2005–2006 results are based
on responses from 4,056 U.S. employees, spanning all
levels of job responsibility, 16 job functions, 11 industry
sectors, and 4 thresholds of organizational size.
Executive Summary
Nearly three out of four employees reported that they had observed misconduct in the prior
12-month period, with half of employees reporting that what they had observed was serious
misconduct that could cause “a significant loss of public trust if discovered.”
Between 2000 and 2005, employees reported:
� Consistent levels of overall misconduct, with 74 percent reporting in 2005 that they had
observed misconduct, compared with 76 percent in 2000
� Consistent levels of serious misconduct, with 50 percent in 2005 characterizing the
misconduct they had observed as serious, compared with 49 percent in 2000
Although the level of observed misconduct has remained constant, employees reported that the
conditions that facilitate management’s ability to prevent, detect, and respond to fraud and
misconduct within companies are improving.
Between 2000 and 2005, employees reported the following positive changes in conditions
and attitudes:
� Pressure to engage in misconduct to meet business objectives has decreased.
� The adequacy of resources available to meet targets without cutting corners has improved.
� Apathy and indifference toward codes of conduct have declined.
� Comfort levels in using a hotline to report misconduct have risen.
� Confidence that appropriate action would be taken in response to alleged improprieties has
increased.
� Confidence that whistleblowers would be protected from retaliation has increased.
� Perceptions of chief executive officers and other senior executives as positive role models
have improved.
� The perception that top management is approachable if employees have questions about
ethics or need to deliver bad news has increased.
� The perception that business leaders would respond appropriately if they became aware
of misconduct has increased.
Employees who work in companies with comprehensive ethics and compliance programs reported
more favorable results across the board than did those who work in companies without such pro-
grams. For instance, employees who work in companies with such programs reported fewer obser-
vations of misconduct and higher levels of confidence in management’s commitment to integrity.
At companies with ethics and compliance programs:
� Employees reported fewer observations of misconduct.
� A significantly higher percentage of employees reported that their colleagues felt motivated
and empowered to “do the right thing.”
� A significantly higher percentage of employees reported that their colleagues felt comfortable
raising and addressing ethics concerns.
� A significantly higher percentage of employees believed their CEOs and other senior
executives valued ethics and integrity over short-term business goals.
1
Overall Results
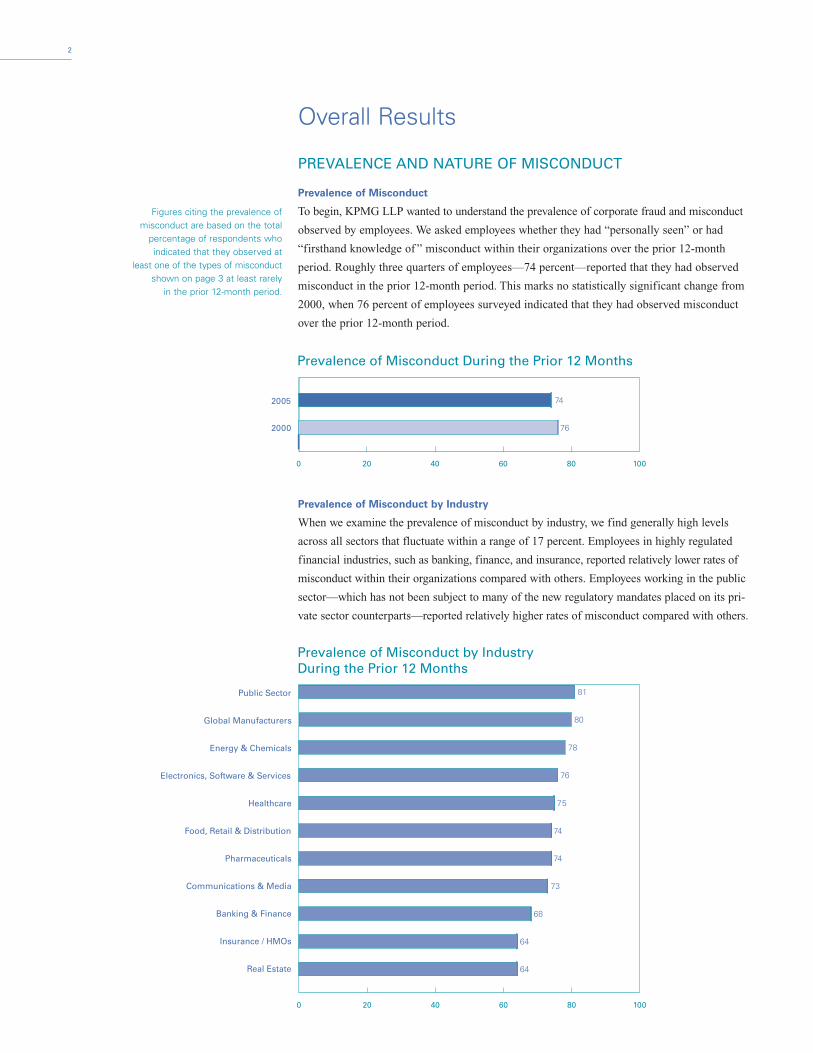
PREVALENCE AND NATURE OF MISCONDUCT
Prevalence of Misconduct
To begin, KPMG LLP wanted to understand the prevalence of corporate fraud and misconduct
observed by employees. We asked employees whether they had “personally seen” or had
“firsthand knowledge of ” misconduct within their organizations over the prior 12-month
period. Roughly three quarters of employees—74 percent—reported that they had observed
misconduct in the prior 12-month period. This marks no statistically significant change from
2000, when 76 percent of employees surveyed indicated that they had observed misconduct
over the prior 12-month period.
Prevalence of Misconduct by Industry
When we examine the prevalence of misconduct by industry, we find generally high levels
across all sectors that fluctuate within a range of 17 percent. Employees in highly regulated
financial industries, such as banking, finance, and insurance, reported relatively lower rates of
misconduct within their organizations compared with others. Employees working in the public
sector—which has not been subject to many of the new regulatory mandates placed on its pri-
vate sector counterparts—reported relatively higher rates of misconduct compared with others.
2
0 20 40 60 80 100
Prevalence of Misconduct During the Prior 12 Months
2000
2005
76
74
0 20 40 60 80 100
Prevalence of Misconduct by Industry During the Prior 12 Months
Public Sector
Global Manufacturers
Energy & Chemicals
Electronics, Software & Services
Healthcare
Food, Retail & Distribution
Pharmaceuticals
Communications & Media
Banking & Finance
Insurance / HMOs
Real Estate
64
68
73
74
74
75
76
78
80
81
64
Figures citing the prevalence ofmisconduct are based on the total
percentage of respondents whoindicated that they observed at
least one of the types of misconductshown on page 3 at least rarely
in the prior 12-month period.

Seriousness of Misconduct
To gauge the seriousness of observed misconduct, we asked employees if what they observed
could cause “a significant loss of public trust if discovered.” A full 50 percent of employees
answered in the affirmative, on a par with the 49 percent who answered affirmatively in 2000.
Nature of Misconduct
We also wanted to understand the specific types of misconduct being observed. We asked
employees to identify specific types of misconduct of which they had “firsthand knowledge”
or had “personally seen.” When public attention is drawn to allegations of corporate wrong-
doing, we recognized that only one problem tends to be in the spotlight at a given time.
However, experience tells us that companies do not experience integrity risks one at a time
or in neatly segmented boxes. Indeed, the nature of misconduct risk at any given time can be
as diverse and fluid as the business itself.
Therefore, we took a broader view by allowing respondents to select from among 41 germane
categories of misconduct that can undermine an organization’s reputation for integrity, as
shown in the table below. These categories include, and go beyond, issues of financial report-
ing fraud that were the center of Sarbanes-Oxley legislation.
3
0 20 40 60 80 100
Prevalence of Misconduct That Could Cause a “Significant Loss of Public Trust if Discovered”
2000
2005 50
49
Compromising customer or marketplace
trust by:
� Engaging in false or deceptive sales practices� Submitting false or misleading invoices to
customers� Engaging in anti-competitive practices (e.g.,
market rigging)� Improperly gathering competitors’ confidential
information� Fabricating product quality or safety test results� Breaching customer or consumer privacy� Entering into customer contract relationships
without proper terms, contracts, or approvals� Violating contract terms with customers
Compromising shareholder or organizational
trust by:
� Falsifying or manipulating financial reportinginformation
� Stealing or misappropriating assets� Falsifying time and expense reports� Breaching computer, network, or database
controls� Mishandling confidential or proprietary infor-
mation
� Violating document retention rules� Providing inappropriate information to analysts
or investors� Trading securities based on “inside” information� Engaging in activities that pose a conflict of
interest� Wasting, mismanaging, or abusing the organiza-
tion’s resources
Compromising employee trust by:
� Discriminating against employees� Engaging in sexual harassment or creating a
hostile work environment� Violating workplace health and safety rules� Violating employee wage, overtime, or benefit
rules� Breaching employee privacy� Abusing substances (drugs, alcohol) at work
Compromising supplier trust by:
� Violating or circumventing supplier selection rules� Accepting inappropriate gifts or kickbacks from
suppliers� Paying suppliers without accurate invoices
or records
� Entering into supplier contracts that lack properterms, conditions, or approvals
� Violating the intellectual property rights or confidential information of suppliers
� Violating contract or payment terms with suppliers� Doing business with disreputable suppliers
Compromising public or community trust by:
� Violating environmental standards� Exposing the public to safety risk� Making false or misleading claims to the media� Providing regulators with false or misleading
information� Making improper political contributions to
domestic officials� Making improper payments or bribes to foreign
officials� Doing business with third parties that may be
involved in money laundering� Doing business with third parties prohibited under
international trade restrictions and embargoes� Violating international labor or human rights
General:
� Violating company values and principles
C AT E G O R I E S O F F R AU D A N D M I S C O N D U C T A S S E S S E D I N S U R V E Y
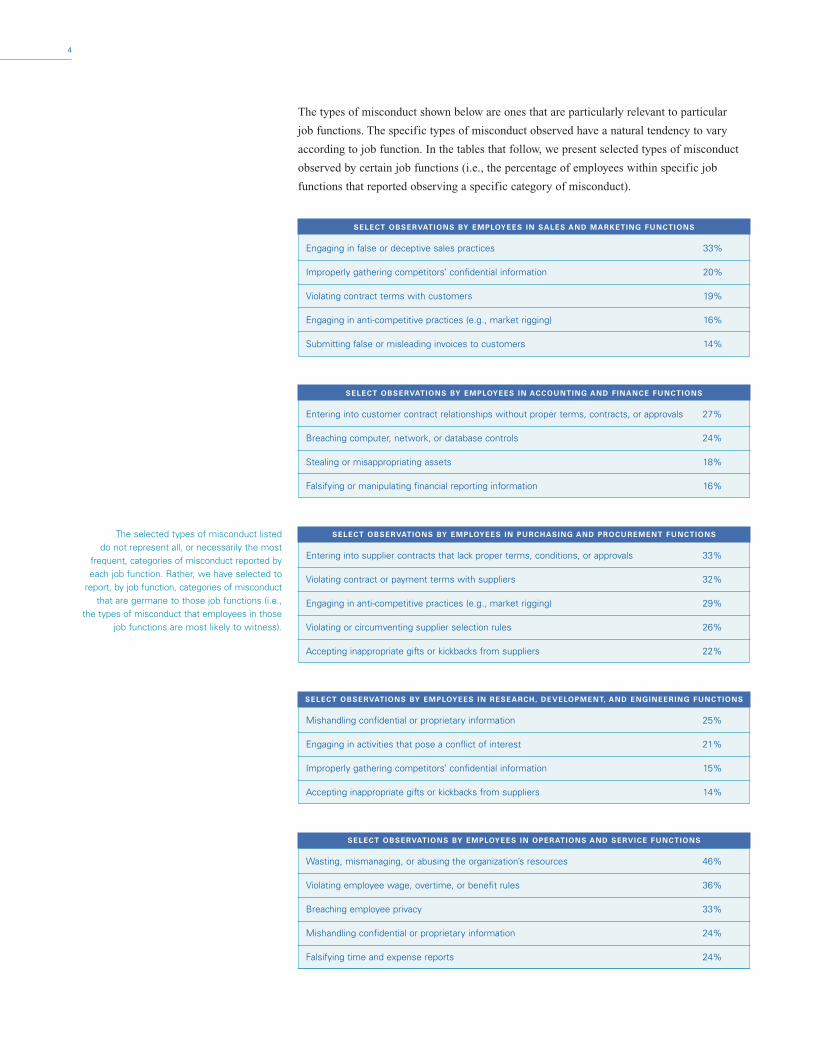
The types of misconduct shown below are ones that are particularly relevant to particular
job functions. The specific types of misconduct observed have a natural tendency to vary
according to job function. In the tables that follow, we present selected types of misconduct
observed by certain job functions (i.e., the percentage of employees within specific job
functions that reported observing a specific category of misconduct).
4
SELECT OBSERVATIONS BY EMPLOYEES IN ACCOUNTING AND FINANCE FUNCTIONS
Entering into customer contract relationships without proper terms, contracts, or approvals 27%
Breaching computer, network, or database controls 24%
Stealing or misappropriating assets 18%
Falsifying or manipulating financial reporting information 16%
SELECT OBSERVATIONS BY EMPLOYEES IN SALES AND MARKETING FUNCTIONS
Engaging in false or deceptive sales practices 33%
Improperly gathering competitors’ confidential information 20%
Violating contract terms with customers 19%
Engaging in anti-competitive practices (e.g., market rigging) 16%
Submitting false or misleading invoices to customers 14%
SELECT OBSERVATIONS BY EMPLOYEES IN RESEARCH, DEVELOPMENT, AND ENGINEERING FUNCTIONS
Mishandling confidential or proprietary information 25%
Engaging in activities that pose a conflict of interest 21%
Improperly gathering competitors’ confidential information 15%
Accepting inappropriate gifts or kickbacks from suppliers 14%
SELECT OBSERVATIONS BY EMPLOYEES IN PURCHASING AND PROCUREMENT FUNCTIONS
Entering into supplier contracts that lack proper terms, conditions, or approvals 33%
Violating contract or payment terms with suppliers 32%
Engaging in anti-competitive practices (e.g., market rigging) 29%
Violating or circumventing supplier selection rules 26%
Accepting inappropriate gifts or kickbacks from suppliers 22%
SELECT OBSERVATIONS BY EMPLOYEES IN OPERATIONS AND SERVICE FUNCTIONS
Wasting, mismanaging, or abusing the organization’s resources 46%
Violating employee wage, overtime, or benefit rules 36%
Breaching employee privacy 33%
Mishandling confidential or proprietary information 24%
Falsifying time and expense reports 24%
The selected types of misconduct listed do not represent all, or necessarily the most
frequent, categories of misconduct reported byeach job function. Rather, we have selected to
report, by job function, categories of misconductthat are germane to those job functions (i.e.,
the types of misconduct that employees in thosejob functions are most likely to witness).
5
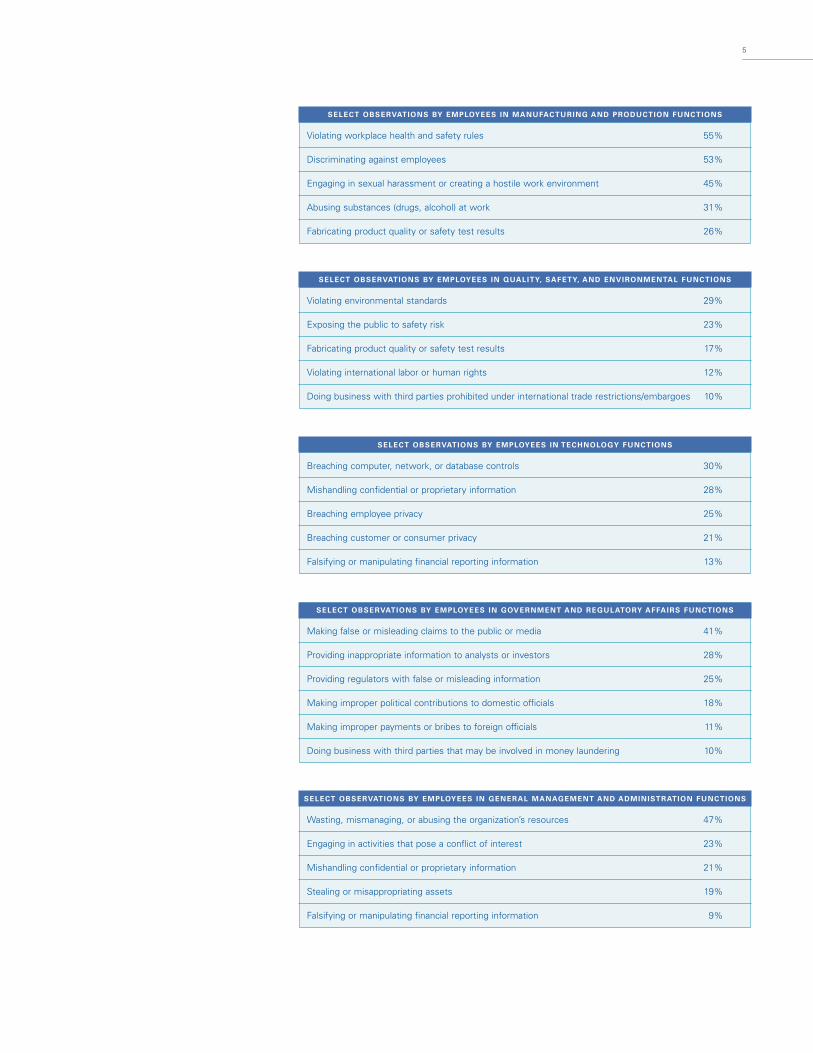
SELECT OBSERVATIONS BY EMPLOYEES IN MANUFACTURING AND PRODUCTION FUNCTIONS
Violating workplace health and safety rules 55%
Discriminating against employees 53%
Engaging in sexual harassment or creating a hostile work environment 45%
Abusing substances (drugs, alcohol) at work 31%
Fabricating product quality or safety test results 26%
SELECT OBSERVATIONS BY EMPLOYEES IN TECHNOLOGY FUNCTIONS
Breaching computer, network, or database controls 30%
Mishandling confidential or proprietary information 28%
Breaching employee privacy 25%
Breaching customer or consumer privacy 21%
Falsifying or manipulating financial reporting information 13%
SELECT OBSERVATIONS BY EMPLOYEES IN QUALITY, SAFETY, AND ENVIRONMENTAL FUNCTIONS
Violating environmental standards 29%
Exposing the public to safety risk 23%
Fabricating product quality or safety test results 17%
Violating international labor or human rights 12%
Doing business with third parties prohibited under international trade restrictions/embargoes 10%
SELECT OBSERVATIONS BY EMPLOYEES IN GENERAL MANAGEMENT AND ADMINISTRATION FUNCTIONS
Wasting, mismanaging, or abusing the organization’s resources 47%
Engaging in activities that pose a conflict of interest 23%
Mishandling confidential or proprietary information 21%
Stealing or misappropriating assets 19%
Falsifying or manipulating financial reporting information 9%
SELECT OBSERVATIONS BY EMPLOYEES IN GOVERNMENT AND REGULATORY AFFAIRS FUNCTIONS
Making false or misleading claims to the public or media 41%
Providing inappropriate information to analysts or investors 28%
Providing regulators with false or misleading information 25%
Making improper political contributions to domestic officials 18%
Making improper payments or bribes to foreign officials 11%
Doing business with third parties that may be involved in money laundering 10%
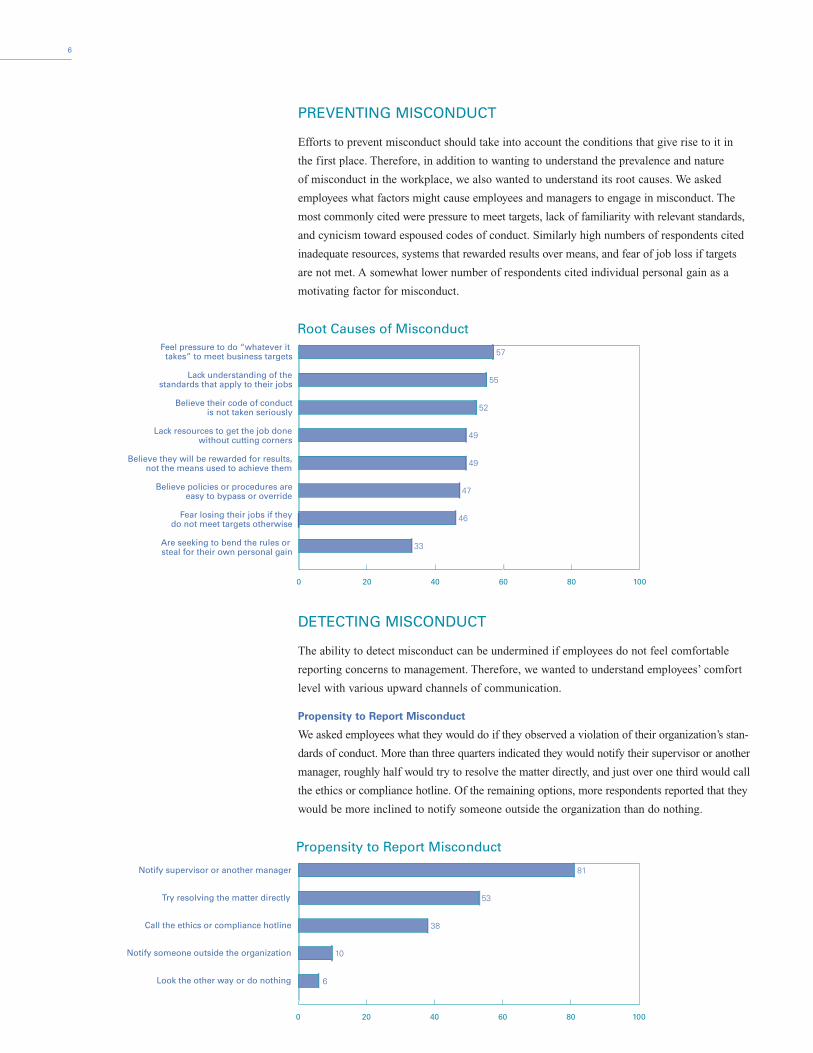
PREVENTING MISCONDUCT
Efforts to prevent misconduct should take into account the conditions that give rise to it in
the first place. Therefore, in addition to wanting to understand the prevalence and nature
of misconduct in the workplace, we also wanted to understand its root causes. We asked
employees what factors might cause employees and managers to engage in misconduct. The
most commonly cited were pressure to meet targets, lack of familiarity with relevant standards,
and cynicism toward espoused codes of conduct. Similarly high numbers of respondents cited
inadequate resources, systems that rewarded results over means, and fear of job loss if targets
are not met. A somewhat lower number of respondents cited individual personal gain as a
motivating factor for misconduct.
DETECTING MISCONDUCT
The ability to detect misconduct can be undermined if employees do not feel comfortable
reporting concerns to management. Therefore, we wanted to understand employees’ comfort
level with various upward channels of communication.
Propensity to Report Misconduct
We asked employees what they would do if they observed a violation of their organization’s stan-
dards of conduct. More than three quarters indicated they would notify their supervisor or another
manager, roughly half would try to resolve the matter directly, and just over one third would call
the ethics or compliance hotline. Of the remaining options, more respondents reported that they
would be more inclined to notify someone outside the organization than do nothing.
6
0 20 40 60 80 100
Root Causes of Misconduct Feel pressure to do “whatever it
takes” to meet business targets
Lack understanding of thestandards that apply to their jobs
Believe their code of conductis not taken seriously
Lack resources to get the job donewithout cutting corners
Believe they will be rewarded for results,not the means used to achieve them
Believe policies or procedures areeasy to bypass or override
Fear losing their jobs if theydo not meet targets otherwise
Are seeking to bend the rules or steal for their own personal gain
57
55
49
47
33
52
49
46
0 20 40 60 80 100
Propensity to Report Misconduct
Notify supervisor or another manager
Try resolving the matter directly
Call the ethics or compliance hotline
Notify someone outside the organization
Look the other way or do nothing
81
38
6
53
10
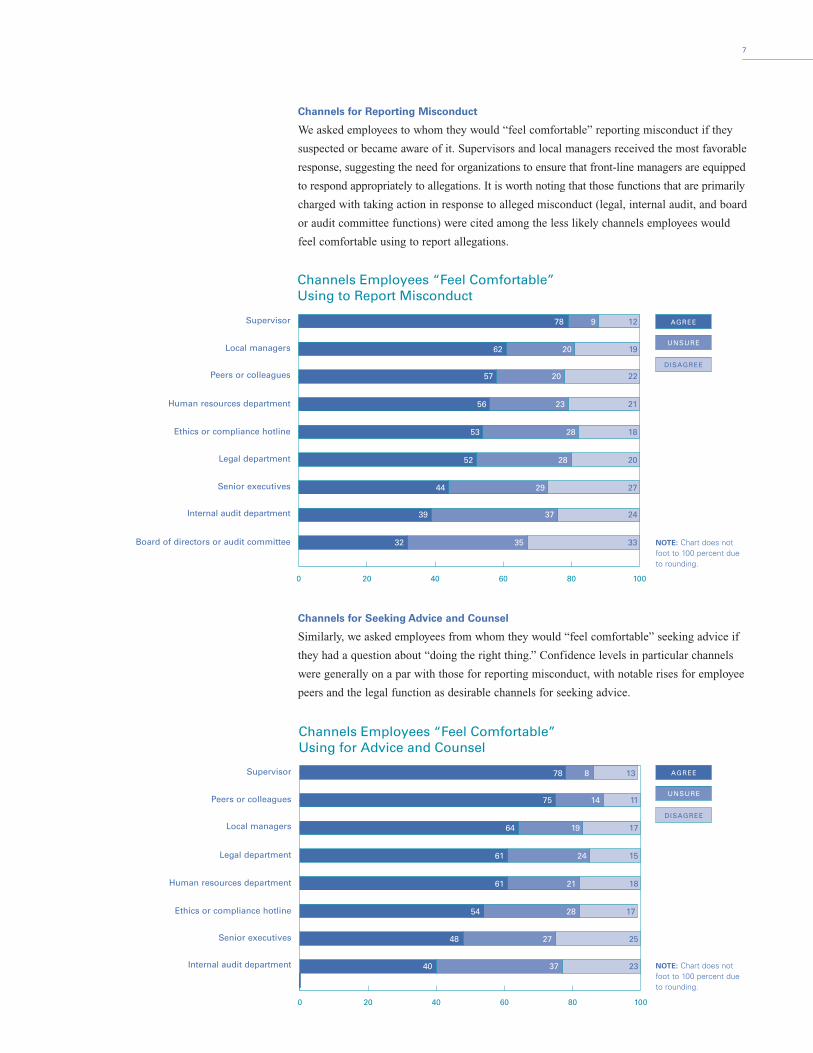
Channels for Reporting Misconduct
We asked employees to whom they would “feel comfortable” reporting misconduct if they
suspected or became aware of it. Supervisors and local managers received the most favorable
response, suggesting the need for organizations to ensure that front-line managers are equipped
to respond appropriately to allegations. It is worth noting that those functions that are primarily
charged with taking action in response to alleged misconduct (legal, internal audit, and board
or audit committee functions) were cited among the less likely channels employees would
feel comfortable using to report allegations.
Channels for Seeking Advice and Counsel
Similarly, we asked employees from whom they would “feel comfortable” seeking advice if
they had a question about “doing the right thing.” Confidence levels in particular channels
were generally on a par with those for reporting misconduct, with notable rises for employee
peers and the legal function as desirable channels for seeking advice.
7
0 20 40 60 80 100
Channels Employees “Feel Comfortable”Using to Report Misconduct
12978Supervisor
192062Local managers
222057
212356
182853
202852
272944
243739
333532
Peers or colleagues
Human resources department
Ethics or compliance hotline
Legal department
Senior executives
Internal audit department
Board of directors or audit committee
AGREE
UNSURE
DISAGREE
AGREE
UNSURE
DISAGREE
0 20 40 60 80 100
Channels Employees “Feel Comfortable”Using for Advice and Counsel
13878
172854
111475
171964
152461
182161
252748
233740
Supervisor
Peers or colleagues
Local managers
Legal department
Human resources department
Ethics or compliance hotline
Senior executives
Internal audit department NOTE: Chart does not foot to 100 percent due to rounding.
NOTE: Chart does not foot to 100 percent due to rounding.
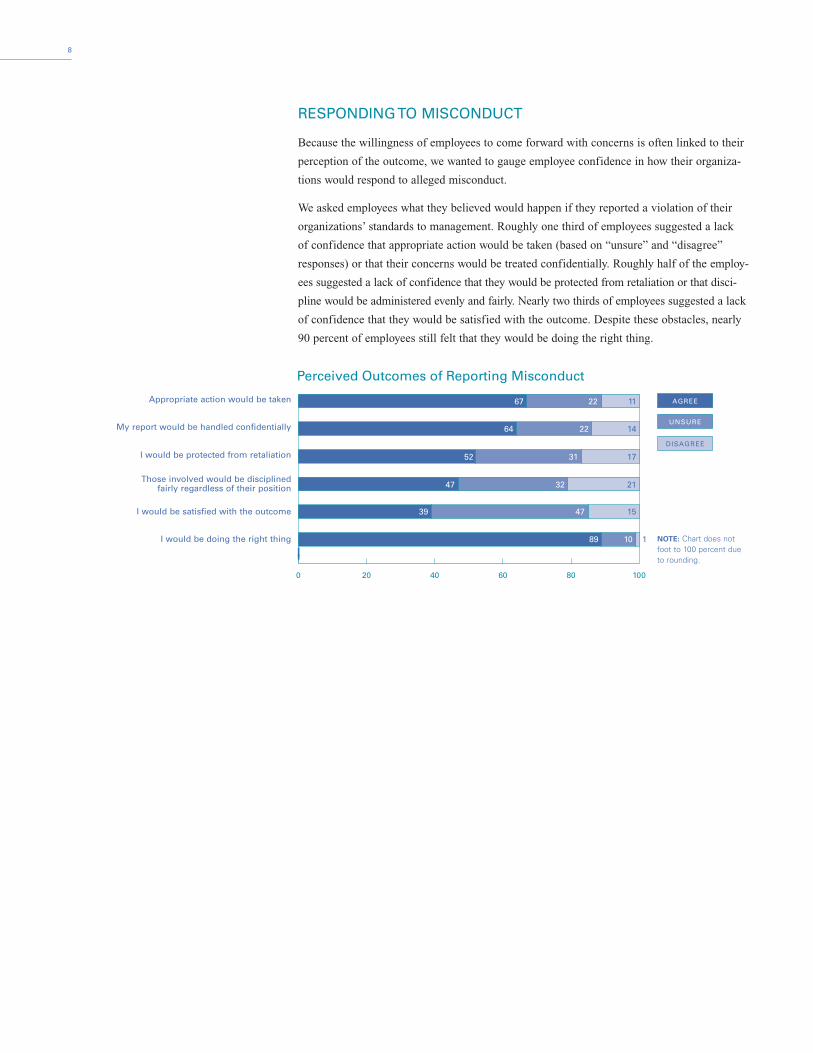
RESPONDING TO MISCONDUCT
Because the willingness of employees to come forward with concerns is often linked to their
perception of the outcome, we wanted to gauge employee confidence in how their organiza-
tions would respond to alleged misconduct.
We asked employees what they believed would happen if they reported a violation of their
organizations’ standards to management. Roughly one third of employees suggested a lack
of confidence that appropriate action would be taken (based on “unsure” and “disagree”
responses) or that their concerns would be treated confidentially. Roughly half of the employ-
ees suggested a lack of confidence that they would be protected from retaliation or that disci-
pline would be administered evenly and fairly. Nearly two thirds of employees suggested a lack
of confidence that they would be satisfied with the outcome. Despite these obstacles, nearly
90 percent of employees still felt that they would be doing the right thing.
8
AGREE
UNSURE
DISAGREE
Appropriate action would be taken
My report would be handled confidentially
I would be protected from retaliation
Those involved would be disciplined fairly regardless of their position
I would be satisfied with the outcome
I would be doing the right thing
0 20 40 60 80 100
Perceived Outcomes of Reporting Misconduct
112267
142264
173152
213247
154739
11089 NOTE: Chart does not foot to 100 percent due to rounding.
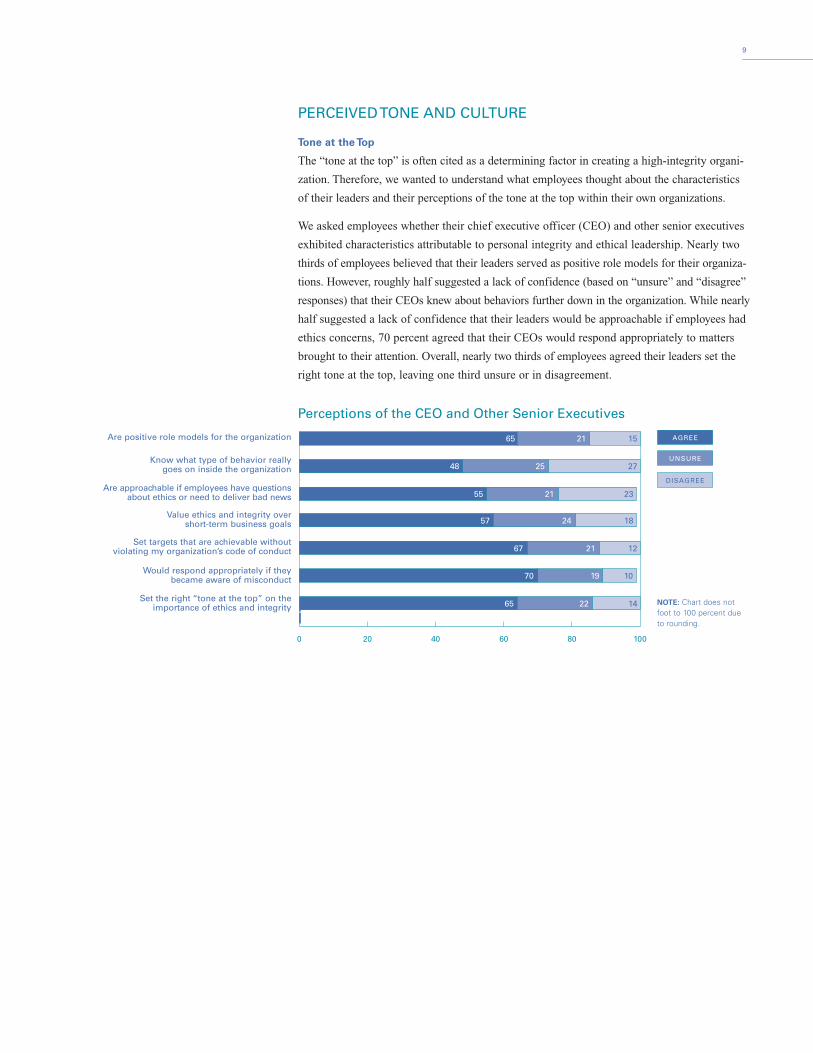
PERCEIVED TONE AND CULTURE
Tone at the Top
The “tone at the top” is often cited as a determining factor in creating a high-integrity organi-
zation. Therefore, we wanted to understand what employees thought about the characteristics
of their leaders and their perceptions of the tone at the top within their own organizations.
We asked employees whether their chief executive officer (CEO) and other senior executives
exhibited characteristics attributable to personal integrity and ethical leadership. Nearly two
thirds of employees believed that their leaders served as positive role models for their organiza-
tions. However, roughly half suggested a lack of confidence (based on “unsure” and “disagree”
responses) that their CEOs knew about behaviors further down in the organization. While nearly
half suggested a lack of confidence that their leaders would be approachable if employees had
ethics concerns, 70 percent agreed that their CEOs would respond appropriately to matters
brought to their attention. Overall, nearly two thirds of employees agreed their leaders set the
right tone at the top, leaving one third unsure or in disagreement.
9
AGREE
UNSURE
DISAGREE
Are positive role models for the organization
Know what type of behavior really goes on inside the organization
Are approachable if employees have questions about ethics or need to deliver bad news
Value ethics and integrity overshort-term business goals
Set targets that are achievable without violating my organization’s code of conduct
Would respond appropriately if they became aware of misconduct
Set the right “tone at the top” on the importance of ethics and integrity
0 20 40 60 80 100
Perceptions of the CEO and Other Senior Executives
152165
272548
122167
142265
101970
232155
182457
NOTE: Chart does not foot to 100 percent due to rounding.
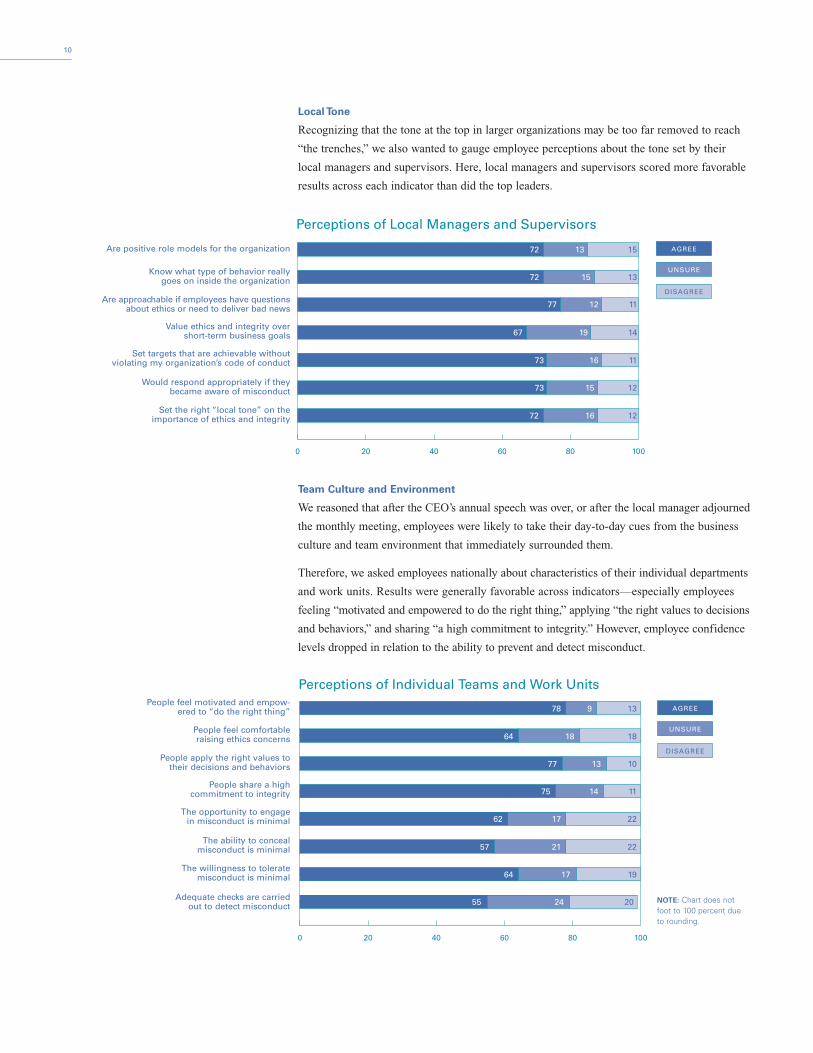
Local Tone
Recognizing that the tone at the top in larger organizations may be too far removed to reach
“the trenches,” we also wanted to gauge employee perceptions about the tone set by their
local managers and supervisors. Here, local managers and supervisors scored more favorable
results across each indicator than did the top leaders.
Team Culture and Environment
We reasoned that after the CEO’s annual speech was over, or after the local manager adjourned
the monthly meeting, employees were likely to take their day-to-day cues from the business
culture and team environment that immediately surrounded them.
Therefore, we asked employees nationally about characteristics of their individual departments
and work units. Results were generally favorable across indicators—especially employees
feeling “motivated and empowered to do the right thing,” applying “the right values to decisions
and behaviors,” and sharing “a high commitment to integrity.” However, employee confidence
levels dropped in relation to the ability to prevent and detect misconduct.
10
People feel motivated and empow-ered to “do the right thing”
People feel comfortable raising ethics concerns
People apply the right values to their decisions and behaviors
People share a high commitment to integrity
The opportunity to engage in misconduct is minimal
The ability to conceal misconduct is minimal
The willingness to tolerate misconduct is minimal
Adequate checks are carried out to detect misconduct
0 20 40 60 80 100
Perceptions of Individual Teams and Work Units
13978
181864
101377
111475
221762
222157
191764
202455 NOTE: Chart does not foot to 100 percent due to rounding.
AGREE
UNSURE
DISAGREE
AGREE
UNSURE
DISAGREE
Are positive role models for the organization
Know what type of behavior really goes on inside the organization
Are approachable if employees have questions about ethics or need to deliver bad news
Value ethics and integrity overshort-term business goals
Set targets that are achievable without violating my organization’s code of conduct
Would respond appropriately if they became aware of misconduct
Set the right “local tone” on the importance of ethics and integrity
0000
0 20 40 60 80 100
Perceptions of Local Managers and Supervisors
151372
131572
111277
141967
111673
121573
121672
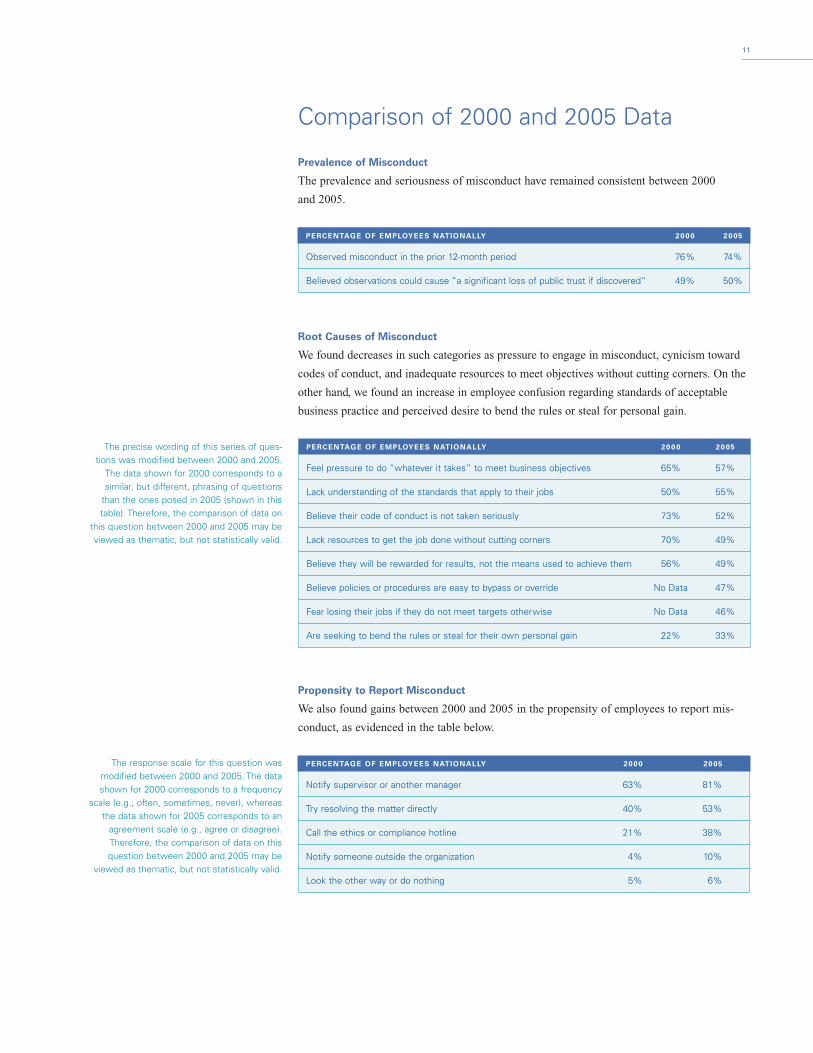
Comparison of 2000 and 2005 Data
Prevalence of Misconduct
The prevalence and seriousness of misconduct have remained consistent between 2000
and 2005.
Root Causes of Misconduct
We found decreases in such categories as pressure to engage in misconduct, cynicism toward
codes of conduct, and inadequate resources to meet objectives without cutting corners. On the
other hand, we found an increase in employee confusion regarding standards of acceptable
business practice and perceived desire to bend the rules or steal for personal gain.
Propensity to Report Misconduct
We also found gains between 2000 and 2005 in the propensity of employees to report mis-
conduct, as evidenced in the table below.
11
PERCENTAGE OF EMPLOYEES NATIONALLY 2000 2005
Observed misconduct in the prior 12-month period 76% 74%
Believed observations could cause “a significant loss of public trust if discovered” 49% 50%
PERCENTAGE OF EMPLOYEES NATIONALLY 2000 2005
Feel pressure to do “whatever it takes” to meet business objectives 65% 57%
Lack understanding of the standards that apply to their jobs 50% 55%
Believe their code of conduct is not taken seriously 73% 52%
Lack resources to get the job done without cutting corners 70% 49%
Believe they will be rewarded for results, not the means used to achieve them 56% 49%
Believe policies or procedures are easy to bypass or override No Data 47%
Fear losing their jobs if they do not meet targets otherwise No Data 46%
Are seeking to bend the rules or steal for their own personal gain 22% 33%
PERCENTAGE OF EMPLOYEES NATIONALLY 2000 2005
Notify supervisor or another manager 63% 81%
Try resolving the matter directly 40% 53%
Call the ethics or compliance hotline 21% 38%
Notify someone outside the organization 4% 10%
Look the other way or do nothing 5% 6%
The precise wording of this series of ques-tions was modified between 2000 and 2005.
The data shown for 2000 corresponds to asimilar, but different, phrasing of questions
than the ones posed in 2005 (shown in thistable). Therefore, the comparison of data on
this question between 2000 and 2005 may beviewed as thematic, but not statistically valid.
The response scale for this question wasmodified between 2000 and 2005. The datashown for 2000 corresponds to a frequency
scale (e.g., often, sometimes, never), whereasthe data shown for 2005 corresponds to an
agreement scale (e.g., agree or disagree).Therefore, the comparison of data on thisquestion between 2000 and 2005 may be
viewed as thematic, but not statistically valid.

PERCENTAGE OF EMPLOYEES NATIONALLY 2000 2005
Are positive role models for the organization 60% 65%
Know what type of behavior really goes on inside the organization 43% 48%
Are approachable if employees have questions about ethics or need to deliver bad news 45% 55%
Value ethics and integrity over short-term business goals No Data 57%
Set targets that are achievable without violating my organization’s standards of conduct* 58% 67%
Would respond appropriately if they became aware of misconduct 64% 70%
Set the right “tone at the top” on the importance of ethics and integrity No Data 65%
Channels for Reporting Misconduct
Employee comfort levels in reporting misconduct through a hotline rose between 2000 and 2005.
Perceived Outcomes of Reporting Misconduct to Management
In all criteria where we have comparative data, employees expressed greater confidence
in the outcomes of reporting misconduct to management than they had in 2000.
Perceptions of the CEO and Other Senior Executives
Overall, employees had more positive perceptions of CEOs and other senior executives.
12
PERCENTAGE OF EMPLOYEES NATIONALLY 2000 2005
Supervisor 77% 78%
Local managers No Data 62%
Peers or colleagues No Data 57%
Human resources department 56% 56%
Ethics or compliance hotline 40% 53%
Senior executives 43% 44%
Legal department 40% 52%
Internal audit department No Data 39%
Board of directors or audit committee No Data 32%
PERCENTAGE OF EMPLOYEES NATIONALLY 2000 2005
Appropriate action would be taken 61% 67%
My report would be handled confidentially 59% 64%
I would be protected from retaliation 47% 52%
Those involved would be disciplined fairly regardless of their position 39% 47%
I would be satisfied with the outcome No Data 39%
I would be doing the right thing 85% 89%
* The precise wording of this question was modified between 2000and 2005. The data shown for 2000 corresponds to a similar, butdifferent, question than the one posed in 2005 (shown in table).Therefore, the comparison of data on this question between 2000and 2005 may be viewed as thematic, but not statistically valid.

Impact of Ethics and Compliance Programs
PROGRAM ELEMENTS
Ethics and compliance programs have become increasingly commonplace within organiza-
tions. These are also referred to as “antifraud programs” in auditing standards and literature,
and were largely reinforced by Sarbanes-Oxley Act legislation. We wanted to gauge whether
specific program elements were recognizable to employees, and to understand whether the
presence of such program elements had any impact on the indicators measured in the survey.
We asked employees whether their organizations had the specific ethics and compliance
program elements shown in the table below.
PRESENCE OF PROGRAM ELEMENTS
FORMALLY INFORMALLY UNSURE NOT AT ALL
Has a code of conduct that articulates the values and standards of the organization 77% 10% 10% 3%
Has a senior-level ethics or compliance officer 51% 7% 32% 10%
Performs background investigations on prospective employees 60% 10% 23% 7%
Provides communication and training to employees on its code of conduct 69% 17% 8% 5%
Has a confidential and anonymous hotline that employees can use to report misconduct or seek advice 48% 6% 24% 22%
Audits and monitors employee compliance with its code of conduct 44% 23% 24% 10%
Has policies to hold employees and managers accountable for code of conduct violations 65% 12% 17% 7%
Provides incentives for employees to uphold the code of conduct 23% 13% 28% 37%
Has policies to investigate and take corrective action if misconduct is alleged 65% 11% 18% 6%
13
NOTE: Chart does not foot to 100 percent due to rounding.
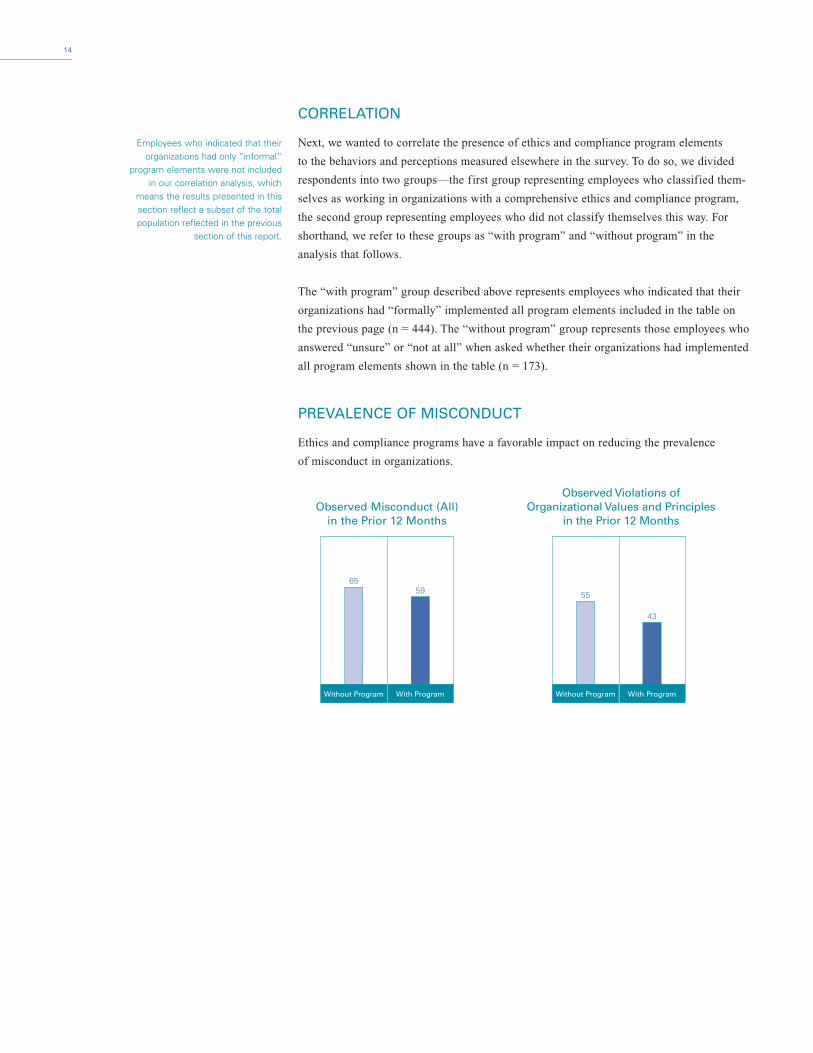
CORRELATION
Next, we wanted to correlate the presence of ethics and compliance program elements
to the behaviors and perceptions measured elsewhere in the survey. To do so, we divided
respondents into two groups—the first group representing employees who classified them-
selves as working in organizations with a comprehensive ethics and compliance program,
the second group representing employees who did not classify themselves this way. For
shorthand, we refer to these groups as “with program” and “without program” in the
analysis that follows.
The “with program” group described above represents employees who indicated that their
organizations had “formally” implemented all program elements included in the table on
the previous page (n = 444). The “without program” group represents those employees who
answered “unsure” or “not at all” when asked whether their organizations had implemented
all program elements shown in the table (n = 173).
PREVALENCE OF MISCONDUCT
Ethics and compliance programs have a favorable impact on reducing the prevalence
of misconduct in organizations.
14
Observed Violations of Organizational Values and Principles
in the Prior 12 Months
55
43
Without Program With Program
Employees who indicated that theirorganizations had only “informal”
program elements were not included in our correlation analysis, which
means the results presented in thissection reflect a subset of the totalpopulation reflected in the previous
section of this report.
Observed Misconduct (All)in the Prior 12 Months
6559
Without Program With Program
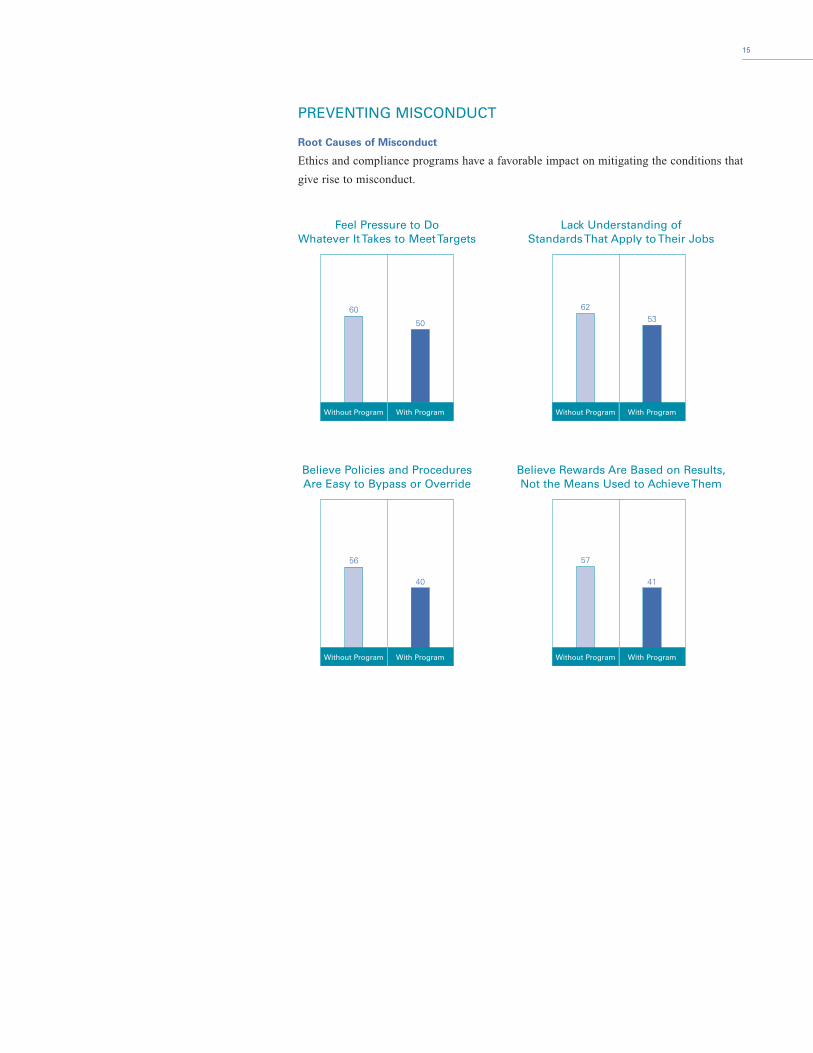
PREVENTING MISCONDUCT
Root Causes of Misconduct
Ethics and compliance programs have a favorable impact on mitigating the conditions that
give rise to misconduct.
15
Feel Pressure to Do Whatever It Takes to Meet Targets
Lack Understanding of Standards That Apply to Their Jobs
60
50
Without Program With Program
6253
Without Program With Program
Believe Policies and Procedures Are Easy to Bypass or Override
Believe Rewards Are Based on Results, Not the Means Used to Achieve Them
56
40
Without Program With Program
57
41
Without Program With Program

DETECTING MISCONDUCT
Channels for Reporting Misconduct
Ethics and compliance programs have a favorable impact on employee willingness
to report misconduct.
16
Would Feel Comfortable ReportingMisconduct to Supervisor
Would Feel Comfortable ReportingMisconduct to Legal Department
48
88
Without Program With Program
25
73
Without Program With Program
Would Feel Comfortable ReportingMisconduct to Internal Audit
Would Feel Comfortable ReportingMisconduct to Board of Directors
19
63
Without Program With Program
20
59
Without Program With Program
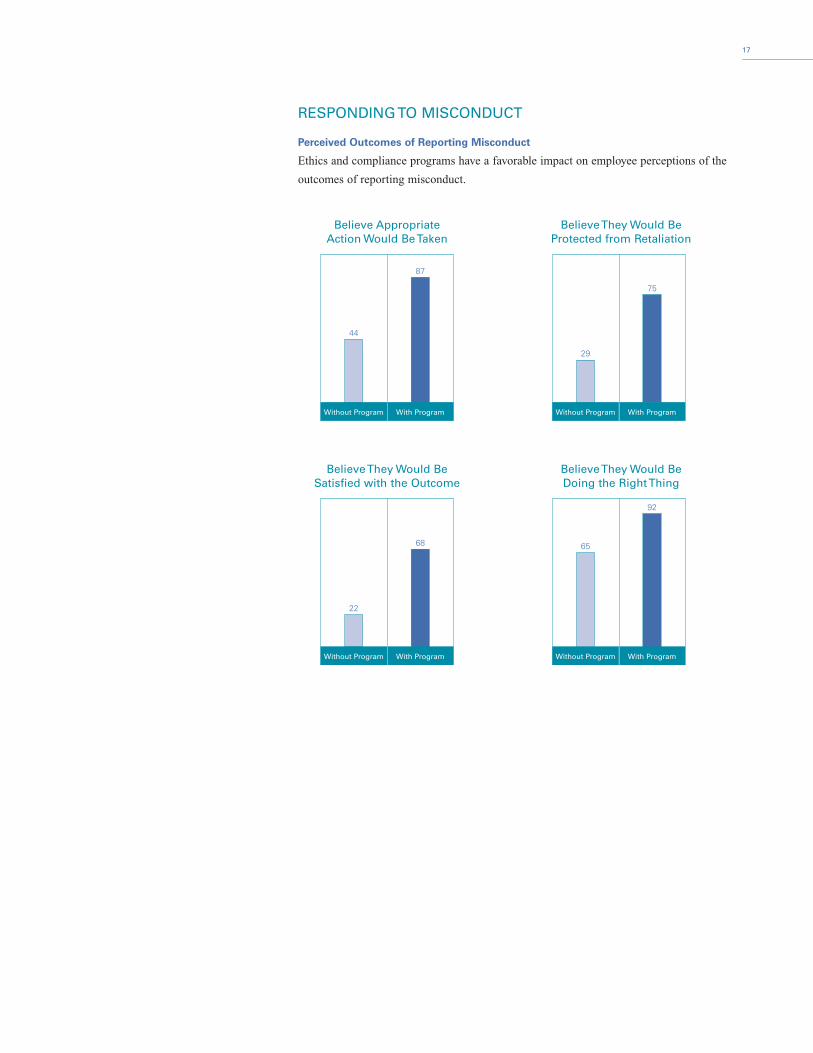
RESPONDING TO MISCONDUCT
Perceived Outcomes of Reporting Misconduct
Ethics and compliance programs have a favorable impact on employee perceptions of the
outcomes of reporting misconduct.
17
Believe Appropriate Action Would Be Taken
Believe They Would BeProtected from Retaliation
44
87
Without Program With Program
29
75
Without Program With Program
Believe They Would BeSatisfied with the Outcome
Believe They Would BeDoing the Right Thing
22
68
Without Program With Program
65
92
Without Program With Program
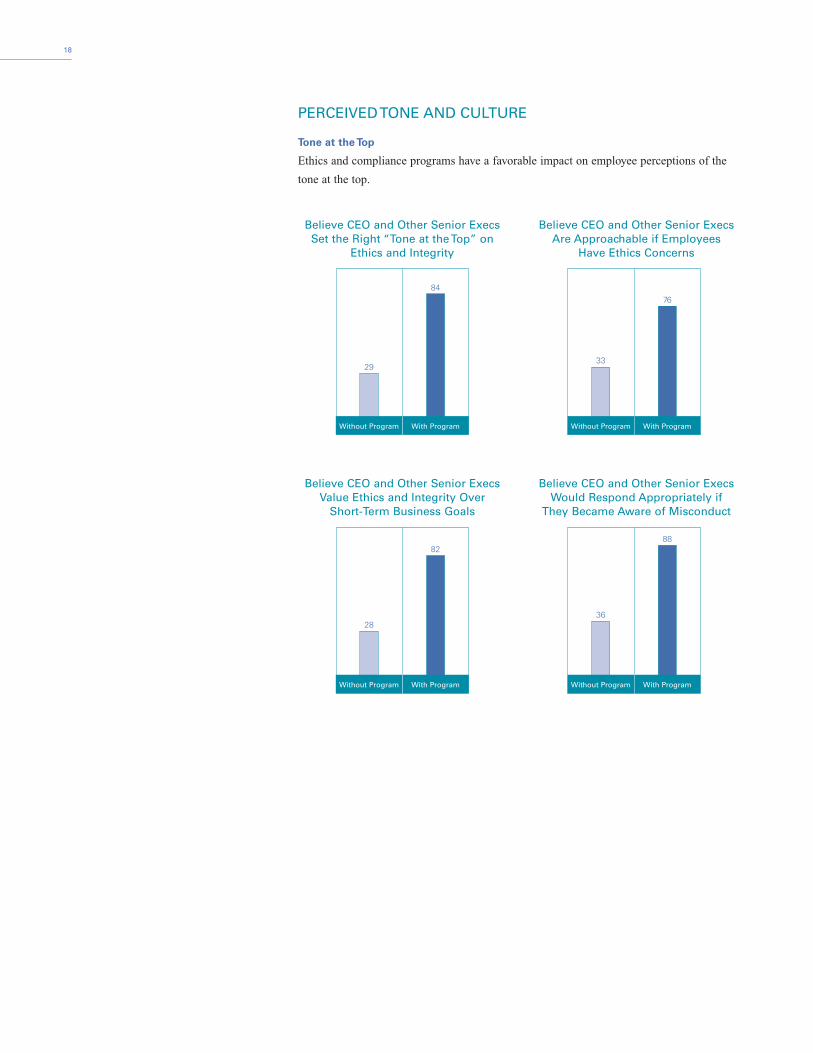
PERCEIVED TONE AND CULTURE
Tone at the Top
Ethics and compliance programs have a favorable impact on employee perceptions of the
tone at the top.
18
Believe CEO and Other Senior ExecsSet the Right “Tone at the Top” on
Ethics and Integrity
Believe CEO and Other Senior ExecsAre Approachable if Employees
Have Ethics Concerns
29
84
Without Program With Program
33
76
Without Program With Program
Believe CEO and Other Senior ExecsValue Ethics and Integrity Over
Short-Term Business Goals
Believe CEO and Other Senior ExecsWould Respond Appropriately if
They Became Aware of Misconduct
28
82
Without Program With Program
36
88
Without Program With Program
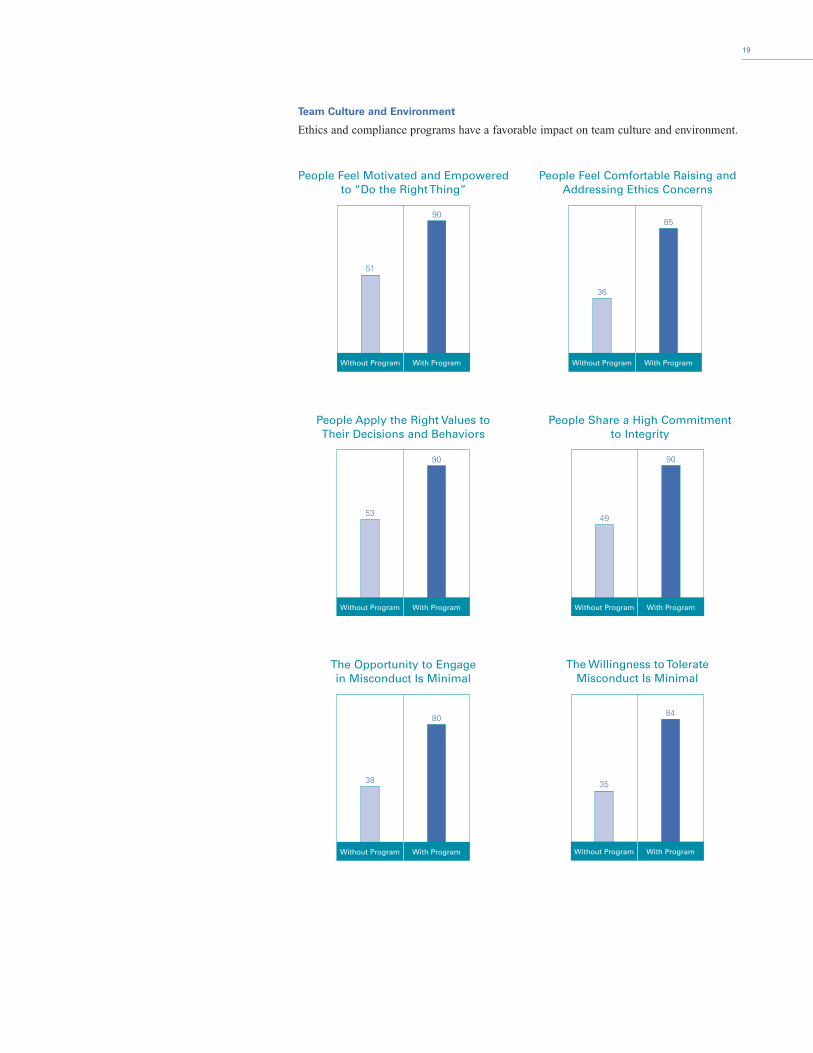
Team Culture and Environment
Ethics and compliance programs have a favorable impact on team culture and environment.
19
The Opportunity to Engagein Misconduct Is Minimal
38
80
Without Program With Program
The Willingness to Tolerate Misconduct Is Minimal
35
84
Without Program With Program
People Apply the Right Values toTheir Decisions and Behaviors
People Share a High Commitmentto Integrity
53
90
Without Program With Program
49
90
Without Program With Program
People Feel Motivated and Empoweredto “Do the Right Thing”
People Feel Comfortable Raising andAddressing Ethics Concerns
51
90
Without Program With Program
36
85
Without Program With Program
Meeting the Regulatory Challenge
The government has responded to widespread cases of corporate fraud and misconduct through
an array of reforms aimed at encouraging companies to be more self-governing. The importance
of establishing an effective ethics and compliance program can increasingly be seen as a com-
mon denominator across legislative and judicial policies—and a cornerstone of corporate fraud
risk management.
SARBANES-OXLEY ACT OF 2002 (SECTION 404)
Section 404 of the Sarbanes-Oxley Act requires companies and their auditors to evaluate the
effectiveness of their internal control over financial reporting based on a suitable control
framework. Most companies in the United States are applying the integrated internal control
framework developed by the Committee of Sponsoring Organizations (COSO) of the
Treadway Commission for this purpose. Generally speaking, COSO addresses ethics and
compliance program elements in company-level components that have a pervasive influence
on organizational behavior, such as the control environment.
Examples of company-level control considerations include:
� Establishment of the tone at the top by the board and management
� Existence of codes of conduct and other policies regarding acceptable business practices
� Extent to which employees are made aware of management’s expectations
� Pressure to meet unrealistic or short-term performance targets
� Management’s attitude toward overriding established controls
� Extent to which adherence to the code of conduct is a criterion in performance appraisals
� Extent to which management monitors whether internal control systems are working
� Establishment of channels for people to report suspected improprieties
� Appropriateness of remedial action taken in response to violations of the code of conduct
CORPORATE GOVERNANCE LISTING STANDARDS
In response to provisions of the Sarbanes-Oxley Act, both the New York Stock Exchange
(NYSE) and the National Association of Securities Dealers Automated Quotation (NASDAQ)
system adopted new corporate governance rules for listed companies. While the specific rules
for each exchange differ, each exchange includes standards that require listed companies to
adopt and disclose codes of conduct for directors, officers, and employees and disclose any
code of conduct waivers for directors or executive officers. In addition, the rules of each
exchange require listed companies to adopt mechanisms to enforce their codes of conduct.
U.S. SENTENCING GUIDELINES CRITERIA
The federal sentencing guidelines for organizational defendants establish minimum compliance
and ethics program requirements for organizations seeking to mitigate penalties for corporate
misconduct. Amended on November 1, 2004, these guidelines now make more explicit the
expectation that organizations promote a culture of ethical conduct, tailor each program element
based on compliance risk, and periodically evaluate program effectiveness.
20
Specifically, the amended guidelines call on organizations to:
� Promote a culture that encourages ethical conduct and a commitment to compliance with
the law
� Establish standards and procedures to prevent and detect criminal conduct
� Ensure the board of directors and senior executives are knowledgeable and exercise reason-
able oversight of the compliance and ethics program
� Assign a high-level individual within the organization to ensure the organization has an
effective compliance and ethics program, and delegate day-to-day operational responsibility
to individuals with adequate resources, authority, and direct access to the board
� Use reasonable efforts and exercise due diligence to exclude individuals from positions of
substantial authority who have engaged in illegal activities or other conduct inconsistent
with an effective compliance and ethics program
� Conduct effective training programs for directors, officers, employees, and other agents and
provide such individuals with periodic information appropriate to their respective roles and
responsibilities relative to the compliance and ethics program
� Ensure that the compliance and ethics program is followed, including monitoring and audit-
ing to detect criminal conduct
� Publicize a system, which may include mechanisms for anonymity and confidentiality,
whereby the organization’s employees and agents may report or seek guidance regarding
potential or actual misconduct without fear of retaliation
� Evaluate periodically the effectiveness of the compliance and ethics program
� Promote and enforce consistently the compliance and ethics program through incentives
and disciplinary measures
� Take reasonable steps to respond appropriately to misconduct, including making necessary
modifications to the compliance and ethics program.
DEPARTMENT OF JUSTICE PROSECUTION POLICY
The Department of Justice also has amended guidance related to the federal prosecution of
business organizations in cases involving corporate wrongdoing. While the guidance states
that a compliance program does not absolve a corporation from criminal liability, it does pro-
vide factors that prosecutors should consider in determining whether to charge an organiza-
tion or only its employees and agents with a crime.
These factors include evaluating whether:
� The compliance program is merely a “paper program” or has been designed and imple-
mented in an effective manner
� Corporate management is enforcing the program or tacitly encouraging or pressuring
employees to engage in misconduct to achieve business objectives
� The corporation has provided for a staff sufficient to audit and evaluate the results of the
corporation’s compliance efforts
� The corporation’s employees are informed about the compliance program and are con-
vinced of the corporation’s commitment to it.
21
DIRECTOR AND OFFICER LIABILITY
An influential Delaware court broke ground in 1996 with its In re Caremark Int’l Inc.
Derivative Litigation decision. The Caremark case was a derivative shareholder action
brought against the board of directors of Caremark International alleging directors breached
their fiduciary duties by failing to monitor effectively the conduct of company employees
who violated various state and federal laws—which led to the company pleading guilty to
criminal charges and paying substantial criminal and civil fines.
The court held that boards of directors that exercise reasonable oversight of a compliance
program may be eligible for protection from personal liability in shareholder civil suits
resulting from employee misconduct. The Caremark case pointed out that the compliance
program should provide “timely, accurate information sufficient to allow management and
the board, each within its scope, to reach informed judgments concerning both the corpora-
tion’s compliance with laws and its business performance.” It also made clear that a director’s
fiduciary duty goes beyond ensuring that a compliance program exists, but that “[t]he direc-
tor’s obligation [also] includes a duty to attempt in good faith to assure that [the compliance
program] is adequate…”
THE CORPORATE RESPONSE
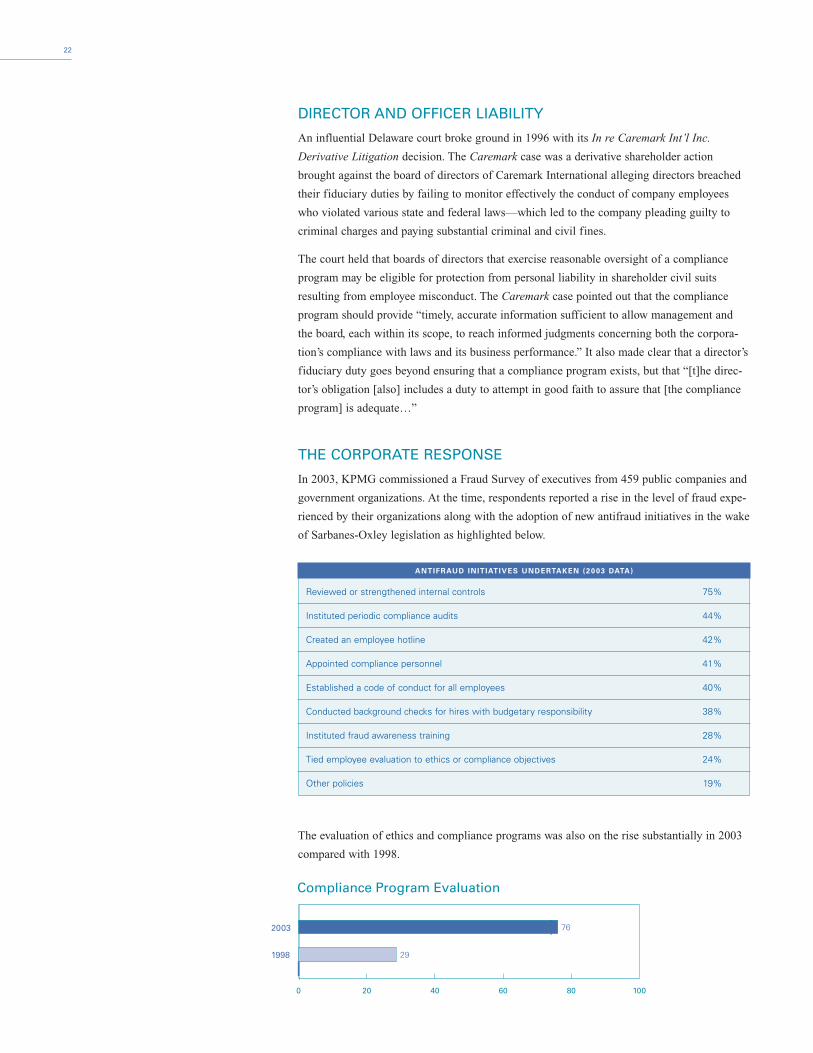
In 2003, KPMG commissioned a Fraud Survey of executives from 459 public companies and
government organizations. At the time, respondents reported a rise in the level of fraud expe-
rienced by their organizations along with the adoption of new antifraud initiatives in the wake
of Sarbanes-Oxley legislation as highlighted below.
The evaluation of ethics and compliance programs was also on the rise substantially in 2003
compared with 1998.
22
ANTIFRAUD INITIATIVES UNDERTAKEN (2003 DATA)
Reviewed or strengthened internal controls 75%
Instituted periodic compliance audits 44%
Created an employee hotline 42%
Appointed compliance personnel 41%
Established a code of conduct for all employees 40%
Conducted background checks for hires with budgetary responsibility 38%
Instituted fraud awareness training 28%
Tied employee evaluation to ethics or compliance objectives 24%
Other policies 19%
0 20 40 60 80 100
Compliance Program Evaluation
1998
2003
29
76
Background and Methodology
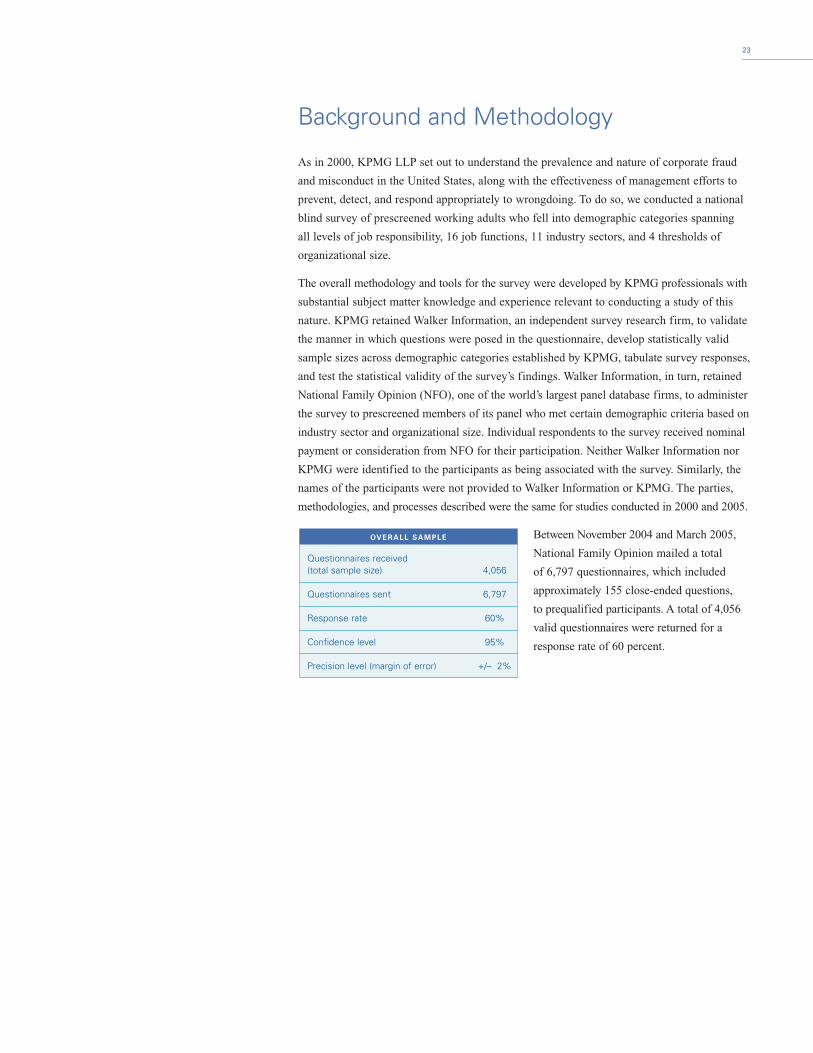
As in 2000, KPMG LLP set out to understand the prevalence and nature of corporate fraud
and misconduct in the United States, along with the effectiveness of management efforts to
prevent, detect, and respond appropriately to wrongdoing. To do so, we conducted a national
blind survey of prescreened working adults who fell into demographic categories spanning
all levels of job responsibility, 16 job functions, 11 industry sectors, and 4 thresholds of
organizational size.
The overall methodology and tools for the survey were developed by KPMG professionals with
substantial subject matter knowledge and experience relevant to conducting a study of this
nature. KPMG retained Walker Information, an independent survey research firm, to validate
the manner in which questions were posed in the questionnaire, develop statistically valid
sample sizes across demographic categories established by KPMG, tabulate survey responses,
and test the statistical validity of the survey’s findings. Walker Information, in turn, retained
National Family Opinion (NFO), one of the world’s largest panel database firms, to administer
the survey to prescreened members of its panel who met certain demographic criteria based on
industry sector and organizational size. Individual respondents to the survey received nominal
payment or consideration from NFO for their participation. Neither Walker Information nor
KPMG were identified to the participants as being associated with the survey. Similarly, the
names of the participants were not provided to Walker Information or KPMG. The parties,
methodologies, and processes described were the same for studies conducted in 2000 and 2005.
Between November 2004 and March 2005,
National Family Opinion mailed a total
of 6,797 questionnaires, which included
approximately 155 close-ended questions,
to prequalified participants. A total of 4,056
valid questionnaires were returned for a
response rate of 60 percent.
23
OVERALL SAMPLE
Questionnaires received (total sample size) 4,056
Questionnaires sent 6,797
Response rate 60%
Confidence level 95%
Precision level (margin of error) +/– 2%
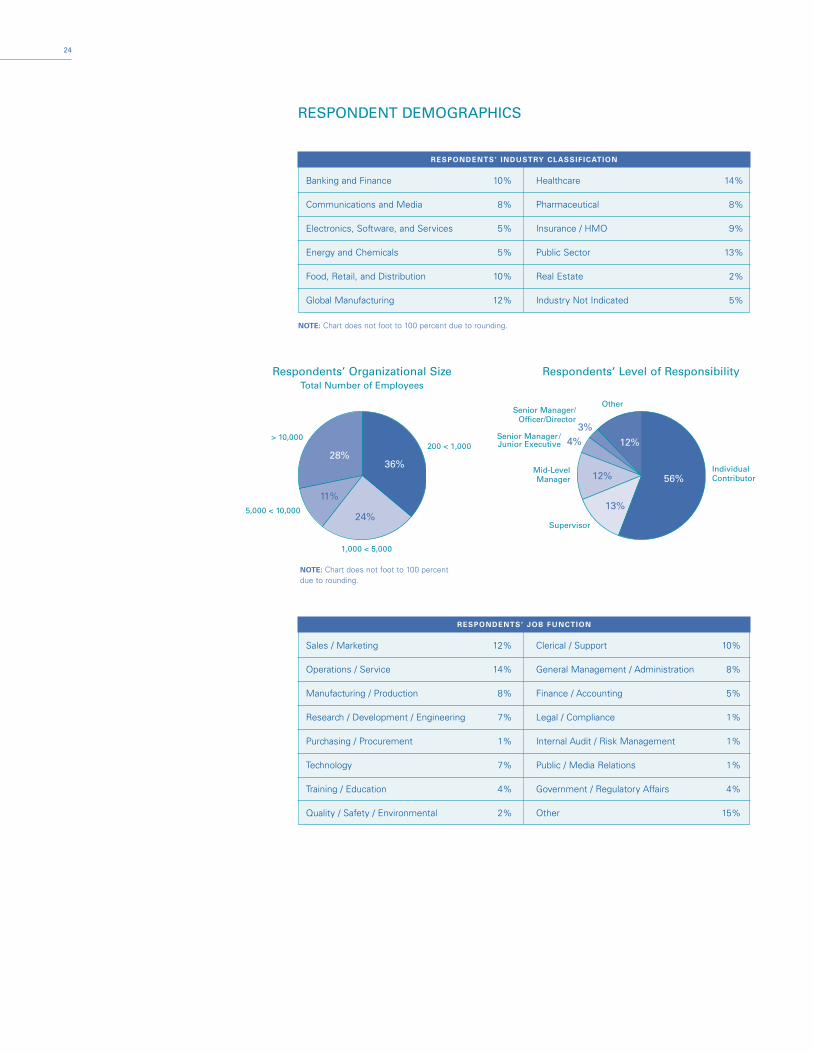
RESPONDENT DEMOGRAPHICS
24
Respondents’ Organizational SizeTotal Number of Employees
Respondents’ Level of Responsibility
200 < 1,000
IndividualContributor
Supervisor
Mid-LevelManager
Senior Manager/Junior Executive
Senior Manager/Officer/Director
Other
> 10,000
1,000 < 5,000
5,000 < 10,000
RESPONDENTS’ JOB FUNCTION
Sales / Marketing 12% Clerical / Support 10%
Operations / Service 14% General Management / Administration 8%
Manufacturing / Production 8% Finance / Accounting 5%
Research / Development / Engineering 7% Legal / Compliance 1%
Purchasing / Procurement 1% Internal Audit / Risk Management 1%
Technology 7% Public / Media Relations 1%
Training / Education 4% Government / Regulatory Affairs 4%
Quality / Safety / Environmental 2% Other 15%
RESPONDENTS’ INDUSTRY CLASSIFICATION
Banking and Finance 10% Healthcare 14%
Communications and Media 8% Pharmaceutical 8%
Electronics, Software, and Services 5% Insurance / HMO 9%
Energy and Chemicals 5% Public Sector 13%
Food, Retail, and Distribution 10% Real Estate 2%
Global Manufacturing 12% Industry Not Indicated 5%
28%
56%
12%
13%
12%36%
24%
11%
4%3%
NOTE: Chart does not foot to 100 percent due to rounding.
NOTE: Chart does not foot to 100 percent due to rounding.
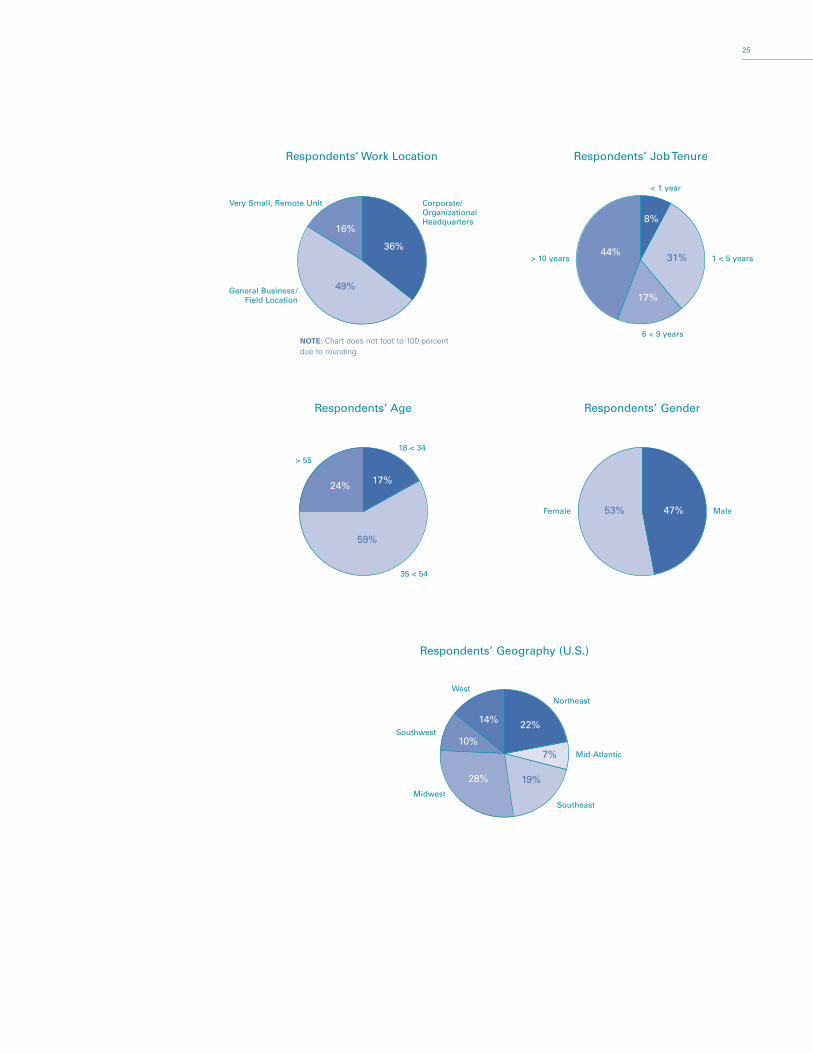
25
Respondents’ Age Respondents’ Gender
18 < 34
MaleFemale
> 55
35 < 54
Respondents’ Geography (U.S.)
Northeast
Mid-Atlantic
Southeast
Southwest
West
Midwest
Respondents’ Work Location Respondents’ Job Tenure
Corporate/OrganizationalHeadquarters
1 < 5 years
6 < 9 years
> 10 years
< 1 year
Very Small, Remote Unit
General Business/Field Location
16%8%
44%
17%
31%36%
49%
59%
53% 47%
22%14%
10%
28% 19%
7%
24% 17%
NOTE: Chart does not foot to 100 percent due to rounding.
FREQUENTLY ASKED QUESTIONS
How can I determine if employees from a particular company were among the participants
in the survey?
This was a blind survey. KPMG was not identified to the participants as being associated
with the survey, and neither the names of participants nor the names of their employers were
provided to KPMG.
How were participants for the survey selected?
A panel database firm was retained to identify participants who (1) were U.S. working adults,
(2) worked for organizations that employed at least 200 people, and (3) worked for organizations
in one of 11 broad industry sectors identified by KPMG.
Would it be correct to say that the results of this survey are reflective of the overall
U.S. population?
No, this survey was not designed to mirror the demographics of the U.S. workforce. For
example, employees in our sample population work for organizations that employ at least
200 individuals (33 percent of respondents reported that they work for organizations with
more than 5,000 employees). On average, most employees in the United States work for
organizations that employ fewer people.
Does KPMG make its questionnaire and other detailed data publicly available?
Not typically. All questions and data associated with this survey are proprietary to KPMG.
While it is our practice to share high-level results of our survey publicly, additional questions
and benchmark data are typically shared only with KPMG clients who have specifically
contracted for their use. We do occasionally share information with certain institutions for
authorized academic research purposes.
About KPMG Forensic
KPMG ForensicSM is a global practice comprising multidisciplinary professionals from KPMG member firmswho can assist clients in their efforts to achieve the highest levels of business integrity through the prevention,detection, and investigation of fraud and misconduct. This practice not only helps clients discover the factsunderlying concerns about fraud and misconduct but also assists clients in assessing their vulnerabilities to such activities, and in developing controls and programs to address these risks.
KPMG Forensic uses computer forensic and data analysis techniques to help clients detect fraudulent activity andother forms of misconduct. In addition, KPMG LLP, the U.S. member firm, operates the Cypress TechnologyCenter (CTEC), which offers sophisticated technology tools and skilled professionals to help clients reduce litiga-tion costs and risks in the areas of evidence and discovery management and the acquisition, management, andanalysis of large data sets.
Professionals in the KPMG Forensic practice draw on extensive experience in forensic accounting, law and regulatory enforcement, fraud and misconduct risk assessment, antifraud risk controls, program design andimplementation, asset tracing, computer forensics, and forensic data analysis.
With professionals from the Americas, Asia Pacific, and Europe to the Middle East and Africa, KPMG Forensicis well positioned to provide a high level of consistent service to global clients. It can readily assemble multina-tional teams comprising members who have shared methodologies, demonstrated technical skills, and deepindustry knowledge.
Service offerings are subject to legal and regulatory restrictions. Some services may not be available to KPMG’sfinancial statement audit or other attest service clients.
26
© 2
005
KP
MG
LLP
, the
U.S
. mem
ber
firm
of
KP
MG
Inte
rnat
iona
l, a
Swis
s co
oper
ativ
e. A
ll rig
hts
rese
rved
. Prin
ted
in t
he U
.S.A
. 050
362
KP
MG
and
the
KP
MG
logo
are
reg
iste
red
trad
emar
ks o
f K
PM
G In
tern
atio
nal.
KP
MG
For
ensi
c is
a s
ervi
ce m
ark
of K
PM
G In
tern
atio
nal.
For more information, please call the Forensic Hotline at 1-877-679-KPMG (5764) or
visit our Web site at www.us.kpmg.com under Audit & Risk Advisory Services.
ACKNOWLEDGEMENTS
Major KPMG Contributors
Scott Avelino Lead Author
Rich Girgenti
Tim Hedley
Chuck Riepenhoff
Seth Cohen
Ori Ben-Chorin
Laura Durkin
Muel Kaptein
Daniel Malan
Dean Newlan
Michael Wang
K. Marshall Bain
Lynda Leavitt
Lilanthi Alahendra
Robert Wade
Duane Coda
Special ThanksWithout implying their endorsement, KPMG wishesto thank the following individuals and organizationsfor their assistance in producing this survey:
Chris Woolard Walker Information
Jeff MarrWalker Information
Josef HorvathWalker Information
Steve ValigoskyNational Family Opinion