kpmg's guide to international business location … identification of the key...
TRANSCRIPT

Competitive AlternativesKPMG’s Guide to International
Business Location Costs
Volume II Report—2012 Edition
competitivealternatives.com
Corporate Sponsors

KPMG LLP, in association with MMK Consulting Inc., has conducted an analysis of the relative
costs of doing business in 14 countries in the Americas, Europe, and Asia Pacific. This report
was made possible through the support of our research contributors and sponsors, as
identified in this report.
The analysis in this publication is based on cost information collected primarily between July
2011 and January 2012. Taxes reflect tax rates in effect on January 1, 2012, and also
incorporate any announced changes at that time to take effect at specified later dates.
Exchange rates and other cost factors will, of course, change over time. Tax rates and other
tax-related information are also subject to change as a result of new legislation, judicial
decisions, and administrative pronouncements.
All information provided is of a general nature and is not intended to address the
circumstances of any particular individual or entity. Although we endeavor to provide
accurate and timely information, there can be no guarantee that such information is
accurate as of the date it is received or that it will continue to be accurate in the future.
No one should act upon such information without appropriate professional advice after
a thorough examination of the particular situation.
© 2012 MMK Consulting Inc. All rights reserved.
No part of this publication may be reproduced, reprinted, stored in a retrieval system, or
transmitted, in part or whole, in any form or by any means, electronic, mechanical,
photocopying, recording, or otherwise, without the prior written permission of the authors.
Electronic copies of this report, as well as additional information in respect of this report, are
available at www.CompetitiveAlternatives.com.

Competitive Alternatives
KPMG’s Guide to
International Business Location Costs
2012 Edition
Volume II: Appendices

Appendices
A. Details of Study Methodology...................................................................... A.1 to A.4 Discusses the study methodology and
key business model assumptions underlying
the analysis contained in this report.
B. Tax Assumptions and Comparisons ........................................................... B.1 to B.24 Presents the tax rate assumptions used for each location
in the comparative analysis, along with summary measures
of tax burden resulting from the analysis.
C. Other Competitiveness Factors: Regional Data and Data Source Notes .............................................................................. C.1 to C.10
Contains a detailed regional and local data, along with detailed
data source notes to support the analysis of other competitiveness
factors presented in Chapter 6 of the study report.
D. Selected Bibliography and Sources of Data ............................................... D.1 to D.15 Contains a listing of sources used in respect of
each city to gather recent data for input to this study.

www.competitivealternatives.com A.1
Appendix A Details of Study Methodology The value of any major study depends on the quality of the study design, the data assembled, and the analytical methodology. This appendix provides further details of the methodology of the Competitive Alternatives study, including: Design of the CompetitiveAlternatives.com Cost Model Identification of the key location-sensitive cost components Definition of the standard business operations Specification of common business model assumptions Methodology for estimating labor costs Methodology for estimating transportation/distribution costs for each operation
Methodology for estimating taxes.
A. CompetitiveAlternatives.com Cost Model
This report utilizes the CompetitiveAlternatives.com Cost Model, which analyzes costs for businesses in many types of business operations across multiple geographic locations. The model uses two streams of information: Standardized operating specifications for each business operation
Current business investment and operating cost data for each location.
By combining this information for each operation and location, the model produces estimates of annual costs and cash flows for a new business facility in each location. Outputs from the Cost Model include standard financial and project evaluation reports including: ten-year income statements ten-year balance sheets ten-year cash flow statements net present value of cash flows corporate income tax calculations.
These reports form the basis of the cost comparisons contained in this report. The result is a snapshot of business costs in each location, scaled relative to the significance of each cost item during the establishment, ramp-up, and full operation phases, over ten years.
B. Key Location-sensitive Costs This study and the Cost Model differentiate among 26 location-sensitive cost components. Data for these location-sensitive cost factors, for each of the cities included in this study, were compiled during the latter half of 2011 and the start of 2012. The resulting database includes more than 50,000 individual cost items. Sources of data are listed in Appendix D. Other costs that a new business would encounter have been held constant for each location. These include: Major cost items, such as major machinery and raw materials, used in production. These costs are generally subject to global market pricing and are relatively location-insensitive. Parts and components where costs are fixed from other levels of the supply chain are treated in the same way.
Smaller cost items, such as advertising and business services, which are of very limited materiality for the types of business examined.
The scope of the Cost Model does not include an assessment of either withholding taxes or the taxation of individuals.
EXHIBIT A.1
Location-sensitive Cost Components
Labor costs • Salaries and wages
- 42 job positions • Statutory plans
- Government pension plans - Public medical plans - Unemployment insurance - Workers’ compensation
• Employer-sponsored benefits - Paid time not worked
(holidays and vacation) - Private health insurance - Other discretionary
benefits
Facility costs • Industrial land • Industrial construction • Industrial leasing • Office leasing
Transportation costs • Air freight • Surface freight (road & sea)
Utility costs • Electricity • Natural gas
Cost of capital • Financing costs (interest) • Depreciation charges
Taxes other than income • Capital • Property • Sales and transactions • Land transfer • Sundry local taxes
Income taxes • Federal • Regional (state, provincial) • Local

A.2 Competitive Alternatives: KPMG’s Guide to International Business Location Costs 2012 Edition
C. Standard Business Operations As described in Chapter 3, 19 standard business operations were specified for analysis in this report. Each of the 19 business operations has been defined according to a number of standard investment and operating specifications, including: land and building requirements machinery and equipment requirements inventory financing (debt and equity) and working capital requirements annual sales revenues workforce requirements raw material inputs research and development expenditures electricity and natural gas requirements product distribution requirements.
Summaries of the standardized parameters for each of the 19 operations are presented in Chapter 3.
D. Business Model Assumptions
1. Common Assumptions: Startup Phase
All figures are shown in current US dollars, unless another currency is specified.
For each type of facility, the following items are assumed to be identical in each location:
- physical requirements for buildings and land - investment in core machinery and equipment (investments
in non-core equipment are constant for all mature markets, and lower in all high growth markets as noted in Chapter 1)
- working capital requirements, including inventory levels - cost of equity capital - debt-to-equity ratio at start-up.
Expenditures for land (if any) occur in Year 0. Real estate transfer taxes are capitalized in the cost of land.
Four depreciable asset classes are recognized: buildings, machinery and equipment, office equipment, and R&D equipment. Major initial investments in all asset classes are made in Year 0.
An initial investment in inventory is made in Year 0. Average inventory levels are assumed to remain steady over the 10-year period.
The initial investment is partially financed with debt. Debt servicing costs are treated as expenses in the year incurred. No net principal payments are assumed during the 10-year period, so the level of debt remains constant.
2. Common Assumptions: Operating Phase
All figures are shown in current US dollars, unless another currency is specified.
There is a ramp-up period of up to three years before operations reach full capacity.
For each type of facility, the following items are assumed to be identical in each location:
- volume of output - staffing requirements (for mature markets only, higher
staffing levels are assumed in high growth markets to allow for productivity differentials, as noted in Chapter 1)
- industrial and/or office leasing requirements - electricity and natural gas requirements - research and development activities - cost of equity capital.
All of the firm’s business income is related to operations. For profit center operations, sales revenue is held constant for all locations. For cost center operations, revenue is determined using a “cost-plus” markup approach; with the markup percentage held constant for all locations.
All revenues earned and expenses incurred in a given period are collected and paid in the same period.
Net cash flow from operations is added to cash on the balance sheet.
Additional capital expenditures for retooling are undertaken as required by the type of business operation.
Costs for materials and other location-insensitive costs are based on a predetermined percentage of sales, split between direct and indirect costs in accordance with general accounting principles. These percentages vary with the business type. For cost center operations, where revenue is a function of costs, location-insensitive costs are fixed in US$ per annum for all locations.
The firm is a start-up, stand-alone, limited company. For the purposes of apportionment of taxable income in North America, the firm is assumed to be eligible to apportion income among states, but not to maintain a substantial portion of its physical business operations in any location other than the location being examined. The firm is also assumed not to be subject to a material level of taxation in any jurisdiction other than its main location.
For North American operations, the company does not qualify as an S-Corporation in the United States or a Canadian-Controlled Private Corporation in Canada, and does not receive the preferential tax treatment accorded to those categories of company.
For the purposes of net present value calculations, at the end of Year 10, residual value is measured as:
- current assets (including inventory), at cost; plus - land, at historical cost; plus - buildings, at depreciated historical cost; less - all liabilities at face value.

www.competitivealternatives.com A.3
Machinery and equipment are assumed to have zero scrap value, and no taxable capital gains are realized on the sale of capital assets.
Calculations over the 10 years of operation are made on the basis of current (2011-12) price levels, exchange rates, tax structures, and cost factors, except:
- For high growth markets, wage rates used in the analysis have been adjusted to reflect expected levels of wage inflation in each country, to the extent this exceeds the average level of wage inflation in the mature markets. It has been assumed that current levels of wage inflation in the high growth markets will decline to levels equal to the mature markets over a period of 10 years.
- Where future tax changes have been announced, such future tax changes are reflected in the calculations.
E. Labor Costs To estimate annual labor costs for each facility, employees from different industries and operations have been grouped into a range of generic job positions, based on common levels of skill and responsibility. This approach reflects the nature of data available from different wage surveys, and the number of positions that can be comparably costed across a wide range of locations. By grouping employees into generic positions, the diversity of salary levels that would be encountered in a typical operation has been built into the calculation of annual labor costs. This study uses 42 generic job positions: eight management positions eight production positions five scientific/technical positions ten information technology positions nine sales and administrative positions two facility maintenance positions.
Based on individual job descriptions, typical salary and wage levels have been collected for each position in each city studied. Statutory and employer-sponsored benefits have also been calculated individually, according to the average pay for each job. For discussion of labor cost issues specific to the high growth markets, refer to Chapter 1.
F. Facilities Costs Facility requirements have been developed based on actual firm data during the process of defining the standard operating parameters for each business operation: For manufacturing operations, facility costs include the cost of leasing a suitable modern industrial facility in a suburban area
For service operations, facilities costs include the cost of leasing suitable Class A office space, generally in a suburban area for most business operations but in a downtown location for the International Financial Services operation.
Costs for land purchase and building construction , and lease capitalization rates are used in some instances to refine values for industrial leasing and property valuation for local tax purposes. Costs for land purchase, building construction, industrial leasing, and/or office leasing were collected by Colliers International real estate professionals in each local market.
G. Transportation/Distribution Costs A product distribution pattern has been developed for each relevant operation reflecting the characteristics of, and markets for, the goods produced. Product distribution has been based on global, continental, national, or regional markets. Overseas exports are assumed to be transported by sea freight, except in the case of higher value products with shorter life cycles, in which case air freight may be used.
1. Food Processing Operation
In developing the product distribution model for the food processing industry, the tendency for food product markets to be somewhat country-specific due to different taste preferences among regions has been considered. As a result, this model assumes that 50 percent of product is sold to distributors in the region in which it is produced, with the remainder being distributed to global markets.
2. Advanced Batteries, Auto Parts, Metal Machining, Plastic Products, and Precision Components Operations
Plants manufacturing advanced battery systems, auto parts, metal components, plastic products, and precision components are generally producing for industrial customers who will use these components in further value-added manufacturing. Production of such components have become increasingly globalized over the last decade, but still with a tendency for producers to locate close to one or more of their major customers. In the distribution models for these operations, output is assumed to be distributed to customers globally. Global sales are weighed using Gross Fixed Capital Formation as a proxy for industrial capacity and demand in each country. To allow for the local presence of major customers, this measure is double-weighted on favor of the region of production.

A.4 Competitive Alternatives: KPMG’s Guide to International Business Location Costs 2012 Edition
3. Electronics Assembly, Medical Devices, Pharmaceuticals, Specialty Chemicals, and Telecom Equipment Operations
Markets for these products tend to be continent-wide, as a minimum, with many firms selling on a global basis In the distribution models for these operations, output is assumed to be distributed to customers globally. Global sales are weighted by a combination of population (to reflect personal consumption demand) and Gross Fixed Capital Formation (to reflect industrial consumption demand). To allow for the local presence of major customers, this measure is double-weighted in favor of the region of production.
4. Aircraft Parts Operation
Markets for these products tend to be focused on the regions surrounding major aircraft assembly plants, such as the North American Boeing plants in Seattle and Wichita, and Bombardier plants in Montreal; the European Airbus plants in Toulouse, Hamburg, and Broughton; and the Brazilian Embraer plants near Sao Paulo. Distribution for aircraft parts is assumed to occur on the following basis: 60 percent to major aircraft assembly plants in Europe (25 percent), North America (25 percent), and South America (10 percent)
40 percent exported equally among eight broad global regions, as parts used by maintenance, repair and overall operations.
7. Other Operations
The remaining operations are all services operations and have no physical product distribution requirements: Biomedical R&D Clinical trials management Electronics systems testing International financial services Shared services center Software development Video game production.
8. General Product Distribution Assumptions
The following general assumptions apply to each of the product distribution patterns outlined above: The model firms do not have any in-house distribution capability, so all freight movements are handled by third-party logistics providers
Each firm is able to maximize the efficiency of its distribution patterns, delivering product to its customers in full truckload and/or container-load quantities, or as standardized less-than-load shipments
The model firms are not selling to customers requiring just-in-time (JIT) or just-in-order (JIO) deliveries
Intra-continental distribution is by road and/or rail freight (based on the most economical option), except where the use of sea freight is required between countries in Asia (e.g. between Japan and mainland Asia).
H. Energy Costs Energy requirements have been developed based on actual firm and industry average data during the process of defining the standard operating parameters for each business operation. For manufacturing operations, both electricity and natural gas requirements have been considered. For service operations, where energy requirements are far less significant, only electricity requirements have been considered. Based on the identified energy requirements, costs were calculated based on published schedule rates of relevant energy suppliers or reported statistical rate data for industrial and commercial users, as available in each location.
I. Taxation Costs Refer to Appendix B for details of taxation methodology.
J. Interpretation of Results While great care has been taken in performing this analysis and developing the findings, the resulting comparisons are of a general nature. All cost factors examined in this study are subject to change over time, due to changes in local laws, regulations, and/or market conditions. The results of this study should not be interpreted as a definitive or final opinion on the merits of locating any specific facility in one jurisdiction over another. Further analysis is required to determine the best site for a specific facility or operation.

www.competitivealternatives.com B.1
Appendix B Tax Assumptions and Comparisons This appendix presents the tax rate assumptions used in the comparative analysis, along with summary measures of tax burden resulting from the analysis. In this study, income taxes have been calculated on the “tax payable” basis. Deferred income tax balances (both positive and negative) have been excluded, since these accounting book entries are generally not relevant for location decision making. All tax rates listed here are current as at January 1, 2012, based on latest information available as at that date. Taxes are grouped based on substance rather than legal form, and legislated names of specific taxes in certain jurisdictions differ from the generic titles used in this study. Given the broad scope of this assignment, a number of simplifying assumptions have been made with respect to specific taxes. Any simplifying assumptions made are consistent with the business model assumptions set out in Appendix A. Payroll taxes have been incorporated into statutory benefit costs shown in this report, but are not presented in this table. These data should not be used to draw definitive conclusions regarding the relative position of any particular jurisdiction with respect to a particular element of taxation. In all circumstances, professional advice should be sought to address any specific taxation issues in any jurisdiction.

B.2 C
EXH
Fede
Corpor
Federa
Region
Local
Combi
Manuf
Fede
Regi
Combi
Effecti
19-ope
Capita
Tax ba
Capit
Net e
Tota
Debt
Sales T
Refun
Fede
Regi
Non-r
Regi
Loca
Proper
Land
Build
Mac
Inven
Total p
12-o
7-op
Local B
Taxes
Gros
Salar
Emp
Competitive Alterna
HIBIT B.6: CANAD
eral, regional, an
rate Income Tax a
al
nal
ined income tax rat
facturing tax rate re
eral
onal
ined manufacturing
ive income tax rate
eration average c
l Tax d
ased on:
tal stock
equity
l assets
t/borrowings
Tax e
dable GST/VAT
eral f
onal f
refundable sales tax
onal f
al f
rty Tax g
d h
dings h
hinery & equipmen
ntory j
property-based taxe
operation (mfg) ave
peration (non-mfg) a
Business Taxes
based on:
ss receipts l
ries m
ployees n
atives: KPMG’s Gu
DA
nd local tax rate
CalgAB
15.0
10.0
–
te 25.0
eduction b
–
–
g tax rate 25.0
e,
11.7
–
–
–
5.0
–
x
–
–
2.35
2.35
nt i –
–
es: k
erage $3.2
average $2.9
–
–
–
ide to International
es – In percent
gary B
CharlottetoPE
00 15.00
00 16.00
–
00 31.00
–
–
00 31.00
71 16.72
–
–
–
0 5.00
–
10.00t
–
5u 2.49
5u 2.49
–
–
29 $2.65v
94 –
–
–
–
Business Location
wn Edmonton AB
F
15.00
10.00
–
25.00
–
–
25.00
12.63
–
–
–
5.00
–
–
–
1.15
1.15
–
–
$1.61
–
–
–
–
n Costs 2012 Ed
redericton NB
HalifaNS
15.00 15.00
10.00 16.00
– –
25.00 31.00
– –
– –
25.00 31.00
8.75 13.81
– –
– 0.050
– –
13.00q 15.0
– –
– –
4.34 3.79
4.34 3.79
– –
– –
$5.22 $4.81
– –
– –
– –
– –
ition
ax
Moncton NB
Mo
0 15.00 1
0 10.00 1
–
0 25.00 2
–
–
0 25.00 2
1 8.95 9
–
0 –
–
00q 13.00q 5
9
–
–
9 4.67 3
9 4.67 3
–
–
1 $5.07 $
–
–
–
–
ontreal QC
Prince George
BC
5.00 15.00
1.90 10.00
– –
6.90 25.00
– –
– –
6.90 25.00
9.48 11.88
– –
– –
– –
5.00 12.00q,s
9.50r
– –
– –
3.76 3.78
3.76 3.78
– –
– –
4.70 $4.20v
– –
– –
– –
– –
Quebec City QC
SaskS
15.00 15
11.90 12
– –
26.90 27
– –
– 2.
26.90 25
9.48 7.
– –
– –
– –
5.00 5.
9.50r –
– 5.
– –
4.07 1.
4.07 1.
–
–
$4.80 $2
– –
– –
– –
– –
katoon SK
St. John’sNL
5.00 15.00
2.00 14.00
– –
7.00 29.00
– –
00 9.00
5.00 20.00
94 5.19
– –
– –
– –
00 13.00q
–
00 –
– –
78 3.04u
78 3.04u
– –
– –
2.34 $4.34
– –
– –
– –
– –
s

ToroO
15
11.
–
26
1.
25
11
–
–
13
–
–
2.
2.
$3
–
–
–
–
onto ON
Trois-Rivières
QC
5.00 15.00
.50o 11.90
– –
6.50 26.90
– –
50o –
5.00 26.90
.77 7.71
– –
– –
– –
– –
3.00q 5.00
9.50r
– –
– –
60 3.55
60 3.55
– –
– –
3.95 $3.93
– –
– –
– –
– –
Vancouver
BC W
15.00
10.00
–
25.00
–
–
25.00
12.75
–
–
–
–
12.00q,s
7.00
–
1.88
1.88
–
–
$2.51v
–
–
–
–
Windsor-Essex
ON
WinnipMB
15.00 15.00
11.50o 12.00
– –
26.50 27.00
– –
1.50o –
25.00 27.00
11.28 6.11
– –
– –
– –
– –
13.00q 5.00
–
– 7.00
– –
3.83 3.35u
3.83 3.35u
– –
– –
$4.27 $3.85
– $1.58
– –
– –
– –
peg
a Percentaeach jurientity ex
b Manufaccompany
c The 19-oincome ttax credi
d Percentageneral t
e Percenta
f General
g The Propcomponeareas ideoperation
h Percentaprice equ
i Percenta
j Percenta
k Total pro
l Percenta
m Percenta
n Tax per e
o Ontario gTax rate
p Nova ScWhere tastandardCDN $10exemptio
q Harmoniprovincia
r Quebec 9.975%.the fede
s The 12%GST and
t Prince Etax rate i
u Incorpora
v This studbusiness
0
0
0
0
0
0
u u
5
8
age of taxable incomisdiction are not indxamined in this stud
cturing tax rate reduy’s payroll or capita
operation average etax rates in each loits.
age of taxable capittax base indicated
age of sales price.
rate. Other rates m
perty Tax category ent of multi-base loentified in the real en being examined.
age of current markualization and renta
age of depreciated
age of cost.
operty-based taxes
age of gross sales.
age of gross payrol
employee.
general tax rate is s reduction for manu
otia Capital Tax appaxable capital is les
d rate based on taxa0 million, tax is calcon. This tax is sche
ized single sales taxal component that v
sales tax applies toOn January 1, 201ral GST.
% harmonized salesd a 7% non-recover
Edward Island sales is 10.5%.
rates both property
dy incorporates theses.
Fo
me. Minor adjustmdividually discloseddy. Many jurisdictio
ductions reduce on al assets are not de
effective income taocation due to the im
tal, determined on here is subject to m
may apply to specif
includes all properocal business taxesestate research for
ket value, incorporaal yields (estimated
value.
in US $ per square
ll.
scheduled to decreufacturing will decr
plies once taxable ss than CDN $10 mable capital in exceculated at the standeduled to be elimin
ax applies at the rat varies by province.
o the sale price plu3 the tax rate will c
s tax currently applrable provincial sale
s tax applies to the
y tax and property-b
e impact of a partia
ww
ootnotes
ments required in thd. Tax rates shown ons offer lower inc
a pro-rata basis whevoted to manufact
ax rates for this stumpact of adjustme
the general basis iminor adjustment.
fied articles.
rty-based taxes, incs. Property tax rater this study as offer
ating current tax rad where required).
e foot of building sp
ease to 11% on Julrease to 1% on Jul
capital exceeds CDmillion (US $9.8 milless of CDN $5 millidard rate of 0.05%
nated on July 1 201
te indicated, includi
us the 5% federal Gchange to 9.975%
licable in British Coes tax on April 1, 20
sale price plus the
based business/occ
al property tax exem
ww.competitivealte
he calculation of tax in this exhibit are fome tax rates for s
here a significant coturing or processin
udy vary from the cents to taxable inco
indicated. In many j
cluding the propertyes relate to the subring sites suitable f
ates, assessment fa
pace.
ly 1 2012, and 10%ly 1 2012, and 0%
DN $5 million (US $lion), tax is calculation. Once taxable c of all taxable capit
12.
ing a 5% federal co
GST, so the effectiv but will no longer a
olumbia will revert t013.
5% federal GST, s
cupancy tax rates.
mption for manufac
ernatives.com B.
xable income in for the size of small businesses.
omponent of a g operations.
ombined nominal ome and income
jurisdictions, the
y-based urban or urban for the types of
actors, base-year
% on July 1 2013. on July 1 2013.
$4.9 million). ted at double the capital exceeds tal, with no base
omponent and a
ve tax rate is apply on top of
to a 5% federal
so the effective
cturing
3

B.4 Competitive Alternatives: KPMG’s Guide to International Business Location Costs 2012 Edition
EXHIBIT B.7: UNITED STATES
Federal, regional, and local tax rates – In percent Albuquerque
NM Anchorage
AK Atlanta
GA Austin
TX Baltimore
MD Bangor
ME Baton Rouge
LA
Beaumont TX
Billings MT
Boise ID
Boston MA
Buffalo NY
Burlington VT
Corporate Income Tax a
Federal 34.00o 34.00o 34.00o 34.00o 34.00o 34.00o 34.00o 34.00o 34.00o 34.00o 34.00o 34.00o 34.00o
Regional 7.60s 9.40s 6.00q 1.00q,v 8.25q 8.93q,s 8.00q,s 1.00q,v 6.75 7.60 8.00 7.10q,r 8.50s
Local – – – – – – – – – – – – –
Combined income tax rate 38.44z,aa 40.20z 37.60z,aa 34.66z 39.45z 39.89z 36.56z,ad 34.66z 38.46z 39.02z 39.28z 38.69z 39.61z
Manufacturing tax rate reduction b
Federal 2.85p 2.77p 3.06p 3.06p 3.06p 3.06p 2.82p 3.06p 2.85p 2.83p 3.06p 3.06p 2.80p
Regional 0.63p 0.85p – – – – 0.72p – 0.61p 0.68p – 0.60bc 0.77p
Combined manufacturing tax rate 34.96 36.59 34.54 31.60 36.39 36.83 33.02 31.60 34.99 35.50 36.22 35.03 36.05
Effective income tax rate,
19-operation average c 25.71 40.20ae 24.77 27.56 27.64 30.00 20.63 27.48 31.39 29.86 28.32 28.13 28.57
Capital Tax d
Tax based on:
Capital stock – – – – – – – – – – – – –
Net equity – – 0.030af – – – – – – – – 0.150r –
Total assets – – – – – – 0.300ap – – – 0.260ag – –
Debt/borrowings – – – – – – – – – – – – –
Sales Tax e
Refundable GST/VAT
Federal f – – – – – – – – – – – – –
Regional f – – – – – – – – – – – – –
Non-refundable sales tax
Regional f 5.13 – 4.00 6.25 6.00 5.00 4.00 6.25 – 6.00 6.25 4.00 6.00
Local f 1.88 – 2.75 2.00 – – 5.00 2.00 – – – 4.75 0.67
Property Tax g
Land h 1.73 1.55 1.34 2.35 1.52 1.92 1.07 2.63 1.30 1.88 2.69 3.87 1.78
Buildings h 1.73 1.55 1.34 2.35 1.52 1.92 1.60bk 2.63 1.30 1.88 2.69 3.87 1.78
Machinery & equipment i 1.73 1.55 1.34 2.35 3.40bq 1.92at 1.60bk 2.63 1.30 1.88 2.69ar – 1.78
Inventory j – 1.55 1.34bp 2.35bp – – 1.60br 2.63bp – – – – –
Total property-based taxes: k
12-operation (mfg) average $5.00 $6.18 $3.73 $6.52 $1.93 $1.86 $3.21 $7.11 $3.75 $5.41 $3.30 $4.00 $5.23
7-operation (non-mfg) average $0.88 $0.78 $0.68 $1.19 $1.19 $0.02 $0.81 $1.34 $0.66 $0.95 $1.37 – $0.90
Local Business Taxes
Taxes based on:
Gross receipts l – – – – – – – – – – – – –
Salaries m – – – – – – – – – – – – –
Employees n – – – – – – – – – – – – –

www.competitivealternatives.com B.5
Cedar Rapids
IA
Champaign- Urbana
IL
Charleston WV
Cheyenne WY
Chicago IL
Cincinnati OH
Cleveland OH
Dallas-Fort Worth
TX
Denver CO
Detroit MI
Fargo ND
Gulfport- Biloxi MS
Corporate Income Tax a
34.00o 34.00o 34.00o 34.00o 34.00o 34.00o 34.00o 34.00o 34.00o 34.00o 34.00o 34.00o Federal
12.00q,s 9.50t 7.75bh – 9.50t – – 1.00q,v 4.63 6.00q,w 5.15s 5.00s Regional
– – – – – 1.50bo 2.00 – – –bo – – Local
39.88z,ab 40.27z 39.12z 34.00 40.27z 34.99z 35.32z 34.66z 37.06z 37.96z 37.40z 37.30z Combined income tax rate
Manufacturing tax rate reduction b
2.69p 3.06p 3.06p 3.06p 2.77p 3.06p 3.06p 3.06p 2.92p 3.06p 3.06p 3.06p Federal
1.08p – – – 0.86p – – – 0.42p – – – Regional
36.11 37.21 36.06 30.94 36.65 31.93 32.26 31.60 33.72 34.90 34.34 34.24 Combined manufacturing tax rate
26.90 31.33 28.51 27.74 29.81 28.38 28.19 27.74 28.52 26.38 29.64 29.65
Effective income tax rate,
19-operation average c
Capital Tax d
Tax based on:
– 0.100ah – – 0.100ah – – – – – – – Capital Stock
– – 0.270bi – – – – – – – – – Net equity
– – – 0.020 – – – – – – – 0.250 Total assets
– – – – – – – – – – – – Debt/borrowings
Sales Tax e
Refundable GST/VAT
– – – – – – – – – – – – Federal f
– – – – – – – – – – – – Regional f
Non-refundable sales tax
6.00 6.25 6.00 4.00 6.25 5.50 5.50 6.25 2.90 6.00 5.00 7.00 Regional f
1.00 2.50 – 2.00 2.06 1.00 2.25 1.97 4.82 – 2.50 – Local f
Property Tax g
4.04 2.55 1.76 0.84 2.58 2.45 3.19 2.78 1.93 2.94 1.77 1.79 Land h
4.04 2.55 1.76 0.84 2.58 2.45 3.19 2.78 1.93 2.94 1.77 1.79 Buildings h
– – 1.76 0.84 – – – 2.78 1.93 2.40bj – 1.79 Machinery & equipment i
– – 1.76 – – – – 2.78bp – – – 1.79bs Inventory j
Total property-based taxes: k
$3.71 $2.50 $5.92 $2.44 $3.13 $2.06 $3.12 $7.82 $5.66 $6.85 $1.67 $5.93 12-operation (mfg) average
– – $0.90 $0.43 – – – $1.42 $0.98 $1.22 – $0.91 7-operation (non-mfg) average k
Local Business Taxes
Taxes based on:
– – 1.00ax – – 0.26u 0.26u – – – – – Gross receipts l
– – – – – – – – – – – – Salaries m
– – – – – – – – – – – – Employees n

B.6 Competitive Alternatives: KPMG’s Guide to International Business Location Costs 2012 Edition
EXHIBIT B.7: UNITED STATES (CONTINUED)
Federal, regional, and local tax rates – In percent Hartford
CT Honolulu
HI Houston
TX Indianapolis
IN Jackson
MS Las
Vegas NV
Lexington KY
Little Rock AR
Los Angeles CA
Madison WI
Manchester NH
Miami FL
Corporate Income Tax a
Federal 34.00o 34.00o 34.00o 34.00o 34.00o 34.00o 34.00o 34.00o 34.00o 34.00o 34.00o 34.00o
Regional 9.00q,x 6.40s 1.00q,v 8.50w 5.00s – 6.00q,s 6.50s 8.84 7.90q 8.50 5.50q,s
Local – – – – – – 2.75 – – – – –
Combined income tax rate 39.94z 38.22z 34.66z 39.61z 37.30z 34.00 39.78z 38.29z 39.83z 39.21z 39.61z 37.63z
Manufacturing tax rate reduction b
Federal 3.06p 3.06p 3.06p 3.06p 3.06p 3.06p 2.88p 3.06p 3.06p 3.06p 3.06p 2.89p
Regional – – – – – – 0.54p – – – – 0.50p
Combined manufacturing tax rate 36.88 35.16 31.60 36.55 34.24 30.94 36.36 35.23 36.77 36.15 36.55 34.24
Effective income tax rate,
19-operation average c 24.29 37.30ae 27.32 29.16 29.09 26.59 31.13 29.20 29.76 29.82 31.48 26.66
Capital Tax d
Tax based on:
Capital stock 0.310x – – – – – – 0.300 – – – –
Net equity – – – – – – – – – – – –
Total assets – – – – 0.250 – – – – – – –
Debt/borrowings – – – – – – – – – – – –
Sales Tax e
Refundable GST/VAT
Federal f – – – – – – – – – – – –
Regional f – – – – – – – – – – – –
Non-refundable sales tax
Regional f 6.35 4.00 6.25 7.00 7.00 6.85 6.00 6.00 7.25 5.00 – 6.00
Local f – 0.50 1.69 – – 1.25 – 1.50 1.50 0.50 – 1.00
Property Tax g
Land h 1.75 1.24 2.70 2.42av 2.51 1.17 1.04 1.35 1.33 2.15 2.62 2.15
Buildings h 1.75 1.24 2.70 2.42av 2.51 1.17 1.04 1.35 1.33 2.15 2.62 2.15
Machinery & equipment i 1.75as – 2.70 2.42av 2.51 1.17 0.15 1.35 1.33 – – 2.15
Inventory j – – 2.70bp – 2.51bs – 0.42 1.35 – – – –
Total property-based taxes: k
12-operation (mfg) average $3.52 $2.38 $7.57 $4.59 $8.30 $3.23 $1.49 $4.53 $4.46 $2.23 $2.61 $6.28
7-operation (non-mfg) average $0.89 – $1.37 $1.03 $1.27 $0.60 $0.07 $0.69 $0.68 – – $1.09
Local Business Taxes
Taxes based on:
Gross receipts l – – – – – – – – – – – –
Salaries m – – – – – 1.05 – – – – 0.75bg –
Employees n – – – – – – – – – – – 4.50ac
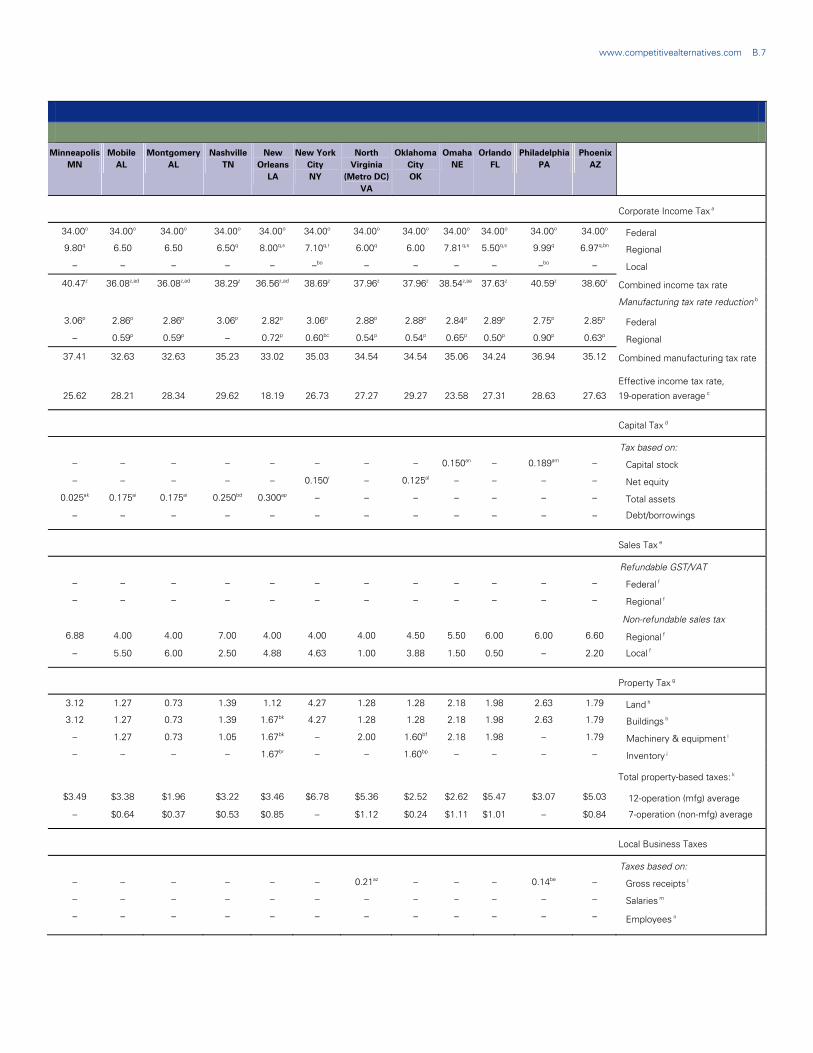
www.competitivealternatives.com B.7
Minneapolis
MN Mobile
AL Montgomery
AL Nashville
TN New
Orleans LA
New York City NY
North Virginia
(Metro DC) VA
Oklahoma City OK
Omaha NE
Orlando FL
Philadelphia PA
Phoenix AZ
Corporate Income Tax a
34.00o 34.00o 34.00o 34.00o 34.00o 34.00o 34.00o 34.00o 34.00o 34.00o 34.00o 34.00o Federal
9.80q 6.50 6.50 6.50q 8.00q,s 7.10q,r 6.00q 6.00 7.81q,s 5.50q,s 9.99q 6.97q,bn Regional
– – – – – –bo – – – – –bo – Local
40.47z 36.08z,ad 36.08z,ad 38.29z 36.56z,ad 38.69z 37.96z 37.96z 38.54z,aa 37.63z 40.59z 38.60z Combined income tax rate
Manufacturing tax rate reduction b
3.06p 2.86p 2.86p 3.06p 2.82p 3.06p 2.88p 2.88p 2.84p 2.89p 2.75p 2.85p Federal
– 0.59p 0.59p – 0.72p 0.60bc 0.54p 0.54p 0.65p 0.50p 0.90p 0.63p Regional
37.41 32.63 32.63 35.23 33.02 35.03 34.54 34.54 35.06 34.24 36.94 35.12 Combined manufacturing tax rate
25.62 28.21 28.34 29.62 18.19 26.73 27.27 29.27 23.58 27.31 28.63 27.63
Effective income tax rate,
19-operation average c
Capital Tax d
Tax based on:
– – – – – – – – 0.150an – 0.189am – Capital stock
– – – – – 0.150r – 0.125al – – – – Net equity
0.025ak 0.175ai 0.175ai 0.250bd 0.300ap – – – – – – – Total assets
– – – – – – – – – – – – Debt/borrowings
Sales Tax e
Refundable GST/VAT
– – – – – – – – – – – – Federal f
– – – – – – – – – – – – Regional f
Non-refundable sales tax
6.88 4.00 4.00 7.00 4.00 4.00 4.00 4.50 5.50 6.00 6.00 6.60 Regional f
– 5.50 6.00 2.50 4.88 4.63 1.00 3.88 1.50 0.50 – 2.20 Local f
Property Tax g
3.12 1.27 0.73 1.39 1.12 4.27 1.28 1.28 2.18 1.98 2.63 1.79 Land h
3.12 1.27 0.73 1.39 1.67bk 4.27 1.28 1.28 2.18 1.98 2.63 1.79 Buildings h
– 1.27 0.73 1.05 1.67bk – 2.00 1.60bf 2.18 1.98 – 1.79 Machinery & equipment i
– – – – 1.67br – – 1.60bp – – – – Inventory j
Total property-based taxes: k
$3.49 $3.38 $1.96 $3.22 $3.46 $6.78 $5.36 $2.52 $2.62 $5.47 $3.07 $5.03 12-operation (mfg) average
– $0.64 $0.37 $0.53 $0.85 – $1.12 $0.24 $1.11 $1.01 – $0.84 7-operation (non-mfg) average
Local Business Taxes
Taxes based on:
– – – – – – 0.21az – – – 0.14be – Gross receipts l
– – – – – – – – – – – – Salaries m
– – – – – – – – – – – – Employees n

B.8 Competitive Alternatives: KPMG’s Guide to International Business Location Costs 2012 Edition
EXHIBIT B.7: UNITED STATES (CONTINUED)
Federal, regional, and local tax rates – In percent Pittsburgh
PA Portland
OR Providence
RI Raleigh
NC Riverside-
San Bernardino
CA
Sacramento CA
Saginaw MI
Salem OR
Salt Lake City UT
San Diego
CA
San Francisco
CA
Corporate Income Tax a
Federal 34.00o 34.00o 34.00o 34.00o 34.00o 34.00o 34.00o 34.00o 34.00o 34.00o 34.00o
Regional 9.99q 7.60s,aj 9.00y 6.90q 8.84 8.84 6.00q,w 7.60s,aj 5.00 8.84 8.84
Local – 1.45bo – – – – –bo – – – –
Combined income tax rate 40.59z 39.97z 39.94z 38.55z 39.83z 39.83z 37.96z 39.02z 37.30z 39.83z 39.83z
Manufacturing tax rate reduction b
Federal 2.75p 3.06p 2.78p 3.06p 3.06p 3.06p 3.06p 3.06p 2.91p 3.06p 3.06p
Regional 0.90p – 0.81p – – – – – 0.45p – –
Combined manufacturing tax rate 36.94 36.91 36.35 35.49 36.77 36.77 34.90 35.96 33.94 36.77 36.77
Effective income tax rate,
19-operation average c 29.31 31.64 26.21 28.95 30.97 30.44 26.86 31.12 28.57 30.07 30.29
Capital Tax d
Tax based on:
Capital stock 0.189am – 0.025y – – – – – – – –
Net equity – – – – – – – – – – –
Total assets – – – 0.150bd – – – – – – –
Debt/borrowings – – – – – – – – – – –
Sales Tax e
Refundable GST/VAT
Federal f – – – – – – – – – – –
Regional f – – – – – – – – – – –
Non-refundable sales tax
Regional f 6.00 – 7.00 4.75 7.25 7.25 6.00 – 4.70 7.25 7.25
Local f 1.00 – – 2.00 0.50 0.50 – – 2.15 0.50 1.50
Property Tax g
Land h 2.98 1.13 1.96 0.92 1.12 1.12 2.58 1.11 1.29 1.08 1.20
Buildings h 2.98 1.13 1.96 0.92 1.12 1.12 2.58 1.11 1.29 1.08 1.20
Machinery & equipment i – 1.96 2.82au 0.92 1.12 1.12 1.88bj 1.55 1.29 1.08 1.20
Inventory j – – – – – – – – – – –
Total property-based taxes: k
12-operation (mfg) average $3.34 $5.01 $2.47 $2.55 $3.72 $3.40 $4.87 $3.85 $3.75 $3.61 $4.23
7-operation (non-mfg) average – $0.99 $1.43 $0.47 $0.57 $0.57 $0.95 $0.79 $0.66 $0.55 $0.61
Local Business Taxes
Taxes based on:
Gross receipts l – – – – – – – – – 0.035ba –
Salaries m – – – – – – – – – – –
Employees n – – – – – – – – – – –

www.competitivealternatives.com B.9
Seattle
WA Shreveport
LA Sioux Falls
SD Spartanburg
SC Spokane
WA St. Louis
MO Tampa
FL Trenton
NJ Wichita
KS Wilmington
DE Youngstown
OH
Corporate Income Tax a
34.00o 34.00o 34.00o 34.00o 34.00o 34.00o 34.00o 34.00o 34.00o 34.00o 34.00o Federal
– 8.00q,s – 5.00q – 6.25q 5.50q,s 9.00q,s 7.00s 8.70q – Regional
– – – – – –bo – – – – 1.00bo Local
34.00 36.56z,ad 34.00 37.30z 34.00 37.06z,ab 37.63z 39.94z 38.62z 39.74z 34.66z Combined income tax rate
Manufacturing tax rate reduction b
3.06p 2.82p 3.06p 3.06p 3.06p 2.87p 2.89p 2.78p 2.85p 2.79p 3.06p Federal
– 0.72p – – – 0.56p 0.50p 0.81p 0.63p 0.78p – Regional
30.94 33.02 30.94 34.24 30.94 33.63 34.24 36.35 35.14 36.17 31.60 Combined manufacturing tax rate
25.90 21.12 27.61 27.83 26.85 29.25 27.24 26.69 31.59 29.02 28.31
Effective income tax rate,
19-operation average c
Capital Tax d
Tax based on:
– – – – – – – – – 0.035bl – Capital stock
– – – 0.100 – – – – – – – Net equity
– 0.300ap – – – 0.027ao – – – – – Total assets
– – – – – – – – – – – Debt/borrowings
Sales Tax e
Refundable GST/VAT
– – – – – – – – – – – Federal f
– – – – – – – – – – – Regional f
Non-refundable sales tax
6.50 4.00 4.00 6.00 6.50 4.23 6.00 7.00 6.30 – 5.50 Regional f
2.87 4.60 2.00 – 2.20 3.96 1.00 – 1.00 – 1.00 Local f
Property Tax g
1.21 1.78 1.75 4.49aq 1.30 2.89 2.01 2.43 3.01 1.35 1.87 Land h
1.21 2.68bk 1.75aw 4.49aq 1.30 2.89 2.01 2.43 3.01 1.35 1.87 Buildings h
1.21 2.68bk – 4.49aq 1.30 3.06 2.01 – – – – Machinery & equipment i
– 2.68br – – – – – – – – – Inventory j
Total property-based taxes: k
$3.70 $5.23 $1.10 $9.71 $3.90 $8.77 $5.88 $2.86 $2.35 $1.44 $1.81 12-operation (mfg) average
$0.62 $1.36 – $1.68 $0.66 $1.56 $1.02 – – – – 7-operation (non-mfg) average
Local Business Taxes
Taxes based on:
1.80bb 0.10ay – – 1.80bb – – – – 0.40bm 0.26u Gross receipts l
– – – – – – – – – – – Salaries m
– – – – – – – – – – – Employees n

B.10 Competitive Alternatives: KPMG’s Guide to International Business Location Costs 2012 Edition
EXHIBIT B.7 (CONT’D)
Federal, regional, and local tax rates – In percent
Footnotes
a Percentage of taxable income. Minor adjustments required in the calculation
of taxable income in each jurisdiction are not individually disclosed. Tax rates shown in this exhibit are for the size of entity examined in this study. Many jurisdictions offer lower income tax rates for small businesses.
b Manufacturing tax rate reductions reduce on a pro-rata basis where a significant component of a company’s payroll or capital assets are not devoted to manufacturing or processing operations.
c The 19-operation average effective income tax rates for this study vary from the combined nominal income tax rates in each location due to the impact of adjustments to taxable income and income tax credits.
d Percentage of taxable capital, determined on the general basis indicated. In many jurisdictions, the general tax base indicated here is subject to minor adjustment.
e Percentage of sales price.
f General rate. Other rates may apply to specified articles.
g The Property Tax category includes all property-based taxes, including the property-based component of multi-base local business taxes. Property tax rates relate to the suburban or urban areas identified in the real estate research for this study as offering sites suitable for the types of operation being examined.
h Percentage of current market value, incorporating current tax rates, assessment factors, base-year price equalization factors and rental yields (estimated where required).
i Percentage of depreciated value. Special depreciation rates may apply for property tax purposes.
j Percentage of cost.
k Total property-based taxes in US $ per square foot of building space.
l Percentage of gross sales.
m Percentage of gross payroll.
n Tax per employee.
o Marginal tax rate applies if earnings exceed US $335,000 and are less than US $10 million. All US taxable income in excess of US $75,000 is taxed at marginal rates of 34% to 39%. Lower marginal rates (15% to 25%) apply to the first US $75,000 of taxable income.
p Effective impact of 9% tax deduction for Qualified Production Activities Income (QPAI). Benefit at the federal is reduced where a state also permits the QPAI deduction, as this reduces the federal deduction for state income tax paid. However, in these instances, the effective value of the saving at the state level is also shown, resulting in a higher total rate reduction than in states that do not permit the QPAI deduction. Effective rates shown are further adjusted to reflect the impact of state deductibility of federal and/or state taxes as relevant, to be consistent with the presentation of combined income tax rate.
q Interstate and export sales from this state are not attributed back to the state-of-origin for the purpose of allocating income between states (no “sales throwback” and/or attribution of services to where the “benefit of the services is received by the client” instead of where the “income producing activities are performed”). For companies with a single main location for operations (as is assumed in this study), this may result in a portion of taxable income not being subject to state income tax. The extent of this benefit depends on the weighting given to the sales factor in each state’s interstate income apportionment formula.
r New York State Franchise Tax is calculated as the greater of 7.1% of taxable income or 0.15% of taxable capital. Where tax is based on capital, maximum annual tax is US $350,000.
s Top marginal tax rate. Lower rates of tax apply to the first US $5,000 to
US $1,000,000 of income, depending on the state. Tax calculations in this study reflected the benefit of lower marginal tax rates as appropriate.
t Illinois corporate income tax rate is scheduled to decrease from 9.50% to 7.75% in 2015.
u All sales to customers located outside of Ohio are exempt from the Commercial Activity Tax.
v Texas Franchise Tax is based on “net margin” tax base, as defined for Texas Franchise Tax purposes.
w Indiana corporate income tax rate is scheduled to decrease to 8% in 2013, 7.5% in 2014, 7% in 2015, and 6.5% in 2016.
x Connecticut Business Tax is calculated as the greater of 9.0% (in 2012 and 2013, 7.5% thereafter) of taxable income or 0.31% of taxable capital. Where tax is based on capital, maximum tax is US $1 million.
y Rhode Island income tax rate may be reduced by up to 6.00%, subject to the level of new employment created. Tax paid is the greater of tax on taxable income and tax on taxable capital.
z In calculating the combined tax rate, the regional and local tax rates have been reduced by (1-Federal tax rate) to recognize the deduction permitted at the federal level for regional/local income taxes paid.
aa In calculating the combined tax rate, the regional tax rate has been reduced by (1-Regional tax rate) to recognize the deduction permitted at the regional level for regional taxes paid.
ab In calculating the combined tax rate, the federal tax rate has been reduced by (1 - 50% x Regional tax rate) to recognize the 50% deduction permitted at the regional level for federal income taxes paid.
ac Annual tax per employee. Rate varies by industry. This rate applies to manufacturing and many types of service operations.
ad In calculating the combined tax rate, the federal tax rate has been reduced by (1-Regional tax rate) to recognize the deduction permitted at the regional level for federal income taxes paid.
ae Effective income tax rate for all 19 operations is not reflective of true tax rates due to marginal profitability for some operations combined with the effects of Alternative Minimum Tax. Results shown represent the support services operation, as an operation with a reasonable net income before tax and no special tax provisions.
af Approximate rate for firms with US $1 million to US $20 million of taxable capital. Actual rates vary based on amount of taxable capital. Maximum annual tax is US $5,000.
ag Massachusetts Excise Tax on Capital effectively applies only to inventory and supplies, not total assets. For manufacturing firms, excise tax also applies to machinery and equipment, in lieu of local property tax.
ah Maximum annual tax is US $2 million.
ai Top marginal rate. Lower rates apply where taxable capital is less than US $2.5 million. Maximum annual tax is US $15,000.
aj In Oregon, a rate of 6.6% applies to income under $250,000 and the top marginal rate of 7.6% applies to income over that threshold. In 2013, the threshold is scheduled to increase to $10 million, reducing the effective tax rate on taxable income below $10 million.
ak Approximate rate. Actual tax is based on inventory, tangible property, payroll and in-state sales. Maximum annual tax is US $5,000.
al Maximum annual tax is US $20,000.

www.competitivealternatives.com B.11
EXHIBIT B.7 (CONT’D)
Federal, regional, and local tax rates – In percent
Footnotes
am Pennsylvania Capital Stock Tax applies to the average of 75% of capital stock and average book profits for the previous five years. The first US $125,000 of taxable value is exempt. Manufacturing and research firms are both exempt from Capital Stock Tax. This tax is scheduled to decrease to 0.089% in 2013 and be eliminated in 2014.
an This bi-annual tax has been split to show the effective rate on an annualized basis. Effective maximum annual tax is US $11,995.
ao First US $1 million of taxable capital exempt. Tax may be based on capital stock if this exceeds total assets less investments. Missouri business franchise tax on capital is scheduled to reduce to 0.020% in 2013, 0.013% in 2014, 0.0067% in 2015, and be eliminated in 2016.
ap Louisiana taxable capital is the greater of total fixed assets, or capital plus retained earnings plus 44% of debt. Rate shown is top marginal rate. The first US $300,000 is taxed at half this rate.
aq This study incorporates the impact of a five year exemption for new manufacturing establishments from county-level property taxes in Spartanburg. Firms are still subject to city and school taxes during this period.
ar In Massachusetts, machinery and equipment of manufacturing and processing firms are exempt from local property tax.
as This study incorporates the impact of a five-year automatic property tax exemption for new manufacturing equipment located in Connecticut.
at This study incorporates the impact of an automatic property tax exemption for virtually all new business equipment located in Maine.
au Manufacturing equipment is exempt from property tax.
av This study incorporates the impact of an abatement in Indiana of 100% of property tax for one year for new commercial real and personal property of manufacturing and R&D operations.
aw This study incorporates the impact of a one year full abatement and a five year phase-in for property taxes on new industrial buildings in Sioux Falls.
ax Rate for services companies. Rate for manufacturing companies is 0.3%.
ay Rate shown is applicable to services firms. Manufacturers are exempt.
az Rates vary by type of business. Rate shown is applicable to many types of business services. Manufacturers are exempt.
ba Rate for services companies. Rate for manufacturing companies is 0.020%.
bb Washington State Business and Occupation Tax. Rate shown is the general rate for services companies. General rate for manufacturing companies is 0.484%. Specific rates apply to certain industries.
bc Incorporates the effect of a 0.6% reduction in the New York State franchise tax rate for manufacturers.
bd Tax base is the greater of net worth or real and tangible property.
be In Greater Philadelphia, the applicability of gross receipts tax varies by municipality. The rate shown is reflective of more central locations in the metro area and is applied to the services operations modeled. Many outer suburban locations do not have a gross receipts tax, and no tax has been applied to the manufacturing operations modeled.
bf This study incorporates the impact of a five-year property tax exemption for new machinery and equipment located in Oklahoma.
bg New Hampshire Business Enterprise Tax applies to salaries and interest paid.
bh West Virginia corporate income tax rate is scheduled to decrease to 7% in 2013, and 6.5% in 2014.
bi West Virginia business franchise tax on capital is scheduled to reduce to 0.21% in 2013, 0.1% in 2014, and be eliminated in 2015.
bj This study incorporates the impact of a Michigan state exemption for a portion of property tax paid on manufacturing machinery and equipment.
bk This study incorporates a five year full abatement on buildings and machinery for new manufacturing operations in Louisiana.
bl Maximum annual tax is $185,000.
bm Rate for professional/business services companies on gross receipts in excess of US $1.2 million. For manufacturing companies, tax is 0.189% on gross receipts over US $15 million.
bn Arizona corporate income tax rate is scheduled to decrease to 6.5% in 2014, 6.0% in 2015, and 5.5% in 2016.
bo Local income tax rates shown reflect suburban locations. Higher local income tax rates apply to downtown operations in Cincinnati (2.10%), Detroit (1.00%), New York City (8.85%), Philadelphia (6.45%), Portland (3.65%), Saginaw (1.50%), St. Louis (1.00%), and Youngstown (2.75%).
bp Freeport exemptions apply to manufacturers’ inventory in Georgia, Oklahoma, and Texas.
bq An abatement applies to all manufacturing and R&D machinery and equipment in Baltimore.
br In Louisiana, manufacturers, wholesalers, and retailers receive a refundable income tax credit equal to the amount of property tax paid on inventory.
bs In Mississippi, manufacturers, wholesalers, and retailers receive a non-refundable income tax credit equal to the lesser of property tax paid on inventory or US $5,000.

B.12 Competitive Alternatives: KPMG’s Guide to International Business Location Costs 2012 Edition
EXHIBIT B.1: FRANCE
Federal, regional, and local tax rates – in percent
Marseille Paris Footnotes
Corporate Income Tax a a Percentage of taxable income. Minor adjustments required in the calculation of taxable income in each jurisdiction are not individually disclosed. Tax rates shown in this exhibit are for the size of entity examined in this study. Many jurisdictions offer lower income tax rates for small businesses.
b Manufacturing tax rate reductions reduce on a pro-rata basis where a significant component of a company’s payroll or capital assets are not devoted to manufacturing or processing operations.
c The 19-operation average effective income tax rates for this study vary from the combined nominal income tax rates in each location due to the impact of adjustments to taxable income and income tax credits.
d Percentage of taxable capital, determined on the general basis indicated. In many jurisdictions, the general tax base indicated here is subject to minor adjustment.
e Percentage of sales price.
f General rate. Other rates may apply to specified articles.
g The Property Tax category includes all property-based taxes, including the property-based component of multi-base local business taxes. Property tax rates relate to the suburban or urban areas identified in the real estate research for this study as offering sites suitable for the types of operation being examined.
h Percentage of current market value, incorporating current tax rates, assessment factors, base-year price equalization factors and rental yields (estimated where required).
i Percentage of depreciated value. Special depreciation rates may apply for property tax purposes.
j Percentage of cost.
k Total property-based taxes in US $ per square foot of building space.
l Percentage of gross sales.
m Percentage of gross payroll.
n Tax per employee.
o One-time tax on share issuance for non-listed companies. Maximum tax is €5,000.
p Includes both Tax on Developed Properties (TFPB) and Contribution for Enterprise Land Value (CFE), both of which are based on property rental value. CFE is levied directly on the lessee of leased properties.
q Contribution for Enterprise Value Added (CVAE), top marginal rate. Lower rates apply to companies with sales turnover of less than €50 million per annum. Tax base is value added, which is calculated as gross receipts less limited specified deductions.
r Total CFE plus CVAE is capped at 3% of value added as assessed for CVAE.
Federal 33.33 33.33
Regional – –
Local – –
Combined income tax rate 33.33 33.33
Manufacturing tax rate reduction b
Federal – –
Regional – –
Combined manufacturing tax rate 33.33 33.33
Effective income tax rate,
19-operation average c 21.55 17.64
Capital Tax d
Tax based on:
Capital stock 3.000o 3.000o
Net equity – –
Total assets – –
Debt/borrowings – –
Sales Tax e
Refundable GST/VAT
Federal f 19.60 19.60
Regional f – –
Non-refundable sales tax
Regional f – –
Local f – –
Property Tax g
Land h 3.35p 1.93p
Buildings h 3.35p 1.93p
Machinery & equipment i – –
Inventory j – –
Total property-based taxes: k
12-operation (mfg) average $3.02r $2.07r
7-operation (non-mfg) average $7.00r $11.34r
Local Business Taxes
Taxes based on:
Gross receipts l 1.50q 1.50q
Salaries m – –
Employees n – –

www.competitivealternatives.com B.13
EXHIBIT B.2: GERMANY
Federal, regional, and local tax rates – In percent
Berlin Frankfurt Footnotes
Corporate Income Tax a a Percentage of taxable income. Minor adjustments required in the calculation of taxable income in each jurisdiction are not individually disclosed. Tax rates shown in this exhibit are for the size of entity examined in this study. Many jurisdictions offer lower income tax rates for small businesses.
b Manufacturing tax rate reductions reduce on a pro-rata basis where a significant component of a company’s payroll or capital assets are not devoted to manufacturing or processing operations.
c The 19-operation average effective income tax rates for this study vary from the combined nominal income tax rates in each location due to the impact of adjustments to taxable income and income tax credits.
d Percentage of taxable capital, determined on the general basis indicated. In many jurisdictions, the general tax base indicated here is subject to minor adjustment.
e Percentage of sales price.
f General rate. Other rates may apply to specified articles.
g The Property Tax category includes all property-based taxes, including the property-based component of multi-base local business taxes. Property tax rates relate to the suburban or urban areas identified in the real estate research for this study as offering sites suitable for the types of operation being examined.
h Percentage of current market value, incorporating current tax rates, assessment factors, base-year price equalization factors and rental yields (estimated where required).
i Percentage of depreciated value. Special depreciation rates may apply for property tax purposes.
j Percentage of cost.
k Total property-based taxes in US $ per square foot of building space.
l Percentage of gross sales.
m Percentage of gross payroll.
n Tax per employee.
o Federal tax rate represents 15% basic tax, plus 5.5% solidarity surcharge.
Federal 15.83o 15.83o
Regional – –
Local 14.35 16.10
Combined income tax rate 30.18 31.93
Manufacturing tax rate reduction b
Federal – –
Regional – –
Combined manufacturing tax rate 30.18 31.93
Effective income tax rate,
19-operation average c 28.71 29.81
Capital Tax d
Tax based on:
Capital stock – –
Net equity – –
Total assets – –
Debt/borrowings – –
Sales Tax e
Refundable GST/VAT
Federal f 19.00 19.00
Regional f – –
Non-refundable sales tax
Regional f – –
Local f – –
Property Tax g
Land h 2.84 1.61
Buildings h 2.84 1.61
Machinery & equipment i – –
Inventory j – –
Total property-based taxes: k
12-operation (mfg) average $3.50 $2.67
7-operation (non-mfg) average – –
Local Business Taxes
Taxes based on:
Gross receipts l – –
Salaries m – –
Employees n – –

B.14 Competitive Alternatives: KPMG’s Guide to International Business Location Costs 2012 Edition
EXHIBIT B.3: ITALY
Federal, regional, and local tax rates – In percent
Milan Rome Footnotes
Corporate Income Tax a a Percentage of taxable income. Minor adjustments required in the calculation of taxable income in each jurisdiction are not individually disclosed. Tax rates shown in this exhibit are for the size of entity examined in this study. Many jurisdictions offer lower income tax rates for small businesses.
b Manufacturing tax rate reductions reduce on a pro-rata basis where a significant component of a company’s payroll or capital assets are not devoted to manufacturing or processing operations.
c The 19-operation average effective income tax rates for this study vary from the combined nominal income tax rates in each location due to the impact of adjustments to taxable income and income tax credits.
d Percentage of taxable capital, determined on the general basis indicated. In many jurisdictions, the general tax base indicated here is subject to minor adjustment.
e Percentage of sales price.
f General rate. Other rates may apply to specified articles.
g The Property Tax category includes all property-based taxes, including the property-based component of multi-base local business taxes. Property tax rates relate to the suburban or urban areas identified in the real estate research for this study as offering sites suitable for the types of operation being examined.
h Percentage of current market value, incorporating current tax rates, assessment factors, base-year price equalization factors and rental yields (estimated where required).
i Percentage of depreciated value. Special depreciation rates may apply for property tax purposes.
j Percentage of cost.
k Total property-based taxes in US $ per square foot of building space.
l Percentage of gross sales.
m Percentage of gross payroll.
n Tax per employee.
o Deductions for payroll and interest costs are limited for Italian Regional Tax on Productive Activities (IRAP). This results in a higher taxable income base for IRAP purposes than for most other income taxes listed in this Appendix.
p In calculating the combined tax rate, the regional tax rate has been reduced by (1 - (federal tax rate x 10%)) to recognize the 10 percent deduction permitted at the federal level for regional income taxes paid.
q One-time tax on issuance of medium and long term loans.
r Local tax on immovable property tax (ICI) is based on imputed income value of a property as determined by the Immovable Property Registry. The rates shown here represent the estimated tax rate as a percentage of property fair market value, based on the assumption that imputed income represents 1.94% of fair market value. For leased facilities, imputed income is assumed to equal actual lease payments.
Federal 27.50 27.50
Regional 3.90o 4.97o
Local – –
Combined income tax rate 31.29p 32.33p
Manufacturing tax rate reduction b
Federal – –
Regional – –
Combined manufacturing tax rate 31.29 32.33
Effective income tax rate,
19-operation average c 34.77 37.27
Capital Tax d
Tax based on:
Capital stock – –
Net equity – –
Total assets – –
Debt/borrowings 0.250q 0.250q
Sales Tax e
Refundable GST/VAT
Federal f 21.00 21.00
Regional f – –
Non-refundable sales tax
Regional f – –
Local f – –
Property Tax g
Land h 0.50r 0.70r
Buildings h 0.51r 0.71r
Machinery & equipment i – –
Inventory j – –
Total property-based taxes: k
12-operation (mfg) average $0.42 $0.48
7-operation (non-mfg) average $2.04 $1.83
Local Business Taxes
Taxes based on:
Gross receipts l – –
Salaries m – –
Employees n – –

www.competitivealternatives.com B.15
EXHIBIT B.4: NETHERLANDS
Federal, regional, and local tax rates – In percent
Amsterdam Rotterdam Footnotes
Corporate Income Tax a a Percentage of taxable income. Minor adjustments required in the calculation of taxable income in each jurisdiction are not individually disclosed. Tax rates shown in this exhibit are for the size of entity examined in this study. Many jurisdictions offer lower income tax rates for small businesses.
b Manufacturing tax rate reductions reduce on a pro-rata basis where a significant component of a company’s payroll or capital assets are not devoted to manufacturing or processing operations.
c The 19-operation average effective income tax rates for this study vary from the combined nominal income tax rates in each location due to the impact of adjustments to taxable income and income tax credits.
d Percentage of taxable capital, determined on the general basis indicated. In many jurisdictions, the general tax base indicated here is subject to minor adjustment.
e Percentage of sales price.
f General rate. Other rates may apply to specified articles.
g The Property Tax category includes all property-based taxes, including the property-based component of multi-base local business taxes. Property tax rates relate to the suburban or urban areas identified in the real estate research for this study as offering sites suitable for the types of operation being examined.
h Percentage of current market value, incorporating current tax rates, assessment factors, base-year price equalization factors and rental yields (estimated where required).
i Percentage of depreciated value. Special depreciation rates may apply for property tax purposes.
j Percentage of cost.
k Total property-based taxes in US $ per square foot of building space.
l Percentage of gross sales.
m Percentage of gross payroll.
n Tax per employee.
o Top marginal rate. The first €200,000 of taxable income is taxed at 20%. p The benefits provided under the Netherlands’ R&D employee wage tax withholding
program is netted into the calculation of effective income tax rate.
q Incorporates real estate taxes levied on both property owners and property occupants.
Federal 25.00 o 25.00 o
Regional – –
Local – –
Combined income tax rate 25.00 25.00
Manufacturing tax rate reduction b
Federal – –
Regional – –
Combined manufacturing tax rate 25.00 25.00
Effective income tax rate,
19-operation average c 20.42p 20.42 p
Capital Tax d
Tax based on:
Capital stock – –
Net equity – –
Total assets – –
Debt/borrowings – –
Sales Tax e
Refundable GST/VAT
Federal f 19.00 19.00
Regional f – –
Non-refundable sales tax
Regional f – –
Local f – –
Property Tax g
Land h 0.38 q 0.48 q
Buildings h 0.38 q 0.48 q
Machinery & equipment i – –
Inventory j – –
Total property-based taxes: k
12-operation (mfg) average $0.56 $0.73
7-operation (non-mfg) average $0.39 $0.49
Local Business Taxes
Taxes based on:
Gross receipts l – –
Salaries m – –
Employees n – –

B.16 Competitive Alternatives: KPMG’s Guide to International Business Location Costs 2012 Edition
EXHIBIT B.5: UNITED KINGDOM
Federal, regional, and local tax rates – In percent
London Manchester Footnotes
Corporate Income Tax a a Percentage of taxable income. Minor adjustments required in the calculation of taxable income in each jurisdiction are not individually disclosed. Tax rates shown in this exhibit are for the size of entity examined in this study. Many jurisdictions offer lower income tax rates for small businesses.
b Manufacturing tax rate reductions reduce on a pro-rata basis where a significant component of a company’s payroll or capital assets are not devoted to manufacturing or processing operations.
c The 19-operation average effective income tax rates for this study vary from the combined nominal income tax rates in each location due to the impact of adjustments to taxable income and income tax credits.
d Percentage of taxable capital, determined on the general basis indicated. In many jurisdictions, the general tax base indicated here is subject to minor adjustment.
e Percentage of sales price.
f General rate. Other rates may apply to specified articles.
g The Property Tax category includes all property-based taxes, including the property-based component of multi-base local business taxes. Property tax rates relate to the suburban or urban areas identified in the real estate research for this study as offering sites suitable for the types of operation being examined.
h Percentage of current market value, incorporating current tax rates, assessment factors, base-year price equalization factors and rental yields (estimated where required).
i Percentage of depreciated value. Special depreciation rates may apply for property tax purposes.
j Percentage of cost.
k Total property-based taxes in US $ per square foot of building space.
l Percentage of gross sales.
m Percentage of gross payroll.
n Tax per employee.
o Top marginal tax rate applies where taxable income exceeds £1.5 million. If taxable income is below £300,000, the tax rate is 20%, while a pro-rated tax rate of between 20% and 26% applies if taxable income is between £300,000 and £1.5 million.
p The top marginal rate is scheduled to decrease by 1% on April 1 of each year from 2012 until it reaches 23% on April 1, 2014.
Federal 26.00o,p 26.00o,p
Regional
Local – –
Combined income tax rate 26.00 26.00
Manufacturing tax rate reduction b
Federal – –
Regional – –
Combined manufacturing tax rate 26.00 26.00
Effective income tax rate,
19-operation average c 17.81 19.99
Capital Tax d
Tax based on:
Capital stock – –
Net equity – –
Total assets – –
Debt/borrowings – –
Sales Tax e
Refundable GST/VAT
Federal f 20.00 20.00
Regional f – –
Non-refundable sales tax
Regional f – –
Local f – –
Property Tax g
Land h 4.37 4.33
Buildings h 4.37 4.33
Machinery & equipment i – –
Inventory j – –
Total property-based taxes: k
12-operation (mfg) average $6.45 $3.88
7-operation (non-mfg) average – –
Local Business Taxes
Taxes based on:
Gross receipts l – –
Salaries m – –
Employees n – –

www.competitivealternatives.com B.17
EXHIBIT B.8: AUSTRALIA
Federal, regional, and local tax rates – In percent
Adelaide Brisbane Melbourne Sydney Footnotes
Corporate Income Tax a a Percentage of taxable income. Minor adjustments required in the calculation of taxable income in each jurisdiction are not individually disclosed. Tax rates shown in this exhibit are for the size of entity examined in this study. Many jurisdictions offer lower income tax rates for small businesses.
b Manufacturing tax rate reductions reduce on a pro-rata basis where a significant component of a company’s payroll or capital assets are not devoted to manufacturing or processing operations.
c The 19-operation average effective income tax rates for this study vary from the combined nominal income tax rates in each location due to the impact of adjustments to taxable income and income tax credits.
d Percentage of taxable capital, determined on the general basis indicated. In many jurisdictions, the general tax base indicated here is subject to minor adjustment.
e Percentage of sales price.
f General rate. Other rates may apply to specified articles.
g The Property Tax category includes all property-based taxes, including the property-based component of multi-base local business taxes. Property tax rates relate to the suburban or urban areas identified in the real estate research for this study as offering sites suitable for the types of operation being examined.
h Percentage of current market value, incorporating current tax rates, assessment factors, base-year price equalization factors and rental yields (estimated where required).
i Percentage of depreciated value. Special depreciation rates may apply for property tax purposes.
j Percentage of cost.
k Total property-based taxes in US $ per square foot of building space.
l Percentage of gross sales.
m Percentage of gross payroll.
n Tax per employee.
o The general company tax rate is proposed to decrease to 29% on July 1, 2013.
p Includes both state land tax (3.70%) and local council rates (0.51%). Land tax represents top marginal rate. Lower rates apply on the first AUD $1.05 million of land value.
q Includes both state land tax (2.00%) and local council rates (0.85%). Land tax represents top marginal rate. Lower rates apply on the first AUD $5 million of land value.
r Includes both state land tax (2.25%) and local council rates (0.85%). Land tax represents top marginal rate. Lower rates apply on the first AUD $3 million of land value.
s Includes both state land tax (2.00%) and local council rates (0.68%). Land tax represents top marginal rate. Lower rates apply on the first AUD $2.37 million of land value.
t State payroll tax of 4.95% (for Adelaide), 4.75% (for Brisbane), 4.90% (for Melbourne) and 5.45% (for Sydney) is not shown here as it is included under statutory plans in the labor analysis.
Federal 30.00o 30.00o 30.00o 30.00o
Regional – – – –
Local – – – –
Combined income tax rate 30.00 30.00 30.00 30.00
Manufacturing tax rate reduction b
Federal – – – –
Regional – – – –
Combined manufacturing tax rate 30.00 30.00 30.00 30.00
Effective income tax rate,
19-operation average c 22.76 22.44 22.76 21.61
Capital Tax d
Tax based on:
Capital stock – – – –
Net equity – – – –
Total assets – – – –
Debt/borrowings – – – –
Sales Tax e
Refundable GST/VAT
Federal f 10.00 10.00 10.00 10.00
Regional f – – – –
Non-refundable sales tax
Regional f – – – –
Local f – – – –
Property Tax g
Land h 4.21p 2.85q 3.10r 2.68s
Buildings h 0.51 – 0.85 –
Machinery & equipment i – – – –
Inventory j – – – –
Total property-based taxes: k
12-operation (mfg) average $3.63 $1.94 $2.26 $2.22
7-operation (non-mfg) average – – – –
Local Business Taxes
Taxes based on:
Gross receipts l – – – –
Salaries m –t –t –t –t
Employees n – – – –

B.18 Competitive Alternatives: KPMG’s Guide to International Business Location Costs 2012 Edition
EXHIBIT B.9: JAPAN
Federal, regional, and local tax rates – In percent
Osaka Tokyo Footnotes
Corporate Income Tax a a Percentage of taxable income. Minor adjustments required in the calculation of taxable income in each jurisdiction are not individually disclosed. Tax rates shown in this exhibit are for the size of entity examined in this study. Many jurisdictions offer lower income tax rates for small businesses.
b Manufacturing tax rate reductions reduce on a pro-rata basis where a significant component of a company’s payroll or capital assets are not devoted to manufacturing or processing operations.
c The 19-operation average effective income tax rates for this study vary from the combined nominal income tax rates in each location due to the impact of adjustments to taxable income and income tax credits.
d Percentage of taxable capital, determined on the general basis indicated. In many jurisdictions, the general tax base indicated here is subject to minor adjustment.
e Percentage of sales price.
f General rate. Other rates may apply to specified articles.
g The Property Tax category includes all property-based taxes, including the property-based component of multi-base local business taxes. Property tax rates relate to the suburban or urban areas identified in the real estate research for this study as offering sites suitable for the types of operation being examined.
h Percentage of current market value, incorporating current tax rates, assessment factors, base-year price equalization factors and rental yields (estimated where required).
i Percentage of depreciated value. Special depreciation rates may apply for property tax purposes.
j Percentage of cost.
k Total property-based taxes in US $ per square foot of building space.
l Percentage of gross sales.
m Percentage of gross payroll.
n Tax per employee.
o Top marginal rate. The first ¥8 million of taxable income is taxed at 18% only if the corporation’s paid-in capital is ¥100 million or less. The top marginal rate is scheduled to decrease to 28.05% on April 1, 2012, and then to 25.5% on April 1, 2015.
p Two separate income taxes apply at the prefectural level. Business Tax applies at a top marginal rate at 5.78%, with lower rates applying to the first ¥8 million of taxable income and for corporations with paid-in capital of ¥100 million or more. However corporations with paid-in capital of ¥100 million or more are also subject to capital and value-added components of Business Tax. Special Local Corporate Tax applies as a percentage of Business Tax, which is then converted into an effective rate expressed as a percentage of taxable income. The top marginal rate for Special Local Corporate Tax is 148% of Business Tax (effective rate: 4.29%).
q Prefectural and Municipal Inhabitant Tax are based on federal corporate income tax. The combined top marginal rate of 20.5% of federal tax paid represents an effective rate of 6.15% of taxable income.
r Prefectural and Municipal Inhabitant Tax are based on federal corporate income tax. The combined top marginal rate of 20.7% of federal tax paid represents an effective rate of 6.21% of taxable income.
s In calculating the combined tax rate, the prefectural business tax rates have been reduced by (1 – Federal tax rate) to recognize the deduction permitted at the federal level for business tax paid. Prefectural and municipal inhabitant (income-based) taxes are not deductible for federal income tax purposes.
t Effective income tax rate for all 19 operations is not reflective of true tax rates due to marginal profitability for some operations. Results shown represent the support services operation, as an operation with a reasonable net income before tax and no special tax provisions.
u One-time tax on share issuance.
v Approximate rate including prefectural and municipal per-capita taxes on taxable capital of ¥5 billion (rates vary based on capital stock and employees), plus capital component of Business Tax applicable to companies with paid-in capital in excess of ¥100 million.
w Incorporates 1.70% property tax plus building occupancy tax of ¥600 per m2 of floor space. x Value added component of Prefectural Business Tax applicable to companies with paid-in capital in excess of
¥100 million. Tax base is value added, defined as gross receipts less limited specified deductions.
y Represents salaries component of multi-base local business tax. Not assessable where total employee count is 100 or less.
Federal 30.00o 30.00o
Regional 10.07p 10.07p
Local 6.15q 6.21r
Combined income tax rate 43.20s 43.26s
Manufacturing tax rate reduction b
Federal – –
Regional – –
Combined manufacturing tax rate 43.20 43.26
Effective income tax rate,
19-operation average c 34.29 39.10t
Capital Tax d
Tax based on:
Capital stock (federal) 0.700u 0.700u
Capital stock (regional/local) 0.302v 0.286v
Total assets – –
Debt/borrowings – –
Sales Tax e
Refundable GST/VAT
Federal f 5.00 5.00
Regional f – –
Non-refundable sales tax
Regional f – –
Local f – –
Property Tax g
Land h 1.70 1.70
Buildings h 2.19w 2.16w
Machinery & equipment i 1.40 1.40
Inventory j – –
Total property-based taxes: k
12-operation (mfg) average $9.44 $14.85
7-operation (non-mfg) average $1.77 $1.80
Local Business Taxes
Taxes based on:
Gross receipts l 0.50x 0.50x
Salaries m 0.25y 0.25y
Employees n – –

www.competitivealternatives.com B.19
EXHIBIT B.7: BRAZIL
Federal, regional, and local tax rates – In percent
Belo Horizonte
São Paulo Footnotes
Corporate Income Tax a a Percentage of taxable income. Minor adjustments required in the calculation of taxable income in each jurisdiction are not individually disclosed. Tax rates shown in this exhibit are for the size of entity examined in this study. Many jurisdictions offer lower income tax rates for small businesses.
b Manufacturing tax rate reductions reduce on a pro-rata basis where a significant component of a company’s payroll or capital assets are not devoted to manufacturing or processing operations.
c The 19-operation average effective income tax rates for this study vary from the combined nominal income tax rates in each location due to the impact of adjustments to taxable income and income tax credits.
d Percentage of taxable capital, determined on the general basis indicated. In many jurisdictions, the general tax base indicated here is subject to minor adjustment.
e Percentage of sales price.
f General rate. Other rates may apply to specified articles.
g The Property Tax category includes all property-based taxes, including the property-based component of multi-base local business taxes. Property tax rates relate to the suburban or urban areas identified in the real estate research for this study as offering sites suitable for the types of operation being examined.
h Percentage of current market value, incorporating current tax rates, assessment factors, base-year price equalization factors and rental yields (estimated where required).
i Percentage of depreciated value. Special depreciation rates may apply for property tax purposes.
j Percentage of cost.
k Total property-based taxes in US $ per square foot of building space.
l Percentage of gross sales.
m Percentage of gross payroll.
n Tax per employee.
o Top marginal rate. The first BRL 240,000 of taxable income is taxed at 24%. p One-time tax on issuance of loans.
q Estimated combined cost of Federal Excise Tax (IPI) and State Value Added Tax (ICMS). Rate varies by product, and this estimate is based on product categories relevant to the business operations modeled. For manufacturers, wholesalers and retailers, credits can generally be claimed for taxes paid (non-cumulative GST style). These taxes represent a non-refundable sales tax cost (cumulative) to other types of business. IPI and ICMS are compounded, with the value of the taxes being included in the base value on which the taxes are calculated.
r Top marginal rate. Lower rates apply on the first BRL 1 million of land value.
s Social Integration Program (PIS) and Social Security Contribution (COFINS) apply at a combined rate of 3.65% of gross domestic revenues (cumulative) or 9.25% of domestic value added (non-cumulative), depending on various attributes of the business (e.g. industry of operation, income tax status). Special provisions apply to certain industries.
t Municipal Service Tax (ISS) applies to service operations only. Manufacturers are exempt. Rates vary by type of service activity. Range of common rates is shown.
Federal 34.00o 34.00o
Regional – –
Local – –
Combined income tax rate 34.00 34.00
Manufacturing tax rate reduction b
Federal – –
Regional – –
Combined manufacturing tax rate 34.00 34.00
Effective income tax rate,
19-operation average c 34.94 35.27
Capital Tax d
Tax based on:
Capital stock – –
Net equity – –
Total assets – –
Debt/borrowings 1.877p 1.877p
Sales Tax e
Refundable GST/VAT
Federal f 23.75q 23.75q
Regional f – –
Non-refundable sales tax
Regional f 23.75q 23.75q
Local f – –
Property Tax g
Land h 3.00r 1.50
Buildings h 1.60 1.50
Machinery & equipment i – –
Inventory j – –
Total property-based taxes: k
12-operation (mfg) average $1.63 $1.69
7-operation (non-mfg) average – –
Local Business Taxes
Taxes based on:
Gross receipts l (federal) 3.65s 3.65s
Gross receipts l (local) 2.0-5.0t 2.0-5.0t
Salaries m – –
Employees n – –

B.20 Competitive Alternatives: KPMG’s Guide to International Business Location Costs 2012 Edition
EXHIBIT B.7: MEXICO
Federal, regional, and local tax rates – In percent
Mexico City
Monterrey Footnotes
Corporate Income Tax a a Percentage of taxable income. Minor adjustments required in the calculation of taxable income in each jurisdiction are not individually disclosed. Tax rates shown in this exhibit are for the size of entity examined in this study. Many jurisdictions offer lower income tax rates for small businesses.
b Manufacturing tax rate reductions reduce on a pro-rata basis where a significant component of a company’s payroll or capital assets are not devoted to manufacturing or processing operations.
c The 19-operation average effective income tax rates for this study vary from the combined nominal income tax rates in each location due to the impact of adjustments to taxable income and income tax credits.
d Percentage of taxable capital, determined on the general basis indicated. In many jurisdictions, the general tax base indicated here is subject to minor adjustment.
e Percentage of sales price.
f General rate. Other rates may apply to specified articles.
g The Property Tax category includes all property-based taxes, including the property-based component of multi-base local business taxes. Property tax rates relate to the suburban or urban areas identified in the real estate research for this study as offering sites suitable for the types of operation being examined.
h Percentage of current market value, incorporating current tax rates, assessment factors, base-year price equalization factors and rental yields (estimated where required).
i Percentage of depreciated value. Special depreciation rates may apply for property tax purposes.
j Percentage of cost.
k Total property-based taxes in US $ per square foot of building space.
l Percentage of gross sales.
m Percentage of gross payroll.
n Tax per employee.
o Tax rate is scheduled to decrease to 29% for 2013 and then to 28% for 2014 and later years.
p Effective income tax rates for Mexico incorporate the impact of the Flat Business Tax (IETU) minimum tax regime, where relevant based upon standard business model assumptions (refer Appendix A).
q Exemption of 20% to 40% applies for new firms with 60 or fewer employees.
r Full exemption applies for new companies for the first year of operation.
Federal 30.00o 30.00o
Regional – –
Local – –
Combined income tax rate 30.00 30.00
Manufacturing tax rate reduction b
Federal – –
Regional – –
Combined manufacturing tax rate 30.00 30.00
Effective income tax rate,
19-operation average c 27.25p 27.29p
Capital Tax d
Tax based on:
Capital stock – –
Net equity – –
Total assets – –
Debt/borrowings – –
Sales Tax e
Refundable GST/VAT
Federal f 16.00 16.00
Regional f – –
Non-refundable sales tax
Regional f – –
Local f – –
Property Tax g
Land h 0.15 0.20
Buildings h 0.15 0.20
Machinery & equipment i – –
Inventory j – –
Total property-based taxes: k
12-operation (mfg) average $0.10 $0.11
7-operation (non-mfg) average – –
Local Business Taxes
Taxes based on:
Gross receipts l – –
Salaries m 2.50q 2.00r
Employees n – –
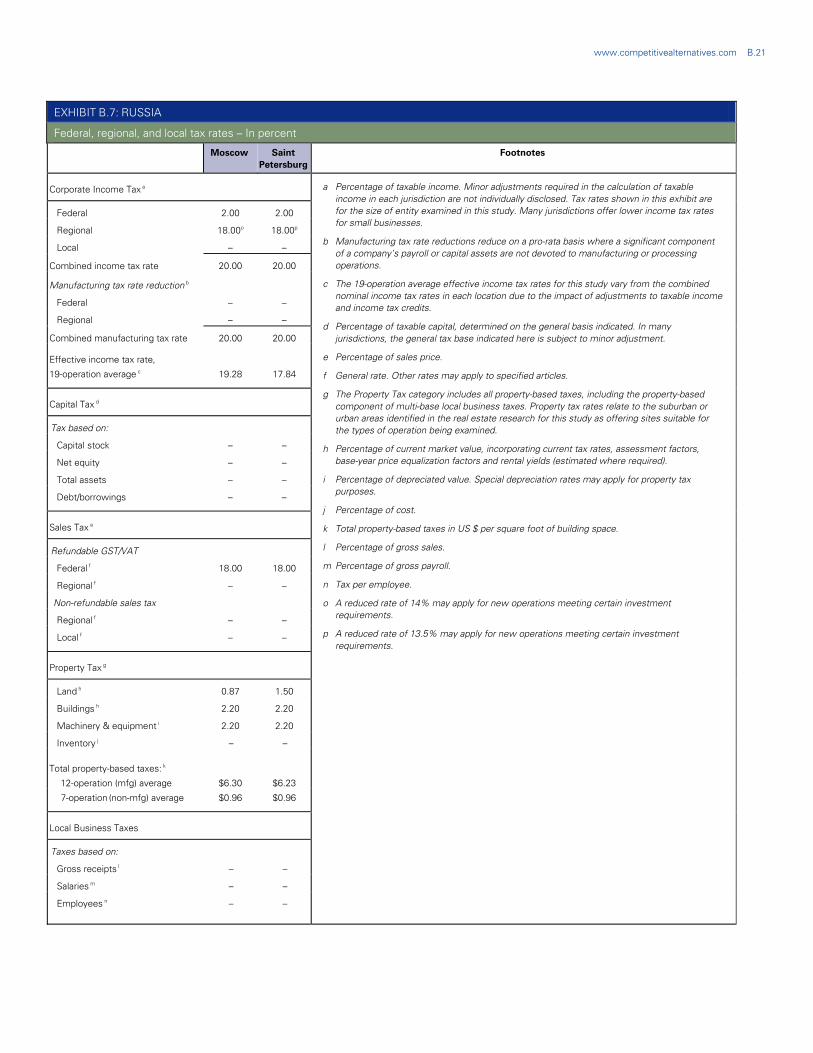
www.competitivealternatives.com B.21
EXHIBIT B.7: RUSSIA
Federal, regional, and local tax rates – In percent
Moscow Saint Petersburg
Footnotes
Corporate Income Tax a a Percentage of taxable income. Minor adjustments required in the calculation of taxable income in each jurisdiction are not individually disclosed. Tax rates shown in this exhibit are for the size of entity examined in this study. Many jurisdictions offer lower income tax rates for small businesses.
b Manufacturing tax rate reductions reduce on a pro-rata basis where a significant component of a company’s payroll or capital assets are not devoted to manufacturing or processing operations.
c The 19-operation average effective income tax rates for this study vary from the combined nominal income tax rates in each location due to the impact of adjustments to taxable income and income tax credits.
d Percentage of taxable capital, determined on the general basis indicated. In many jurisdictions, the general tax base indicated here is subject to minor adjustment.
e Percentage of sales price.
f General rate. Other rates may apply to specified articles.
g The Property Tax category includes all property-based taxes, including the property-based component of multi-base local business taxes. Property tax rates relate to the suburban or urban areas identified in the real estate research for this study as offering sites suitable for the types of operation being examined.
h Percentage of current market value, incorporating current tax rates, assessment factors, base-year price equalization factors and rental yields (estimated where required).
i Percentage of depreciated value. Special depreciation rates may apply for property tax purposes.
j Percentage of cost.
k Total property-based taxes in US $ per square foot of building space.
l Percentage of gross sales.
m Percentage of gross payroll.
n Tax per employee.
o A reduced rate of 14% may apply for new operations meeting certain investment requirements.
p A reduced rate of 13.5% may apply for new operations meeting certain investment requirements.
Federal 2.00 2.00
Regional 18.00o 18.00p
Local – –
Combined income tax rate 20.00 20.00
Manufacturing tax rate reduction b
Federal – –
Regional – –
Combined manufacturing tax rate 20.00 20.00
Effective income tax rate,
19-operation average c 19.28 17.84
Capital Tax d
Tax based on:
Capital stock – –
Net equity – –
Total assets – –
Debt/borrowings – –
Sales Tax e
Refundable GST/VAT
Federal f 18.00 18.00
Regional f – –
Non-refundable sales tax
Regional f – –
Local f – –
Property Tax g
Land h 0.87 1.50
Buildings h 2.20 2.20
Machinery & equipment i 2.20 2.20
Inventory j – –
Total property-based taxes: k
12-operation (mfg) average $6.30 $6.23
7-operation (non-mfg) average $0.96 $0.96
Local Business Taxes
Taxes based on:
Gross receipts l – –
Salaries m – –
Employees n – –

B.22 Competitive Alternatives: KPMG’s Guide to International Business Location Costs 2012 Edition
EXHIBIT B.7: CHINA
Federal, regional, and local tax rates – In percent
Chengdu Shanghai Footnotes
Corporate Income Tax a a Percentage of taxable income. Minor adjustments required in the calculation of taxable income in each jurisdiction are not individually disclosed. Tax rates shown in this exhibit are for the size of entity examined in this study. Many jurisdictions offer lower income tax rates for small businesses.
b Manufacturing tax rate reductions reduce on a pro-rata basis where a significant component of a company’s payroll or capital assets are not devoted to manufacturing or processing operations.
c The 19-operation average effective income tax rates for this study vary from the combined nominal income tax rates in each location due to the impact of adjustments to taxable income and income tax credits.
d Percentage of taxable capital, determined on the general basis indicated. In many jurisdictions, the general tax base indicated here is subject to minor adjustment.
e Percentage of sales price.
f General rate. Other rates may apply to specified articles.
g The Property Tax category includes all property-based taxes, including the property-based component of multi-base local business taxes. Property tax rates relate to the suburban or urban areas identified in the real estate research for this study as offering sites suitable for the types of operation being examined.
h Percentage of current market value, incorporating current tax rates, assessment factors, base-year price equalization factors and rental yields (estimated where required).
i Percentage of depreciated value. Special depreciation rates may apply for property tax purposes.
j Percentage of cost.
k Total property-based taxes in US $ per square foot of building space.
l Percentage of gross sales.
m Percentage of gross payroll.
n Tax per employee.
o A reduced tax rate of 15% applies to many types of encouraged or state-supported enterprises, including many categories of advanced manufacturing and technology industries.
p One-time taxes on share and loan issuance.
q Incorporates 0.84% real estate tax plus urban land use tax of RMB 18 per m2 of land. While the tax rate estimated as a percentage of market value is high, this is reflective of relatively low market value for industrial land in and around Chengdu.
r Incorporates 0.96% real estate tax plus urban land use tax of RMB 15.75 per m2 of land.
s Business Tax is applicable to services firms only. Manufacturers are exempt.
t Local watercourse, urban maintenance/construction, and/or education taxes (as applicable in each city). The tax base for these taxes comprises Business Tax paid + Net VAT remitted + Consumption Tax paid. (Consumption Tax is a sales tax that only applies to a very limited range of luxury and other goods.)
Federal 25.00o 25.00o
Regional – –
Local – –
Combined income tax rate 25.00 25.00
Manufacturing tax rate reduction b
Federal – –
Regional – –
Combined manufacturing tax rate 25.00 25.00
Effective income tax rate,
19-operation average c 16.67 16.48
Capital Tax d
Tax based on:
Capital stock 0.050p 0.050p
Net equity – –
Total assets – –
Debt/borrowings 0.005p 0.005p
Sales Tax e
Refundable GST/VAT
Federal f 17.00 17.00
Regional f – –
Non-refundable sales tax
Regional f – –
Local f – –
Property Tax g
Land h 24.70q 1.48r
Buildings h 0.84 0.96
Machinery & equipment i – –
Inventory j – –
Total property-based taxes: k
12-operation (mfg) average $0.22 $1.13
7-operation (non-mfg) average – –
Local Business Taxes
Taxes based on:
Gross receipts l 5.00s 5.00s
Salaries m – –
Employees n – –
Other 10.10t 11.00t

www.competitivealternatives.com B.23
EXHIBIT B.7: INDIA
Federal, regional, and local tax rates – In percent
Chennai Mumbai Footnotes
Corporate Income Tax a a Percentage of taxable income. Minor adjustments required in the calculation of taxable income in each jurisdiction are not individually disclosed. Tax rates shown in this exhibit are for the size of entity examined in this study. Many jurisdictions offer lower income tax rates for small businesses.
b Manufacturing tax rate reductions reduce on a pro-rata basis where a significant component of a company’s payroll or capital assets are not devoted to manufacturing or processing operations.
c The 19-operation average effective income tax rates for this study vary from the combined nominal income tax rates in each location due to the impact of adjustments to taxable income and income tax credits.
d Percentage of taxable capital, determined on the general basis indicated. In many jurisdictions, the general tax base indicated here is subject to minor adjustment.
e Percentage of sales price.
f General rate. Other rates may apply to specified articles.
g The Property Tax category includes all property-based taxes, including the property-based component of multi-base local business taxes. Property tax rates relate to the suburban or urban areas identified in the real estate research for this study as offering sites suitable for the types of operation being examined.
h Percentage of current market value, incorporating current tax rates, assessment factors, base-year price equalization factors and rental yields (estimated where required).
i Percentage of depreciated value. Special depreciation rates may apply for property tax purposes.
j Percentage of cost.
k Total property-based taxes in US $ per square foot of building space.
l Percentage of gross sales.
m Percentage of gross payroll.
n Tax per employee.
o The tax rate is scheduled to decrease to 30.0% on April 1, 2012 with the introduction of India’s new Direct Tax Code.
p One-time tax on share issuance.
q Central Excise Duty and Service Tax. These taxes are refundable (non-cumulative) for manufacturers and service providers.
r State Value Added Tax (VAT) applicable to intra-state transactions only. This tax is refundable (non-cumulative) for manufacturers.
s Estimated blended rate from multiple non-refundable state and local sales taxes including VAT, Central Sales Tax (CST), and Additional Duty of Customs (ADC, a sales tax in addition to regular customs duty). Reduced rate applicable to manufacturers is estimated at 0.7%.
t Estimated blended rate from multiple non-refundable state and local sales taxes including VAT, CST, ADC, and Greater Mumbai Octroi. Reduced rate applicable to manufacturers is estimated at 6.2%.
Federal 30.61o 30.61o
Regional – –
Local – –
Combined income tax rate 30.61 30.61
Manufacturing tax rate reduction b
Federal – –
Regional – –
Combined manufacturing tax rate 30.61 30.61
Effective income tax rate,
19-operation average c 28.52 28.24
Capital Tax d
Tax based on:
Capital stock – 0.010p
Net equity – –
Total assets – –
Debt/borrowings – –
Sales Tax e
Refundable GST/VAT
Federal f 10.30q 10.30q
Regional f 14.50r 12.50r
Non-refundable sales tax
Regional f 6.80s 11.70t
Local f – –
Property Tax g
Land h – 5.64
Buildings h 0.28 –
Machinery & equipment i – –
Inventory j – –
Total property-based taxes: k
12-operation (mfg) average $0.13 $0.53
7-operation (non-mfg) average – –
Local Business Taxes
Taxes based on:
Gross receipts l – –
Salaries m – –
Employees n – –

B.24 Competitive Alternatives: KPMG’s Guide to International Business Location Costs 2012 Edition
THIS PAGE IS INTENTIONALLY BLANK

www.competitivealternatives.com C.1
Appendix C Other Competitiveness Factors: Regional Data and Data Source Notes In support of the analysis of other competitiveness factors presented in Chapter 6 of the Competitive Alternatives 2012 report, this Appendix contains:
Regional data for a number of the competitiveness measures presented at the national level in Chapter 6 Detailed data source notes for the data presented in Chapter 6.
A. Regional Competitiveness Data Differing data collection standards and practices in the study countries limit the range of other competitiveness factors that can be compared across or within the countries. Exhibit C.1 presents data on other competitiveness factors for each of the 113 cities featured in Competitive Alternatives 2012. Due to data availability and/or quality issues, only a limited range of factors is presented for the 10 cities in the high-growth countries.
Exhibit C.1 presents data that covers ten main topics, each of which were analyzed at the national level in Chapter 6:
Macro-economic conditions: - GDP growth rates - GDP per capita
Population: - Elderly dependency rate - Urban density
Labor markets: - Economic activity (labor force participation) rates - Unemployment rates - Educational attainment rates
Innovation: - Expenditure on R&D as a percentage of GDP
Quality of life - Housing affordability - Doctors per 100,000 inhabitants
In most instances, data can be compared across all locations studied. However, in some instances data definitions differ among the study countries and this prevents comparability. In these cases, data are presented as national indices, with each country scaled to 100 and indices for each location indicating whether it lies above or below the national average for its country. These national indices are clearly labeled, and such indices cannot be used to compare two regions in different countries.
National-level data presented in Exhibit C.1 may differ from national-level data presented in the relevant exhibits in Chapter 6, due to the need to choose a different reporting year or data definition in Exhibit C.1 to match national-level data to the data presented for various jurisdictions within the country.
Data in Exhibit C.1 is labeled based on the 113 cities featured in Competitive Alternatives 2012. However, it should be noted that all data represent state, provincial, or regional data, unless specifically identified as being city data.
Detailed footnotes to Exhibit C.1 provide further details on data definitions, data sources and reporting dates.
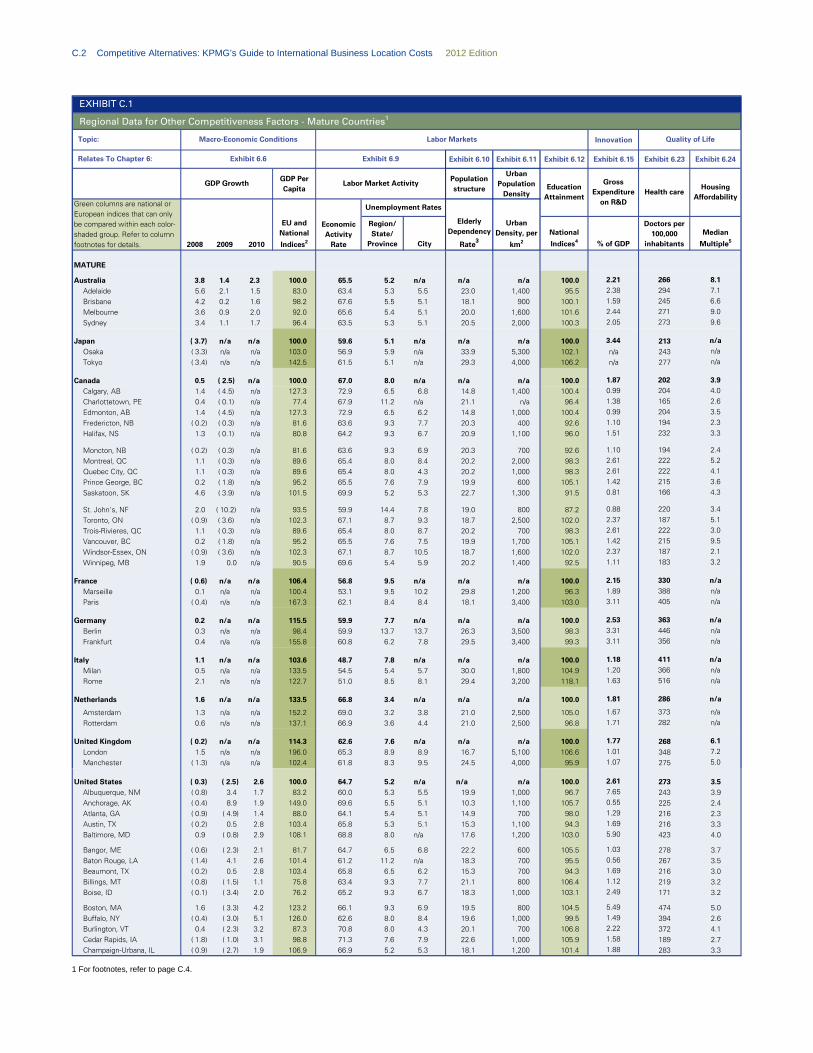
C.2 Competitive Alternatives: KPMG’s Guide to International Business Location Costs 2012 Edition
Innovation
Exhibit 6.10 Exhibit 6.11 Exhibit 6.12 Exhibit 6.15 Exhibit 6.23 Exhibit 6.24
GDP Per Capita
Population structure
Urban Population
Density
Region/ State/
Province City
National
Indices4 % of GDP
Doctors per 100,000
inhabitants
Median
Multiple5
MATURE
Australia 3.8 1.4 2.3 100.0 65.5 5.2 n/a n/a n/a 100.0 2.21 266 8.1
Adelaide 5.6 2.1 1.5 83.0 63.4 5.3 5.5 23.0 1,400 95.5 2.38 294 7.1
Brisbane 4.2 0.2 1.6 98.2 67.6 5.5 5.1 18.1 900 100.1 1.59 245 6.6
Melbourne 3.6 0.9 2.0 92.0 65.6 5.4 5.1 20.0 1,600 101.6 2.44 271 9.0
Sydney 3.4 1.1 1.7 96.4 63.5 5.3 5.1 20.5 2,000 100.3 2.05 273 9.6
Japan ( 3.7) n/a n/a 100.0 59.6 5.1 n/a n/a n/a 100.0 3.44 213 n/a
Osaka ( 3.3) n/a n/a 103.0 56.9 5.9 n/a 33.9 5,300 102.1 n/a 243 n/a
Tokyo ( 3.4) n/a n/a 142.5 61.5 5.1 n/a 29.3 4,000 106.2 n/a 277 n/a
Canada 0.5 ( 2.5) n/a 100.0 67.0 8.0 n/a n/a n/a 100.0 1.87 202 3.9
Calgary, AB 1.4 ( 4.5) n/a 127.3 72.9 6.5 6.8 14.8 1,400 100.4 0.99 204 4.0
Charlottetown, PE 0.4 ( 0.1) n/a 77.4 67.9 11.2 n/a 21.1 n/a 96.4 1.38 165 2.6
Edmonton, AB 1.4 ( 4.5) n/a 127.3 72.9 6.5 6.2 14.8 1,000 100.4 0.99 204 3.5
Fredericton, NB ( 0.2) ( 0.3) n/a 81.6 63.6 9.3 7.7 20.3 400 92.6 1.10 194 2.3
Halifax, NS 1.3 ( 0.1) n/a 80.8 64.2 9.3 6.7 20.9 1,100 96.0 1.51 232 3.3
Moncton, NB ( 0.2) ( 0.3) n/a 81.6 63.6 9.3 6.9 20.3 700 92.6 1.10 194 2.4
Montreal, QC 1.1 ( 0.3) n/a 89.6 65.4 8.0 8.4 20.2 2,000 98.3 2.61 222 5.2
Quebec City, QC 1.1 ( 0.3) n/a 89.6 65.4 8.0 4.3 20.2 1,000 98.3 2.61 222 4.1
Prince George, BC 0.2 ( 1.8) n/a 95.2 65.5 7.6 7.9 19.9 600 105.1 1.42 215 3.6
Saskatoon, SK 4.6 ( 3.9) n/a 101.5 69.9 5.2 5.3 22.7 1,300 91.5 0.81 166 4.3
St. John's, NF 2.0 ( 10.2) n/a 93.5 59.9 14.4 7.8 19.0 800 87.2 0.88 220 3.4
Toronto, ON ( 0.9) ( 3.6) n/a 102.3 67.1 8.7 9.3 18.7 2,500 102.0 2.37 187 5.1
Trois-Rivieres, QC 1.1 ( 0.3) n/a 89.6 65.4 8.0 8.7 20.2 700 98.3 2.61 222 3.0
Vancouver, BC 0.2 ( 1.8) n/a 95.2 65.5 7.6 7.5 19.9 1,700 105.1 1.42 215 9.5
Windsor-Essex, ON ( 0.9) ( 3.6) n/a 102.3 67.1 8.7 10.5 18.7 1,600 102.0 2.37 187 2.1
Winnipeg, MB 1.9 0.0 n/a 90.5 69.6 5.4 5.9 20.2 1,400 92.5 1.11 183 3.2
France ( 0.6) n/a n/a 106.4 56.8 9.5 n/a n/a n/a 100.0 2.15 330 n/a
Marseille 0.1 n/a n/a 100.4 53.1 9.5 10.2 29.8 1,200 96.3 1.89 388 n/a
Paris ( 0.4) n/a n/a 167.3 62.1 8.4 8.4 18.1 3,400 103.0 3.11 405 n/a
Germany 0.2 n/a n/a 115.5 59.9 7.7 n/a n/a n/a 100.0 2.53 363 n/a
Berlin 0.3 n/a n/a 98.4 59.9 13.7 13.7 26.3 3,500 98.3 3.31 446 n/a
Frankfurt 0.4 n/a n/a 155.8 60.8 6.2 7.8 29.5 3,400 99.3 3.11 356 n/a
Italy 1.1 n/a n/a 103.6 48.7 7.8 n/a n/a n/a 100.0 1.18 411 n/a
Milan 0.5 n/a n/a 133.5 54.5 5.4 5.7 30.0 1,800 104.9 1.20 366 n/a
Rome 2.1 n/a n/a 122.7 51.0 8.5 8.1 29.4 3,200 118.1 1.63 516 n/a
Netherlands 1.6 n/a n/a 133.5 66.8 3.4 n/a n/a n/a 100.0 1.81 286 n/a
Amsterdam 1.3 n/a n/a 152.2 69.0 3.2 3.8 21.0 2,500 105.0 1.67 373 n/a
Rotterdam 0.6 n/a n/a 137.1 66.9 3.6 4.4 21.0 2,500 96.8 1.71 282 n/a
United Kingdom ( 0.2) n/a n/a 114.3 62.6 7.6 n/a n/a n/a 100.0 1.77 268 6.1
London 1.5 n/a n/a 196.0 65.3 8.9 8.9 16.7 5,100 106.6 1.01 348 7.2
Manchester ( 1.3) n/a n/a 102.4 61.8 8.3 9.5 24.5 4,000 95.9 1.07 275 5.0
United States ( 0.3) ( 2.5) 2.6 100.0 64.7 5.2 n/a n/a n/a 100.0 2.61 273 3.5Albuquerque, NM ( 0.8) 3.4 1.7 83.2 60.0 5.3 5.5 19.9 1,000 96.7 7.65 243 3.9Anchorage, AK ( 0.4) 8.9 1.9 149.0 69.6 5.5 5.1 10.3 1,100 105.7 0.55 225 2.4Atlanta, GA ( 0.9) ( 4.9) 1.4 88.0 64.1 5.4 5.1 14.9 700 98.0 1.29 216 2.3Austin, TX ( 0.2) 0.5 2.8 103.4 65.8 5.3 5.1 15.3 1,100 94.3 1.69 216 3.3Baltimore, MD 0.9 ( 0.8) 2.9 108.1 68.8 8.0 n/a 17.6 1,200 103.0 5.90 423 4.0
Bangor, ME ( 0.6) ( 2.3) 2.1 81.7 64.7 6.5 6.8 22.2 600 105.5 1.03 278 3.7Baton Rouge, LA ( 1.4) 4.1 2.6 101.4 61.2 11.2 n/a 18.3 700 95.5 0.56 267 3.5Beaumont, TX ( 0.2) 0.5 2.8 103.4 65.8 6.5 6.2 15.3 700 94.3 1.69 216 3.0Billings, MT ( 0.8) ( 1.5) 1.1 75.8 63.4 9.3 7.7 21.1 800 106.4 1.12 219 3.2Boise, ID ( 0.1) ( 3.4) 2.0 76.2 65.2 9.3 6.7 18.3 1,000 103.1 2.49 171 3.2
Boston, MA 1.6 ( 3.3) 4.2 123.2 66.1 9.3 6.9 19.5 800 104.5 5.49 474 5.0Buffalo, NY ( 0.4) ( 3.0) 5.1 126.0 62.6 8.0 8.4 19.6 1,000 99.5 1.49 394 2.6Burlington, VT 0.4 ( 2.3) 3.2 87.3 70.8 8.0 4.3 20.1 700 106.8 2.22 372 4.1Cedar Rapids, IA ( 1.8) ( 1.0) 3.1 98.8 71.3 7.6 7.9 22.6 1,000 105.9 1.58 189 2.7Champaign-Urbana, IL ( 0.9) ( 2.7) 1.9 106.9 66.9 5.2 5.3 18.1 1,200 101.4 1.88 283 3.3
EXHIBIT C.1
Regional Data for Other Competitiveness Factors - Mature Countries1
Macro-Economic Conditions
Exhibit 6.6 Exhibit 6.9
Topic:
Relates To Chapter 6:
Labor Market Activity
Quality of Life
GDP Growth
EU and National
Indices2
Economic Activity
Rate
Gross Expenditure
on R&DHealth care
Housing Affordability
Education Attainment
Unemployment Rates
2008 2010
Urban Density, per
km2
Green columns are national or European indices that can only be compared within each color-shaded group. Refer to column footnotes for details. 2009
Labor Markets
Elderly Dependency
Rate3
1 For footnotes, refer to page C.4.

www.competitivealternatives.com C.3
Innovation
Exhibit 6.10 Exhibit 6.11 Exhibit 6.12 Exhibit 6.15 Exhibit 6.23 Exhibit 6.24
GDP Per Capita
Population structure
Urban Population
Density
Region/ State/
Province City
National
Indices4 % of GDP
Doctors per 100,000
inhabitants
Median
Multiple5
MATURE (cont'd)
United States (cont'd) ( 0.3) ( 2.5) 2.6 100.0 64.7 5.2 n/a n/a n/a 100.0 2.61 273 3.5
Charleston, WV n/a 2.8 4.0 71.3 54.5 14.4 7.8 23.5 600 97.2 1.32 236 3.1Cheyenne, WY 5.5 9.8 (0.3) 144.0 70.5 8.7 9.3 18.2 900 107.3 0.40 187 3.5Chicago, IL ( 0.9) ( 2.7) 1.9 106.9 66.9 8.0 8.7 18.1 1,500 101.4 1.88 283 3.6Cincinnati, OH ( 1.6) ( 4.2) 2.1 87.2 65.2 7.6 7.5 20.5 900 102.7 2.16 271 2.5Cleveland, OH ( 1.6) ( 4.2) 2.1 87.2 65.2 8.7 10.5 20.5 1,100 102.7 2.16 271 2.5
Dallas-Fort Worth, TX ( 0.2) 0.5 2.8 103.4 65.8 5.4 5.9 15.3 1,100 94.3 1.69 216 2.7Denver, CO 1.9 ( 0.5) 1.4 110.0 69.8 9.5 n/a 15.0 1,500 104.3 2.29 260 3.9Detroit, MI ( 4.3) ( 5.0) 2.9 82.5 62.0 9.5 10.2 19.3 1,200 103.4 4.13 258 2.5Fargo, ND 8.2 2.0 7.1 109.4 73.0 8.4 8.4 21.9 1,200 106.0 1.61 250 3.1Gulfport-Biloxi, MS 1.4 ( 2.5) 1.1 69.2 58.6 7.7 n/a 19.2 600 94.6 0.84 179 3.2
Hartford, CT ( 0.7) ( 1.8) 3.1 139.5 68.4 13.7 13.7 20.3 700 103.9 5.01 380 3.6Honolulu, HI 0.8 ( 3.7) 1.8 102.7 63.0 6.2 7.8 22.1 1,800 106.2 1.00 371 8.5Houston, TX ( 0.2) 0.5 2.8 103.4 65.8 7.8 n/a 15.3 1,100 94.3 1.69 216 2.9Indianapolis, IN ( 1.7) ( 4.1) 4.6 89.3 63.8 5.4 5.7 19.1 900 100.9 2.32 217 2.4Jackson, MS 1.4 ( 2.5) 1.1 69.2 58.6 8.5 8.1 19.2 700 94.6 0.84 179 3.2
Las Vegas, NV ( 3.4) ( 6.7) (0.2) 97.4 65.6 5.1 n/a 17.0 1,800 98.0 0.69 188 2.6Lexington, KY 0.4 ( 1.9) 3.2 78.6 61.3 5.9 n/a 19.7 1,400 96.2 0.94 234 3.1Little Rock, AR ( 0.1) ( 1.5) 2.3 74.2 60.5 5.1 n/a 21.8 700 96.9 0.75 204 2.9Los Angeles, CA ( 0.1) ( 3.7) 1.8 109.5 64.3 3.4 n/a 16.5 2,400 95.1 4.25 271 5.9Madison, WI ( 1.1) ( 2.8) 2.5 91.8 69.4 3.2 3.8 19.7 1,100 105.2 2.08 262 3.8
Manchester, NH ( 0.1) ( 1.7) 1.3 97.9 70.3 3.6 4.4 18.7 800 106.7 4.25 289 3.6Miami, FL ( 3.4) ( 3.7) 1.4 84.4 61.7 7.6 n/a 26.9 1,700 99.9 0.87 252 4.7Minneapolis, MN 1.4 ( 2.9) 3.2 108.2 71.4 8.9 8.9 18.4 1,000 106.9 2.55 297 2.9Mobile, AL ( 0.1) ( 3.0) 2.0 76.1 59.8 8.3 9.5 20.7 600 96.1 2.87 218 3.2Montgomery, AL ( 0.1) ( 3.0) 2.0 76.1 59.8 9.6 n/a 20.7 800 96.1 2.87 218 3.0
Nashville, TN 0.1 ( 4.4) 3.5 85.0 62.6 8.5 8.8 19.7 700 97.9 1.56 266 2.9New Orleans, LA ( 1.4) 4.1 2.6 101.4 61.2 8.0 7.4 18.3 2,000 95.5 0.56 267 3.5New York City, NY ( 0.4) ( 3.0) 5.1 126.0 62.6 10.7 10.2 19.6 1,800 99.5 1.49 394 6.1North Virginia, Metro DC, VA 1.3 ( 0.3) 2.6 112.0 67.6 8.0 7.1 17.7 1,300 101.5 2.85 278 3.8Oklahoma City, OK 2.8 ( 1.0) 1.0 83.8 62.3 7.7 7.9 20.5 900 100.2 0.68 175 3.2
Omaha, NE 0.8 0.6 1.9 102.8 70.9 8.2 7.6 20.6 1,100 105.4 1.16 251 2.6Orlando, FL ( 3.4) ( 3.7) 1.4 84.4 61.7 7.8 7.5 26.9 1,000 99.9 0.87 252 3.3Philadelphia, PA 0.1 ( 1.7) 3.0 94.0 63.2 8.0 10.6 23.0 1,100 103.2 2.40 307 3.8Phoenix, AZ ( 1.8) ( 5.7) 0.7 84.1 63.3 7.7 5.6 20.5 1,400 99.2 2.69 213 2.7Pittsburgh, PA 0.1 ( 1.7) 3.0 94.0 63.2 9.0 9.6 23.0 800 103.2 2.40 307 2.7
Portland, OR 4.2 ( 4.9) 3.4 102.6 65.8 8.5 7.7 19.6 1,300 103.7 2.75 281 4.4Providence, RI ( 2.0) ( 1.8) 2.8 98.7 67.7 8.5 8.4 20.6 900 99.6 2.60 382 4.2Raleigh, NC ( 1.2) ( 2.0) 3.4 94.0 63.5 6.2 5.2 18.3 700 98.6 2.13 257 3.5Riverside-San Bernardino, CA ( 0.1) ( 3.7) 1.8 109.5 64.3 6.1 6.1 16.5 n/a 95.1 4.25 271 3.1Sacramento, CA ( 0.1) ( 3.7) 1.8 109.5 64.3 10.2 9.0 16.5 1,500 95.1 4.25 271 3.2
Saginaw, MI ( 4.3) ( 5.0) 2.9 82.5 62.0 9.0 8.2 19.3 700 103.4 4.13 258 1.6Salem, OR 4.2 ( 4.9) 3.4 102.6 65.8 6.6 7.5 19.6 1,200 103.7 2.75 281 4.0Salt Lake City, UT 0.9 ( 1.5) 1.7 87.4 69.0 10.2 10.2 13.9 1,500 105.6 2.24 212 3.8San Diego, CA ( 0.1) ( 3.7) 1.8 109.5 64.3 10.1 9.7 16.5 1,300 95.1 4.25 271 6.2San Francisco, CA ( 0.1) ( 3.7) 1.8 109.5 64.3 10.1 9.2 16.5 2,100 95.1 4.25 271 7.2
Seattle, WA 1.0 ( 2.4) 1.6 107.4 67.5 8.0 8.3 17.4 1,100 104.4 4.99 271 5.0Shreveport, LA ( 1.4) 4.1 2.6 101.4 61.2 8.7 9.0 18.3 700 95.5 0.56 267 3.7Sioux Falls, SD 6.8 0.6 2.2 104.9 70.9 12.2 13.5 22.2 1,000 104.5 0.66 224 2.7Spartanburg, SC ( 1.2) ( 3.5) 2.6 73.9 60.5 3.8 4.1 19.9 400 98.0 1.31 228 3.2Spokane, WA 1.0 ( 2.4) 1.6 107.4 67.5 10.9 9.0 17.4 900 104.4 4.99 271 3.9
St. Louis, MO 1.4 ( 3.8) 1.4 85.6 65.3 9.2 9.2 20.5 1,000 101.4 1.61 247 2.6Tampa, FL ( 3.4) ( 3.7) 1.4 84.4 61.7 7.0 5.6 26.9 1,000 99.9 0.87 252 3.1Trenton, NJ 0.2 ( 3.9) 2.5 117.7 66.4 8.0 8.5 19.7 n/a 102.9 4.28 315 4.0Wichita, KS 1.1 ( 3.1) 2.1 94.2 69.7 10.6 9.2 19.8 900 104.5 1.62 228 2.5Wilmington, DE ( 4.8) 2.1 1.3 147.5 61.7 10.9 8.4 20.9 1,100 101.9 2.72 246 3.8Youngstown, OH ( 1.6) ( 4.2) 2.1 87.2 65.2 14.4 15.2 20.5 700 102.7 2.16 271 1.7
Education Attainment
GDP Growth Labor Market Activity
Economic Activity
Rate
Unemployment RatesGreen columns are national or European indices that can only be compared within each color-shaded group. Refer to column footnotes for details. 2008 2010
EU and National
Indices2
Elderly Dependency
Rate3
EXHIBIT C.1 (Cont'd)
Regional Data for Other Competitiveness Factors – Mature Countries1
Gross Expenditure
on R&DHealth care
Housing Affordability
Relates To Chapter 6:
Quality of Life
2009
Exhibit 6.6 Exhibit 6.9
Topic: Macro-Economic Conditions Labor Markets
Urban Density, per
km2
1 For footnotes, refer to page C.4.

C.4 Competitive Alternatives: KPMG’s Guide to International Business Location Costs 2012 Edition
Innovation
Exhibit 6.10 Exhibit 6.11 Exhibit 6.12 Exhibit 6.15 Exhibit 6.23 Exhibit 6.24
GDP Per Capita
Population structure
Urban Population
Density
2009
Region/ State/
Province City
National
Indices4 % of GDP
Doctors per 100,000
inhabitants
Median
Multiple5
HIGH GROWTH
Brazil 13.9 13.9 13.9 100.0 n/a n/a n/a n/a n/a n/a n/a n/a n/a
Belo Horizonte 17.1 17.1 17.1 89.0 n/a n/a n/a 10.7 5,800 n/a n/a n/a n/a
Sao Paulo 11.1 11.1 11.1 153.0 n/a n/a n/a 8.4 7,000 n/a n/a n/a n/a
China 9.6 9.6 9.6 100.0 n/a n/a n/a n/a n/a n/a n/a n/a 9.8Chengdu 11.0 11.0 11.0 81.3 n/a n/a n/a 17.3 5,400 n/a n/a n/a 7.6Shanghai 9.7 9.7 9.7 171.8 n/a n/a n/a 18.0 6,400 n/a n/a n/a 12.0
India 6.4 6.4 6.4 100.0 n/a n/a n/a n/a n/a n/a n/a n/a n/a
Chennai 6.4 6.4 6.4 138.8 n/a n/a n/a n/a 12,500 n/a n/a n/a n/a
Mumbai 7.7 7.7 7.7 170.3 n/a n/a n/a n/a 27,100 n/a n/a n/a n/a
Mexico 1.5 1.5 1.5 100.0 n/a n/a n/a n/a n/a n/a n/a n/a n/a
Mexico City 0.9 0.9 0.9 204.7 n/a n/a n/a 17.9 9,700 n/a n/a n/a n/a
Monterrey 1.6 1.6 1.6 184.0 n/a n/a n/a 13.1 4,400 n/a n/a n/a n/a
Russia 5.7 5.7 5.7 100.0 n/a n/a n/a n/a n/a n/a n/a n/a n/a
Moscow 7.7 7.7 7.7 300.6 n/a n/a n/a 19.4 3,000 n/a n/a n/a n/a
Saint Petersburg 9.3 9.3 9.3 142.0 n/a n/a n/a 20.5 3,800 n/a n/a n/a n/a
Regional Data for Other Competitiveness Factors – High Growth Countries1
Topic: Macro-Economic Conditions Labor Markets Quality of Life
Health careHousing
Affordability Green columns are national or European indices that can only be compared within each color-shaded group. Refer to column footnotes for details. 2008 2010
EU and National
Indices2
Economic Activity
Rate
Unemployment Rates
Elderly Dependency
Rate3
Urban Density, per
km2
Education Attainment
Gross Expenditure
on R&D
Relates To Chapter 6: Exhibit 6.6 Exhibit 6.9
GDP Growth Labor Market Activity
EXHIBIT C.1 (Cont'd)
1 For footnotes, see below.
Summary Footnotes for Exhibit C.1 1 Refer to the following section "Detailed Data Source Notes for Exhibit C.1" for full data definitions, data sources and reporting dates.
2 Indices represent a measure of GDP per capita for the region/state/province where each city is located relative to the national GDP per capita of its country (national GDP per
capita = 100). In the case of the European countries, the EU-27 average was used for GDP per capita (EU-27 GDP per capita=100). Indices can only be compared between jurisdictions within each country and not between the countries (except within the EU in the case of GDP per capita measure).
3 Represents a ratio of population 65 and over to the working age population (15-64).
4 Indices represent a measure of education attainment (high school completion) for the region/state/province where each city is located relative to the national level of education
attainment (national education attainment rate = 100). Indices can only be compared between jurisdictions within each country. Indices cannot be compared between countries, due to different age cut-offs for measuring attainment.
5 Housing affordability median multiple: median house price (apartment price in China) as a multiple of median household income.
Detailed Data Source Notes for Exhibit C.1
GDP growth and GDP per capita
Data are reported separately for 2008, 2009 and 2010, as available for each location.
Australia Australian Bureau of Statistics, Australian National Accounts: State Accounts, Table 1: Gross state product, chain volume measures and current prices, (reporting
chain volume measures, and 2010 data for GDP per capita).
Canada Statistics Canada, Table: Real gross domestic product (expenditure based), by province and territory, chained (2002) dollars, and, British Columbia Statistics,
Economic Statistics Report, October 2011, Table: Provincial GDP per capita for Canada and Provinces (reporting 2009 data, chained (2002) dollars).
Europe Eurostat. Table: Gross Domestic Product (GDP) at current market prices at NUTS level 2 (purchasing power standard , reporting data for GDP per inhabitant for
2008). NUTS 2 level for all regions except: Berlin, Paris, London (NUTS 1).
Japan Statistics Bureau Japan, Japan Statistical Yearbook 2012, Prefectural Accounts. Table: Economic Growth and Prefectural Income per Capita (FY.2005-2008). GDP
growth is reported at constant prices.
United States US Bureau of Economic Analysis, News Release: GDP by State, June 2011. Table 1: Real GDP by state, 2007-2010 (advance data for 2010), and, Regional Data,
Gross Domestic Product by State, Table: Per capita real GDP by state, 2007-2010, (reporting 2008 data).
Brazil Instituto Brasileiro de Geografia e Estatística (IBGE), Tabela 1 - Produto Interno Bruto a preços correntes e Produto Interno Bruto per capita, segundo as Grandes
Regiões, as Unidades da Federação e os municípios - 2004-2008 (current prices).
China China Statistics, China Statistical Yearbook 2010, Tables: Indices of Gross Domestic Product, Gross Regional Product and Indices, and, Per Capita Income of
Urban Households by Sources and Region (reporting 2009 data).
India Indian Reserve Bank, Handbook of Statistics on Indian Economy 2010-2011, GDP growth derived from tables: Macro-Economic Aggregates (Net Domestic
Product at Factor Cost, at Constant Prices), Net State Domestic Product at Factor Cost – State-Wise (At Constant Prices). Per Capita Net State Domestic Product at
Factor Cost – State-Wise (at Constant Prices, reporting 2009-2010 data).

www.competitivealternatives.com C.5
Mexico Instituto Nacional de Estadística, Geografía e Informática (INEGI). Table used to derive GDP growth rate: GDP at 2003 prices, Mexico, Nuevo León, Distrito
Federal. Regional Economic Statistics, Regional GDP per Capita, national currency, constant prices (reporting 2008 data).
Russia Federal State Statistics Service, Central Statistical Database, Tables: Indices of physical volumes of gross regional product, percentage, annual indices. Gross
Regional per Capita Income, annual data (reporting 2009 data).
Elderly dependency rate
All states/provinces/regions in mature economies
and Mexico OECD, regional data, Table: Ratio between population aged 65 and more and population aged 15-64, (reporting 2008 data).
Brazil IBGE, Calculated from table: População residente, por situação do domicílio, sexo e grupos de idade – Sinopse, (reporting 2010 data for metropolitan regions).
China China Statistics, China Statistical Yearbook 2010, Table: Age Composition and Dependency Ratio of Population by Region (2009).
Russia Federal State Statistics Service, Central Statistical Database, Calculated from table: Current population by age groups, total population as of January 1 (reporting
metropolitan data for 2010). Urban Density All cities Demographia. World Urban Areas (World Agglomerations), 2011. Table: Urban areas by Geography. Population per square kilometer. Unemployment and economic activity rates
Australia Australian Bureau of Statistics, Labour Force, Australia, Detailed, Table: Labour force status by State, Capital city / Balance of state and Sex, (reporting 2010 data).
Canada Statistics Canada. National and provincial unemployment and participation rates, table: Labour force, employed and unemployed, numbers and rates, by province,
(reporting 2010 data).City unemployment rates, table: Labour force characteristics, unadjusted, by census metropolitan area, (3 month moving average). Reporting October 2010 data. Prince George data: British Columbia Statistics, Labour Force Activity by Selected B.C. Cities, reporting 2010 data.
Europe Eurostat. National and regional economic activity rates, Table: Economic activity rates by sex and age, NUTS levels 1 and 2 (%), (reporting 2009 data, annual). NUTS 2 level for all regions except: Berlin, Paris, London (NUTS1). Regional and city level unemployment rates, Table: Unemployment rates by sex and age at
NUTS levels 1,2 and 3. NUTS 3 level for all except: Berlin, Paris, London (NUTS1), Manchester (NUTS2), (reporting 2009 data).
Japan Portal of Official Statistics of Japan, Labour Force Survey 2010, Table 1. National unemployment and participation rates: Population of 15 years old or more by
labour force status, agri-/non-agriculture, status in employment (employee by number of persons engaged in enterprise), (reporting 2010 data). Prefectural rates:
Population of 15 years old or more by age, labour force status, marital status, status in employment and industries (reporting 2010 data).
United States U.S. Department of Labor, Bureau of Labor Statistics. National and state participation and unemployment data: Labor Force Survey 2010, Current Population
Survey, table: Employment Status of the civilian non-institutional population by age, sex and race. Data is on population aged 16 and over, (reporting data for 2010 Unemployment data at city level: Local Area Unemployment Statistics, Table: Unemployment rates for metropolitan areas, annual average rankings (reporting 2010
data). Education attainment
While reporting years for this data vary between 2000 and 2010, changes in education attainment across the entire adult population occur slowly over time. Ages used to define adult population differ among countries.
Australia Australian Bureau of Statistics, Education and Work, 2010. Table: Persons aged 15-64 years, Level of highest educational attainment, by state or territory of usual
residence and sex.
Canada Statistics Canada, Derived from Table: Population 15 years and over by highest degree, certificate or diploma, by province and territory, (reporting 2006 Census
data).
Europe Eurostat. Table: Persons aged 25-64 and 20-24 with upper secondary or tertiary education attainment, by sex and NUTS 2 level. Data at NUTS2 level, except
Berlin, Paris and London (NUTS1), (reporting 2010).
Japan Statistics Bureau Japan, 2000 Population of Japan, Table: Population 15 Years of Age and Over by School Attendance and Type of Last School Completed and Sex
- Japan and Prefectures: 1990 to 2000, (reporting 2000 data).
United States US Census Bureau, 2008-2010 American Community Survey, 3 year estimates, Table: Sex by age by educational attainment for the population 18 years and over ,
(reporting data nationally and by state). Gross expenditure on R&D
Reporting years for this data for all countries are relatively close, being between 2005 and 2008.
Australia Australian Bureau of Statistics, Research and Experimental Development, All Sector Summary, GERD as proportion of GDP and GSP, (reporting 2008-2009 data).
Canada Statistics Canada. Calculated from tables: Domestic spending on research and development (GERD), performing sector, by province, and, Gross domestic product,
expenditure-based, by province and territory, (reporting 2008 data).
Europe Eurostat. Table: Total intramural R&D expenditure (GERD) by sector of performance and region. Data is based on NUTS 2 regions except: Berlin, Paris & London
(NUTS 1 used), (reporting 2008 data for the UK regions, 2007 data for the German, Italian and the Netherlands regions and 2004 data for the French regions).
Japan OECD, Science, Technology and Industry Scoreboard 2011. Figure: R&D in OECD and non-OECD countries, 2009.
United States National Science Board. 2012. Science and Engineering Indicators 2012. Arlington VA: National Science Foundation (NSB 12-01). State Indicators, table: R&D as a
percentage of gross domestic product, by state: 2000, 2004, and 2008.

C.6 Competitive Alternatives: KPMG’s Guide to International Business Location Costs 2012 Edition
Housing affordability median multiple
Data for cities in Australia, Canada, United Kingdom and United States:
Demographia, 7th Annual International Housing Affordability Survey, 2011 (reporting data for Quarter 3, 2010).
Affordability for Prince George in Canada was calculated using median household income data from British Columbia Statistics, 2006 Census Profile Summary
Version, Prince George, CA, and, average house price for British Columbia Northern from British Columbia Real Estate Association, Housing Forecast Update,
January 2012.
For several cities in the United States which were not reported in the Demographia survey, proxy data has been used from reported cities with closest geographical/size characteristics or calculated, as follows:
Data for Philadelphia (PA) has been used as a substitute for Wilmington (DE); Washington (DC-VA-MD-WV) as substitute for North Virginia (metro DC); Colorado Springs (CO) as substitute for Cheyenne (WY); Manchester (NH) as substitute for Burlington (VT); Boise (ID) as substitute for Billings (MT); Portland (ME) as
substitute for Bangor (ME).
Data for cities in China:
J.P.Morgan, Asia Pacific Equity Research, Asian Property Yardstick, 2010. Reporting estimates for 2010. Number of doctors per 100,000 inhabitants
Australia Australian Bureau of Statistics, Australian Social Trends Data Cube, Table: Health, State Summary 2009, (reporting 2006 data).
Canada Canadian Institute for Health Information, Health Indicators 2011, (reporting 2009 data).
Europe Eurostat, Table: Health personnel by NUTS 2 region, (reporting 2008 data for Netherlands, 2009 data for Germany and Italy, 2010 data for France and the United
Kingdom. NUTS 2 level for all regions except Berlin, Frankfurt, London, Manchester and Paris, which are reported at NUTS 1 level.
Japan Ministry of Health, Labor and Welfare, Japan. Health Statistics in Japan 2010, table: Number of physicians practicing in health care facilities per 100,000 population
by prefecture, 2008.
United States U.S. Census Bureau, Statistical Abstract of the United States: 2012. Table: Active physicians and nurses, by state: 2009.
B. Data Source Notes
Set out below are detailed data sources and notes for the other competitiveness factor data presented in Chapter 6. Notes are categorized based upon the corresponding Exhibit numbers in Chapter 6. Exhibit 6.2, Site selection factors, by indicated frequency of importance, and
Exhibit 6.3, Quality of life factors, by indicated frequency of importance
Area Development (www.areadevelopment.com), Site and Facility Planning, 26th Annual Corporate Survey, 2011 and 24th Annual Corporate Survey, 2009.
Exhibit 6.4, Indices of Overall Economic Competitiveness, 2011
World Competitiveness Yearbook (WCY) copyright © 2011, IMD International, Switzerland, World Competitiveness Center, www.imd.ch/wcc.
The Global Competitiveness Report, The Global Competitiveness Index (GCI), World Economic Forum, Switzerland 2011-2012.
Exhibit 6.5, Positions in the Global Economy
Share of World GDP Calculated from the International Monetary Fund (IMF), World Economic Outlook database, September 2011 edition, current prices.
Share of World Exports Calculated from the United Nations Conference on Trade and Development (UNCTAD) Statistics, Exports and imports of merchandise and
services, annual, 1980-2010. Total merchandise trade, exports, current prices.
Share of World FDI Inflows Calculated from UNCTAD, FDI/TNC database, FDI inflows, by region and economy, 1990-2010.
Share of World FDI Outflows Calculated from UNCTAD, FDI/TNC database, FDI outflows, by region and economy, 1990-2010.
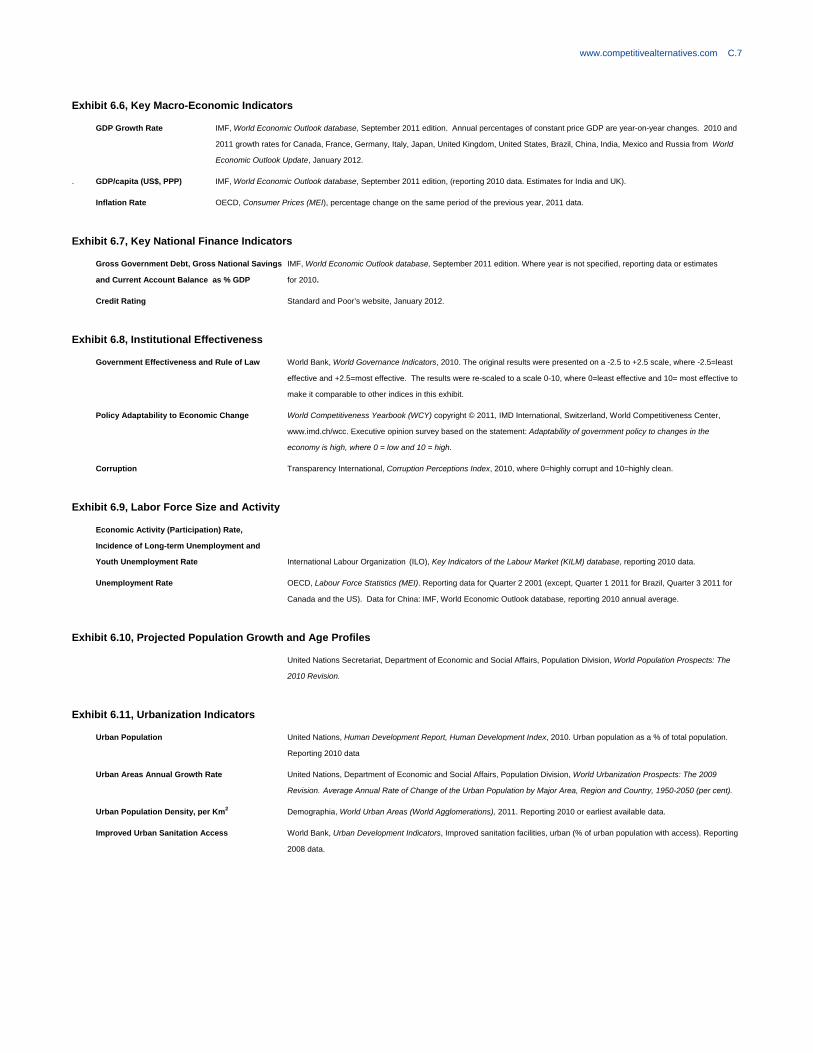
www.competitivealternatives.com C.7
Exhibit 6.6, Key Macro-Economic Indicators
GDP Growth Rate IMF, World Economic Outlook database, September 2011 edition. Annual percentages of constant price GDP are year-on-year changes. 2010 and
2011 growth rates for Canada, France, Germany, Italy, Japan, United Kingdom, United States, Brazil, China, India, Mexico and Russia from World
Economic Outlook Update, January 2012.
. GDP/capita (US$, PPP) IMF, World Economic Outlook database, September 2011 edition, (reporting 2010 data. Estimates for India and UK).
Inflation Rate OECD, Consumer Prices (MEI), percentage change on the same period of the previous year, 2011 data.
Exhibit 6.7, Key National Finance Indicators
Gross Government Debt, Gross National Savings IMF, World Economic Outlook database, September 2011 edition. Where year is not specified, reporting data or estimates
and Current Account Balance as % GDP for 2010.
Credit Rating Standard and Poor’s website, January 2012.
Exhibit 6.8, Institutional Effectiveness
Government Effectiveness and Rule of Law World Bank, World Governance Indicators, 2010. The original results were presented on a -2.5 to +2.5 scale, where -2.5=least
effective and +2.5=most effective. The results were re-scaled to a scale 0-10, where 0=least effective and 10= most effective to
make it comparable to other indices in this exhibit.
Policy Adaptability to Economic Change World Competitiveness Yearbook (WCY) copyright © 2011, IMD International, Switzerland, World Competitiveness Center,
www.imd.ch/wcc. Executive opinion survey based on the statement: Adaptability of government policy to changes in the
economy is high, where 0 = low and 10 = high.
Corruption Transparency International, Corruption Perceptions Index, 2010, where 0=highly corrupt and 10=highly clean.
Exhibit 6.9, Labor Force Size and Activity
Economic Activity (Participation) Rate,
Incidence of Long-term Unemployment and
Youth Unemployment Rate International Labour Organization (ILO), Key Indicators of the Labour Market (KILM) database, reporting 2010 data.
Unemployment Rate OECD, Labour Force Statistics (MEI). Reporting data for Quarter 2 2001 (except, Quarter 1 2011 for Brazil, Quarter 3 2011 for
Canada and the US). Data for China: IMF, World Economic Outlook database, reporting 2010 annual average.
Exhibit 6.10, Projected Population Growth and Age Profiles
United Nations Secretariat, Department of Economic and Social Affairs, Population Division, World Population Prospects: The
2010 Revision.
Exhibit 6.11, Urbanization Indicators
Urban Population United Nations, Human Development Report, Human Development Index, 2010. Urban population as a % of total population.
Reporting 2010 data
Urban Areas Annual Growth Rate United Nations, Department of Economic and Social Affairs, Population Division, World Urbanization Prospects: The 2009
Revision. Average Annual Rate of Change of the Urban Population by Major Area, Region and Country, 1950-2050 (per cent).
Urban Population Density, per Km2 Demographia, World Urban Areas (World Agglomerations), 2011. Reporting 2010 or earliest available data.
Improved Urban Sanitation Access World Bank, Urban Development Indicators, Improved sanitation facilities, urban (% of urban population with access). Reporting
2008 data.

C.8 Competitive Alternatives: KPMG’s Guide to International Business Location Costs 2012 Edition
Exhibit 6.12, Skills Gap, Education Attainment and Outcomes, Education Expenditure
Employer Difficulty in Filling Skilled Jobs,
% Literacy Rate and ManpowerGroup, Talent Shortage 2011 Survey Results.
Secondary School Attainment United Nations, Human Development Report, Human Development Index, 2010. Adult literacy rate (% ages 15 and older).
Reporting data from 2005-2008. Population with at least secondary education (% ages 25 and older). Reporting data from
2010 or earliest available.
High School Science Skills (PISA Score) OECD, Program for International Student Assessment (PISA) 2009: What Students Know and Can Do: Student Performance in
Reading, Mathematics and Science, Figure 1: Comparing Countries’ and Economies’ Performance. PISA is a system of
international assessments that focus on 15-year-olds' capabilities in reading literacy, mathematics literacy, and science literacy.
The most recent assessment was administered in 2009. OECD Average Score on the science scale=501. Score for China
reflects the results for students from Shanghai only.
Education Expenditure as % GDP OECD, Education at a Glance 2011, (reporting 2008 or latest available data), for all countries. Table: Expenditure on educational
institutions as a percentage of GDP, for all levels of education.
Expenditure per Student as % of GDP per Capita OECD, Education at a Glance 2011, (reporting 2008 or latest available data), for all countries except Canada, Calculated from
Table: Annual expenditure per student by educational institutions relative to GDP per capita. Data for Canada extracted from
table Expenditure on educational institutions per student for all services relative to GDP per capita in 2006 edition of OECD's
Education at a Glance, (reporting 2002 data).
Exhibit 6.13, Tertiary Education Indicators
Tertiary Education Attainment OECD, Education at a Glance 2011, Population with tertiary education (25-64), (reporting 2008 data).
Tertiary Education Access UNESCO Institute of Statistics. Gross enrolment ratio, ISCED 5 and 6, total: total enrolment in a specific level of education,
regardless of age, expressed as a percentage of the eligible official school-age population corresponding to the same level of
education in a given school year. For the tertiary level, the population used is that of the five-year age group following on from
the secondary school leaving. Reporting data from 1999 and 2009 or earliest/latest available.
Tertiary Education Graduates UNESCO Institute of Statistics. Total graduates in all programs, tertiary, total. Reporting data from 1999 and 2009 or
earliest/latest available.
Exhibit 6.14, Labor Market Flexibility Indicators
Union Density OECD, Employment Database, Table: Trade union density (%) (reporting 2010 or latest available data). Data for China: Trade
Unions in China, David Metcalf and Jianwei Li, Discussion Paper No. 708, Centre for Economic Performance, London School of
Economics, 2006. Data for Russia: A Cross-Country Study of Union Membership, David. G. Blanchflower, IZA Discussion
Paper No. 2016, 2006, data 2000-2002. Data for Brazil, The Global State of Workers' Rights, Freedom House, 2010.
Collective Bargaining Coverage For all countries except Mexico: OECD, Working Paper 89, Legislation, collective bargaining and enforcement: updating the
OECD employment protection indicators, Danielle Venn, 2009, (reporting 2007 data). Amsterdam Institute for Advanced Labour
Studies, University of Amsterdam, Database on Institutional Characteristics of Trade Unions, Wage Setting, State Intervention
and Social Pacts in 34 countries between1960 and 2007. Data for Mexico: International Labour Organisation, Industrial
Relations, Employment Strategy Paper Social Dialogue and Employment in Argentina, Brazil and Mexico, 2004, Adalberto
Cardoso (Reporting 1998, 2000, 2003 data).
Employer Flexibility Under Employment OECD, Strictness of Employment Protection (regular employment and temporary employment), (reporting 2009 or 2008 data),
Protection Legislation where 0= least restrictive and 6=most restrictive.

www.competitivealternatives.com C.9
Exhibit 6.15, Innovation Indicators
HRST Workforce as % of Total Employment OECD, Science, Technology and Industry Scoreboard 2011. Figure: HRST occupations, 2010 (OECD notes that HRST for
Japan are likely to be understated due to structural reporting issues). Data for Canada, OECD Science, Technology and
Industry Scoreboard 2009, reporting 2008 data. Data for Mexico: OECD, Briefing Note on Mexico, 2007, (reporting 2004 data),
employment of tertiary level graduates in total employment.
Researchers per 1,000 Employment and OECD, Science, Technology and Industry Scoreboard 2011. Figure: R&D in OECD and non-OECD countries, 2009. Data for
R&D Expenditure as % GDP Brazil, China and India: OECD, OECD in Figures 2009, (reporting 2007 or latest available data).
Capacity for Innovation/ The Global Competitiveness Report, 2011-2012, World Economic Forum, Switzerland 2011-2012. Executive survey question: In
Company Level Innovation your country, how do companies obtain technology? [1 = exclusively from licensing or imitating foreign companies; 7 = by
conducting formal research and pioneering their own new products and processes].
Exhibit 6.16, Leading States/Regions for R&D Expenditure as a Percentage of GDP
Refer to the section above “Detailed Data Source Notes for Exhibit C.1”, under “Gross expenditure on R&D”.
Exhibit 6.17, Indicators of Business Regulatory Environment
Days to Finalize Permitting for a Warehouse World Bank, Doing Business Report 2012, Dealing with Construction Permits sub-index, (reporting 2011 data).
Commercial Real Estate Transparency Index Jones Lang LaSalle, LaSalle Investment Management, Global Real Estate Transparency Index 2010, where 1= strong,
5=weak.
Market Access Index The Global Enabling Trade Report, the Enabling Trade Index 2010, World Economic Forum, Switzerland 2010. Market Access
Subindex measures the extent to which to which the policy framework of the country welcomes foreign goods into the economy
and enables access to foreign markets for its exporters. The original scale where 1= weak and 7 = strong was inverted to
1=strong and 7=weak in order to make it consistent with other scales in Exhibit 6.17.
Ease of Doing Business Ranking World Bank, Doing Business Report 2012, (reporting 2011 data).
Exhibit 6.18, Indicators of Environmental Performance and Regulation
Environmental Performance Index Yale Center for Environmental Law and Policy (YCELP) of Yale University and the Center for International Earth Science
Information Network (CIESIN) of Columbia University, in collaboration with the World Economic Forum and the Joint Research
Centre of the European Commission. 2012. Environmental Performance Index, where 0=low, 100=high.
Environmental Laws and Competitiveness World Competitiveness Yearbook (WCY) copyright © 2011, IMD International, Switzerland, World Competitiveness Center,
www.imd.ch/wcc. Executive opinion survey based on the statement: Environmental laws and compliance do not hinder the
competitiveness of businesses, where 0= hinder, 10= do not hinder. This has been re-scaled to a 0-100 scale in order to make
the results more easily comparable with the Environmental Performance Index.
Exhibit 6.19, Energy Consumption, Self-sufficiency and Efficiency
International Energy Association, Key World Energy Statistics, 2011. Calculated based on energy balances and selected
indicators for 2009, expressed in million tonnes of oil equivalent (mtoe) on a net calorific value basis.
Energy demand forecast data: International Energy Association, World Energy Outlook 2010 Factsheet.
Exhibit 6.20, Indicators of Quality of Infrastructure
ICT Development Index-Access International Telecommunications Union, Measuring the Information Society, 2011, Table, IDI access sub-index. where 1= low
and 10 = high (reporting 2010 data). The original scale where 1= low and 10 = high was rescaled to 0=low and 10=high in
order to make it consistent with the scale of Quality of Distribution Infrastructure indicator.
Quality of Distribution Infrastructure World Competitiveness Yearbook (WCY) copyright © 2011, IMD International, Switzerland, World Competitiveness Center,
www.imd.ch/wcc. Executive opinion survey based on the statement: The distribution infrastructure of goods and services is
generally efficient, where 0=inefficient and 10= efficient.

C.10 Competitive Alternatives: KPMG’s Guide to International Business Location Costs 2012 Edition
Exhibit 6.21, Overall Wellbeing United Nations, Human Development Report, Human Development Index, 2010.
Exhibit 6.22, Crime and Physical Safety
Homicides per 100,000 Population United Nations, International Homicide Data, Intentional Homicide, rate per 100,000 population. Reporting data from 2007 or
2008. For Mexico data have been updated to 2010 to reflect the rapid and significant increase in Mexico’s homicide rate
since 2008. 2010 data sourced from: Instituto Ciudadano De Estudios Sobre La Inseguridad (ICESI), Homicidios Dolosos.
Total Y Por Cada 100 Mil Habitantes. Registro Ante Agencias Del Ministero Publico De Las Entidades Federativas.
Police Reliability and Business Cost of Crime The Global Enabling Trade Report, the Enabling Trade Index 2010, Physical Security Pillar , World Economic Forum,
Switzerland, 2010.
Question regarding reliability of police services: To what extent can police services be relied upon to enforce law and order in
your country? [1 = cannot be relied upon at all; 7 = can always be relied upon].
Question regarding business cost of crime and violence: Does the incidence of crime and violence impose costs on businesses
in our country? [1=significant costs; 7= no costs]
The original scale where 1= negative and 7 = positive was inverted to 1=positive and 7=negative in order to make it consistent
with the scale of Homicides per 100,000 Population indicator.
Exhibit 6.23, Healthcare Indicators
World Health Organisation, World Health Statistics 2011, (reporting data 2000-2010).
Exhibit 6.24, Housing Affordability
Housing Affordability (median multiple) Demographia, International Housing Affordability Survey, 2010. Based on an average of 4 local markets surveyed in
Australia, 16 in Canada, 2 in the UK, 71 in the US using median multiple = median house price/median household income.
Asian Property Yardstick, J.P.Morgan. Household income multiple: Price of a 90 sqm apartment divided by annual household
income. Estimates for 2010. Based on an average of two local markets in China.

www.competitivealternatives.com D.1
Appendix D Selected Bibliography and Sources of Data For the purposes of this study, a wide variety of sources in each city and country were contacted to gather recent and accurate statistical data for input to the industry models. These sources are listed on the following pages. Where only the name of an organization is listed, data were sourced either from the organization’s website or custom prepared reports. Document titles are included where data were sourced from a specific, publicly-available publication.
A. Location, Population, Local Industry, and Transportation
Australia All cities Australian Bureau of Statistics
Adelaide City of Adelaide, Economic Development
Department of Trade and Economic Development, South Australia
Brisbane Brisbane City Council
Brisbane Investment
Site Selection Online
Melbourne City of Melbourne
Melbourne Development Board
Melbourne Port Corporation
Sydney New South Wales Department of State and Regional Development
City of Sydney
Brazil Belo Horizonte Prefeitura Belo Horizonte
São Paulo Business in Sao Paulo Brazil, Economy Foreign Trade Export Opportunities
Canada All Cities Statistics Canada
Belleville-Quinte West City of Belleville; City of Quinte West
Brandon Economic Development Brandon
Manitoba Trade & Investment
Calgary Calgary Economic Development
Charlottetown Innovation PEI
Atlantic Canada Opportunities Agency
Durham Region Durham Region Economic Development & Tourism Department
Edmonton Alberta Treasury Board and Enterprise
Edmonton Economic Development Corporation
Fredericton Enterprise Fredericton
Halifax Greater Halifax Partnership
Kamloops Venture Kamloops
Lethbridge Economic Development Lethbridge
Medicine Hat City of Medicine Hat Business Development Office
Middlesex County Middlesex County Economic Development
Moncton Enterprise Greater Moncton
Atlantic Canada Opportunities Agency
Montreal Montreal International
Investissement Québec

D.2 Competitive Alternatives: KPMG’s Guide to International Business Location Costs 2012 Edition
Moose Jaw City of Moose Jaw
South Central Enterprise Region
Enterprise Saskatchewan
Prince Albert North Central Enterprise Region
Enterprise Saskatchewan
Prince George Initiatives Prince George Development Corporation
Quebec City Québec International
Red Deer City of Red Deer
Regina Regina Regional Opportunities Commission
Saint John Enterprise Saint John
Saskatoon Saskatoon Regional Economic Development Authority
St. John’s Newfoundland and Labrador, Department of Innovation, Business and Rural
Development
City of St. John’s
Atlantic Canada Opportunities Agency
Sydney Enterprise Cape Breton Corporation
Toronto City of Toronto
Trois-Rivières Innovation et Développement économique Trois-Rivières
Truro Colchester Regional Development Agency
Nova Scotia Economic and Rural Development and Tourism
Vancouver Metro Vancouver
Vancouver Economic Commission
Victoria Greater Victoria Development Agency
Windsor-Essex Windsor-Essex Economic Development Corporation
Winnipeg Economic Development Winnipeg Inc.
Manitoba Entrepreneurship, Training & Trade
China Chengdu KPMG China, Offshoring and Outsourcing in Chengdu 2010
Government of Sichuan Province
Shanghai Government of Shanghai Province
France All Cities Institut National de la Statistique et des Études Économiques
Marseille Ville de Marseille
Paris Paris Regional Development Agency
Germany Berlin Berlin Partner GmbH
Frankfurt Frankfurt Economic Development GmbH
India All cities Ministry of Statistics & Programme Implementation
Chennai Chennai Metropolitan Development Authority, Second Master Plan,
September 2008; Chennai City Connect
Mumbai Maharashtra Industrial Development Corporation
City and Industrial Development Corporation of Maharashtra
Italy All Cities Istituto Nazionale di Statistica
Milan Milano Metropoli
Rome Sviluppo Lazio
Japan Osaka City of Osaka
Tokyo Tokyo Metropolitan Government

www.competitivealternatives.com D.3
Mexico All Cities ProMexico
Instituto Nacional de Estadística Geografía e Informática (INEGI)
US Trade Department
Mexico City Government of Distrito Federal
Monterrey Government of the State of Nuevo León
Monterrey Ciudad Internacional del Conocimiento
Monterrey Technology Park
Netherlands All Cities Statistics Netherlands
Amsterdam Amsterdam in Business
Rotterdam Rotterdam Investment Agency
Russia Moscow Moscow International Portal
Saint Petersburg Saint Petersburg Open City
United Kingdom All Cities UK Office for National Statistics
London Government Office for the South East
London Development Agency
South London Chamber of Commerce & Industry
Manchester Manchester City Council Manchester Training and Enterprise Council Manchester Chamber of Commerce and Industry Manchester Business Link Manchester Investment & Development Agency Services
United States All Cities US Census Bureau
InfoUSA
www.city-data.com
Albuquerque City of Albuquerque
Alexandria Louisiana Economic Development
City of Alexandria
Anchorage Anchorage Economic Development Corporation
Atlanta Metro Atlanta Chamber of Commerce
Austin The Greater Austin Chamber of Commerce
Baltimore City of Baltimore
Emerging Technology Centers
Baltimore Development Corporation
Bangor Bangor Region Development Alliance
Baton Rouge East Baton Rouge Parish
Beaumont City Town Info, Beaumont, Texas
Billings City of Billings
Boise Boise Area Chamber of Commerce
Boston Greater Boston Chamber of Commerce
Buffalo Buffalo Niagara Enterprise
Burlington Greater Burlington Industrial Corporation
Cedar Rapids Cedar Rapids Area Chamber of Commerce
Champaign-Urbana Illinois Department of Commerce and Economic Opportunity
Charleston Charleston Area Alliance
Cheyenne The Cheyenne-Laramie County Corporation for Economic Development
Chicago City of Chicago
Cincinnati Cincinnati Ohio Economic Development

D.4 Competitive Alternatives: KPMG’s Guide to International Business Location Costs 2012 Edition
Cleveland City of Cleveland
Dallas-Fort Worth Greater Dallas Chamber
Texas Department of Economic Development
Denver Metro Denver Economic Development Corporation
Detroit Wayne County Economic Development
Fargo Great Fargo Moorhead Economic Development Corporation
Gulfport-Biloxi Harrison County Development Commission
Hartford Greater Hartford Chamber of Commerce
Honolulu City and County of Honolulu, Economic Development
Houma Louisiana Economic Development
Terrebonne Economic Development Authority
Houston Greater Houston Partnership Research Department
Indianapolis Indianapolis Private Industry Council
Jackson Metro Jackson Economic Development Alliance
Lafayette Louisiana Economic Development
Lafayette Economic Development Authority
Lake Charles Louisiana Economic Development
SWLA Chamber-Economic Development Alliance
Las Vegas City of Las Vegas
Las Vegas Chamber of Commerce
Lexington Lexington-Fayette Urban County Government
Little Rock Little Rock Chamber of Commerce
City of Little Rock
Los Angeles Los Angeles County Economic Development
San Gabriel Valley Economic Partnership
Madison City-Data.com
Manchester City of Manchester
Miami City of Miami
Miami Dade County
Minneapolis Greater Minneapolis Chamber of Commerce
Mobile Mobile Area Chamber of Commerce
Monroe Louisiana Economic Development
University of Louisiana at Monroe, Business and Economic Climate of
Monroe and Northeast Louisiana 2010
Montgomery Montgomery Area Chamber of Commerce
Nashville Nashville Area Chamber of Commerce
New Orleans Louisiana Economic Development; City of New Orleans
New York City Hoover’s Online
City of New York
North Virginia (Metro DC) Northern Virginia Economic Development Coalition
Oklahoma City Greater Oklahoma City Chamber of Commerce
Omaha City of Omaha
Omaha Economic Development Corporation
Orlando Metro Orlando Economic Development Commission
Philadelphia Philadelphia Economic Development
Greater Philadelphia Chamber of Commerce
Phoenix Greater Phoenix Chamber of Commerce
Pittsburgh Urban Redevelopment Authority of Pittsburgh
Portland Portland Metropolitan Chamber of Commerce
Providence Rhode Island Economic Development Corporation
Raleigh Greater Raleigh Chamber of Commerce
Research Triangle Park

www.competitivealternatives.com D.5
Riverside-San
Bernardino
California Employment Development Department
Inland Empire Economic Partnership
City of Riverside
City of San Bernardino
Sacramento City of Sacramento
Saginaw City of Saginaw, Assessor’s Office
Salem City of Salem
Salt Lake City City of Salt Lake City
Salt Lake City Chamber of Commerce
San Diego San Diego Regional Economic Development Corporation
San Francisco City and County of San Francisco
San Francisco Center for Economic Development
Seattle Seattle Chamber of Commerce
Economic Development Council of Seattle and King County
Shreveport Shreveport Chamber of Commerce
Sioux Falls Sioux Falls Area Chamber of Commerce
Spartanburg City of Spartanburg
Greater Greenville Chamber of Commerce
Spokane Spokane Area Economic Development Council
Washington State Labor Market Information
St. Louis The Alliance of Edwardsville & Glen Carbon (economic development)
Tampa Greater Tampa Chamber of Commerce
Trenton New Jersey Economic Development Association
Wichita Wichita Office of Economic Development
Wilmington Wilmington Economic Development Corporation
Youngstown Youngstown Warren Regional Chamber
General City Populations Online – http://www.citypopulation.de
Google Maps
The World Factbook, Central Intelligence Agency, 2011
B. Land Prices, Construction Costs, and Facility Lease Costs
All Countries Colliers International
C. Wages and Salaries, Statutory Plans, and Benefits
Wages and Salaries All Countries Mercer (customized report)
Mercer, Total Employment Costs Report 2011
Mercer, Global Compensation Planning Report 2011
North America ERI Economic Research Institute, Salary Assessor Database, 2011 Mercer, Canada and US Geographic Salary Differentials, 2011 Robert Half, Accounting and Finance Salary Guide, Canada and US, 2011
High Growth
Countries
Chengdu Labour & Social Security Bureau Glassdoor.com US Bureau of Labor Statistics, International Comparisons Of Hourly Compensation Costs In Manufacturing, 2010
Statutory Benefits All Countries Mercer, Total Employment Costs Report, 2011

D.6 Competitive Alternatives: KPMG’s Guide to International Business Location Costs 2012 Edition
North America
Tax Facts, KPMG Canada
Canada Revenue Agency
Internal Revenue Service
State Employment and/or Labor Commissions, as required
State/provincial Workers’ Compensation Boards or private insurers, as required
Other Benefits All Countries Mercer, Total Employment Costs Report, 2011
Mercer, Worldwide Benefit and Employment Guidelines, 2011
Canada Hewitt Associates (customized report)
United States US Bureau of Labor Statistics, Employer Costs for Employee Compensation,
June 2011
D. Electricity Costs
Australia Adelaide AGL
Brisbane Energex, Ergon
Melbourne Origin
Sydney Energy Australia
Brazil All Cities OLADE
Belo Horizonte CEMIG
São Paulo AES Electropaulo
Canada Belleville-Quinte West Veridian Connections
Ontario Energy Board
Brandon Manitoba Hydro
Calgary ENMAX
Charlottetown Maritime Electric Company Limited
Durham Region Ontario Energy Board
Oshawa PUC Networks Inc.
Veridian Connections
Whitby Hydro Energy Services
Edmonton EPCOR
Fredericton New Brunswick Power Corporation
Halifax Nova Scotia Power
Kamloops BC Hydro
Lethbridge City of Lethbridge Electric Utility
ENMAX
Medicine Hat City of Medicine Hat Electric Utility
ENMAX
Middlesex County Middlesex Power Corporation
Ontario Energy Board
Moncton New Brunswick Power Corporation
Montreal Hydro Quebec
Moose Jaw SaskPower
Prince Albert SaskPower
Prince George BC Hydro
Quebec City Hydro Quebec
Red Deer ENMAX
Regina SaskPower
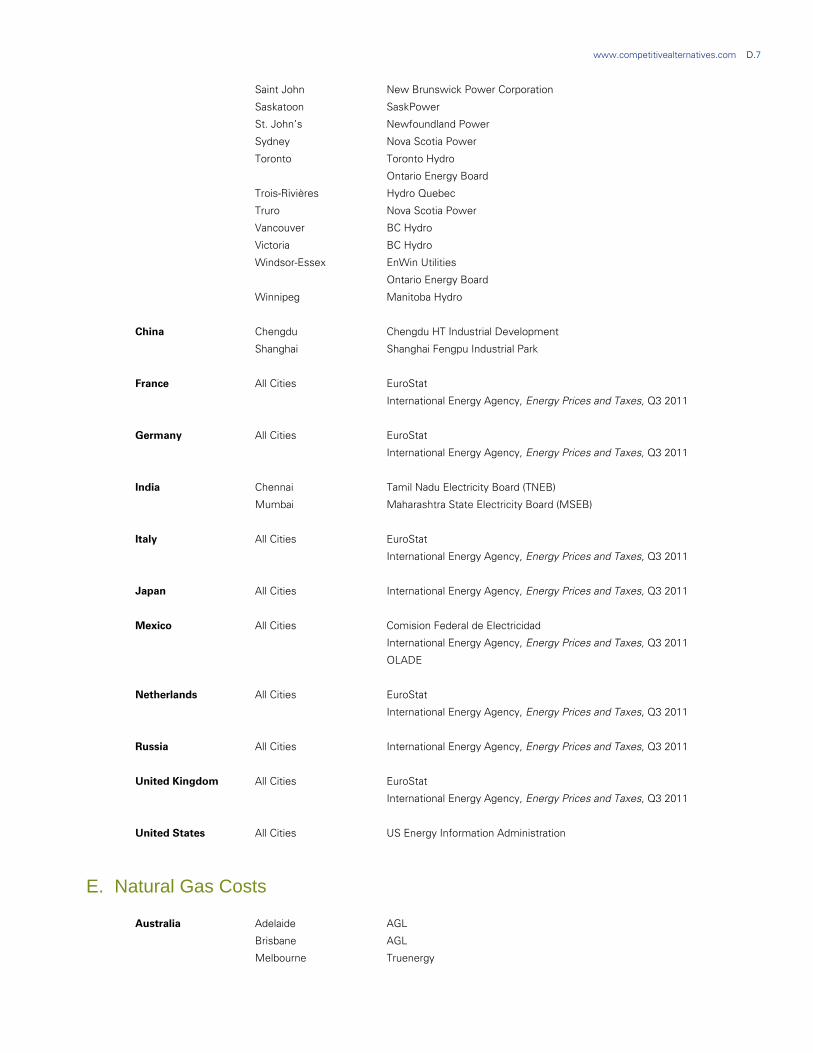
www.competitivealternatives.com D.7
Saint John New Brunswick Power Corporation
Saskatoon SaskPower
St. John’s Newfoundland Power
Sydney Nova Scotia Power
Toronto Toronto Hydro
Ontario Energy Board
Trois-Rivières Hydro Quebec
Truro Nova Scotia Power
Vancouver BC Hydro
Victoria BC Hydro
Windsor-Essex EnWin Utilities
Ontario Energy Board
Winnipeg Manitoba Hydro
China Chengdu Chengdu HT Industrial Development
Shanghai Shanghai Fengpu Industrial Park
France All Cities EuroStat
International Energy Agency, Energy Prices and Taxes, Q3 2011
Germany All Cities EuroStat
International Energy Agency, Energy Prices and Taxes, Q3 2011
India Chennai Tamil Nadu Electricity Board (TNEB)
Mumbai Maharashtra State Electricity Board (MSEB)
Italy All Cities EuroStat
International Energy Agency, Energy Prices and Taxes, Q3 2011
Japan All Cities International Energy Agency, Energy Prices and Taxes, Q3 2011
Mexico All Cities Comision Federal de Electricidad
International Energy Agency, Energy Prices and Taxes, Q3 2011
OLADE
Netherlands All Cities EuroStat
International Energy Agency, Energy Prices and Taxes, Q3 2011
Russia All Cities International Energy Agency, Energy Prices and Taxes, Q3 2011
United Kingdom All Cities EuroStat
International Energy Agency, Energy Prices and Taxes, Q3 2011
United States All Cities US Energy Information Administration
E. Natural Gas Costs
Australia Adelaide AGL
Brisbane AGL
Melbourne Truenergy
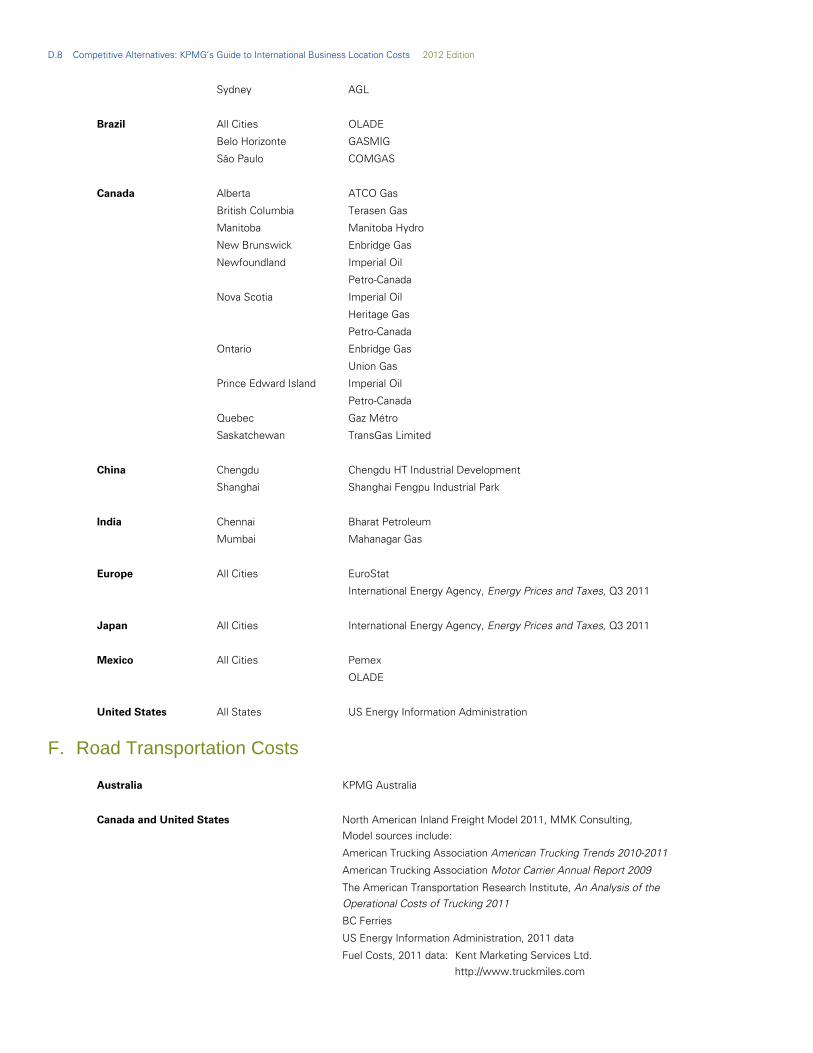
D.8 Competitive Alternatives: KPMG’s Guide to International Business Location Costs 2012 Edition
Sydney AGL
Brazil All Cities OLADE
Belo Horizonte GASMIG
São Paulo COMGAS
Canada Alberta ATCO Gas
British Columbia Terasen Gas
Manitoba Manitoba Hydro
New Brunswick Enbridge Gas
Newfoundland Imperial Oil
Petro-Canada
Nova Scotia Imperial Oil
Heritage Gas
Petro-Canada
Ontario Enbridge Gas
Union Gas
Prince Edward Island Imperial Oil
Petro-Canada
Quebec Gaz Métro
Saskatchewan TransGas Limited
China Chengdu Chengdu HT Industrial Development
Shanghai Shanghai Fengpu Industrial Park
India Chennai Bharat Petroleum
Mumbai Mahanagar Gas
Europe All Cities EuroStat
International Energy Agency, Energy Prices and Taxes, Q3 2011
Japan All Cities International Energy Agency, Energy Prices and Taxes, Q3 2011
Mexico All Cities Pemex
OLADE
United States All States US Energy Information Administration
F. Road Transportation Costs
Australia KPMG Australia
Canada and United States North American Inland Freight Model 2011, MMK Consulting,
Model sources include:
American Trucking Association American Trucking Trends 2010-2011
American Trucking Association Motor Carrier Annual Report 2009
The American Transportation Research Institute, An Analysis of the
Operational Costs of Trucking 2011
BC Ferries
US Energy Information Administration, 2011 data
Fuel Costs, 2011 data: Kent Marketing Services Ltd.
http://www.truckmiles.com

www.competitivealternatives.com D.9
Federation of Tax Administrators
Marine Atlantic
Matson Lines
Transport Canada, Operating Cost of Trucking and Surface Intermodal
Transportation in Canada 2010
Taylor Study, The U.S.-Canada Border: Cost Impacts, Causes, and Short to Long Term Management Options 2003
Worktruckonline.com, Medium Duty Operating Costs Increase in 2008-CY
US Department of Labor, Bureau of Labor Statistics 2010
Cantruck.ca
TransportRoutier.ca
Galaxy Transport Corp. and its agents
Mexico Cosmex International
G. Sea Transportation Costs
All Countries Galaxy Transport Corp. and its agents
H. Air Transportation Costs
All Countries Galaxy Transport Corp. and its agents
I. National and Regional Taxes
Australia All Cities KPMG Australia
Brazil All Cities KPMG Brazil
Canada All Cities KPMG Canada, Tax Facts 2011-2012
Revenue Canada
Provincial Revenue/Tax Departments as required
China All Cities KPMG China
France All Cities Fidal (KPMG France)
Germany All Cities KPMG Germany
India All Cities KPMG India
Italy All Cities K Studio Associate (KPMG Italy)
Japan All Cities KPMG Japan

D.10 Competitive Alternatives: KPMG’s Guide to International Business Location Costs 2012 Edition
Mexico All Cities KPMG Mexico
Cosmex International
Netherlands All Cities KPMG Netherlands
Russia All Cities KPMG Russia
United Kingdom All Cities KPMG United Kingdom
United States All Cities CCH, 2012 State Tax Handbook
State Revenue/Tax Departments as required
Albuquerque State of New Mexico Taxation & Revenue
Alexandria Louisiana Department of Revenue
Anchorage Alaska Department of Revenue
Atlanta Georgia Department of Revenue
Austin Texas Comptroller of Public Accounts
Baltimore Maryland Department of Revenue
Bangor Maine Department of Revenue
Baton Rouge Louisiana Department of Revenue
Beaumont Texas Comptroller of Public Accounts
Billings Montana Department of Revenue
Boise Idaho State Tax Commission
Boston Massachusetts Department of Revenue
Buffalo New York State Department of Taxation and Finance
Burlington Vermont Department of Taxes
Cedar Rapids Iowa Department of Revenue
Champaign-Urbana Illinois Department of Revenue
Charleston West Virginia State Tax Department
Cheyenne Wyoming Department of Revenue
Chicago Illinois Department of Revenue
Cincinnati Ohio Department of Taxation
Cleveland Ohio Department of Taxation
Dallas-Fort Worth Texas Comptroller of Public Accounts
Denver Colorado Department of Revenue
Detroit Michigan Department of Treasury
Fargo North Dakota State Tax Department
Gulfport-Biloxi, MS Missouri Department of Revenue
Hartford State of Connecticut, Department of Revenue Services
Honolulu Hawaii Department of Taxation
Houma Louisiana Department of Revenue
Houston Texas Comptroller of Public Accounts
Indianapolis Indiana Department of Revenue
Jackson Mississippi State Tax Commission
Lafayette Louisiana Department of Revenue
Lake Charles Louisiana Department of Revenue
Las Vegas Nevada Department of Taxation
Lexington Kentucky Department of Revenue
Little Rock Arkansas Department of Finance and Administration
Los Angeles California Franchise Tax Board
Madison Wisconsin Department of Revenue
Manchester New Hampshire Department of Revenue Administration
Miami Florida Department of Revenue

www.competitivealternatives.com D.11
Minneapolis Minnesota Revenue
Mobile Alabama Department of Revenue
Monroe Louisiana Department of Revenue
Montgomery Alabama Department of Revenue
Nashville Tennessee Department of Revenue
New Orleans Louisiana Department of Revenue
New York City New York State Department of Taxation and Finance
North Virginia (Metro DC) Virginia Department of Taxation
Oklahoma City Oklahoma Tax Commission
Omaha Nebraska Department of Revenue
Orlando Florida Department of Revenue
Philadelphia Pennsylvania Department of Revenue
Phoenix Arizona Department of Revenue
Pittsburgh Pennsylvania Department of Revenue
Portland Oregon Department of Revenue
Providence Rhode Island Division of Taxation
Raleigh North Carolina Department of Revenue
Riverside-San Bernardino California Franchise Tax Board
Sacramento California Franchise Tax Board
Saginaw Michigan Department of Treasury
Salem Oregon Department of Revenue
Salt Lake City Utah State Tax Commission
San Diego California Franchise Tax Board
San Francisco California Franchise Tax Board
Seattle Washington State Department of Revenue
Shreveport Louisiana Department of Revenue
Sioux Falls South Dakota Department of Revenue
Spartanburg South Carolina Department of Revenue
Spokane Washington State Department of Revenue
St. Louis Missouri Department of Revenue
Tampa Florida Department of Revenue
Trenton New Jersey Division of Taxation
Wichita Kansas Department of Revenue
Wilmington Delaware Division of Revenue
Youngstown Ohio Department of Taxation
J. Local Taxes
Australia All Cities KPMG Australia
Local city councils
Brazil All Cities KPMG Brazil
Canada All Cities Provincial Revenue/Tax Departments as required
Belleville-Quinte West City of Belleville
City of Quinte-West
Brandon City of Brandon
Charlottetown Town of Stratford
Durham Region Cities of Ajax, Brock, Clarington, Oshawa, Pickering, Scugog, Uxbridge, Whitby
Edmonton City of Edmonton
Fredericton City of Fredericton

D.12 Competitive Alternatives: KPMG’s Guide to International Business Location Costs 2012 Edition
Halifax Halifax Regional Municipality, Tax Division
Kamloops City of Kamloops
Lethbridge City of Lethbridge
Medicine Hat City of Medicine Hat
Middlesex County Municipalities of Lucan Biddulph, Middlesex Centre, North Middlesex, Strathroy-Caradoc, Thames Centre
Moncton Business Moncton, Property Taxes
Montreal City of Laval, Tax Department
Moose Jaw City of Moose Jaw, City Hall
Prince Albert City of Prince Albert, Assessment & Taxation Department
Prince George City of Prince George, Tax Department
Quebec City City of Quebec, Tax Department
Red Deer City of Red Deer, Tax Department
Regina City of Regina, Tax Department
Saint John City of Saint John
Saskatoon City of Saskatoon, Office of the City Assessor
St. John’s City of Mount Pearl, Tax Department
Town of Paradise
Sydney Cape Breton Regional Municipality, Tax Office
Toronto City of Toronto, Tax & Water Department
City of Brampton, Finance Department
City of Mississauga
Trois-Rivières City of Trois-Rivières
Truro Town of Truro, Finance & Property Department
Vancouver Township of Langley, Property Tax Department
Victoria District of Langford
Windsor-Essex Town of Lake Shore, Tax Department
Town of Tecumseh, Tax Department
Winnipeg City of Winnipeg, Tax Department & Corporate Finance
China All Cities KPMG China
France All Cities Fidal (KPMG France)
Germany All Cities KPMG Germany
India All Cities Colliers International
KPMG India
Italy All Cities K Studio Associate (KPMG Italy)
Japan All Cities KPMG Japan
Mexico All Cities Cosmex International
DFK / Llarena y Asociados S.C.
Netherlands All cities KPMG Netherlands
Russia All Cities KPMG Russia
United Kingdom All Cities KPMG United Kingdom

www.competitivealternatives.com D.13
United States Albuquerque City of Albuquerque, Treasury Department
Alexandria Rapides Parish Assessor
Anchorage The Municipality of Anchorage, Treasury Division
Atlanta Georgia Department of Revenue, Property Tax Division
Austin Travis County Tax
Baltimore State of Maryland, Department of Assessment & Taxation
Bangor City of Bangor, Treasury Department
Baton Rouge East Baton Rouge Parish Assessor
Beaumont Jefferson County Tax Office
Billings Yellowstone County, Treasurer
City of Billings, Department of Revenue
Boise Ada County Treasurer
Canyon County Assessor
Boston Massachusetts Department of Revenue, Division of Local Services
Buffalo City of Buffalo, Assessor’s Office
Erie County Clerk
Burlington City of South Burlington, Department of Assessment Administration
Town of Williston
Town of Colchester
Cedar Rapids Linn County Assessor
Iowa Department of Revenue and Finance
Champaign-Urbana County of Champaign Treasury
Charleston Kanawha County, Assessor & County Clerk
Putnam County Assessor
Cheyenne Laramie County Assessor
Chicago Will County Recorder Office
Will County Clerk’s Office, Tax Extension
Illinois Department of Revenue
Cincinnati Hamilton County Auditor; Butler Country Treasurer
Cleveland Cuyahoga County Treasurer's Office
Dallas-Fort Worth Dallas County, Central Appraisal District
Tarrant County, Tax Assessment
Denver Denver Assessor’s Office
Detroit City of Romulus Assessor’s Office
Wayne County Register of Deeds
Fargo North Dakota State Tax Commissioner
Cass County Assessor
Gulfport-Biloxi Harrison County Tax Assessor
Hartford State of Connecticut, Tax Collector & Real Estate Conveyance Tax
Town of Newington, Town Clerk
Town of Southington, Town Clerk & Assessor
Town of Cheshier, Town Clerk
Town of Wolcott, Town Clerk
Town of Enfield, Town Clerk & Assessor
Town of Somers, Town Clerk
Honolulu City of Honolulu, Real Property Assessment Division
State of Hawaii, Department of Taxation
Houma Terrebonne Parish Assessor
Houston Harris County, Tax Assessor/Collector
Indianapolis Hendricks County, Auditor’s Office
Jackson Hinds County, Tax Assessor
Lafayette Lafayette Assessor
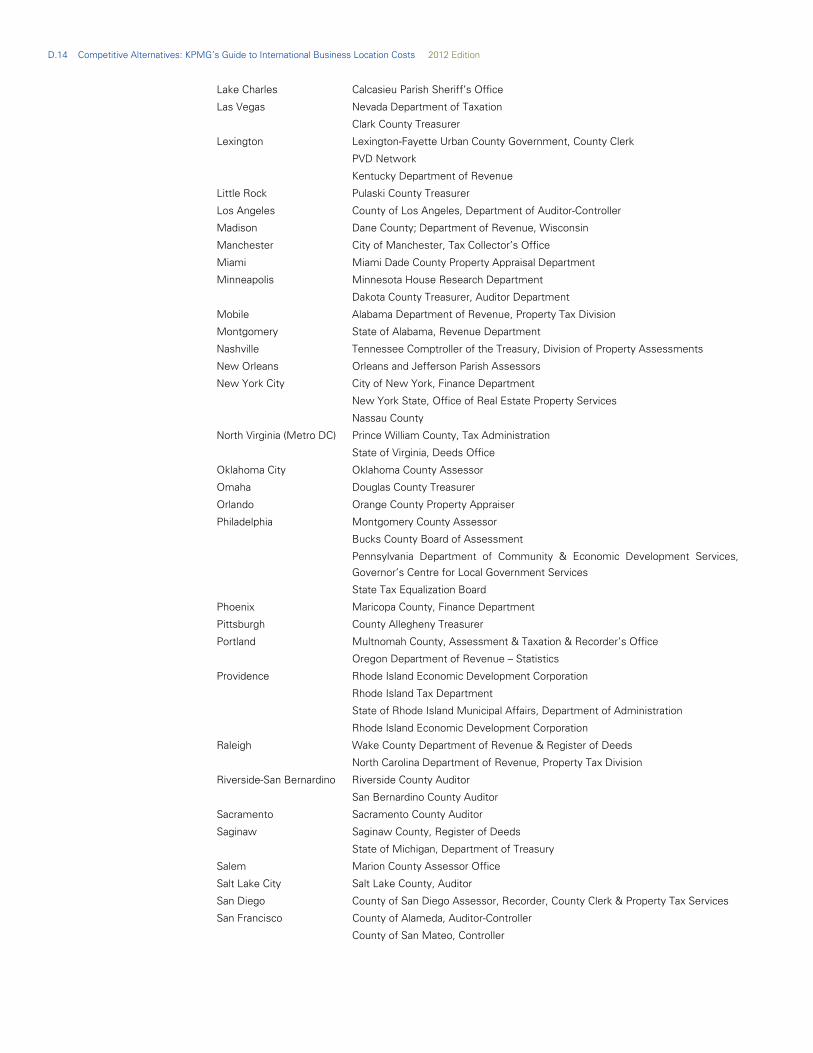
D.14 Competitive Alternatives: KPMG’s Guide to International Business Location Costs 2012 Edition
Lake Charles Calcasieu Parish Sheriff’s Office
Las Vegas Nevada Department of Taxation
Clark County Treasurer
Lexington Lexington-Fayette Urban County Government, County Clerk
PVD Network
Kentucky Department of Revenue
Little Rock Pulaski County Treasurer
Los Angeles County of Los Angeles, Department of Auditor-Controller
Madison Dane County; Department of Revenue, Wisconsin
Manchester City of Manchester, Tax Collector’s Office
Miami Miami Dade County Property Appraisal Department
Minneapolis Minnesota House Research Department
Dakota County Treasurer, Auditor Department
Mobile Alabama Department of Revenue, Property Tax Division
Montgomery State of Alabama, Revenue Department
Nashville Tennessee Comptroller of the Treasury, Division of Property Assessments
New Orleans Orleans and Jefferson Parish Assessors
New York City City of New York, Finance Department
New York State, Office of Real Estate Property Services
Nassau County
North Virginia (Metro DC) Prince William County, Tax Administration
State of Virginia, Deeds Office
Oklahoma City Oklahoma County Assessor
Omaha Douglas County Treasurer
Orlando Orange County Property Appraiser
Philadelphia Montgomery County Assessor
Bucks County Board of Assessment
Pennsylvania Department of Community & Economic Development Services,
Governor’s Centre for Local Government Services
State Tax Equalization Board
Phoenix Maricopa County, Finance Department
Pittsburgh County Allegheny Treasurer
Portland Multnomah County, Assessment & Taxation & Recorder’s Office
Oregon Department of Revenue – Statistics
Providence Rhode Island Economic Development Corporation
Rhode Island Tax Department
State of Rhode Island Municipal Affairs, Department of Administration
Rhode Island Economic Development Corporation
Raleigh Wake County Department of Revenue & Register of Deeds
North Carolina Department of Revenue, Property Tax Division
Riverside-San Bernardino Riverside County Auditor
San Bernardino County Auditor
Sacramento Sacramento County Auditor
Saginaw Saginaw County, Register of Deeds
State of Michigan, Department of Treasury
Salem Marion County Assessor Office
Salt Lake City Salt Lake County, Auditor
San Diego County of San Diego Assessor, Recorder, County Clerk & Property Tax Services
San Francisco County of Alameda, Auditor-Controller
County of San Mateo, Controller

www.competitivealternatives.com D.15
Seattle King County, Department of Assessments
Pierce County
Kent Economic Development
Washington State Department of Revenue
Shreveport Caddo Parish Tax Division
City of Shreveport Revenue Division
Louisiana Tax Commission
Sioux Falls South Dakota Department of Revenue and Regulation, Business Tax Division
County of Minnehaha, Register of Deeds
Sioux Falls Development Foundation
Spartanburg South Carolina Department of Commerce & Tax Department
County of Spartanburg, Auditor
Spokane Spokane County Assessor
Spoke County Treasurer
Washington State Department of Revenue
St. Louis St Louis County, Collector of Revenue & Department of Taxes
Missouri Department of Revenue
Tampa Hillsborough County
Polk County Tax Controller
Tampa Bay Economic Development
Greater Tampa Chamber of Commerce
Trenton Mercer County Taxation Department
New Jersey Division of Taxation, Realty Transfer Fees
Wichita Sedgwick County, Clerk’s Office
Wilmington Delaware Division of Revenue
Newcastle County Recorder of Deeds
State of Delaware, Property Taxes
Youngstown Trumbull County Auditor
Ohio Department of Taxation
K. Other Sources for Industry Data and Statistics
US Census Bureau Annual Survey of Manufacturers: General Statistics: Statistics for Industry Groups and Industries: 2009 and 2008
Area Development Magazine
Aerospace Industries Association Aerospace Statistics, Income Statement Aerospace Manufacturing Industry 2010 .
IMS, IMS Health Market Prognosis, March 2011, Global Pharmaceutical Sales, 2003-2010 .
Z/Yen Group The Global Financial Centers Index 10, September 2011
Anything Research 2011 Premium Report on Battery Manufacturing
New Venture Research The Worldwide Electronics Manufacturing Services Market, 2011 Edition
NPD Group Inc. U.S. Video Game Industry Press Release, January 12, 2012
DataMonitor Research Software: Global Industry Guide 2010
Ernst & Young Beyond Borders, Global Biotechnology Report 2011

www.CompetitiveAlternatives.com