kramer-schadt, s., revilla, e., and wiegand, t. (2005 ... · lynx reintroductions in fragmented...
TRANSCRIPT

Kramer-Schadt, S., Revilla, E., and Wiegand, T. (2005). Lynx reintroductions in fragmented landscapes of Germany: Projects with a future or misunderstood wildlife conservation? Biol. Conserv. 125: 169-182.
Keywords: 8DE/colonization/connectivity/conservation/dispersal/Eurasian Lynx/extinction probability/fragmentation/habitat/habitat model/landscape/Lynx lynx/Malme/management/ model/mortality/program/PVA/reintroduction/simulation/spatial/strategy/survival/survival rate/viability
Abstract: Eurasian lynx are slowly recovering in Germany after an absence of about 100 years, and additional reintroduction programs have been launched. However, suitable habitat is patchily distributed in Germany, and whether patches could host a viable population or contribute to the potential spread of lynx is uncertain. We combined demographic scenarios with a spatially explicit population simulation model to evaluate the viability and colonization success of lynx in the different patches, the aim being to conclude guidelines for reintroductions. The spatial basis of our model is a validated habitat model for the lynx in Germany. The dispersal module stems from a calibrated dispersal model, while the demographic module uses plausible published information on the lynx life history. The results indicate that (1) a viable population is possible, but that (2) source patches are not interconnected except along the German-Czech border, and that (3) from a demographic viewpoint at least 10 females and 5 males are required for a start that will develop into a viable population with an extinction probability of less than 5% in 50 years. The survival rate of resident adults was the most sensitive parameter, and the best management strategy for the success of reintroduction would be to reduce the mortality of residents in the source patches. Nevertheless, the extremely low probability of connectivity between suitable patches makes most of the reintroduction plans isolated efforts, and they are therefore questionable in the long run. With such a model, the suitability of the single habitat patches can be assessed and the most appropriate management scheme applied. This study shows that simulation models are useful tools for establishing the comparative effectiveness of reintroduction plans aimed at increasing the viability of the species.

www.elsevier.com/locate/biocon
Biological Conservation 125 (2005) 169–182
BIOLOGICAL
CONSERVATION
Lynx reintroductions in fragmented landscapes of Germany:Projects with a future or misunderstood wildlife conservation?
Stephanie Kramer-Schadt a,b,*, Eloy Revilla a,c, Thorsten Wiegand a
a Department of Ecological Modelling, UFZ Centre for Environmental Research, Permoser Str. 15, D-04318 Leipzig, Germanyb Department fur Okologie, Lehrstuhl fur Landschaftsokologie, Technische Universitat Munchen, Am Hochanger 6, D-85350
Freising-Weihenstephan, Germanyc Department of Applied Biology, Estacion Biologica de Donana, Consejo Superior de Investigaciones Cientıficas,
Avenida Maria Luisa s/n, E-41013 Sevilla, Spain
Received 15 September 2004; received in revised form 3 February 2005; accepted 27 February 2005
Available online 4 May 2005
Abstract
Eurasian lynx are slowly recovering in Germany after an absence of about 100 years, and additional reintroduction programs
have been launched. However, suitable habitat is patchily distributed in Germany, and whether patches could host a viable popu-
lation or contribute to the potential spread of lynx is uncertain. We combined demographic scenarios with a spatially explicit pop-
ulation simulation model to evaluate the viability and colonization success of lynx in the different patches, the aim being to conclude
guidelines for reintroductions. The spatial basis of our model is a validated habitat model for the lynx in Germany. The dispersal
module stems from a calibrated dispersal model, while the demographic module uses plausible published information on the lynx�life history. The results indicate that (1) a viable population is possible, but that (2) source patches are not interconnected except
along the German–Czech border, and that (3) from a demographic viewpoint at least 10 females and 5 males are required for a start
that will develop into a viable population with an extinction probability of less than 5% in 50 years. The survival rate of resident
adults was the most sensitive parameter, and the best management strategy for the success of reintroduction would be to reduce the
mortality of residents in the source patches. Nevertheless, the extremely low probability of connectivity between suitable patches
makes most of the reintroduction plans isolated efforts, and they are therefore questionable in the long run. With such a model,
the suitability of the single habitat patches can be assessed and the most appropriate management scheme applied. This study shows
that simulation models are useful tools for establishing the comparative effectiveness of reintroduction plans aimed at increasing the
viability of the species.
� 2005 Elsevier Ltd. All rights reserved.
Keywords: Large carnivores; Lynx lynx L.; Mortality scenarios; Population viability analysis; Spatially explicit individual-based model; Species
reintroduction
1. Introduction
Species reintroduction is being increasingly regardedas a valuable tool for conservation schemes, for example
to save species from extinction or to reinstate species
0006-3207/$ - see front matter � 2005 Elsevier Ltd. All rights reserved.
doi:10.1016/j.biocon.2005.02.015
* Corresponding author. Tel.: +49 341 235 2034; fax: +49 341 235
3500.
E-mail address: [email protected] (S. Kramer-Schadt).
that have become locally extinct. Due to a change in
public attitudes towards wildlife in the mid-20th cen-
tury, species reintroductions have been increasingly con-sidered (Leaper et al., 1999; South et al., 2000; Sarrazin
and Legendre, 2000; Breitenmoser et al., 2001; O�Tooleet al., 2002). In human-dominated landscapes of Ger-
many, reintroductions of lynx Lynx lynx have been the
subject of intense, controversial debate since the 1970s
(see Schadt et al., 2002a,b). A recent example is the

170 S. Kramer-Schadt et al. / Biological Conservation 125 (2005) 169–182
release of lynx into the Harz Forest in 2000 (Wotschi-
kowsky et al., 2001). Lynx are also slowly recolonizing
the Bavarian Forest and the adjacent low mountain
ranges following a reintroduction of lynx in the Czech
Bohemian Forest (Fig. 1; Wolfl et al., 2001).
Carnivore reintroductions in particular are extremelylengthy, costly and complex processes, and so they evi-
dently need to be made more efficient (Breitenmoser
et al., 2001). The future development of a reintroduced
lynx population and the success of potential reintroduc-
tion initiatives are difficult to assess because of the large
spatial requirements of a lynx population and because
the dynamics of small expanding populations in frag-
mented landscapes are not well understood. Questionssuch as the minimum number of individuals that should
be released and the influence of factors leading to higher
mortality on population development remain unan-
swered. For example, although the higher deaths caused
Fig. 1. Source and target patches for measuring the connectivity of the Germ
1000 km2; light grey shows target patches, which are larger than 100 km2. D
indicate the starting points of the simulated animals. Connectivity between t
pairs are given in the Appendix.
by humans in fragmented landscapes due to habitat con-
traction and modification as well as poaching and road
mortality are major factors contributing to the failure of
reintroductions (Kaczensky et al., 1996; Trombulak and
Frissell, 2000; Ferreras et al., 2001), their consequences
for population dynamics are inherently difficult to assess.Models as assessment tools for reintroductions and
management have been used for a variety of species
(Howells and Edward-Jones, 1997; Letcher et al., 1998;
Bustamante, 1998; Leaper et al., 1999; Merrill et al.,
1999; South et al., 2000; Ebenhard, 2000; Mathews
and Macdonald, 2001; Ellner and Fieberg, 2003; Steury
and Murray, 2004; Posillico et al., 2004). The assessment
of human impact on the survival of species, such as frag-mentation due to roads, is increasingly relying on popu-
lation viability analyses (PVA), which use demographic
models incorporating various aspects of the ecology and
behaviour of the species concerned (Boyce, 1992;
an landscape. Dark grey indicates source patches, which are larger than
otted lines show highways; black lines mark main rivers. The triangles
he patches for the different scenarios and the numbers of released lynx

S. Kramer-Schadt et al. / Biological Conservation 125 (2005) 169–182 171
Akcakaya and Raphael, 1998). Conservation efforts of
other carnivores in fragmented landscapes using PVA
have, for example, been made for the Iberian lynx in
Spain (Gaona et al., 1998; Revilla et al., 2004). Despite
a few drawbacks (Beissinger and Westphal, 1998; but see
Wiegand et al., 2004), spatially explicit population sim-ulation models are virtually the only means to answer
certain specific questions of population development un-
der different landscape and demographic scenarios
(Brook et al., 2002) and should therefore be integrated
into the recovery planning process (Morris et al.,
2002). Often, generic population viability analysis tools
are too unspecific for this purpose (Possingham and Da-
vies, 1995; Akcakaya, 1995) and specifically constructedmodels are required (Wiegand et al., 1998; Brook et al.,
2000; Reed et al., 2002).
We perform a PVA with a specifically constructed,
spatially explicit population simulation model that sum-
marizes the available data on the Eurasian lynx. The
model consists of three submodels: a landscape sub-
model for entire Germany and some surrounding areas
with a resolution of 1 km2, an individual-based dispersalsubmodel which describes dispersal of lynx in this land-
scape, and a population submodel which includes a ter-
ritory selection module allocating female and male home
ranges (which may comprise areas on average 100 km2)
after dispersal in this landscape as well as a demographic
module including mortality and reproduction. In a pre-
vious publication (Schadt et al., 2002b) we constructed
and validated a habitat model for the lynx in Germany.Based on this map we defined four landscape categories:
barriers, matrix, dispersal and breeding habitat, which
we assigned to each 1 km2 pixel of the landscape. The
habitat model showed that a pixel of breeding habitat
was always part of a connected and undisturbed area,
mainly forests, of the size of an average female home
range of about 100 km2 (i.e., the habitat model included
a variable which operated at a scale larger than the pixelof the landscape). We therefore refer to the areas with
breeding habitat >100 km2 as possibly suitable patches.
Additionally, we refer to �source patches�, when the area
identified as suitable is larger than 1000 km2 (Schadt
et al., 2002b). We then identify the scenarios under
which a lynx population would be viable in Germany.
The aim of our study is to formulate management
strategies and to provide guidelines for evaluating suit-able habitat patches before animals are released in order
to improve species reintroductions. To this end, we test
the impact of demographic scenarios (i.e., different mor-
tality scenarios) on the development of the population
and hence on reintroduction success. In this context,
questions such as the requirements for successful spread-
ing (e.g., the size of suitable habitat, the numbers and sex
of individuals, connectivity among populations) are ofparticular interest. Our specific questions are: (1) Can
the suitable habitat patches sustain a viable lynx popula-
tion? (2) If so, what would be the minimum release popu-
lation? (3) What would be the most efficient (economic)
ratio of females to males? (4) And can other patches be
colonized? We answer these questions explicitly for Ger-
many.We are especially interested in population develop-
ment in the Harz Forest, and whether there is a possiblelinkage via the Thuringian Forest with the population
in the Bavarian Forest. Additionally, we assess the popu-
lation development in other patches considered suitable,
such as the Black Forest and the Palatine Forest (Fig. 1).
2. Methods
We use an individual-based, spatially explicit model to
simulate the spatiotemporal population dynamics of lynx
in Germany and to test the viability of reintroduced pop-
ulations under the different demographic scenarios. The
model basically consists of a landscapemodel, an individ-
ual-based dispersal model, a home range selection model,
and a demographic model. The landscape model is based
on a GIS habitat suitability map for Germany (Schadtet al., 2002b), and the dispersal model was developed in
Kramer-Schadt et al. (2004). Model rules and parameters
are derived from published data of lynx demography in
Europe (Table 1). Sensitivity analysis was conducted to
assess the influence of model parameters on the model re-
sults against a realistic reference scenario. Sensitivity was
considered to be high whenever deviation from the refer-
ence scenario exceeded 20% (Huth et al., 1998).
2.1. Life history of Eurasian lynx
In central Europe, lynx are mostly bound to forested
habitat and their main prey are ungulates, especially roe
deer. Apart from females with the current year�s off-
spring, lynx are solitary living animals. Their territories
are intrasexually exclusive, and holding a territory seemsto be a condition for adults to reproduce (Ferreras et al.,
1997; Breitenmoser et al., 2000). Adult males generally
occupy large territories, often sharing them with one
or two females.
Mating takes place in spring and the average litter size
is two kittens (Breitenmoser-Wursten et al., 2001). Subad-
ults leave their natal territory at the age of about 10
months to search for their own territories (Zimmermann,1998). Adults can also disperse if breeding areas are satu-
rated (Gaona et al., 1998). Mortality during dispersal is
higher than for resident individuals, the total annualmor-
tality rate being about 0.5 (Ferreras et al., 1992, 2001;
Gaona et al., 1998; Breitenmoser-Wursten et al., 2001).
Females are usually mature at the age of two years.
Lynx can be sexually active throughout their lifetime,
which can be up to 17 years in the wild (Breitenmoseret al., 2000). Lynx suffer high mortality rates due to

Table 1
Model parameters for each submodel. The mortality probabilities for each model step are given in each submodel and were assessed with indirect
parameter adjustment to reflect published data on annual mortality rates
Submodel Symbol Published value Model parameter value
or range
Demographic submodel
� Non-overlapping core area size of female home ranges CAf 70 (SD ± 30) km2a 70–100 km2
� Males overlapping females RESm 1 or morea, 1–2b,c Up to 3
� Surviving subadults starting to disperse per reproductive female Nsub 1.6d, 1.0–1.1c 1–2
� Sex ratio of kittens Ratios 1:1d,c 1:1
� Reproduction rate (=prob. of giving birth) Pbirth 0.75d, 0.88c 0.5, 0.75, 0.95
0.6 ± 0.12 SD; 0.8 ± 0.12
SD e
� Annual mortality rates of residents MRres 12%d, 10–30%e, 13%c
Jura Mts., 22–28%c Alps
0.07, 0.18, 0.25
(results p.a. see Table 2)
� Number of released males and females Nrel – 1–18, 20, 22, 25, 30
Dispersal submodel
� Correlation factor (dispersal) PCf 0.5
� Probability of stepping into matrix Pmatrixf 0.03
� Maximum number of intraday steps smaxf 45
� Exponent of step distribution of Eq. (2) x f 11
� Annual mortality rates of dispersers MRdisp 55%e, 44%c Jura Mts.,
56–60%c Alps
(results p.a. see Table 2)
� Daily mortality rate of dispersers Mbasicf 0.0001, 0.0006, 0.0014
� Mortality rate per crossing event of motorway/main river Mhighwayf 0, 0.09, 0.14
main road Mroadf 0, 0.0009, 0.0019
a Breitenmoser et al. (1993).b Breitenmoser et al. (2000).c The authors state that their statistics concerning annual mortality rates are very weak due to small sample sizes (Breitenmoser-Wursten et al.,
2001).d Jedrzejewski et al. (1996).e Gaona et al. (1998).f Kramer-Schadt et al. (2004).
172 S. Kramer-Schadt et al. / Biological Conservation 125 (2005) 169–182
human-related factors such as poaching and road casu-
alties, resulting in total annual mortality rates of 0.2–
0.3. In protected areas, mortality rates for residents
average about 0.1 (Ferreras et al., 1992; Jedrzejewski
et al., 1996; Zimmermann, 1998; Ferreras, 2001; Bre-
itenmoser-Wursten et al., 2001).
2.2. Study area
Germany has an area of about 358,000 km2 and an
average human population density of 230 inhabitants
per km2, dropping to about 100 inhabitants per km2 in
areas such as low mountain ranges (e.g., the Black For-
est, Palatine Forest and Thuringian Forest). About 30%
of Germany is forested, including plantations, albeit
with large local variations (e.g., Hessen has 41% forest,compared to about 10% in Schleswig-Holstein). The for-
ests are clustered in areas formerly unsuitable for agri-
cultural activity in the low mountain ranges and in
areas with poor soils in the north-east. Two point five
per cent of German territory is protected by National
Park status. Germany has a very dense road network
consisting of 11,000 km of motorways and more than
50,000 km of interstate or main roads. We included con-nected neighbouring forest areas in Poland, the Czech
Republic (e.g., the Bohemian Forest), France (e.g., the
northern Vosges Mountains) and Belgium in our large-
scale study area (Fig. 1).
2.3. Data resolution and scales of the submodels
Our aim requires a model which operates at a spatial
scale of entire Germany (358,000 km2), the size of
�source patches� (i.e., the spatial unit of a population)is larger than 1000 km2, a female lynx home range
(i.e., the spatial unit of an individual lynx) is on average
100 km2, and lynx disperse on average distances of 42
km (Kramer-Schadt et al., 2004). Our model therefore
needs to balance between inclusion of detail in the
description of the landscape given through the habitat
suitability model, the spatial resolution of our data
and the typical scales at which the important processesof the model take place.
For constructing the habitat suitability model with
data from Switzerland, Germany, Czech Republic and
Slovenia, Schadt et al. (2002b) used only one uniform
data source, the CORINE land use data (European To-
pic Center on Land Cover, Environment Satellite Data
Center, Kiruna, Sweden), which classify the following
land use types on a 250-m grid. The CORINE classifica-tion names are provided in parentheses when different:
(i) Urban areas (artificial territories); (ii) agricultural

S. Kramer-Schadt et al. / Biological Conservation 125 (2005) 169–182 173
land (strongly artificial vegetated areas); (iii) pasture
(less artificial vegetated areas); (iv) forests; (v) non-
wooded semi-natural areas, e.g., heathland; (vi) wet-
lands; (vii) water surfaces. There was no further
breakdown of these land cover types to more detailed
classes (e.g., deciduous forest etc.) available for all coun-tries. The accuracy of the telemetry location data used to
construct the habitat suitability map was 1 km2, which
was selected as the spatial resolution of the habitat suit-
ability model. Of course, small scale features, such as
dense understorey, may influence habitat selection (Fer-
nandez et al., 2003), but given home ranges of 100–400
km2, we can assume that within such a large area the
lynx will find appropriate structures for its needs. Thisis in accordance with other very detailed habitat models
in fragmented landscapes (Zimmermann, 2004).
Considering the different spatial scales given above,
which resolution would be appropriate for our model?
Since lynx perceive forest fragments less than 1 km apart
as connected (Haller and Breitenmoser, 1986), they may
respond during dispersal to spatial structures of 1 km2.
In order not to loose detail of this process we used theoriginal grain of the habitat suitability model also as
the grain of our model landscape. Based on the habitat
suitability map we defined the four landscape categories
breeding habitat, dispersal habitat, matrix and barriers
(see below). Thus, our landscape consists of a grid of
860 · 680 cells, each representing 1 km2 and containing
information about its suitability for lynx (e.g., dispersal
habitat, matrix etc.).In the dispersal model (see Section 2.6; Kramer-
Schadt et al., 2004), the individuals directly search for
the next movement steps based on the information the
neighbouring 1 km2 grid cells contain. In the population
model (see Section 2.5), we upscale in terms of home
range occupancy, i.e., each female that wants to settle
and reproduce needs to collect a certain amount of con-
tagious cells of non-occupied breeding habitat, whereasmales search for cells that are already occupied by fe-
males (see below). The other scales automatically
emerge from the behaviour of the individuals in the
model in response to the landscape map and their demo-
graphic parameters. Individuals settling in a given
source patch may (or may not) form a viable (sub)pop-
ulation, and the connectivity between source patches
automatically emerges due to the behavioural rules ofdispersing lynx. Thus, we use the same landscape model
for all submodels, but in the submodels we address it in
different ways to account for the different spatial scales
involved.
2.4. Landscape submodel
We obtained the habitat suitability map for residentindividuals by logistic regression with a mesh size of 1
km2 as described in Schadt et al. (2002b). The model
contained just one variable: the proportion of area used
extensively by humans, such as forests and heathland, in
a 5 km circular neighbourhood. The habitat types can be
summarized as breeding, dispersal, matrix and barrier
habitat. Breeding habitat refers to areas with non-frag-
mented forest and other natural and semi-natural landuse types with a P-value above 0.5 as calculated in the
logistic regression model. All forested area and breeding
habitat is dispersal habitat (Kramer-Schadt et al., 2004).
Barriers consist of urban areas and lakes, and are never
used. The remaining areas, such as pasture and agricul-
tural land, are summarized as matrix which, although
not strictly avoided by dispersing lynx, is only used
occasionally.To simulate the effects of road mortality and crossing
large rivers, we created a second map containing linear
elements such as main roads (2–4 lanes), motorways
(P4 high speed lanes) and main rivers (>100 m wide,
e.g., the Rhine and the Danube). To integrate the assess-
ment of connectivity between patches into our model,
we define source patches as the main patches of special
management interest (>1000 km2) and target patchesas each suitable area >100 km2 (Fig. 1), which is the
average home range size of a female lynx in the Swiss
Jura Mountains (Breitenmoser et al., 1993). Patches sep-
arated by gaps of 1 km were considered as single
patches, as this is thought to be the distance that lynx
can perceive as connected (Haller and Breitenmoser,
1986). Altogether, we obtained 59 patches, of which 11
are source patches ((2) North-Eastern Forests, (6) Lune-burger Heath, (20) Harz Forest, (27) Rothaar Moun-
tains, (29) Erz Mountains, (34) Thuringian Forest, (40)
Spessart, (49) Bavarian Forest, (53) Northern Black
Forest, (55) Southern Black Forest, (56) Palatine Forest;
the numbers in parentheses refer to the patches shown in
Fig. 1). Animals leaving the study area in the simula-
tions are deleted because once they have emigrated they
have no further influence on population development;the re-immigration of these individuals is not considered
either.
2.5. Population submodel
One simulation run. At the beginning of each model
time step (year), we determine the number of resident
males and females and the number of dispersers. Allnon-residents older than one year disperse (Rule 1)
and search for home ranges (Rule 2). The spatially expli-
cit processes of dispersal and territory selection in the
model depend upon local habitat quality as perceived
by individual lynx as they move through the landscape.
Consequently, these processes are determined by a set of
rules which take into account the habitat type of the
eight cells surrounding the location of the individual.If dispersing individuals survive, they settle or continue
dispersal in the following year. Next, we decide for each
174 S. Kramer-Schadt et al. / Biological Conservation 125 (2005) 169–182
resident female to reproduce (Rule 3). In the final step,
we update the demographic variables for each surviving
individual (age and status, i.e., disperser or resident).
Each parameter set is simulated 100 times to obtain a
stabilized standard deviation (<1% variability).
Plausible parameter ranges. The demographic param-eters of the model are mainly based on published data
from Switzerland, Spain and Poland. These data were
derived from long-term field studies of reintroduced
Eurasian lynx populations in the Swiss Jura Mountains
(Breitenmoser et al., 1993) and the Swiss Alps (Haller
and Breitenmoser, 1986; Breitenmoser-Wursten et al.,
2001) as well as a native population of Eurasian lynx
in the Białowie _za Primeval Forest (Jedrzejewski et al.,1996). Data from Spain are also based on long-term field
studies of the Iberian lynx Lynx pardinus (Gaona et al.,
1998; Ferreras et al., 2001). Although this is a different
species, we use published information to constitute the
range of the model parameters. Model rules include de-
tailed information about life-history attributes, family
structure, mortality rates and reproduction.
Mortality rates are influenced by the status of the ani-mal. We introduce three different schemes in which a
simulated individual may die (mortality scheme) to real-
istically reflect the effect of the fragmented landscape: (1)
a daily mortality probability for dispersing lynx; (2) a
mortality probability per linear barrier (road, motor-
way, river) crossing event for dispersers, and (3) an an-
nual mortality probability per resident individual.
Mortality parameters for each scheme were adjustedfor the Harz Forest with indirect parameter assessment
to produce a plausible range for annual mortality rates
as known from the literature (Table 1). We test 9 differ-
ent mortality scenarios (low (�10%), medium (�20%)
and high (�30%) total annual mortality for residents
and low (�30%), medium (�50%) and high (�70%) to-
tal annual mortality rates for dispersers each, i.e., the
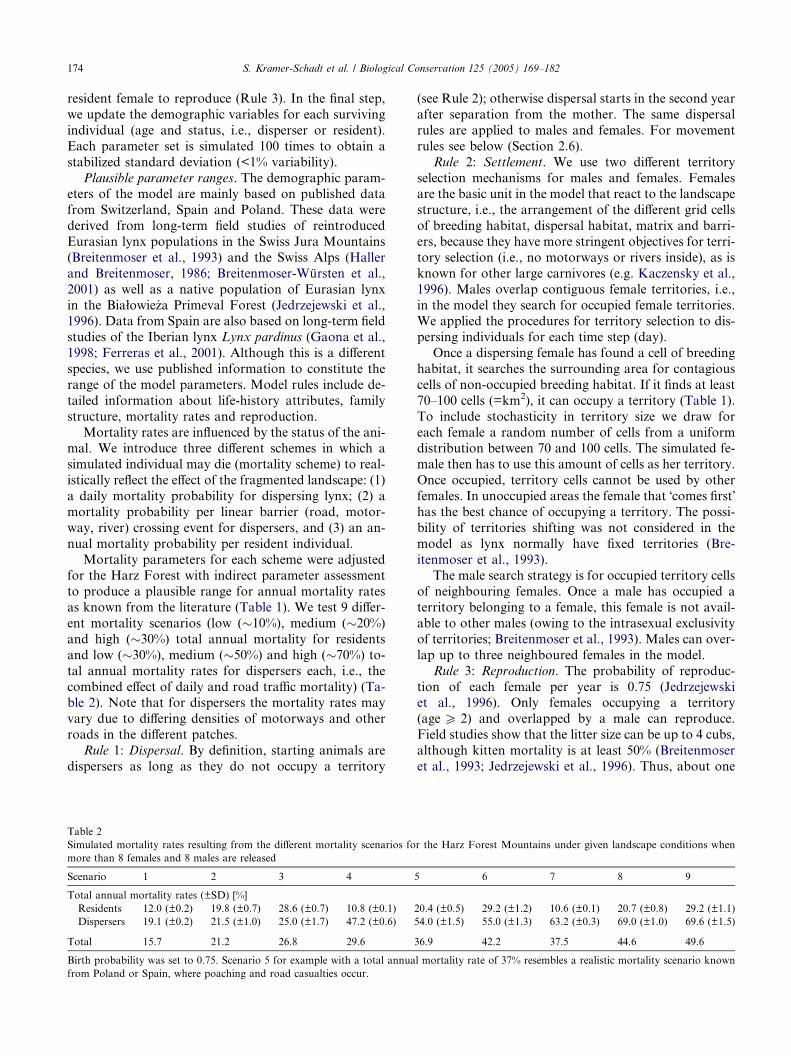
combined effect of daily and road traffic mortality) (Ta-ble 2). Note that for dispersers the mortality rates may
vary due to differing densities of motorways and other
roads in the different patches.
Rule 1: Dispersal. By definition, starting animals are
dispersers as long as they do not occupy a territory
Table 2
Simulated mortality rates resulting from the different mortality scenarios fo
more than 8 females and 8 males are released
Scenario 1 2 3 4
Total annual mortality rates (±SD) [%]
Residents 12.0 (±0.2) 19.8 (±0.7) 28.6 (±0.7) 10.8 (±0.1)
Dispersers 19.1 (±0.2) 21.5 (±1.0) 25.0 (±1.7) 47.2 (±0.6)
Total 15.7 21.2 26.8 29.6
Birth probability was set to 0.75. Scenario 5 for example with a total annua
from Poland or Spain, where poaching and road casualties occur.
(see Rule 2); otherwise dispersal starts in the second year
after separation from the mother. The same dispersal
rules are applied to males and females. For movement
rules see below (Section 2.6).
Rule 2: Settlement. We use two different territory
selection mechanisms for males and females. Femalesare the basic unit in the model that react to the landscape
structure, i.e., the arrangement of the different grid cells
of breeding habitat, dispersal habitat, matrix and barri-
ers, because they have more stringent objectives for terri-
tory selection (i.e., no motorways or rivers inside), as is
known for other large carnivores (e.g. Kaczensky et al.,
1996). Males overlap contiguous female territories, i.e.,
in the model they search for occupied female territories.We applied the procedures for territory selection to dis-
persing individuals for each time step (day).
Once a dispersing female has found a cell of breeding
habitat, it searches the surrounding area for contagious
cells of non-occupied breeding habitat. If it finds at least
70–100 cells (=km2), it can occupy a territory (Table 1).
To include stochasticity in territory size we draw for
each female a random number of cells from a uniformdistribution between 70 and 100 cells. The simulated fe-
male then has to use this amount of cells as her territory.
Once occupied, territory cells cannot be used by other
females. In unoccupied areas the female that �comes first�has the best chance of occupying a territory. The possi-
bility of territories shifting was not considered in the
model as lynx normally have fixed territories (Bre-
itenmoser et al., 1993).The male search strategy is for occupied territory cells
of neighbouring females. Once a male has occupied a
territory belonging to a female, this female is not avail-
able to other males (owing to the intrasexual exclusivity
of territories; Breitenmoser et al., 1993). Males can over-
lap up to three neighboured females in the model.
Rule 3: Reproduction. The probability of reproduc-
tion of each female per year is 0.75 (Jedrzejewskiet al., 1996). Only females occupying a territory
(age P 2) and overlapped by a male can reproduce.
Field studies show that the litter size can be up to 4 cubs,
although kitten mortality is at least 50% (Breitenmoser
et al., 1993; Jedrzejewski et al., 1996). Thus, about one
r the Harz Forest Mountains under given landscape conditions when
5 6 7 8 9
20.4 (±0.5) 29.2 (±1.2) 10.6 (±0.1) 20.7 (±0.8) 29.2 (±1.1)
54.0 (±1.5) 55.0 (±1.3) 63.2 (±0.3) 69.0 (±1.0) 69.6 (±1.5)
36.9 42.2 37.5 44.6 49.6
l mortality rate of 37% resembles a realistic mortality scenario known
S. Kramer-Schadt et al. / Biological Conservation 125 (2005) 169–182 175
or two subadults per reproductive female start dispersal
in their second year (Table 1). We therefore set the prob-
ability of having one or two dispersers starting to 0.5
and the sex ratio to 1:1 (Jedrzejewski et al., 1996).
We did not include environmental stochasticity, e.g.,
good years with a higher birth probability and vice ver-sa, as the roe deer density – the main food resource of
Eurasian lynx (Breitenmoser and Haller, 1993; Okarma
et al., 1997; Jobin et al., 2000) – in Germany is very high.
Hence it is assumed that food limitation does not feature
in population dynamics (Schadt et al., 2002b).
2.6. Dispersal submodel
The movement rules and parameters were taken from
a calibrated dispersal model for the Eurasian lynx (Kra-
mer-Schadt et al., 2004; Table 1). The smallest spatial
unit in our dispersal model is one movement step. We
assume that individuals survey their eight-cell neigh-
bourhood and that their movement steps are based on
this information. The next cell is chosen based on the
preference for dispersal habitat and the avoidance ofmatrix. If the neighbourhood of a dispersing lynx, com-
prising the origin cell and its 8 neighbours, contains only
matrix or dispersal habitat cells, the probability of
choosing one of these cells is random (i.e., 1/9). How-
ever, if the neighbourhood is a mixture of dispersal hab-
itat and matrix, we consider the preference for dispersal
habitat as follows: The number of matrix cells nmat with-
in the neighbourhood is counted. The probability ofleaving dispersal habitat Pleave is then dependent on
the number of matrix cells around the origin cell multi-
plied by a factor Pmatrix (ranging from total avoidance of
matrix [Pmatrix = 0] to randomly choosing any surround-
ing cell [Pmatrix = 1/(9 � nbarr)], where nbarr is the amount
of barrier cells)
P leave ¼ nmat � Pmatrix.
We included a correlation factor Pc of maintaining
direction within a day, which gives the probability of
the next cell being in the same direction of movement.
The hierarchy is preference of dispersal habitat over cor-
relation in movement direction. The first direction of
every day is chosen randomly (Revilla et al., 2004).
Each day, we assign a dispersing lynx a certainamount of movement steps s based on a probability
P(s) using the power function
P ðsÞ ¼ u � 1� s� 1
smax � 1
� �� �x
;
with an exponent x, giving the probability to move
many or few steps per day, and parameter smax that gives
the maximum number of steps that a dispersing lynx can
cover during one day and a normalization factor u scal-
ing P(s) between 0 and 1. P(s) is a good descriptor of theempirical distribution of daily movement distances.
2.7. Population scenarios
We release lynx in the patches considered for reintro-
ductions (the Black Forest (53), Palatine Forest (56),
Bavarian Forest (49), Harz Mountains (20), North-East-
ern Forests (2) and Thuringian Forest (34); Fig. 1). Ourgoal is to assess the minimum number of female and
male lynx required for successful reintroduction under
the different mortality scenarios, and also the connectiv-
ity between these patches.
Assessing the minimum release population. We define
the �minimum release population� (MRP) as the popula-
tion size whose chances of survival are >95%, measured
as the percentage of extinction Pext < 5%, if it were tosurvive at least 50 years. As females are the basic unit,
we increase the number of females and keep the number
of males fixed to the amount of released females (Table
1). To assess the minimum number of males needed for
an MRP, we use the obtained minimum amount of fe-
males necessary for an MRP as a fixed parameter and
vary the number of males.
Isolation or connectivity of the patches. We define con-nectivity as the probability Pcol of settling and reproduc-
ing in other patches. Population development in other
patches is measured as the arithmetic mean of the ob-
served exponential rate of increase �r during the popula-
tion persistence time TP of all simulation runs n, t is time
(years), Nt+1 is the number of animals (residents + new-
borns) in a certain patch in the current year, and Nt the
number of animals of the previous year in the samepatch. Within the time of population persistence, we cal-
culated the geometric mean of r (Caughley, 1980)
�r ¼Pn
1
PTPt
lnNtþ1Nt
� �T P
n.
We only considered residents and newborns to assess
whether individuals (e.g., immigrants) have settled in
these patches. Thus, the influence of this year�s dispers-ers on population development was neglected and we
could ensure that population growth was due to repro-
duction and settlement. When �k > 1, where
�k ¼ er
the population has increased. We used the z-score to cal-
culate the proportion of the one-tailed normal curve
that lies beyond (i.e., is more extreme than) a given nor-
mal deviate, where Z ¼ ð�r � lÞ=r (Zar, 1999); in this
case it is the proportion of the curve that lies beyond
the stable state of population development (i.e., l = 0,
no growth). We distinguish different probability classes
of increasing population trend Pcol, i.e., (1) >0.75, (2)>0.5 and <0.75, (3) >25 and <0.5, (4) >0.05 and
<0.25, (5) >0.01 and <0.05 and (6) <0.01. For example,
probability classes of (2) have a positive population
trend in more than 50% of cases. Probability classes of

176 S. Kramer-Schadt et al. / Biological Conservation 125 (2005) 169–182
(6) indicate that at least one female in 50 years and 100
repeated simulations settles in the patch (P = 0.0002).
Note that these are extreme cases. We define patches
linked with a probability class of at least (6) as
connected.
3. Results
3.1. Model sensitivity
For the sensitivity analysis we simulated an increas-
ing amount of females and males in the Harz Forest
with different parameter values for reproduction andfor the nine mortality scenarios (Table 1). We chose
the Harz Forest to highlight the applied nature of our
study, as lynx have been released there recently. We
took mortality Scenario 5 (Pbirth = 0.75, MRres = 0.2,
MRdisp = 0.5; Table 2) as the reference scenario because
it yielded the current knowledge on overall mortality
rates (see below: �Plausible parameter ranges�).Deviations from the 20% envelope occur with differ-
ent mortality rates for resident individuals and different
Fig. 2. Extinction probability of the Harz population under different mortal
and males was released. Only scenarios with low mortality values for reside
envelope of our reference Scenario 5 (see (b)) shows that the most sensitive pa
the birth probability, the more important the initial number of released anim
birth rates. If more than five females and males are re-
leased in our reference scenario, the mortality rate of
dispersers plays a crucial role for the survival of the
whole population (Fig. 2). Dispersers have to fill the
gaps in the reproducing part of the population, espe-
cially when birth probability is low or resident mortalityhigh.
A higher birth probability of 0.95 affects the mini-
mum number of females needed to establish a viable
population. It is decreased to 6 females (Fig. 2(c)). For
a birth probability of 0.5, only mortality scenarios with
very low mortality rates for residents and dispersers
show a trend to reach the MRP with at least 10–20 fe-
males, depending on dispersal mortality. As expected,we can therefore state that the survival of residents is
the most important factor for establishing a viable pop-
ulation, which was also predicted to be important for
other species of predators, such as Iberian lynx Lynx
pardinus, cheetahs Acinonyx jubatus, badgers Meles
meles, vultures Gyps fulvus or brown bears Ursus arctos
(Crooks et al., 1998; Wiegand et al., 1998; Van Appeldo-
orn et al., 1998; Gaona et al., 1998; Sarrazin and Legen-dre, 2000).
ity scenarios and birth probabilities when the same number of females
nts reach a viable population within a time horizon of 50 years. The
rameters are the birth rate and the mortality rate of residents. The lower
als.

Table 3
Minimum number of females needed to establish a viable population under the mortality scenarios for the different source locations (Fig. 1)
Location (patch no.) Patch size [km2] Occupied HR (SD) Mortality scenario
Females Males 1 2 3 4 5 6 7 8 9
Northern Black Forest (53) 1934 18 (3) 11 (2) 7 – – 6 – – 9 – –
Bavarian Bohemian Forest (49) 1849 18 (3) 11 (2) 6 30 – 7 – – 7 – –
Palatine Forest (56) 5232a 13 (2) 8 (1) 8 – – 9 – – 9 – –
Harz (20) 1566 15 (2) 9 (1) 7 – – 8 – – 7 – –
North-Eastern Forests (2) 1721 11 (2)b 7 (1) 17 – – – – – – – –
Thuringian Forests (34) 1676 16 (2) 10 (1) 7 – – 8 – – 10 – –
Birth probability is 0.75 and the time horizon 50 years. We released the same amount of females and males in each patch. If an MRP is reached in a
mortality scenario, the minimum number of females is given. Also shown is the maximum carrying capacity of resident lynx reached and the patch
size. The number of occupied home ranges (HR) was measured for viable populations as the average number of home ranges after the first 20 years
until the maximum time step of 50 years.a Palatine and Vosges Mountains in France together. The size of the German part is 1354 km2. Lynx emigrating into the Southern Vosges
Mountains were deleted.b The low number of occupied home ranges in comparison to the patch size indicates that not all the space was continuously occupied due to the
increased mortality on the two highways intersecting the patch.
Fig. 3. Influence of an increasing number of male lynx on population
development in the Harz Forest under different mortality scenarios.
Eight females are fixed. For legend see Fig. 2.
S. Kramer-Schadt et al. / Biological Conservation 125 (2005) 169–182 177
3.2. Population scenarios
Assessing the minimum release population. If an over-
lap of one to three female territories per male is as-
sumed, the Harz Forest (20) has a carrying capacity of
15 ± 2 female resident lynx and 9 ± 1 male resident lynx.This results in a density of about 1 female resident lynx
per 100 km2 of breeding habitat, which also holds for
the other source patches, with the exception of the
North-Eastern Forests (2) (Table 3), which are frag-
mented by two motorways.
For low mortality rates of residents in the Harz For-
est (mortality scenarios 1, 4, 7; Table 3) and a realistic
annual birth probability of 0.75 per resident female,the probability of extinction drops relatively quickly be-
low 0.05 with an increasing number of females, i.e., for
at least 8 released females (and 8 released males) we
reach the requirements for an MRP. Mortality rates of
dispersers did not affect the viability of the population
if the resident mortality was very low (Fig. 2(b)). Lynx
pairs released in addition to 8 pairs had no effect on pop-
ulation development. The optimal sex ratio for scenariosreaching an MRP (Scenarios 1, 4, 7) was reached with
about 8 females and 5 males in the Harz Forest (Fig. 3).
Assuming higher mortality rates of residents of about
0.2, which are realistic figures known from lynx popula-
tions in unprotected areas with poaching or expected
road casualties (Jedrzejewski et al., 1996; Gaona et al.,
1998; Ferreras et al., 2001), the requirements for an
MRP are not met (Fig. 2(b)). However, the mean persis-tence time of a population with resident mortality of
about 0.3 (Scenarios 3, 6 and 9) was about the life span
of an individual lynx (in years ± SD: e.g., for the Harz
Forest: 17 ± 7 in Scenario 3, 14 ± 5 in Scenario 6,
12 ± 4 in Scenario 9). This indicates that monitoring
programs should be launched for a long period before
the success of a species reintroduction can be assessed,
and that care should be taken to keep adult mortality
very low.
We obtain similar requirements for an MRP for the
northern Black Forest (53), the Palatine Forest (56)
and the Thuringian Forest (34). Six to ten females need
to be released, and it is only the scenarios with low res-ident mortality that yield viable populations (Table 3).
However, in the Bavarian Bohemian Forest (49) a viable
population can even be obtained with a higher resident
mortality, but only if the number of released females is
high (Scenario 2, Table 3). By contrast, a viable popula-
tion in the North-Eastern Forests (2) is only likely given
a high number of initially released females and very low
mortality rates of both residents and dispersers. The dif-ferences between these patches are explained by the dif-
ferent mortality rates of the dispersing animals (Table

Table 4
Total annual mortality rates [%] of dispersers in the different source patches due to different road and motorway densities under the different
mortality scenarios
Location (patch no.) Road
density
[km/km2]
Patch
size
[km2]
Length [km] of linear barriers Mortality scenario
Main roads Motorway Main rivers 1 2 3 4 5 6 7 8 9
Northern Black Forest (53) 0.17 1934 336.8 26.1 – 36.7 40.7 41.4 61.8 65.7 65.0 72.9 74.9 75.0
Bavarian Forest (49) 0.01 1849 21.4a – – 9.3 11.1 12.9 27.2 31.3 33.6 47.2 52.1 52.2
Palatine Forest (56) 0.15 1354 196.5 21.5 – 26.7 33.8 36.1 44.2 54.7 56.6 53.3 63.3 66.2
Harz (20) 0.19 1566 303.7 – – 19.1 21.5 25.0 47.2 54.0 55.0 63.2 69.0 69.6
North-Eastern Forests (2) 0.07 1721 125.1 74.8 35.3 58.2 61.6 61.7 77.0 78.3 78.4 83.8 84.4 83.9
Thuringian Forests (34) 0.13 1676 223.3 – –
The parameters for crossing linear barriers have been adjusted for the Harz Forest.a Only the roads on the German side could be considered.
178 S. Kramer-Schadt et al. / Biological Conservation 125 (2005) 169–182
4). Even in the low dispersal mortality scenarios (Sce-narios 1, 2, 3), the total annual mortality rates of dis-
persers are up to three times higher in the North-
Eastern Forests (2) than in the Harz Forest (20) since
the former are divided by two motorways and flanked
by another (Fig. 1); the population in the North-Eastern
Forests (2) could not spread because all the dispersers
were killed on the motorways. Accordingly, the extinc-
tion risk of the whole source patch was much higher,and on average only 11 females occupied territories even
though there was room for at least 17. By contrast, the
road density in the Bavarian Bohemian Forest (49) is
low, as is the annual mortality rates of dispersers (Table
4). This shows that dispersing lynx represent a buffer
mechanism enhancing the viability of the whole popula-
tion, because vacant territories can be occupied quickly
(Grimm et al., 2005).Patch connectivity. Generally speaking, connectivity
to other patches (i.e., that at least one female settled in
another patch in 50 years and 100 repeated simulation
runs) occurs for each source patch and different mortal-
ity scenarios, and all the source patches are intercon-
nected via target patches (Fig. 1; Appendix). The
Thuringian Forest (34) would even be directly connected
to the four source patches Harz Forest (20), RothaarMountains (27), Spessart (40) and Erz Mountains (29).
However, sporadically arriving females are no guarantee
of colonization.
The chances of an increasing population trend in the
target patches due to migration from other patches are
extremely low. Only the German–Czech border (49,
48, 41, 44, 39), the northern and southern Black Forest
(55, 53), Palatine Forest and the Vosges Mountains (56,52) and Thuringian Forest and the Rhon (32, 34) could
be colonized permanently with a probability Pcol P 0.5
within a time frame of 50 years. Patch connectivity
mainly occurs for scenarios with low resident mortality
(Scenarios 1, 4, 7). Population spread across Germany
is very restricted, although occasional individual ex-
change is possible.
4. Discussion
PVA can be a valuable tool to support practical con-
servation and can be used to evaluate and design man-
agement methods (Ebenhard, 2000). The basic question
of a PVA is �What are the minimum conditions for the
long-term persistence and adaptation of a species or pop-
ulation in a given place?� (Soule, 1987). Population via-
bility analysis has been a specific field of research inconservation biology since the mid-1980s and has been
conducted for a variety of species (e.g. Gaona et al.,
1998; Hansen et al., 1999; McCarthy et al., 2000, 2001;
Penn et al., 2000; Kelly and Durant, 2000; Haight
et al., 2002). Unfortunately, PVA has a few drawbacks
linked to the parameterizing of models, making the re-
sults uncertain and unreliable (Beissinger and Westphal,
1998). PVA�s significance and usefulness are rooted in itsability to compare different management options (Reed
et al., 2002; Brooks et al., 2002), and we show an example
of how different mortality scenarios affect the probability
of the reintroduction of a lynx population succeeding.
One important advantage of modelling is that a
model puts the data and knowledge on the system into
a logical framework and allows exploring the conse-
quences of this knowledge at spatial and temporal scaleswhich escape observation or experiments. This is espe-
cially important for PVA which operates usually at time
horizons of 50 or 100 years and require risk assessment.
Clearly, scale issues are fundamental to PVA. For exam-
ple, not only minimum conditions from the ecological
point of view are relevant but also the scale at which
these conditions need to be analyzed to respond to the
specific objectives of the PVA. Our objectives requireda spatial scale of entire Germany and could thus not in-
clude details such as stand age of forests which may be
important when analyzing habitat selection within the
spatial scale of home ranges. Nevertheless, we selected
the maximum spatial resolution sustained by our data
(1 km2) which was also necessary to capture the essence
of the response of dispersing lynx to landscape structure.

S. Kramer-Schadt et al. / Biological Conservation 125 (2005) 169–182 179
Processes at all other spatial scales relevant to our objec-
tive (e.g., selection of home ranges) were covered by
rules which translated the minimum 1 km scale to the re-
quired scale.
4.1. Limitations of our model
We included into our model the most important
known factors of lynx biology at a spatial resolution
necessary to respond to our objectives. Those include
landscape structure (which defined the locations where
lynx may breed and canalized dispersal), mortality risk
when crossing linear barriers such as highways, dis-
persal, social structure and demographics. We foundclear and robust answers to our questions. However,
as any model, we needed to make simplifying assump-
tions and have to discuss their potential impact on our
results.
Empirical studies have shown that small populations
in the wild can suffer increased risk in the long term be-
cause of inbreeding (Saccheri et al., 1998; Sobel et al.,
1999; Ebenhard, 2000; Keller and Waller, 2002). Thelong-term survival of a population is influenced by ge-
netic variation, which is a prerequisite for evolutionary
adaptation to a changing environment, and the mainte-
nance of population numbers and genetic variation
should be a key aspect of plans for long-term population
management (Lande and Barrowclough, 1987). Our
model does not include the effects of inbreeding and ge-
netic stochasticity, i.e., random genetic drift, and couldunderestimate the risk of extinction (although cf. Keane
et al., 1994; Ballou, 1997). However, the founder effect
could be greatly limited with a release number of 15–
20 individuals since this number of effective founders
can have a quite diverse genetic pool. It would be neces-
sary to ascertain how many initial individuals or how
many immigrants per generation are needed to avoid ge-
netic bottlenecks or inbreeding depression. The geneticstructure and variability of the two Swiss lynx popula-
tions reintroduced in the Alps and Jura Mountains are
presently being studied, and the results should be in-
cluded in further assessments of suitable areas for
reintroduction.
Another potential mechanism known from general
PVA models to influence viability are catastrophic
events as an element of environmental stochasticity thatcan sharply reduce population size in a short time. Then
again, severe environmental changes such as a sudden
reduction of the main prey (roe deer) or breeding habi-
tat, or a severe disease, are unlikely for lynx, and there is
no historical information on their occurrence for this
species. Nevertheless, there is evidence of lynx losses
due to infections with mange in the Swiss Alps. Though
it seems improbable that mange will occur as an epi-demic in lynx, it may have an impact on the population
(Ryser-Degiorgis et al., 2002). The impacts of occasional
deaths due to disease have been taken into account as
�baseline mortality� in the model.
One of the major uncertainties in the model is that we
did not consider the behavioural flexibility of lynx. They
could probably learn to use underpasses or green-
bridges, and this would reduce the mortality risk. In thiscase, the model results would underestimate patch con-
nectivity. Additionally, lynx react to many small-scale
features in the landscape during dispersal, such as rib-
bons of vegetation along rivers (Zimmermann, 2004),
and this information is lost on the 1 km2 scale of our
habitat model. But this has been balanced in the dis-
persal model by a certain probability to step into matrix,
which accounts for the presence of small scale factorsthat attract lynx into the matrix.
4.2. The future of a lynx population in Germany
According to the model results, a population in the
Harz Forest (20) under the current landscape situation
would only be viable if the mortality rates of the resident
animals could be kept very low. As known from otherpopulations in Spain or Poland, such a mortality sce-
nario is rather unrealistic. In areas of suitable habitat
outside national parks where road mortality and poach-
ing still occur, the mortality rate may be as high as 0.3
(Ferreras et al., 2001). Even in the protected area in Po-
land, poaching makes up 71% of the population�s totalmortality rate of 0.37, while in Switzerland road kills
and poaching account for 70% of mortality (Zimmer-mann, 1998; Schmidt-Posthaus et al., 2002). Whether
these human-induced mortality factors can be neglected
in Germany is thus highly unlikely. Consequently, under
the expected mortality scenarios the probability of a
lynx reintroduction into the Harz Forest succeeding is
only about 0.5 for a time window of 50 years (Fig. 2(b)).
The results show that viable populations would also
be possible in the other major patches such as the Thu-ringian Forest (34), the Black Forest (53, 55) and Pala-
tine Forest (56), but only assuming low mortality for
resident and dispersing lynx. A linkage in the form of
the colonization of other source patches is not given
for the source patch Harz (20). An exception is the
Bavarian Bohemian Forest (49) that is connected along
the German–Czech border with the Erz Mountains (29),
a result that is also supported by field data (Wolfl et al.,2001). The Thuringian Forest (34) could also be linked
with the patches along the German–Czech border (29,
28, 39, 44, 49) and with the Rhon (40).
New motorway construction, as planned and being
carried out between the Harz Forest (20) and the Thu-
ringian Forest (34) as well as between the Erz Moun-
tains (29) and the Bavarian Forest (49), will
additionally worsen colonization success in new patches.Even short motorway sections can play a significant role
as barriers. In Slovenia, a stretch of motorway 30 km

180 S. Kramer-Schadt et al. / Biological Conservation 125 (2005) 169–182
long accounted for 31% of the total mortality of brown
bears U. arctos in the area (Kaczensky et al., 1996). The
fact that lynx are �bad colonizers� is apparent from the
Swiss Alps, where lynx had to be translocated from
the Western to the Eastern population in the Alps. Bar-
riers were not only constituted by high and snow-cappedmountain rifts, but especially by urbanized valleys,
which additionally contain motorways or waterways.
It can therefore be concluded that in Germany lynx will
probably remain restricted to the release patch. But
there is also positive news in a postulation of the Federal
Nature Conservation Agency for protecting the move-
ment corridors between the source patches, including
measures to minimize animal–vehicle collisions (Recket al., 2004).
Movement in fragmented landscapes was included to
a certain degree by using data from the Swiss JuraMoun-
tains, although there were too few data to determine
whether lynx actively avoid motorways or if instead
fences prevent them from crossing. If the latter applies,
movement could be guided, and green-bridges or under-
passes would reduce the mortality risk of dispersers.Experience of the effectiveness of wildlife passages
mainly stems from other species (Kaczensky et al.,
1996; Rodrıguez et al., 1996, 1997; Clevenger and Wal-
tho, 2000; Gloyne and Clevenger, 2001; Clevenger
et al., 2001). This implies testing methods to reduce traf-
fic collisions, including measures to increase the attrac-
tiveness of existing bridges and underpasses for wildlife.
At any rate, it is questionable whether a lynx popula-tion will have a bright future in Germany if we conclude
that in certain areas they will be restricted to their re-
lease patches. Of course, survival may be possible in
the individual patches for some time, but releases in iso-
lated patches do not contribute to an overall connected
population. Wildlife conservation means more than sim-
ply releasing a species in a given area. We must consider
the development of the population as well as linkage toother existing populations. In this sense, we strongly rec-
ommend using PVA before launching reintroductions to
assess the most suitable areas.
4.3. Recommendations for reintroductions
The results show that about 10 females are needed to
successfully establish a minimum viable population ifmortality is kept low. We also showed that the success
of a reintroduction can be influenced by the number of
lynx released. This tallies with findings on critical popu-
lation sizes for other large carnivores (e.g. Saether et al.,
1998). If demographic parameters such as the birth rate
are uncertain, it would be better to release more animals
to �be on the safe side�. This could also reduce the risk of
inbreeding. In addition, more females than males can bereleased. However, high mortality among residents can-
not be compensated for by releasing a large number of
animals. Monitoring programs should be launched that
exceed the life span of the animals to assess reintroduc-
tion success (IUCN/SSC, 1995).
This study shows that simulation models are useful
tools for establishing the comparative effectiveness of
reintroduction plans designed to increase the viabilityof the species (Van Appeldoorn et al., 1998). We recom-
mend PVA and the assessment of land change scenarios
(Dale et al., 1994; White et al., 1997; Pearson et al.,
1999; Urban, 2000; Serneels and Lambin, 2001; Morris
et al., 2002) before a species is released, so that efforts
can be focused on the most promising and fruitful areas,
as well as releasing an appropriate number of animals
that is most likely to lead to a successful reintroduction.
Acknowledgements
This work was kindly funded by Deutsche Bundess-
tiftung Umwelt (ref. 6000/596) and Deutsche Wildtier
Stiftung for the main author. E.R. was supported by a
Marie Curie Individual Fellowship provided by theEuropean Commission (Energy, Environment and
Sustainable Development; Contract EVK2-CT-1999-
50001). We thank Ludwig Trepl and Alejandro Rodrı-
guez for critically commenting on the manuscript.
Appendix A. Supplementary data
Supplementary data associated with this article can
be found in the online version at doi:10.1016/
j.biocon.2005.02.015.
References
Akcakaya, H.R., 1995. RAMAS/GIS: Linking landscape data with
wildlife management and conservation of endangered species. The
Compiler 13, 38–42.
Akcakaya, H.R., Raphael, M.G., 1998. Assessing human impact
despite uncertainty: viability of the northern spotted owl meta-
population in the northwestern USA. Biodiversity and Conserva-
tion 7, 875–894.
Ballou, J.D., 1997. Ancestral inbreeding only minimally affects
inbreeding depression in mammalian populations. Journal of
Heredity 88, 169–178.
Beissinger, S.R., Westphal, M.I., 1998. On the use of demographic
models of population viability in endangered species management.
Journal of Wildlife Management 62, 821–841.
Boyce, M.S., 1992. Population viability analysis. Annual Review of
Ecology and Systematics 23, 481–506.
Breitenmoser-Wursten, C., Zimmermann, F., Ryser, A., Capt, S.,
Laass, S., Siegenthaler, A., Breitenmoser, U., 2001. Untersuchun-
gen zur Luchspopulation in den Nordwestalpen der Schweiz 1997–
2000. KORA Bericht 9, 92.
Breitenmoser, U., Haller, H., 1993. Patterns of predation by reintro-
duced European lynx in the Swiss Alps. Journal of Wildlife
Management 57, 135–144.

S. Kramer-Schadt et al. / Biological Conservation 125 (2005) 169–182 181
Breitenmoser, U., Breitenmoser-Wursten, C., Carbyn, L.N., Funk,
S.M., 2001. Assessment of carnivore reintroductions. In: Gittle-
man, J.L., et al. (Eds.), Carnivore Conservation. University of
Cambridge Press, Cambridge, England, pp. 241–281.
Breitenmoser, U., Breitenmoser-Wursten, C., Okarma, H., Kaphegyi,
T., Kaphegyi-Wallmann, U., Muller, U.M., 2000. The Action Plan
for the Conservation of the Eurasian Lynx (Lynx Lynx) in Europe.
Council of Europe, Switzerland, p. 63.
Breitenmoser, U., Kaczensky, P., Dotterer, M., Breitenmoser-Wur-
sten, C., Capt, S., Bernhart, F., Liberek, M., 1993. Spatial
organization and recruitment of lynx (Lynx lynx) in a re-
introduced population in the Swiss Jura Mountains. Journal of
Zoology (London) 231, 449–464.
Brook, B.W., Burgman, M.A., Akcakaya, H.R., O�Grady, J.J.,
Frankham, R., 2002. Critiques of PVA ask the wrong questions:
Throwing the heuristic baby out with the numerical bath water.
Conservation Biology 16, 262–263.
Brook, B.W., Burgman, M.A., Frankham, R., 2000. Differences and
congruencies between PVA packages: the importance of sex ratio
for predictions of extinction risk. Conservation Ecology [online] 4,
6.
Brooks, T.M., Mittermeier, R.A., Mittermeier, C.G., da Fonseca,
G.A.B., Rylands, A.B., Konstant, W.R., Flick, P., Pilgrim, J.,
Oldfield, S., Magin, G., Hilton-Taylor, C., 2002. Habitat loss and
extinction in the hotspots of biodiversity. Conservation Biology 16,
909–923.
Bustamante, J., 1998. Use of simulation models to plan species
reintroductions: the case of the bearded vulture in Southern Spain.
Animal Conservation 1, 229–238.
Caughley, G., 1980. Analysis of Vertebrate Populations. John Wiley &
Sons, Chichester.
Clevenger, A.P., Chruszcz, B., Gunson, K., 2001. Drainage culverts as
habitat linkages and factors affecting passage by mammals. Journal
of Applied Ecology 38, 1340–1349.
Clevenger, A.P., Waltho, N., 2000. Factors influencing the effective-
ness of wildlife underpasses in Banff National Park, Alberta
Canada. Conservation Biology 14, 47–56.
Crooks, K., Sanjayan, M.A., Doak, D.F., 1998. New insight on
cheetah conservation through demographic modeling. Conserva-
tion Biology 12, 889–895.
Dale, V.H., Pearson, S.M., Offerman, S.M., O�Neill, R.V., 1994.
Relating patterns of land-use change to faunal biodiversity in the
Central Amazon. Conservation Biology 8, 1027–1036.
Ebenhard, T., 2000. Population viability analyses in endangered
species management: the wolf, otter and peregrine falcon in
Sweden. Ecological Bulletins 48, 143–163.
Ellner, S.P., Fieberg, J., 2003. Using PVA for management despite
uncertainty: effects of habitat, hatcheries, and harvest on salmon.
Ecology 84, 1359–1369.
Fernandez, N., Delibes, M., Palomares, F., Mladenoff, D.J., 2003.
Identifying breeding habitat for the Iberian lynx: inferences from
a fine scale spatial analysis. Ecological Applications 13, 1310–
1324.
Ferreras, P., 2001. Landscape structure and asymmetrical inter-patch
connectivity in a metapopulation of the endangered Iberian lynx.
Biological Conservation 100, 125–136.
Ferreras, P., Aldama, J.J., Beltran, J.F., Delibes, M., 1992. Rates and
causes of mortality in a fragmented population of Iberian lynx
(Felis pardina Temminck, 1824). Biological Conservation 61, 197–
202.
Ferreras, P., Beltran, J.F., Aldama, J.J., Delibes, M., 1997. Spatial
organization and land tenure system of the endangered Iberian lynx
(Lynx pardinus). Journal of Zoology (London) 243, 163–189.
Ferreras, P., Gaona, P., Palomares, F., Delibes, M., 2001. Restore
habitat or reduce mortality. Implications from a population
viability analysis of the Iberian lynx. Animal Conservation 4,
265–274.
Gaona, P., Ferreras, P., Delibes, M., 1998. Dynamics and viability of a
metapopulation of the endangered Iberian Lynx (Lynx pardinus).
Ecological Monographs 68, 349–370.
Gloyne, C.C., Clevenger, A.P., 2001. Cougar Puma concolor use of
wildlife crossing structures on the Trans-Canada highway in Banff
National Park, Alberta. Wildlife Biology 7, 117–124.
Grimm, V., Revilla, E., Groeneveld, J., Kramer-Schadt, S., Schwager,
M., Tews, J., Wichmann, M.C., Jeltsch, F., 2005. Importance of
buffer mechanisms for population viability analysis. Conservation
Biology 19 (2), 578–580.
Haight, R.G., Cypher, B., Kelly, P.A., Phillips, S., Possingham, H.P.,
Ralls, K., Starfield, A.M., White, P.J., Williams, D., 2002.
Optimizing habitat protection using demographic models of
population viability. Conservation Biology 16, 1386–1397.
Haller, H., Breitenmoser, U., 1986. Zur Raumorganisation der in den
Schweizer Alpen wiederangesiedelten Population des Luchses
(Lynx lynx). Zeitschrift fur Saugetierkunde 51, 289–311.
Hansen, A.J., Rotella, J.J., Kraska, M.P.V., Brown, D., 1999.
Dynamic habitat and population analysis: an approach to resolve
the biodiversity manager�s dilemma. Ecological Applications 9,
1459–1476.
Howells, O., Edward-Jones, E., 1997. A feasibility study of reintro-
ducing wild boar (Sus scrofa) to Scotland: are existing woodlands
large enough to support minimum viable populations? Biological
Conservation 51, 77–89.
Huth, A., Ditzer, T., Bossel, H., 1998. The Rain Forest Growth Model
FORMIX3. Model Description and Analysis of Forest Growth
and Logging Scenarios for the Deramakot Forest Reserve (Malay-
sia). Verlag Erich Goltze GmbH & Co. KG, Gottingen.
IUCN/SSC, 1995. Guidelines for Re-introductions. Gland,
Switzerland.
Jedrzejewski, W., Jedrzejewska, B., Okarma, H., Schmidt, K., Bune-
vich, A.N., Milkowski, L., 1996. Population dynamics (1869–
1994), demography, and home ranges of the lynx in Bialowieza
Primeval Forest (Poland and Belarus). Ecography 19, 122–138.
Jobin, A., Molinari, P., Breitenmoser, U., 2000. Prey spectrum, prey
preference and consumption rates of Eurasian lynx in the Swiss
Jura Mountains. Acta Theriologica 45, 243–252.
Kaczensky, P., Knauer, F., Jonozovic, M., Huber, T., Adamic, M.,
1996. The Ljubljana–Postojna Highway – a deadly barrier for
brown bears in Slovenia. Journal of Wildlife Research 1, 263–
267.
Keane, B., Waser, P.M., Creel, S.R., Creel, N.M., Elliott, L.F.,
Minchella, D.J., 1994. Subordinate reproduction in dwarf mon-
gooses. Animal Behaviour 47, 65–75.
Keller, L.F., Waller, D.M., 2002. Inbreeding effects in wild popula-
tions. Trends in Ecology & Evolution 17, 230–241.
Kelly, M.J., Durant, S.M., 2000. Viability of the Serengeti cheetah
population. Conservation Biology 14, 786–797.
Kramer-Schadt, S., Revilla, E., Wiegand, T., Breitenmoser, U., 2004.
Fragmented landscapes, road mortality and patch connectivity:
modelling influences on the dispersal of Eurasian lynx. Journal of
Applied Ecology 41, 711–723.
Lande, R., Barrowclough, G.F., 1987. Effective population size,
genetic variation, and their use in population management. In:
Soule, M.E. (Ed.), Viable Populations for Conservation. Cam-
bridge University Press, Cambridge, England, pp. 87–123.
Leaper, R., Massei, G., Gorman, M.L., Aspinall, R., 1999. The
feasibility of reintroducing Wild Boar (Sus scrofa) to Scotland.
Mammal Review 29, 239–259.
Letcher, B.H., Priddy, J.A., Walters, J.R., Crowder, L.B., 1998. An
individual-based, spatially-explicit simulation model of the popu-
lation dynamics of the endangered red-cockaded woodpecker,
Pioides borealis. Biological Conservation 86, 1–14.
Mathews, F., Macdonald, D.W., 2001. The sustainability of the
common crane (Grus grus) flock breeding in Norfolk: insights from
simulation modelling. Biological Conservation 100, 323–333.

182 S. Kramer-Schadt et al. / Biological Conservation 125 (2005) 169–182
McCarthy, M.A., Lindenmayer, D.B., Possingham, H.P., 2000.
Testing spatial PVA models of Australian treecreepers (Aves:
Climacteridae) in fragmented forest. Ecological Applications 10,
1722–1731.
McCarthy, M.A., Lindenmayer, D.B., Possingham, H.P., 2001.
Assessing spatial PVA models of arboreal marsupials using
significance tests and Bayesian statistics. Biological Conservation
98, 191–200.
Merrill, T., Mattson, D.J., Wright, R.G., Quigley, H.B., 1999.
Defining landscapes suitable for restoration of grizzly bears Ursus
arctos in Idaho. Biological Conservation 87, 231–248.
Morris, W.F., Bloch, P.L., Hudgens, B.R., Moyle, L.C., Stinchcombe,
J.R., 2002. Population viability analysis in endangered species
recovery plans: Past use and future improvements. Ecological
Applications 12, 708–712.
O�Toole, L., Fielding, A.H., Haworth, P.F., 2002. Re-introduction of
the golden eagle into the Republic of Ireland. Biological Conser-
vation 103, 303–312.
Okarma, H., Jedrzejewski, W., Schmidt, K., Kowalczyk, R., Jedrze-
jewska, B., 1997. Predation of Eurasian lynx on roe deer and red
deer in Bialowieza Primeval Forest, Poland. Acta Theriologica 42,
203–224.
Pearson, S.M., Drake, J.B., Turner, M.G., 1999. Landscape change
and habitat availability in the southern Appalachian Highlands
and Olympic Peninsula. Ecological Applications 9, 1288–1304.
Penn, A.M., Sherwin, W.B., Gordon, G., Lunney, D., Melzer, A.,
Lacy, R.C., 2000. Demographic forecasting in koala conservation.
Conservation Biology 14, 629–638.
Posillico, M., Meriggi, A., Pagnin, E., Lovari, S., Russo, L., 2004. A
habitat model for brown bear conservation and land use planning
in the central Apennines. Biological Conservation 118, 141–150.
Possingham, H.P., Davies, I., 1995. ALEX: a model for the viablity
analysis of spatially structured populations. Biological Conserva-
tion 73, 143–150.
Reck, H., Hanel, K., Bottcher, M., Winter, A., 2004. Leb-
ensraumkorridore fur Mensch und Natur. Abschlussbericht zur
Erstellung eines bundesweit koharenten Grobkonzeptes (Initiat-
ivskizze) (Eds). Bundesamt fur Naturschutz & Deutscher Jagds-
chutz-Verband, p. 42.
Reed, J.M., Mills, L.S., Dunning, J.B., Menges, E.S., McKelvey, K.S.,
Frye, R., Beissinger, S.R., Anstett, M.C., Miller, P., 2002.
Emerging issues in population viability analysis. Conservation
Biology 16, 7–19.
Revilla, E., Wiegand, T., Palomares, F., Ferreras, P., Delibes, M.,
2004. Effects of matrix heterogeneity on animal dispersal: from
individual behavior to metapopulation-level parameters. The
American Naturalist 164, E130–E153.
Rodrıguez, A., Crema, G., Delibes, M., 1996. Use of non-wildlife
passages across a high speed railway by terrestrial vertebrates.
Journal of Applied Ecology 33, 1527–1540.
Rodrıguez, A., Crema, G., Delibes, M., 1997. Factors affecting
crossing of red foxes and wildcats through non-wildlife passages
across a high-speed railway. Ecography 20, 287–294.
Ryser-Degiorgis, M.-P., Ryser, A., Bacciarini, L., Angst, C., Gottstein,
B., Janovsky, M., Breitenmoser, U., 2002. Notoedric and sarcoptic
mange in free-ranging lynx from Switzerland. Journal of Wildlife
Diseases 38, 228–232.
Saccheri, I., Kuussaari, M., Kankare, M., Vikman, P., Fortelius, W.,
Hanski, I., 1998. Inbreeding and extinction in a butterfly meta-
population. Nature 392, 491–494.
Saether, B.-E., Engen, S., Swenson, J.E., Bakke, O., Sandegren, F.,
1998. Assessing the viability of Scandinavian brown bear, Ursus
arctos, populations: the effects of uncertain parameter estimates.
OIKOS 83, 403–416.
Sarrazin, F., Legendre, S., 2000. Demographic approach to releasing
adults versus young in reintroductions. Conservation Biology 14,
488–500.
Schadt, S., Knauer, F., Kaczensky, P., Revilla, E., Wiegand, T., Trepl,
L., 2002a. Rule-based assessment of suitable habitat and patch
connectivity for the Eurasian lynx in Germany. Ecological Appli-
cations 12, 1469–1483.
Schadt, S., Revilla, E., Wiegand, T., Knauer, F., Kaczensky, P.,
Breitenmoser, U., Bufka, L., Cerveny, J., Koubek, P., Huber, T.,
Stanisa, C., Trepl, L., 2002b. Assessing the suitability of central
European landscapes for the reintroduction of Eurasian lynx.
Journal of Applied Ecology 39, 189–203.
Schmidt-Posthaus, H., Breitenmoser-Wursten, C., Posthaus, H., Bac-
ciarini, L., Breitenmoser, U., 2002. Causes of mortality in
reintroduced Eurasian lynx in Switzerland. Journal of Wildlife
Diseases 38, 84–92.
Serneels, S., Lambin, E.F., 2001. Impact of land-use changes on the
wildebeest migration in the northern part of the Serengeti-Mara
ecosystem. Journal of Biogeography 28, 391–407.
Sobel, N., Khan, R.M., Saltman, A., Sullivan, E.V., Gabrieli, J.D.E.,
1999. Restoration of an inbred adder population. Nature 402, 34–
35.
Soule, M.E., 1987. Introduction. In: Soule, M.E. (Ed.), Viable
Populations for Conservation. Cambridge University Press, Cam-
bridge, England, pp. 1–10.
South, A., Rushton, S., Macdonald, D., 2000. Simulating the proposed
reintroduction of the European beaver (Castor fiber) to Scotland.
Biological Conservation 93, 103–116.
Steury, T.D., Murray, D.L., 2004. Modeling the reintroduction of lynx
to the southern portion of its range. Biological Conservation 117,
127–141.
Trombulak, S.C., Frissell, C.A., 2000. Review of ecological effects of
roads on terrestrial and aquatic communities. Conservation Biol-
ogy 14, 18–30.
Urban, D.L., 2000. Using model analysis to design monitoring
programs for landscape management and impact assessment.
Ecological Applications 10, 1820–1832.
Van Appeldoorn, R.C., Knaapen, J.P., Schippers, P., Verboom, J.,
Van Engen, H., Meeuwsen, H., 1998. Applying ecological knowl-
edge in landscape planning: a simulation model as a tool to
evaluate scenarios for the badger in the Netherlands. Landscape
and Urban Planning 41, 57–69.
White, D., Minotti, P.G., Barczak, M.J., Sifneos, J.C., Freemark,
K.E., Santelmann, M.V., Steinitz, C.F., Kiester, A.R., Preston,
E.M., 1997. Assessing risks to biodiversity from future landscape
change. Conservation Biology 11, 349–360.
Wiegand, T., Naves, J., Stephan, T., Fernandez, A., 1998. Assessing
the risk of extinction for brown bear (Ursus arctos) in the
Cordillera Cantabrica, Spain. Ecological Monographs 68, 539–
570.
Wiegand, T., Revilla, E., Knauer, F., 2004. Reducing uncertainty in
spatially explicit population models. Biodiversity and Conservation
13, 53–78.
Wotschikowsky, U., Kaczensky, P., Knauer, F., 2001. Wiederansied-
lung des Luchses im Harz. Eine kritische Stellungnahme aus
wildbiologischer Sicht. Naturschutz und Landschaftsplanung 33,
259–261.
Wolfl, M., Bufka, L., Cerveny, J., Koubek, P., Heurich, M., Habel, H.,
Huber, T., Poost, W., 2001. Distribution and status of lynx in the
border region between Czech Republic, Germany and Austria.
Acta Theriologica 46, 181–194.
Zar, J.H., 1999. Biostatistical Analysis. Prentice-Hall, Upper Saddle
River, New Jersey.
Zimmermann, F., 1998. Dispersion et survie des Lynx (Lynx lynx)
subadultes d�une population reintroduite dans la chaine du Jura.
KORA Bericht 4, 50.
Zimmermann, F., 2004. Conservation of the Eurasian lynx (Lynx
lynx) in a fragmented landscape – habitat models, dispersal and
potential distribution. Ph.D. Thesis. Universite de Lausanne, p.
179.