krause fund research fall 2019 - tippie.uiowa.edu
TRANSCRIPT

Krause Fund Research Fall 2019
Valero Energy Corporation (VLO) Industrials – Energy
Stock Rating:
Nov 15th, 2019
Target Price: $90-$105 Yuke Zhang Xiaojin Tou [email protected] [email protected]
Investment Thesis
We recommend a Sell rating for Valero because it could not hedge primary government regulation and economic risk. Besides, the Crude oil price will gradually decrease while the economy takes time to recover in the long run. However, the Company has a leading position in the industry while also strength in creates a new product line. Drivers of Thesis
• Government Regulation: The environmental laws and regulations are continuously being enacted and proposed, which may result in a change to operating permits, material changes in operations, and increasing costs.
• Crude Oil Price Decreasing: The CME group projected a decrease in the crude oil price within the following two years. This will significantly influence Valero’s share performance due to the high correlation between them.
Risks to Thesis • Leading Position in Refining Industry: Rank two at US leading refining
companies that hold a large number of refiners and vast resources and well-spread pipelines.
• Stable Buyer Power and Supplier Power: Valero signed a long-term contract with sable large buyers and suppliers, ensured them to make a profit, and delivering values to shareholders continually.
• Renewable Diesel: Valero opened its new product line called renewable diesel. This innovation and development bring reportable revenue to Valero and will continue to grow.
Year 2017 2018 2019E 2020E 2021E 2022E EPS $9.17 $7.30 $9.88 $9.49 $10.07 $10.95 Growth 16.67 % -20.39% 35.34% -3.90% 8.73% 9.97%
12 Month Performance
DCF Model $95 DDM Model $84 Relative Valuation $122
Price Data Current Price $100.61 52wk Range $68.81-$101.99
Key Statistics Market Capitalization (B) 40.01 Shares Outstanding (MM) 426
Dividend Yield 3.18% Two Year Beta 1.13 Earnings Per Share 5.54 Payout Ratio 39.82% Est. 5 Yr. Growth CAGR 2.782% Price/Earnings (TTM) 9.86x Price/Earnings (FY1) 9.47x
Profitability Profit Margin (TTM) 2.87% Return on Assets (TTM) 7.35% Return on Equity (TTM) 6.62%
Krause Fund Research Fall 2019
Analysts:
Investment Thesis
Target Price: $84 - $95
Company Description
Valero Energy Corp (Valero) is a downstream company that manufactures and markets transportation fuels and petrochemical products. Valero refineries produce gasoline, diesel, distillates, lubricants, and other refined products. Valero’s robust sales network strengthened its operations by providing access to the global market.
SELL
Earnings Estimates
12 Months Performance
Relative Financial

2 | P a g e
As of November 15, 2019, our University of Iowa Krause Fund analyst team recommends a “Sell” rating for Valero Energy Corporation. Many factors impact the share price of Valero, including advantages and disadvantages, and more details will be explained in the following report. Trump Administration’s granting of waivers to major Iranian customers, suggesting that the market would not be short of oil. According to CME crude oil futures3, the oil price per barrel in DEC.2019 is $57.05, DEC 2020 is $53.4, DEC 2021 is $51.73 per barrel. DEC 2022 is $51.27 per barrel. DEC 2023 is $51.41 per barrel. DEC 2024 is $51.67 per barrel. Due to the inverted back of the yield curve, the economy will start to reverse itself from sign or recession.
Oil Supply and Demand
Oil Price is an essential indicator of the global economy and the U.S. economy. WTI Oil Price also has a strong relationship with the Energy sector that will influence future revenue performance of the Energy sector. Valero, as a refining company, is driven significantly by the oil price. As a graph showing below, the main trend of Valero’s stock price is almost identical with the WTI Oil Price. Therefore, we are predicting Valero mainly on WTI Oil Price change.
The Organization of the Petroleum Exporting Countries (OPEC) coordinates and unifies the petroleum policies of its Member Countries and managing the oil supply to create long-term efficient and economical to consumers1.In 2016 to 2018. OPEC cut oil production from 33.8 to 32.5 million barrels a day2. This significant decrease in supply resulted in a huge increase in the Oil Price from $40 to $70. At the end of 2018, the actual demand for OPEC oil dropped by 1.2 mb/d3, which primarily due to the Trump Administration’s granting of waivers to major Iranian customers, suggesting that the market would not be short of oil. Currently, the increasing trend was started in December 2018. OPEC and allies agree to cut oil production by 1.2 million barrels per day, which will increase the oil price at the end of 20184. By plotting linear regression analysis with Oil Price regress on Dates, we discovered a linear relationship with an upward curve. As the trendline observing from the graph indicates, we calculated
the growing rate of Oil Price is 1.7%. Though this regression does not necessarily indicate a price increase at a constant rate, it provides a signal that even the oil price falls, it will not fall significantly. With precise prediction, we look at the CME group Crude Oil Futures Quotes. CME Group is the world's leading and most diverse derivatives marketplace offering the widest range of futures and options products for risk management. And the graph is showing below as a smooth curve for Oil Futures Price.
Error! Bookmark not defined. As the graph CME Crude Oil Futures Quotes showing. The CME group projected the expected oil price to decrease in the year 2020 and 2021, and then the price will gradually to stay stable nearly $52. Due to the trend line of oil price, we concluded that the stock price for Valero would have the same growth. The estimated ending price: $57.05 FY19, $53.4 FY20, $51.73 FY21, $51.27 FY22, $51.41 FY23, $51.67 FY24. However, we do not assume a constant rate as always, so we estimate a bit decrease at the CV24.
As digging into the Futures Quotes, the changing in Estimated Crude Oil Price are lying above, and we do expect Valero’s sale price to change with that scale as well.
10-Year Treasury Bill Rate and Fed Fund Rate
As a primary indicator of the U.S economy, treasury bond yield (or rates) is tracked by investors for many reasons. When building our forecast model, we use the 10-Year Treasury Bill rate as our risk-free rate. This is significant since we are using it to predict Weighted Average Cost Capital (WACC). A treasury bond matures in more than ten years, and its yield is closely watched as an indicator of broader investor confidence. Because the treasury carries the full backing of the U. S government, they are viewed as the safest investment. On the other hand, long-term T-bill reflects the U.S economy. The condition of the T-bill can somehow reflect the health status of the U.S economy.
Executive Summary
Macroeconomic Outlook

3 | P a g e
At the end of summer in 2019, the US economy encountered an inverted yield curve, in which the short-term Treasury yield exceeds the long-term Treasury yield. The 2-year/10-year version of the yield curve has preceded each of the past seven recessions, including the most recent slowdown between 2007 and 20095. The more pronounced inversion is a sign that people are more concerned about the fallout of the trade war between the U.S. and China and worried by signs that economic may enter a recession with global wide6.
Also, due to the fear of recession, investors do pay much more attention to the market. This kind of risk aversion may reduce trade and lower the market price. It spooked the market and resulted in the S&P 500 index falling nearly 3%6. Valero does correlate with the overall market (S&P 500 index), which will be discussed later. Therefore, if the economy enters a recession, we must adjust its values and reconsider our recommendation. To inverted back the yield curve, the Federal Reserve cut interest rates, trimming the federal funds rate by 0.25 percent to a range of 1.5 percent to 1.75 percent7. As the dot plot showing below, the FED consensus has no more cut in the following years, and it is growing back.
8
9 After the rate cut, we can see the obvious difference in the yield curve as the graph above. The blue line is the yield curve that lines in Jul.5 the There is downward sloping from 1 month to 3-year treasury yield. While red lines represent the yield curve after the cut, it signals the economy back to a normal trend. We conclude the recession will not happen for the following years. Based on the condition of recent 5 years 10-year T-Notes from Bloomberg, as the graph represented above, we can observe an obvious trend line. After 2016. It gradually increased and reached its highest peak in 2018, which is around 3.062%. This year until September, the 10-yr bond rates decreased to its another down point, which is roughly 1.558%.
Error! Bookmark not defined.
Due to the Fed Consensus to gradually raise the interest rate, we expected the 10-Yr Treasury Bond Rate to increase as well gradually. This will avoid another inverted yield curve. With that being said, the risk-free rate will keep constant or even grow. In conclusion, we will have a lower risk-free rate compares to the previous two years. This will lead to less cost of equity and cost of debt, which further drives the firm’s WACC to be relatively lower.
Real GDP Growth Real Gross Domestic Product (GDP) is another key indicator of economic development that influences the demand for oil and other energy resources. Real Gross Domestic Product is primarily apt to gauge the health of a country’s economy. The significant change of Real GDP, whether up and down, will have a large impact on everyone who is within the economy. Growth normally indicates that the whole economy is healthy and flourishing.

4 | P a g e
Conversely, negative growth can be used to determine whether the economy is in a recession. Companies in the energy sector’s operating activities will drive Real GDP, and the growth of Real GDP will indicate the change of energy sector output. As the graph illustrated, the Wall crude oil price is highly associated with economic growth. In the economic crisis 2008-2019, where the world GDP grows negative, the rising WTI crude oil price also held down as the orange lane represented. On the other hand, the consummation of liquid fuels also correlated with economic growth. In conclusion, if encountered highly growth or economic downturn, oil price and oil consummation will rise and goes down as well10.
The energy sector growth has been a tailwind to GDP growth, accounting for approximately 7.6 percent of U.S. GDP and 5.6 percent of total U.S. employment in 2015, according to the American Petroleum Institute (API)11. The Real GDP growth has remained positive and relatively steady; however, it also had an obvious decrease in 2018. The reason for GDP growth decline could be complicated, but the collapse in oil prices late in 2018 could be a substantial effect of the decline. Additionally, because of the spring back of crude oil prices, the Real GDP growth returned to 3.1%. Compared with the considerable growth in the first quarter of 2019, the second quarter growth decreased again to 2.0%. The deceleration in Real GDP in the second quarter primarily reflected downturns in private domestic investment and exports, according to the Bureau of Economic. Because the trade war still becomes worse, we anticipated that the Net Export will still be negative growth in the next quarter, and the domestic investment will be deteriorated because of the yield curve inversion. So, the Real GDP growth will range from 1.9% to 2.2%. This also reaches our Krause Fund consensus.
12
Unemployment Rate
The unemployment rate is one of the most important indicators of the U.S. economy, reflecting the percentage of unemployed workers in the total labor force. A low unemployment rate reflects the health condition of the economy. It also relates to vehicle miles travel, which can affect the consummation of oil. In the 2008 financial crisis, the unemployment rate reached 7.2%, and after this recession, the unemployment rate went to the highest point 10.2% during 2009, and until now it went down from 10.2% to 3.7%. Recently, the outlook of employment is positive. Up to September 2019, the U.S unemployment rate reaches 3.5%, which is at the lowest point in 50 years13. As the graph shows, the blue line represents the unemployment rate, and the red line represents the vehicle milts travel (VMT). Even though the VMT is a seasonal activity, we still can obtain the fitted line with upward sloping. Additionally, the VMT is increasing as the unemployment rate goes down. With a 50-year low for unemployment rate and consistent job gains, the September employment data make it clear that the American labor market remains historically strong. With that being said, we estimate this stable environment for unemployment will drive the VMT to increase at a constant rate14.
15

5 | P a g e
Industry Overview
Nowadays, crude oil serves as an indispensable part of world energy and acts for essential resources. Major refining companies do have a large market cap, and this allows them to process complex chemical reactions and to carry streams of fluids to terminals. Majority of the oil refining companies corporate with large buyers by signing long term contracts. This allows them to focus on long-run technology improvement and oil refining. The WTI crude oil price is estimated to decrease from $57 in 2017 to $52 in 2024 during the forecast period. This is a critical market driver for refiners. The global demand for crude oil products will continue to grow. Growth of population and consumer class in Asia increase oil demand. High consumption of oil will mainly be due to the transportation sectors in developing countries like India, China, etc.16. From the macroeconomic analysis, we believe the political factor might still affect the whole industry for a while. Considering the growth of the overall market, we optimistically assume that the global economy will still grow up, and the Integrated Oil and Gas industry will benefit from this growth. Where decreasing in Oil Price is for the overall industry, and it does not explain a persist decrease in the company.
Company Overview Valero Energy Corp (Valero) is a midstream and downstream company that refines, markets, distributes and transports fuels and other petrochemical products. As the graph showing below, at the end of FY2018, the company operates through two reportable segments, Refining (96.9%) and Ethanol (3.1%). Valero terminated its VLP segment and merged into its Refining Segment at the end of FY2018. Valero also created a new reportable segment renewable diesel, because of the growing importance of renewable fuels in the market and the growth of our investments in renewable fuels production, starting from FY2019.
Revenue Stream
Midstream activities include the processing, storing, transporting and marketing of oil, natural gas, and natural gas liquids. VLP segment helps Valero to transfer and store oil. The other major stages are upstream, which refers to raw crude oil and natural gas production. Valero Energy Corporation has no reportable segments in this stream. Downstream refers to the refining of crude oil into gasoline, diesel, jet, and other fuels. The Refining segment and the Ethanol segment are in midstream activities17.
Refiners Valero's refining segment includes its refining operations, associated marketing activities, and logistics assets that support its refining operations. Valero, through its subsidiaries, owns 15 petroleum refineries in the United States, Canada, and the United Kingdom, with a combined throughput capacity of approximately 3.1 million barrels per day. Valero owns 14 ethanol plants in the Mid-Continent region of the United States with a combined production capacity of approximately 1.73 billion gallons per year18. Refiners revenue is mainly driven by “Crack Spread”, the spread between crude oil price and products derived from oil processing. The larger the spread, the better it is for Valero Energy to determine its refining revenue. Refiners take raw materials into finished products. Valero takes crude oil as raw materials and refines it to diesel and ethanol. As the graph showing below, it shows a graft of an industrial furnace to refine crude oils. With different temperature, the more spread in the furnace, the more refining products it will produce19.
Industry Analysis

6 | P a g e
Competitive Environment
Up to the year 2018, 135 operating refineries are competing for each other across 30 states20.The major competitors in the T3 (downstream) sector are Valero Energy, Marathon Petroleum, HollyFrontier. They are companies that focus on oil refining and are on the S&P 500. As data retrieved from the government website, the graph showing below indicate heading refining companies’ total operable tropospheric crude oil distillation capacity. Marathon has the highest capacity, which leads the entire refining industry; however, Valero Energy Cop ration does hold the second place. 21
The major players in this industry are those mega-companies such as Exxon Mobil, BP, Chevron, etc. They control most of the resources and market share of the whole industry.
XOM CVX VLO MPC HFC PSX
ROE 11 9.8 14.3 11.3 19.4 19.3
Debt to Equity 23.71 19.6 44.46 83.04 40.53 40.1
Profit Margin 23.7 27.5 8.9 8.5 18.2 4.2
Net Income 20,549 14,798 3096 2779 1086 5520
Free Cash Flow 3,998 9,042 2504 1904 1296 4560
P/E 14.2 14.1 10.4 11.2 8.3 7.3
Mark Cap 307,348 230,658 35444 34503 8456 52590
EPS 4.81 7.73 7.23 5.28 6.15 16.65
Growth (EPS) 48.8 104.5 46.1 40.2 120.9 19.8
--2018 Annual Report22
Cheverton Corporation (CVX) Cheverton Corporation is a giant company with a market cap of 231B. It engages in the provision of administrative, financial management, and technology support for energy and chemical operations. It operates through the Upstream 32% and Downstream segments 68%. The reason for Cheverton as a huge market size can be computable is that 63% of their businesses are non-US. Therefore, we will not intensity CVX as our big competitor. Exxon Mobil Corporation (XOM) Exxon Mobil Corporation is another company that engages in the exploration, development, and distribution of oil, gas, and petroleum products. It operates through the following segments: Upstream, Downstream, and Chemical23. The Downstream segment manufactures and trades petroleum product, which covers 80% of their revenue. They do have a geographic segment as 65% are non-US, while for VLO, it is 29%24. It also has a very large market cap as 231B, and we will not consider it. Marathon Petroleum Corporation (MPC) Marathon Petroleum Corporation is an independent petroleum product refiners, marketers, and transporters in the United States. The company operates through the following segments: Refining & Marketing, Retail, and Midstream. The Refining & Marketing segment refines crude oil and other feedstocks at its refineries in the Gulf Coast and Midwest regions of the United States, purchases ethanol and refined products for resale, and distributes refined products through various means23, where MPC has its 72% revenue as refining & marketing, it will be the primary competitor for Valero24. Phillips 66 (PSX) Phillips 66 engages in the processing, transportation, storage, and marketing of fuels and other related products. It has diversified revenue, of which 50% are from refining, and 45% are from marketing and specialties. PSX is a very good substitute for VLO; the reason for that is their market cap is close. PSX as 53B and VLO as 41B are relatively middle firms in the industry. HollyFrontier Petroleum Corporation (HFC) HollyFrontier Corporation is an independent petroleum refiner and marketer. It specializes in gasoline, diesel fuel, jet fuel, specialty lubricant products, and specialty and modified asphalt. The Refining segment includes the operations in El Dorado, Tulsa, Navajo, Cheyenne, and Woods Cross Refineries23. Wherefrom Barrels/Day for US leading refining companies, HFC shows no competing power with other refiners. When comparing VLO, MPC, PSX, we noticed that MPC has a very high debt to equity ratio. This means they are high leverage and may face an interest rate risk. PSX has highest ROE, and the highest EPS. Where their growth for EPS only 19.8% percent. Comparing with Valero’s 46%, Valero is tending to increase more in the long run. Since it has relatively lower Marcescent, higher profit margin, higher growth on EPS, and higher P/E.

7 | P a g e
21 In the refining industry, the above chart shows the number of refineries each company has. By observing, we concluded that Marathon petroleum, Valero Energy, and Phillips 66 will still lead the refining industry. 24
When looking at the above graph, which represents of 2018-2019 3 stock prices with respect to each other, as a conclusion, MPC does perform poorly this year due to the yellow line nearly to have a significant increase. Valero and Phillips 66 continue to increase as time goes, which indicates these two stocks are rewarding in current refining industries and need further analysis.
Porter’s Five Forces Analysis New Entrants Profitability Threat: Weak The refining industry has huge capital and high barriers for new entrants, which discussed before it requires extradentary refineries. Additionally, Government regulation and licenses are also required for entering the industry. Buyer Power Profitability Threat: Weak Only the price is sensitive in which pipeline transfer petroleum has nearly zero risk, due to stable large customers and long-term contract. There are nine customers for Valero and their customers, mainly in the petroleum liquid pipeline and storage industry. The most significant customers are Energy Transfer, NuStar Energy, Magellan Midstream Partners, which are also Valero’s partners
Supplier Power Profitability Threat: Weak The raw material of Valero can be crude oil (heavy sour crude oil, medium/ light sour crude oil, sweet crude oil) in the refining segment and corn in the ethanol segment. As same as buyer power, stable large customers and long-term contracts will keep the threat as weak There are 27 suppliers for Valero, including some main suppliers such as Smiths Group PLC (1.42% revenue), MRC Global Inc (0.97% revenue), Jacobs Engineering Group Inc (0.21% revenue), Chesapeake Energy (10% revenue), Pioneer Natural Resources (9% revenue), Marathon Oil Crop (11% revenue), Continental Resources Inc (11.95% revenue), Eaton Corn PLC (1.85% revenue), NuStar Energy PLC (16% revenue), and MISC Bud (2.71% revenue)Error! Bookmark not defined.. Internal Competition Profitability Threat: Strong The competitiveness in the downstream sector, which include in the integrated oil and gas, is significantly intensive. Which we illustrated before, nearly every refiner wants the market share. Substitutes/Complements Profitability Threat: Weak Nuclear Energy, Biofuels and other renewable energy, Hydrogen need long-term investment in order to replace Oil and Gas. The integrated oil and gas industry, which is a fundamental commodity business will be significantly influenced by changes in oil, gas, petrochemical prices, and margins on refined products. The company that can provide the lowest prices will have the most intensive competition in this industry. Additionally, local, regional, and global events or regulations about oil control will affect supply and demand for the relevant commodity. The companies in the Integrated oil and gas industry is a price taker. Crude oil and natural gas prices are subject to external factors over which the company has no control, including product demand connected with global economic conditions, industrial production and inventory levels, technology advancements, production quotas or other actions imposed by the Organization of Petroleum Exporting Countries (OPEC) or other producers, actions of regulators, weather-related damage and disruptions, competing fuel prices, and regional supply interruptions or political uncertainty

8 | P a g e
Overview Valero Energy Corp (Valero) is a downstream company that manufactures and markets transportation fuels and petrochemical products. Valero refineries produce gasoline, diesel, distillates, lubricants, and other refined products. On the other hand, their Ethanol segment includes its ethanol operations, associated marketing activities, and logistics assets that support its ethanol operations. Its assets include petroleum refineries, ethanol plants, and renewable diesel production. The Renewable Diesel covers the operations of Diamond Green Diesel Holdings LLC. Valero is headquartered in San Antonio, Texas, the US. The company’s NYSE ticker is “VLO”.
Corporate Strategy Valero aims at expanding its geographical footprint in the global energy business. The company’s strategic focus lies in the creation of long-term shareholder value through maintaining sustainable growth in profits. Its strategic priorities include attaining cost leadership, improving operational efficiency and liquidity, and increasing its marketing business. Valero pursues value-enhancing strategies to acquire assets, with a focus on operations, which would provide profitable long-term growth.
Company News22 Growth Rate For both 2019 and 2020, from VLO’s annual report, it expects to incur approximately $2.5 billion for capital investments, consisting of approximately 60 percent for sustaining capital and 40 percent for growth strategies. High capital investments lead to lower leverage for Valero Energy, resulting in lower interest rate risk. Acquisition of Ethanol Plants (November 15, 2018) Valero acquired three ethanol plants from two subsidiaries of Green Plains Inc. for a total cash consideration of $320 million, including working capital of $20 million. Therefore, it increases from 11 ethanol plants to 14. Undoubtedly, this also provides solid evidence that Valero is leading in the industry. Merge with VLP (January 10, 2019) Valero completed our acquisition of all the outstanding publicly held common units of VLP pursuant to a definitive Agreement and Plan of Merger (Merger Agreement, and together with the transactions contemplated thereby the Merger Transaction) with VLP. Valero created a new reportable segment, renewable diesel, because of the growing importance of renewable fuel in the market and the growth of our investments in renewable fuels production. Also, effective January 1, 2019, Valero no longer has a VLP segment, and it includes the operations of VLP in our refining segment. Research and Development (September 9, 2019) Valero-Darling Ingredients JV To Develop New Renewable Diesel Plant in Texas. This is also relating to the new segment.
Financial Summary Analysis As the Net income versus Revenue graph shows below. The company reported revenues of (US Dollars) US$117,033 million for the fiscal year ended December 2018 (FY2018), an increase of 24.5% over FY2017. In FY2018, the company’s operating margin was 3.9%, compared to an operating margin of 3.8% in FY2017. In FY2018, the company recorded a net margin of 2.7%, compared to a net margin of 4.3% in FY2017. Net Income was $3.1 billion for the year ended on Dec.31st 2018 and decreased $943 million compared with the year ended on Dec.31st 2017, which is $4.1 billion. Compared with Dec.31 2017 $4.1 billion Net Income, The Net Income decreased nearly $943 million in Dec.31 2018. The primary reason for that was tax reform, which partially offset by a $1.0 billion increase in net income before income tax expense. In the year 2017, Valero gained tax benefit and resulted in a 949 million increase in their net income, that is the parament reason.
Refining assets include petroleum refineries, crude oil pipelines, truck rack bays, refined petroleum product pipelines, tanks, marine docks, terminals, and others in the US, Canada, and the UK. It sells products in the wholesale rack and bulk markets. Key products include gasoline, distillates, asphalt, petrochemicals, lubricants, and other refined petroleum products. We estimate its revenue is highly affected by the oil price, and we assume it will constantly growth but will decrease when the oil price decrease.
Company Analysis

9 | P a g e
Ethanol Includes dry mill facilities processing corn feedstock to produce ethanol, distillers’ grains, and corn oil. It also serves gasoline blenders and refiners through term and spot contracts primarily operating in animal feed markets. Ethanol does operate truck or rail to transport corn oil, ethanol, and distillers’ grains, which several corn plants are in IOWA. As ghee graphing showing, we estimate a slightly decreasing trend in the revenue of Ethanol.
Distiller's Dried Grains with Soluble (DDGS) is a co-product of the distillery industries25. This is a new product line from the segment Renewable Diesel. As the graph showing above, VLO does gain reportable revenue for DDGS. Diamond Green Diesel is North America’s largest renewable diesel plant. From Valero, its own website announcement. An expansion underway will more than the double annual capacity to 675 million gallons, approximately 44,000 barrels per day26. Distribution
27 The above graph shows the people line capacity increased in the U.S. Gulf Coast. Valero headquarter locates in Texas, which is
surrounded by several important pipelines. Within pipeline to Canada and gulf, this allows VLO to have high export and a rise in their revenues. Valero energy occupies the area around the U.S. Gulf Coast area.
Properties Valero owns 15 refineries, 14 ethanol plants, and another products pipeline in the U.S.22. With, Property, Plant, and Equipment is a huge part of Valero’s assets. Meanwhile, its PPE also continued to increase in the last three years from $26,472 million in 2016 to $28,824 million in 2018, around 57% of Valero’s titan assets. Therefore, Valero is a heavy asset-based company, and it satisfied what we expected for industry energy.
Government Regulation Environmental matter: The principle environmental risks for Valero are emissions into the air and the soil, surface water, or groundwater. Because of the climate change problem, the environmental laws and regulations are becoming more stringent, and new environmental laws and regulations are continuously being enacted or proposed, which probably results in changes to operating permits, material changes in operations, increased capital expenditures and operating costs, increased costs of the products, and decreased demand for their products. The Paris Agreement28: This agreement is setting greenhouse gas emission reduction goals, which affect Valero’s operation in foreign markets, such as Canada, the United Kingdom, Ireland, and Latino America. The International Maritime Organization (IMO)29: Implementing a new regulation for a global Sulphur cap for marine bunker fuels by the year 2020 (IMO 2020), which will create a continued need for new and updated process units necessary to produce the low Sulphur marine fuel, and could increase the costs of their products.
SWOT Analysis Valero is one of the largest refiners in North America. Business performance of the Refining segment, the robust sales network of refining operations, and production capabilities strengthened its operations. Growing demand for petroleum products, increasing global upstream investments, and growth initiatives could provide new growth opportunities to the company. Market competition, fluctuating oil prices, and variation in crude slate quality could affect its operations. Strengthen
• Strength - Sales Network: Refining Operations The company sells its refined petroleum products through both wholesale rack and bulk markets. Valero’s robust sales network strengthened its operations by providing access to the global market. • Strength - Production Capability
The company’s operations are strengthened by its robust network of production plants. As of December 2018, Valero owned 15 petroleum refineries in the US, Canada, and the UK with a combined throughput capacity of 3.14 million barrels per day (Mumbles) producing conventional and premium gasoline, diesel,

10 | P a g e
ultra-low-sulfur diesel, distillates, jet fuel, asphalt, lubricants, petrochemicals and others.
• Strength - Business Performance: Refining Refining is a major contributing segment to the company’s revenue. In FY2018, the segment accounted for 96.5% of Valero's revenue. The company reported a 25.3% increase in revenue, which grew to US$113,601 million as compared to US$90,651 million in FY2017. It has advanced “crack spread” which leads them to drain profit from refining. Weakness The company reported a decrease in its cash reserves, which shows that it is not able to pay off its current liabilities. It reported a 49% decrease in cash and cash equivalents, which declined to US$2,982 million in FY2018 from US$5,850 in FY2017. The decrease in the cash component was due to US$4, 371million cash generated from operating activity in FY2018, Opportunities
• Opportunity - Increasing Demand: Oil & Petroleum Products
The company could strengthen its business with the expected increase in demand for oil and petroleum products across the world. According to World Oil Outlook (WOO) 201830, the long-term demand for oil is expected to increase from 97.2 million barrels per day (Mumble/d) in 2017 to 111.7 Mumble/d by 2040.
• Opportunity - Growth Initiatives Valero focuses on strengthening its operations through several initiatives. In November 2018, the company announced its plan to expand its Diamond Green Diesel plant. The company intends to increase its capacity to 675 million gallons per year of renewable diesel production. Threats
• Threat - Intense Competition Valero operates in a highly competitive oil refining and marketing industry. Intense competition threatens the company's existing market position. The inability to compete successfully could hamper the market share of the company.
• Threat - Government Regulations Valero could be affected by the stringent emission standards adopted by various governments. Its operations are regulated by federal, state, and local laws regulating the discharge of substances into the environment. Permits and authorizations required under these laws involve revocation, modification and renewal of refineries, pipelines and other facilities.
• Threat - Variation in Crude Slate Quality The company’s refining operations could affect the variations in crude slate quality31. To sum up, Valero Energy will still to growth in the long-term. It first has very clear market strategy within remained very high growth rate and keeping research and development. Secondly, it is the leading company in refining market segment where Valero has its comparative pipeline advantage. Third, oil and petroleum this segment will continue to grow in the following years. Finally, it has relatively good performance and trend compared to previous years.
Overview Through our analyses of the macroeconomy, oil refining & marketing industry with Valero Energy Corporation, we have arrived a recommendation of a Sell rating. We built our valuation model basing on Discount Cash Flow (DCF), Economic Profit (EP), Dividends Discount (DDM), and relative P/E models, which includes our forecast for key company assumptions basing on company’s products lines and guidance from its executive advices, etc. Given those models, we derived our target price range from $84 to $95.
Cost of Capital We considered the ideal hurdle rate which concludes all sources of capital (debt, equity, pfd., etc.), and applied the Weighted Average Cost of Capital formula calculated Valero’s WACC to be 6.66%. Risk Free Rate Risk-free asset refers to excited return, which has no default risk. In the context of the United States, the risk-free rate implies US treasury yield. We assume the U.S government not to default its own debt. Due to the inverted yield curve, we discussed in the early macroeconomic session, and we projected the current 10-Year Treasury Yield to be relatively low. The behind we are using 10-Yr T-B rate instead of 30-Yr T-B rate is that we do not forecast that long-run. At the end of the model settlement day Nov. 15th, 2019, the 10-Yr Treasury Yield is 1.834%23. In conclusion, we conclude our risk-free rate to be 1.83% Risk Premium Equity market risk premium refers to additional return demand by investors for shifting from a riskless asset to average risk investment. Our Krause fund uses a consensus rate of 4.69%, which calculated by the geometric return of the past 90 years market risk premium. We also quote the risk premium estimated by Professor Damodaran from New York University to be 5.22%32. Then we took an average between 5.22% and 4.69% and concluded our market risk premium to be 4.96%. Beta Beta relates to the risk factor that accounted for the firm to the market. We did not use daily returns; this is because notice variables will drive the fitted line to have a low correlation. We used a bloom beer terminal to plot a 2-year weekly beta vs. S&P 500. The slope of the regression line will be our beta, which is the raw beta. And we ended up with beta equals 1.13Error! Bookmark not defined.. Cost of equity We used CAPM, in this case, to determine the cost of equity, since we do not have another better model to use. And we concluded our cost of equity to be 7.46%. Property, Plant, and Equipment, Net (Net PPE) We forecasted net PPE by forecasted depreciation expenses and gross PPE first. In our model, we depreciated Valero’s gross PPE by historical average depreciation rate that is 4.99%.
Valuation

11 | P a g e
As for capital expenditure, executives gave guidance, indicating that approximately $2,500 million for capital expenditures in both 2019 and 2020. According to reports in the fiscal year 2019, Valero has had invested $726 million, $740 million, $525 million in Quarter1, 2, 3, showing a decreasing trend of investment. Thus, we assumed the investment in Q4 would continually decrease by around $509 million. We thought a massive increase in capital expenditure in the following two years was because of Valero’s strategy on developing more environmentally friendly product lines – renewable diesel. After this period, we forecasted a slight decrease in capital expenditure until reaching its original level. Valero, as a refining company, a capital-intensive company, fixed assets, especially the PPE, are huge parts of its total assets. We hold a conservation outlook of Valero’s development, and we assumed the growth rate of capital expenditure will always higher than its depreciation rate, so Valero’s PPE could keep a steady growth over the years.
Valuation Models In our valuation models, we used DDM, DCF, EP and Relative P/E to forecast Valero’s stock value. In our conclusion, we believed the DCF/EP model would provide a more realistic and comprehensive outlook for Valero.
DDM The discount dividend model is driving by dividends payout to shareholders. Valero has haven paying continuedly increasing dividends over those years. Given that Valero has haven good performances on dividend payout, we think the DDM model could reflect its value. In this model, we use cost of equity to discount dividends and other cash flows, and the target price ended up with $84.36. DCF/EP The DCF/EP model could reflect Valero’s profitability, riskiness, growth, and it tends to forecast stock value in a long-term period, which is more sustainable. The core of the DCF model is that it reflects Valero’s stock value by the sum of future free cash flow and its continuing value. As a capital-intensive company, Valero’s operations strongly relate to cash. Meanwhile, the DCF forecast also based on free cash flows (FCF). However, we will have a lower risk-free rate compared to the previous two years. This would lead to less cost of equity and cost of debt, which further drives the firm’s WACC to be relatively lower. And our forecasting intrinsic value by the DCF/EP Model ended up with $95, which we consider is overvalued. Finally, we decided to use the DCF model as our upper bound target range. As a result, our target price range of Valero will be $84-$95.
Relative Valuation We first identified a list of comparable firms, including HollyFrontier, Marathon Petroleum, Chevron, Exxon Mobile and Phillips 66, and gathered their current financial information. Furtherly, we computed the average multiples across the comparable firms and found out the multiples are too high and unrealize which ended up with targeting price $121 in 2020 by P/E (EPS) model; and $114 by P/Tangible BV model. In our opinion, the energy companies could not reflect by its peer’s performance correctly. We concluded that this model does not reflect Valero’s fundamental value. And, we decided to use the DCF model to predict Valero’s intrinsic Value with range $84-$95.
Overview Revenue Decomposition is a significant part of building the model. Valero’s revenues are driven by its segment revenues. Due to merging the VLP segment with the Refining segment, VLO was no longer having the VLP segment. Instead, Valero announced a new segment as renewable diesel. Refining and Ethanol Segment The Refining segment has three sub-categories: gasolines and blendstocks, distillates, and other products. Our model used 5-year historical data to projected 6-year revenues, with the CV will be the year 2024.
22 (Valero annual report 2018, page 22) We first went to 10k and found the Refining Segment’s yield by thousand Barrel Per Day. Then I adjusted those numbers to millions of barrels per year. This was to use the initial number times 365 then divided by 1,000. Then I obtained the overall year average yield as millions of barrels for all three subcategories. From the annual report segment revenue information, we wrote down each subcategory’s revenue. The second step was to find the average return (per Millions of Barrels) for each subcategory. Where we divided each subcategories’ revenue by volume of its production. This will give us the average return for all three subcategories. Finally, we calculated the holding year return (percent change of the price for average return), and we could adjust factors to its production volume and price for the average return.
DCF/EP DDM P/E P/B P/Tangible BV
Target Price 95 84 121 88 114
Revenue Decomposition

12 | P a g e
As the changing in estimated crude oil price we explained before. We expected the price changing in the refining and ethanol section to change that amount as well. With more specifically, 2019 (-11%), 2020 (-6.4%), 2021 (-3.13%), 2022 (-0.89%), 2023 (0.27%), 2024 (0.51%). The reason for 2019 is -11% is because we just dropped from $64 per barrels into $57 per barrels. Other than the crude oil price as a driven factor, we also calculated all the average increase or decrease in the yield volume and returned on sales. And we also adjusted those factors in each year (where every year times the average change in the previous 5-year). DGD, as Valero’s new segment of renewable diesel, we already have its Q3 report.
Therefore, I estimated the year 2019 to have 915M revenue, which is just the sum of those three quarters plus a forecasted fourth-quarter revenue that is an average of historical data. As the graph showing above, VLO does gain reportable revenue for the Diamond Green Diesel, which is North America’s largest renewable diesel plant. From Valero, its website announcement, an expansion underway will more than the double annual capacity to 675 million gallons, approximately 44,000 barrels per day33. So, we expected the new segment to increase from 50% as its initial growth and gradually decreased to 10%. 2019E 2020E 2021E 2022E 2023E 2024E (CV) 50% 40% 35% 25% 15% 10%
Cost of goods sold (COGS) We projected our COGS as a percentage of revenue. We distributed COGS in three operating segments that are refining, ethanol, and renewable diesel. More subdivided, according to the average historical cost of goods sold on each segment, we projected refining COGS to be 88.03% of refining revenue, ethanol COGS to be 82.71% of its sales. As for renewable diesel, its COGS to be forecasted differently of its sales as below, and we predicted its continuing value of COGS be 87% of its revenue. We assumed these ratios to be constant over the following years. 2019E
2020E
2021E
2022E
2023E
2024E(CV)
88.87% 87.25% 85.62% 85.44% 85.22% 87% Operating Expenses We predicted our operating expenses as a percentage of revenue, which calculated by a historical average percentage operating expenses of revenue. In order to forecast it more realistically, we predicted it by business segments, being consistent with a forecast of COGS. General and Administrative Expenses We divided general and administrative expenses into two parts, fixed and variable costs. We assumed salaries as a fixed part of general and administrative expenses, having a consistent growth with inflation, around 1.7%. In addition, we predicted variable cost parts changes as the average historical percentage of revenue, about 0.45%.
Risk Free Rate, Beta We used risk-free rate and beta mainly in the WACC calculation. If the beta goes down, we will have a lower risk-free rate, and therefore will result in lower WACC. We calculated our intrinsic value by using the DCF/EP model. Where in the DCF/EP model we must discount at the rate reflecting the risk of the cash flow, which is the WACC. Therefore, with a lower beta and risk-free rate, we will drive for a higher intrinsic value. This is sensitive nowadays, the primary reason behind that is that we have a relatively low 10-yr treasury bond rate as our risk-free rate, so we will end up overvalued.
Sensitivity Analysis

13 | P a g e
Equity Risk Premium, Pre-tax Cost of Debt. The way we calculated the pre-tax cost of debt is the risk-free rate plus the default equity risk premium. Therefore, lower equity risk premium we end up with the lower pre-tax cost of debt, after adjusting tax, it will end up in a lower cost of debt. Which the lower Weighted Average Cost of Capital will be derived from that, and our valuation model DCF/EP approach will end up with higher value. Since we must discount by the rate of WACC, lower WACC means we are dividing less and having higher intrinsic values.
Current Dividend Yield, CV ROIC The dividend yield is calculated by dividend/price. A lower dividend yield means fewer dividends are paid out, which means more retained earnings and cash we will receive. Those free cash flows could simulate reinvestment. Therefore, Valero’s assets will increase. ROIC is calculated by NOPLAT/ICt-1, where a higher asset will drive NOPLAT to be higher and ROIC to be higher. As few dividends are paid out, the more value the firm it keeps, where the more intrinsic value it has. Therefore, it is critical to consider dividend payout.
WACC, CV NOPLAT growth With no doubt, the WACC and CV NOPLAT growth play a significant role when predicting DCF model. As the DCF model in the denominator must adjust (WACC – g), and g is defined by the CV NOPLAT growth. Therefore, if WACC and CV NOPLAT growth differ too much, we expect the intrinsic value to shift a lot. Therefore, when forecasting, the sensitivity between those two factors and intrinsic factors are critical. It is crucial to assume growth rate in constant years, and especially in the last years, since it has the CV NOPLAT Growth rate to shift the intrinsic value.
14 | P a g e
This report was created by students enrolled in the Security Analysis (6F:112) class at the University of Iowa. The report was originally created to offer an internal investment recommendation for the University of Iowa Krause Fund and its advisory board. The report also provides potential employers and other interested parties an example of the students’ skills, knowledge and abilities. Members of the Krause Fund are not registered investment advisors, brokers or officially licensed financial professionals. The investment advice contained in this report does not represent an offer or solicitation to buy or sell any of the securities mentioned. Unless otherwise noted, facts and figures included in this report are from publicly available sources. This report is not a complete compilation of data, and its accuracy is not guaranteed. From time to time, the University of Iowa, its faculty, staff, students, or the Krause Fund may hold a financial interest in the companies mentioned in this report.
Important Disclaimer

15 | P a g e
References
1 OPEC Our Mission. (2019). Retrieved from https://www.opec.org/opec_web/en/about_us/23.htm. 2 Meredith, S. (2016, December 1). OPEC reaches agreement to cut oil production to 32.5 million barrels a day: Oil ministers. Retrieved from https://www.cnbc.com/2016/11/30/opec-reportedly-reaches-agreement-to-cut-oil-production.html. 3 Lynch, M. (2019, January 2). What Happened To Oil Prices In 2018? Retrieved from https://www.forbes.com/sites/michaellynch/2019/01/02/what-happened-to-oil-prices-in-2018/#732c818d6d83. 4 Lynch, M. (2019, January 2). What Happened To Oil Prices In 2018? Retrieved from https://www.forbes.com/sites/michaellynch/2019/01/02/what-happened-to-oil-prices-in-2018/#732c818d6d83. 5 McKenna, B. (2019, August 23). The "Inverted Yield Curve" Is Signaling a Recession; These Stocks Could Weather the Storm. Retrieved from https://www.fool.com/investing/2019/08/23/the-inverted-yield-curve-is-signaling-a-recession.aspx. 6 Marte, J. (2019, August 15). Recession watch: What is an 'inverted yield curve' and why does it matter? Retrieved from https://www.washingtonpost.com/business/2019/08/14/recession-watch-what-is-an-inverted-yield-curve-why-does-it-matter/. 7 Royal, J. (2019, November 6). Winners And Losers From The Fed's Rate Cut. Retrieved from https://www.bankrate.com/banking/federal-reserve/interest-rate-decrease-winners-losers/. 8 Federal Fund Cut Consensus Dot Plot (2019). Retrieved from https://www.bloomberg.com/graphics/fomc-dot-plot/. 9 U.S. Department of the Treasury. (2019, November 18). Retrieved from https://www.treasury.gov/resource-center/data-chart-center/interest-rates/pages/TextView.aspx?data=yieldYear&year=2019. 10 U.S. Energy Information Administration - EIA - Independent Statistics and Analysis. (n.d.). Retrieved from https://www.eia.gov/finance/markets/crudeoil/demand-nonoecd.php. 11 Bob, I. (2019, June 4). How Much Does Oil and Gas Drive U.S. GDP? Retrieved from http://openmarkets.cmegroup.com/15157/how-much-does-oil-and-gas-drive-u-s-gdp.
12 Gross Domestic Product. (2019). Retrieved from https://www.bea.gov/data/gdp/gross-domestic-product. 13 U.S. Unemployment Rate Falls to 50-Year Low. (2019, October 4). Retrieved from https://www.whitehouse.gov/articles/u-s-unemployment-rate-falls-50-year-low/. 14 Bureau of Labor Statistics Data. (n.d.). Retrieved from https://data.bls.gov/timeseries/LNS14000000. 15 Vehicle Miles Traveled. (2019, October 25). Retrieved from https://fred.stlouisfed.org/series/TRFVOLUSM227NFWA. 16 By. (2019, September 30). Global Oil Refining Market -Industry Size, Market Growth , Leading Players and Forecast, to 2022. Retrieved from https://www.marketwatch.com/press-release/global-oil-refining-market--industry-size-market-growth-leading-players-and-forecast-to-2022-2019-09-30. 17 Chen, J. (2019, November 18). What Are Midstream Oil Operations? Retrieved from https://www.investopedia.com/terms/m/midstream.asp. 18 Refining Segment. (n.d.). Retrieved from https://www.valero.com/en-us/AboutValero/refining-segment. 19 Introduction to Crack Spreads – CME Group. (n.d.). Retrieved from https://www.cmegroup.com/education/articles-and-reports/introduction-to-crack-spreads.html. 20 U.S. Energy Information Administration - EIA - Independent Statistics and Analysis. (n.d.). Retrieved from https://www.eia.gov/tools/faqs/faq.php?id=29&t=6. 21 Refiners' Total Operable Atmospheric Crude Oil Distillation Capacity as of January 1, 2019. Retrieved from https://www.eia.gov/petroleum/refinerycapacity/table5.pdf 22 Annual Report 10k for each companies ending in 2018. Retrieved from Tomsonone. 23 FactSet. 24 Tomsonone Investment Banking. 25 Bjrae. (2015, July 1). Overview of DDGS. Retrieved from https://www.biofuelscoproducts.umn.edu/general-information/overview.
16 | P a g e
26 (2019.). Retrieved from https://www.valero.com/en-us/AboutValero/renewable-diesel-segment. 27 (2018.). Retrieved from https://www.sec.gov/Archives/edgar/data/1035002/000119312518155966/d580924dex9901.htm. 28 The Paris Agreement. (2019.). Retrieved from https://unfccc.int/process-and-meetings/the-paris-agreement/the-paris-agreement. 29 Default About IMO // . (2019.). Retrieved from http://www.imo.org/en/About/Pages/Default.aspx. 30 Meredith, S. (2019, November 5). OPEC lowers forecast for oil demand growth, says its own market share is dwindling. Retrieved from
https://www.cnbc.com/2019/11/05/opec-report-global-oil-demand-growth-forecast-cut-over-the-medium-and-long-term.html. 31 GlobalData, GDGE1339FSA, September 2019. Retroved from, GlonalData 32 Damdodaran. Retrieved from http://people.stern.nyu.edu/adamodar/New_Home_Page/home.htm 33 (2019.). Retrieved from https://www.valero.com/en-us/AboutValero/renewable-diesel-segment.

Valero Energy Coporation Column3 Column4 Column5
Revenue Decomposition
In Millions $
Fiscal Years Ending Dec. 31 2016 2017 2018 2019E 2020E 2021E 2022E 2023E 2024E (CV)
Yields (thousand barrels per day)
Gasolines and blendstocks 1,404 1,423 1,443 1473 1504 1535 1567 1600 1633
%Change 2.93% 1.35% 1.41% 2.08% 2.08% 2.08% 2.08% 2.08% 2.08%
Distillates 1,066 1,127 1,113 1131 1148 1166 1185 1203 1222
%Change 0.00% 5.72% ‐1.24% 1.57% 1.57% 1.57% 1.57% 1.57% 1.57%
Other Products 408 428 449 456 463 470 478 485 493
%Change ‐3.09% 4.90% 4.91% 1.56% 1.56% 1.56% 1.56% 1.56% 1.56%
Ethanol production 3,842 3,972 4,109 4305 4510 4725 4950 5186 5433
%Change 0.39% 3.38% 3.45% 4.77% 4.77% 4.77% 4.77% 4.77% 4.77%
Refining:
Gasolines and blendstocks
Volume of Production (Millions Barrels) 512 519 527 538 549 560 572 584 596
%Change 2.93% 1.35% 1.41% 2.08% 2.08% 2.08% 2.08% 2.08% 2.08%
Average return (per Millions Barrels) $ 65.27 $ 77.72 $ 88.49 $ 78.75 $ 73.71 $ 71.41 $ 70.77 $ 70.96 $ 71.32
%Change ‐16.64% 19.06% 13.86% ‐11.00% ‐6.40% ‐3.13% ‐0.89% 0.27% 0.51%
Gasolined and blendstocks revenues $ 33,450 $ 40,366 $ 46,606 $ 42,343 $ 40,458 $ 40,007 $ 40,476 $ 41,430 $ 42,508
%Change ‐14.19% 20.68% 15.46% ‐9.15% ‐4.45% ‐1.11% 1.17% 2.36% 2.60%
Distillates
Volume of Production (Millions Barrels) 389 411 406 413 419 426 432 439 446
%Change 0.00% 5.72% ‐1.24% 1.57% 1.57% 1.57% 1.57% 1.57% 1.57%
Average return (per Millions Barrels) $ 83.72 $ 102.28 $ 136.73 $ 124 $ 118 $ 116 $ 117 $ 119 $ 121
%Change ‐14.48% 22.17% 33.68% ‐9.57% ‐4.90% ‐1.58% 0.70% 1.88% 2.12%
Distillates revenues $ 32,576 $ 42,074 $ 55,546 51,018$ 49,282$ 49,267$ 50,391$ 52,145$ 54,088$
%Change ‐14% 29% 32% ‐8% ‐3% 0% 2% 3% 4%
Other product
Volume of Production (Millions Barrels) 149 156 164 166 169 172 174 177 180
%Change ‐3.09% 4.90% 4.91% 1.56% 1.56% 1.56% 1.56% 1.56% 1.56%
Average return (per Millions Barrels) $ 39.90 $ 52.60 $ 69.95 64.03$ 61.65$ 61.43$ 62.62$ 64.59$ 66.77$
%Change ‐17.65% 31.82% 32.98% ‐8.45% ‐3.72% ‐0.36% 1.94% 3.14% 3.38%
Other product revenues $ 5,942 $ 8,217 $ 11,463 10,658$ 10,421$ 10,546$ 10,919$ 11,437$ 12,009$
%Change ‐20.19% 38.29% 39.50% ‐7.02% ‐2.22% 1.20% 3.54% 4.75% 5.00%
Total refining revenues 71,968$ 90,657$ 113,615$ 104,019$ 100,160$ 99,820$ 101,786$ 105,012$ 108,605$
%Change ‐14.85% 25.97% 25.32% ‐8.45% ‐3.71% ‐0.34% 1.97% 3.17% 3.42%
Ethanol:
Ethanol
Ethanol Production Volumes (Millions Gallon 1402 1450 1500 1571 1646 1725 1807 1893 1983
%Change 0.39% 3.38% 3.45% 4.77% 4.77% 4.77% 4.77% 4.77% 4.77%
Average return (per Millions Barrels) 2.36$ 2.03$ 1.94$ 1.57$ 1.34$ 1.18$ 1.06$ 0.97$ 0.89$
%Change 25.65% ‐14.21% ‐4.25% ‐19.03% ‐14.84% ‐11.87% ‐9.83% ‐8.78% ‐8.56%
Ethanol Revenue 3,315$ 2,940$ 2,912$ 2,470$ 2,204$ 2,035$ 1,922$ 1,837$ 1,760$
%Change 26.14% ‐11.31% ‐0.95% ‐15.17% ‐10.79% ‐7.67% ‐5.54% ‐4.43% ‐4.20%
Distillers grains
Distillers grains 568$ 560$ 726$ 672$ 654$ 659$ 679$ 709$ 741$
%Change ‐13.28% ‐1.41% 29.64% ‐7.43% ‐2.65% 0.75% 3.08% 4.29% 4.54%
Total ethanol revenues 3,901$ 3,324$ 3,638$ 3,142$ 2,858$ 2,694$ 2,602$ 2,546$ 2,501$
%Change 18.82% ‐14.79% 9.45% ‐13.63% ‐9.05% ‐5.74% ‐3.43% ‐2.15% ‐1.77%
VLP (Terminating Segment):
Total VLP revenues 363$ 452$ 546$
%Change 24.52% 20.80%
Renewable Diesel (New Segment):
DGD 2019 Q1 2019 Q2 2019 Q3
DGD Revenues 252 222 212 915 1372 1921 2593 3241 3728
%Change ‐11.90% ‐4.50% 331.45% 50.00% 40.00% 35.00% 25.00% 15.00%
Total Renewable Diesel revenues 252$ 222$ 212$ 915$ 1,372$ 1,921$ 2,593$ 3,241$ 3,728$
%Change 50.00% 40.00% 35.00% 25.00% 15.00%
Elimination of intersegment revenues 573$ (629)$ (766)$ (274.00)$ (556.33)$ (532.11)$ (454.15)$ (514.20)$ (500.15)$ Revenues 75,659$ 93,980$ 117,033$ 107,802$ 103,834$ 103,902$ 106,527$ 110,285$ 114,333$
%Change ‐13.83% 24.22% 24.53% ‐7.89% ‐3.68% 0.07% 2.53% 3.53% 3.67%

Valero Enery Coporation Column3 Column4 Column5
Income Statement
In Millions $
Fiscal Years Ending Dec. 31 2016 2017 2018 2019E 2020E 2021E 2022E 2023E 2024E (CV)
Revenues $ 75,659 $ 93,980 $ 117,033 $ 107,802 $ 103,834 $ 103,902 $ 106,527 $ 110,285 $ 114,333
Cost of sales:
Cost of Good Sold 65,962 83,037 104,732 94,705 91,176 91,212 93,516 96,796 101,019
Gross Margin 9,697 10,943 12,301 13,096 12,658 12,690 13,011 13,489 13,315
Expenses:
Operating expenses 4,251 4,504 4,690 5,004 4,836 4,844 4,971 5,156 5,345
Depreciation and amortization expense 1,894 1,986 2,069 2,091 2,121 2,149 2,148 2,154 2,167
Depreciation and depletion 1,324 1,336 1,399 1,440 1,460 1,479 1,478 1,482 1,491
Amortization of intangible assets 570 650 670 652 661 670 669 671 675
lower market inventory valuation adjustment (747) 0 0 0 0 0 0 0 0
Total cost of sales 71,360 89,527 111,491 101,801 98,133 98,205 100,635 104,105 108,531
Other operating expenses 0 61 45 0 0 0 0 0 0
General and administrative expenses 709 829 925 862 831 831 852 882 915
Asset impairment loss 56 0 0 0 0 0 0 0 0
Operating income 3,534 3,563 4,572 5,138 4,870 4,867 5,040 5,297 4,888
Other income, net 94 112 130 151 172 193 214 235 256
Int & debt expense &capitalized interest (446) (468) (470) (322) (488) (446) (455) (476) (504)
Income before income tax expense (benefit) 3,182 3,207 4,232 4,967 4,554 4,613 4,799 5,056 4,640
Income tax expense (benefit) 764 (952) 876 1,036 949 962 1,001 1,054 967
Loss from discountinued operations 0 0 0 0 0 0 0 0 1
Net income attributable to shareholders 2,418 4,159 3,356 3,931 3,604 3,651 3,798 4,002 3,673
Earning per common share $ 4.94 $ 9.17 $ 7.30 $9.88 $9.49 $10.07 $10.95 $12.04 $11.51
Total shares outstanding 461 442 426 415 397 380 364 349 336
Weighted‐average common shares outstanding 451 413 418 398 380 363 347 332 319
Dividends per share $2.40 $2.80 $ 3.20 $ 4.00 $ 4.40 $ 4.70 $ 5.40 $ 5.50 $ 6.20

Valero Energy Corporation Column3 Column4 Column5
Balance Sheet
In Millions $
Fiscal Years Ending Dec. 31 2016 2017 2018 2019E 2020E 2021E 2022E 2023E 2024E (CV)
Current assets:
Cash and cash equivalents $ 4,816 $ 5,850 $ 2,982 7,173 4,421 3,645 2,549 4,303 4,887
Receivables, net 5,901 6,922 7,345 6,468 6,334 6,546 7,508 7,169 7,203
Inventories 5,709 6,384 6,532 6,684 6,438 6,845 8,071 7,720 7,775
Prepaid expenses and other 374 156 816 367 353 353 362 375 389
Total current assets 16,800 19,312 17,675 20,692 17,546 17,389 18,491 19,567 20,253
Property, plant, and equipment, at cost 37,733 40,010 42,473 44,973 47,473 49,609 51,842 54,175 56,612
Accumulated depreciation (11,261) (12,530) (13,625) (15,716) (17,838) (19,986) (22,134) (24,288) (26,454)
Property, plant, and equipment, net 26,472 27,480 28,848 29,257 29,635 29,623 29,708 29,887 30,158
Deferred income taxes 671 536 544 605 661 717 776 838 895
Deferred charges and other assets, net 2,901 3,366 3,632 3,262 3,318 3,342 3,354 3,379 3,406
Deferred turnaround and catalyst costs, net 1,614 1,520 1,749 1,711 1,735 1,757 1,757 1,762 1,772
Long term Income tax receivables 447 673 343 110 130 119 120 125 132
Investments in joint ventures 201 530 542 366 386 405 424 446 463
Intangible assets, net 148 142 307 299 291 283 276 269 262
Goodwill 0 0 260 260 260 260 260 260 260
Other 491 501 431 517 517 517 517 517 517
Total assets $ 46,844 $ 50,694 $ 50,699 $ 53,815 $ 51,160 $ 51,072 $ 52,329 $ 53,670 $ 54,712
Liabilities & Shareholders' Equity:
Current portion of debt and capital lease obligations 115 122 238 920 77 69 85 262 262
Accounts payable 6,357 8,348 8,594 8196 7856 7916 8186 8333 8646
Accrued expenses 694 712 630 711 685 685 703 727 754
Taxes other than income taxes payable 1,084 1,321 1,213 1376 1445 1298 1286 1323 1373
Income taxes payable 78 568 49 58 53 54 56 59 54
Total current liabilities 8,328 11,071 10,724 11,260 10,116 10,022 10,315 10,704 11,090
Debt and capital lease obligations, less current portion 7,886 8,750 8,871 11158 8793 7892 7876 7699 7699
Deferred income tax 8,032 5,244 5,506 5974 6403 6838 7290 7766 8203
Other long‐term liabilities 1,744 2,729 2,867 2323 2328 2362 2479 2458 2481
Total liabilities 25,990 27,794 27,968 30,715 27,639 27,113 27,959 28,628 29,473
Common stock 7,095 7,046 7,055 7,095 7,125 7,155 7,185 7,215 7,245
Treasury stock, at cost; 255,905,051 and 239,603,534 (12,027) (13,315) (14,925) (16,925) (18,425) (19,925) (21,425) (22,925) (24,425)
Retained earnings 26,366 29,200 31,044 33,271 35,050 36,837 38,585 40,585 42,091
Accumulated other comprehensive loss (1,410) (940) (1,507) (1,507) (1,507) (1,507) (1,507) (1,507) (1,506)
Total Valero Energy Corporation stockholders’ equity 20,024 21,991 21,667 21,934 22,243 22,560 22,838 23,368 23,405
Noncontrolling interests 830 909 1,064 1,165 1,276 1,397 1,530 1,675 1,834
Total liabilities and equity $ 46,844 $ 50,694 $ 50,699 $ 53,814 $ 51,158 $ 51,070 $ 52,327 $ 53,671 $ 54,713

Valero Energy Corporation Column1 Column2 Column3 Column4 Column5
Cash Flow Statement
In Millions $Fiscal Years Ending Dec. 31 2014 2015 2016 2017 2018
Cash flows from operating activities:
Net income $ 3,711 $ 4,102 $ 2,418 $ 4,159 $ 3,356
Adjustments to reconcile net income to net cash
provided by operating activities:
Depreciation and amortization expense 1,690 1,842 1,894 1,986 2,069
lower market inventory valuation adjustment 0 790 (747) 0 0
Asset impairment loss 0 0 56 0 0
Asset retirement expense and other 63 0 0 0 0
Deferred income tax expense 445 165 230 (2,543) 203
Changes in current assets and current liabilities (1,810) (1,306) 976 1,289 (1,297)
Changes in deferred charges and credits and other
operating activities, net142 19 (6) 594 43
Net cash provided by operating activities $ 4,241 $ 5,612 $ 4,821 $ 5,485 $ 4,374
Cash flows from investing activities:
Capital expenditures (2,153) (1,618) (1,278) (1,379) (1,752)
Deferred turnaround and catalyst costs (649) (673) (718) (523) (915)
Investments in joint ventures (14) (141) (4) (406) (181)
Acquistion of undivided interests 0 0 0 (72) (212)
Peru Acquistion, net of cash acquired 0 0 0 0 (468)
Asset Acquisition 0 0 0 0 (408)
Other investing activities, net (28) (55) (6) (2) 8
Net cash used in investing activities $ (2,844) $ (2,487) $ (2,006) (2,382) $ (3,928)
Cash flows from financing activities:
Proceeds from debt issuances or borrowings 28 1,446 2,153 380 1,367
Repayments of debt and capital lease obligations (204) (513) (1,475) (21) (1,359)
Proceeds from the exercise of stock options 47 34 6 10 0
Purchase of common stock for treasury (1,296) (2,838) (1,336) (1,372) (1,708)
Common stock dividends (554) (848) (1,111) (1,242) (1,369)
Proceeds from issuance of Valero Energy Partners LP 0 189 10 36 0
Contributions from noncontrolling interests 12 5 0 30 32
Distributions to noncontrolling interests (public (12) (20) (30) 0 0
Distributions to other noncontrolling interests 0 (25) (35) (67) (116)
Other financing activities, net 49 25 (194) (26) (15)
Net cash used in financing activities (1,930) (2,545) (2,012) (2,272) (3,168)
Effect of foreign exchange rate changes on cash (70) (154) (100) 206 (143)
Net increase (decrease) in cash and temporary cash (603) 425 702 1,034 (2,868)
Cash and temporary cash investments at beginning of 4,292 3,689 4,114 4,816 5,850
Cash and temporary cash investments at end of year $ 3,689 $ 4,114 $ 4,816 $ 5,850 $ 2,982

Valero Energy Corporation
Cash flow
In Millions $
Fiscal Years Ending Dec. 31 2019E 2020E 2021E 2022E 2023E 2024E (CV)
Cash flow from operating activities:
Net Income 3,931 3,604 3,651 3,798 4,002 3,673
Ajustments for Non‐cash Operating expenses:
Depreciation and amortization expense 2,091 2,121 2,149 2,148 2,154 2,167
lower market inventory valuation adjustment 0 0 0 0 0 0
Asset impairment loss 0 0 0 0 0 0
Loss from discountinued operations 0 0 0 0 0 1
Change in deferred income taxes 407 373 378 (267) 414 380
Changes in working capital account:
Changes in current assets:
Receivables, net 877 134 (212) (962) 340 (34)
Inventories (152) 246 (408) (1,226) 351 (55)
Prepaid expenses and other 449 13 (0) (9) (13) (14)
Changes in current liabilities:
Accounts payable (398) (339) 60 270 147 314
Accrued expenses 81 (26) 0 17 25 27
Taxes other than income taxes payable 163 69 (147) (12) 38 50
Income taxes payable 9 (5) 1 2 3 (5)
Net changes in current assets and current liabilities 1,029 92 (706) (1,920) 891 282
Net Cash Flows from operating activities 7,459 6,191 5,472 3,759 7,461 6,503
Cash flows from investing actvities:
Capital Expenditure 4 (260) (652) (1,905) 660 (4)
Derferred turnaround and capital costs, net 38 (24) (22) 1 (5,496) (11)
Investments in joint ventures 176 (20) (20) (19) 0 (17)
R&D (2,541) (2,201) (2,723) 0 0 0
Net Cash Flows from investing activites (2,322) (2,505) (3,417) (1,924) (4,836) (31)
Cash flows from financing activities:
Income tax recicivables 233 (20) 11 (2) (5) (7)
Current potion of debt and capital lease obligations 682 (843) (8) 16 177 0
Debt and captial lease obligations, less current portion 2,287 (2,365) (901) (16) (177) 0
Other long term liabilities (544) 5 34 117 (21) 23
Purchase of common stock for treasury (2,000) (1,500) (1,500) (1,500) (1,500) (1,500)
Common stock dividends (1,704) (1,826) (1,864) (2,050) (2,002) (2,167)
Accumulated other comprehensive income 0 0 0 0 0 1
Noncontrolling interests 101 111 1,397 133 145 159
Net Cash Flows from financing activites (945) (6,438) (2,831) (3,302) (3,382) (3,490)
Cash and cash equivalents at beginning of year 2982 7,173 4,421 3,645 2,178 1,421
Cash and cash equivalents at end of year 7,173 4,421 3,645 2,178 1,421 4,403

Valero Enery Coporation Column3 Column4 Column5
Income Statement
In Millions $
Fiscal Years Ending Dec. 31 2016 2017 2018 2019E 2020E 2021E 2022E 2023E 2024E (CV)
Revenues 100.00% 100.00% 100.00% 100.00% 100.00% 100.00% 100.00% 100.00% 100.00%
Cost of sales:
Cost of Good Sold 87.18% 88.36% 89.49% 87.85% 87.81% 87.79% 87.79% 87.77% 88.35%
Operating expenses 5.62% 4.79% 4.01% 4.64% 4.66% 4.66% 4.67% 4.68% 4.68%
Depreciation and amortization expense 2.50% 2.11% 1.77% 1.94% 2.04% 2.07% 2.02% 1.95% 1.90%
Depreciation and depletion 1.75% 1.42% 1.20% 1.34% 1.41% 1.42% 1.39% 1.34% 1.30%
Amortization of intangible assets 0.75% 0.69% 0.57% 0.60% 0.64% 0.64% 0.63% 0.61% 0.59%
lower market inventory valuation adjustment ‐0.99% 0.00% 0.00% 0.00% 0.00% 0.00% 0.00% 0.00% 0.00%
Total cost of sales 94.32% 95.26% 95.26% 94.43% 94.51% 94.52% 94.47% 94.40% 94.92%
Other operating expenses 0.00% 0.06% 0.04% 0.00% 0.00% 0.00% 0.00% 0.00% 0.00%
General and administrative expenses 0.94% 0.88% 0.79% 0.80% 0.80% 0.80% 0.80% 0.80% 0.80%
Asset impairment loss 0.07% 0.00% 0.00% 0.00% 0.00% 0.00% 0.00% 0.00% 0.00%
Operating income 4.67% 3.79% 3.91% 4.77% 4.69% 4.68% 4.73% 4.80% 4.28%
Other income, net 0.12% 0.12% 0.11% 0.14% 0.17% 0.19% 0.20% 0.21% 0.22%
Int & debt expense &capitalized interest ‐0.59% ‐0.50% ‐0.40% ‐0.30% ‐0.47% ‐0.43% ‐0.43% ‐0.43% ‐0.44%
Income before income tax expense (benefit) 4.21% 3.41% 3.62% 4.61% 4.39% 4.44% 4.50% 4.58% 4.06%
Income tax expense (benefit) 1.01% ‐1.01% 0.75% 0.96% 0.91% 0.93% 0.94% 0.96% 0.85%
Loss from discountinued operations 0.00% 0.00% 0.00% 0.00% 0.00% 0.00% 0.00% 0.00% 0.00%
Net income 3.20% 4.43% 2.87% 3.65% 3.47% 3.51% 3.57% 3.63% 3.21%
Earning per common share 0.01% 0.01% 0.01% 0.01% 0.01% 0.01% 0.01% 0.01% 0.01%
Total shares outstanding 0.60% 0.44% 0.36% 0.37% 0.37% 0.35% 0.33% 0.30% 0.28%
Weighted‐average common shares outstanding 0.61% 0.47% 0.36% 0.38% 0.38% 0.37% 0.34% 0.32% 0.29%
Dividends per share 0.00% 0.00% 0.00% 0.00% 0.00% 0.00% 0.01% 0.00% 0.01%

Valero Energy Corporation Column3 Column4 Column5
Balance Sheet
In Millions $
Fiscal Years Ending Dec. 31 2016 2017 2018 2019E 2020E 2021E 2022E 2023E 2024E (CV)
Cash Flows from operating activities
Cash and cash equivalents 6.37% 6.22% 2.55% 6.65% 4.26% 3.51% 2.39% 3.90% 4.27%
Receivables, net 7.80% 7.37% 6.28% 6.00% 6.10% 6.30% 7.05% 6.50% 6.30%
Inventories 7.55% 6.79% 5.58% 6.20% 6.20% 6.59% 7.58% 7.00% 6.80%
Prepaid expenses and other 0.49% 0.17% 0.70% 0.34% 0.34% 0.34% 0.34% 0.34% 0.34%
Total current assets 22.20% 20.55% 15.10% 19.19% 16.90% 16.74% 17.36% 17.74% 17.71%
Property, plant, and equipment, at cost 49.87% 42.57% 36.29% 41.72% 45.72% 47.75% 48.67% 49.12% 49.52%
Accumulated depreciation ‐14.88% ‐13.33% ‐11.64% ‐14.58% ‐17.18% ‐19.24% ‐20.78% ‐22.02% ‐23.14%
Property, plant, and equipment, net 34.99% 29.24% 24.65% 27.14% 28.54% 28.51% 27.89% 27.10% 26.38%
Deferred income taxes 0.89% 0.57% 0.46% 0.56% 0.64% 0.69% 0.73% 0.76% 0.78%
Deferred charges and other assets, net 3.83% 3.58% 3.10% 3.03% 3.20% 3.22% 3.15% 3.06% 2.98%
Deferred turnaround and catalyst costs, net 2.13% 1.62% 1.49% 1.59% 1.67% 1.69% 1.65% 1.60% 1.55%
Income tax receivables 0.59% 0.72% 0.29% 0.10% 0.12% 0.11% 0.11% 0.11% 0.12%
Investments in joint ventures 0.27% 0.56% 0.46% 0.34% 0.37% 0.39% 0.40% 0.40% 0.40%
Intangible assets, net 0.20% 0.15% 0.26% 0.28% 0.28% 0.27% 0.26% 0.24% 0.23%
Goodwill 0.00% 0.00% 0.22% 0.24% 0.25% 0.25% 0.24% 0.24% 0.23%
Other 0.65% 0.53% 0.37% 0.48% 0.50% 0.50% 0.49% 0.47% 0.45%
Total assets 61.91% 53.94% 43.32% 49.92% 49.27% 49.15% 49.12% 48.67% 47.85%
Liabilities & Shareholders' Equity:
Current portion of debt and capital lease obligations 0.15% 0.13% 0.20% 0.85% 0.07% 0.07% 0.08% 0.24% 0.23%
Accounts payable 8.40% 8.88% 7.34% 7.60% 7.57% 7.62% 7.68% 7.56% 7.56%
Accrued expenses 0.92% 0.76% 0.54% 0.66% 0.66% 0.66% 0.66% 0.66% 0.66%
Taxes other than income taxes payable 1.43% 1.41% 1.04% 1.28% 1.39% 1.25% 1.21% 1.20% 1.20%
Income taxes payable 0.10% 0.60% 0.04% 0.05% 0.05% 0.05% 0.05% 0.05% 0.05%
Total current liabilities 11.01% 11.78% 9.16% 10.45% 9.74% 9.65% 9.68% 9.71% 9.70%
Debt and capital lease obligations, less current portion 10.42% 9.31% 7.58% 10.35% 8.47% 7.60% 7.39% 6.98% 6.73%
Deferred income tax 10.62% 5.58% 4.70% 5.54% 6.17% 6.58% 6.84% 7.04% 7.18%
Other long‐term liabilities 2.31% 2.90% 2.45% 2.15% 2.24% 2.27% 2.33% 2.23% 2.17%
Total liabilities 34.35% 29.57% 23.90% 28.49% 26.62% 26.09% 26.25% 25.96% 25.78%
Common stock 9.38% 7.50% 6.03% 6.58% 6.86% 6.89% 6.74% 6.54% 6.34% Treasury stock, at cost; 255,905,051 and 239,603,534 ‐15.90% ‐14.17% ‐12.75% ‐15.70% ‐17.74% ‐19.18% ‐20.11% ‐20.79% ‐21.36%
Retained earnings 34.85% 31.07% 26.53% 30.86% 33.76% 35.45% 36.22% 36.80% 36.81%
Accumulated other comprehensive loss ‐1.86% ‐1.00% ‐1.29% ‐1.40% ‐1.45% ‐1.45% ‐1.41% ‐1.37% ‐1.32%
Total Valero Energy Corporation stockholders’ equity 26.47% 23.40% 18.51% 20.35% 21.42% 21.71% 21.44% 21.19% 20.47%
Noncontrolling interests 1.10% 0.97% 0.91% 1.08% 1.23% 1.34% 1.44% 1.52% 1.60%
Total liabilities and equity 61.91% 53.94% 43.32% 49.92% 49.27% 49.15% 49.12% 48.67% 47.85%

Valero Energy Corporation Column3 Column4 Column5
Value Driver Estimation
In Millions $
Fiscal Years Ending Dec. 31 2016 2017 2018 2019E 2020E 2021E 2022E 2023E 2024E (CV)
NOPLAT Computation
EBITA:
Revenues $75,659 $93,980 $117,033 $107,802 $103,834 $103,902 $106,527 $110,285 $114,333
‐ Cost of Good Sold 65962 83037 104732 94705 91176 91212 93516 96796 101019
‐ Operating expenses 4251 4504 4690 5004 4836 4844 4971 5156 5345
‐ Depreciation and depletion 1324 1336 1399 1440 1460 1479 1478 1482 1491
‐ Amortization of intangible assets 570 650 670 652 661 670 669 671 675
‐ Other operating expenses 0 61 45 0 0 0 0 0 0
‐ General and administrative expenses 709 829 925 862 831 831 852 882 915
+ interest on operating lease 36 41 31 38 38 38 38 38 39
EBITA $2,879.2 $3,603.7 $4,603.3 $5,175.6 $4,908.3 $4,904.7 $5,078.3 $5,335.5 $4,926.7
Less: Adjusted Taxes
Income tax expense (benefit) 764 (952) 876 1,036 949 962 1,001 1,054 817
+ Tax shield on lower market inventory vauation adjustment (179) 0 0 0 0 0 0 0 0
+ Tax shield on asset impairment loss 13 0 0 0 0 0 0 0 0
‐ Tax on"Other income, net" 23 (33) 27 31 36 40 45 49 53
+ Tax on Int & debt expense &capitalized interest 107 (139) 97 67 102 93 95 (99) (105)
+ Tax shield on applied interest on operating lease 9 (12) 6 8 8 8 8 8 8
Adjusted Taxes 691.0 (1,070.3) 952.9 1,079.1 1,023.4 1,022.6 1,058.8 914.0 667.1
Plus: Changes in Deferred Taxes ‐6 594 43 407 373 378 (267) 414 380
NOPLAT: EBITA ‐ Adjusted Taxes + Changes in DT $2,182.2 $5,268.0 $3,693.4 $4,503.6 $4,258.2 $4,260.2 $3,752.3 $4,836.0 $4,640.0
Invested Capital Computation
Operating Current Assets:
Normal Cash (Assume 0.8% of cash reserve) 605 752 936 862 831 831 852 882 915
Receivables, net 5,901 6,922 7,345 6,468 6,334 6,546 7,508 7,169 7,203
Inventories 5,709 6,384 6,532 6,684 6,438 6,845 8,071 7,720 7,775
Prepaid expenses and other 374 156 816 367 353 353 362 375 389
Operating Current Assets $12,589 $14,214 $15,629 $14,381 $13,955 $14,576 $16,794 $16,146 $16,281
Operating Current Liabilities:
Accounts payable 6,357 8,348 8,594 8,196 7,856 7,916 8,186 8,333 8,646
Accrued expenses 694 712 630 711 685 685 703 727 754
Taxes other than income taxes payable 1,084 1,321 1,213 1,376 1,445 1,298 1,286 1,323 1,373
Income taxes payable 78 568 49 58 53 54 56 59 54
Operating Current Liabilities $8,213 $10,949 $10,486 $10,340 $10,039 $9,953 $10,230 $10,442 $10,828
Operating Working Capital: $4,376 $3,265 $5,143 $4,040 $3,916 $4,623 $6,564 $5,703 $5,453
Plus: Net PPE 26,472 27,480 28,848 29,257 29,635 29,623 29,708 29,887 30,158
Plus: Other Long‐term Assets
Net intangible assets (non‐goodwill) 148 142 307 299 291 283 276 269 262
PV of operating lease 1368.9 1041.4 1244.8 1399 1417 1416 1420 1429 1442
Other L‐T Operating Assets 1,517 1,183 1,552 1,698 1,708 1,700 1,696 1,698 1,703
Less: Other Long‐term Liabilities 1,744 2,729 2,867 2,323 2,328 2,362 2,479 2,458 2,481
Other L‐T Operating liabilities 1,744 2,729 2,867 2,323 2,328 2,362 2,479 2,458 2,481
Invested Capital $30,621 $29,199 $32,676 $32,672 $32,932 $33,584 $35,489 $34,829 $34,833
ROIC: NOPLAT/Begining IC
NOPLAT 2182 5268 3693 4504 4258 4260 3752 4836 4640
Beginning IC $31,087 $30,621 $29,199 $32,676 $32,672 $32,932 $33,584 $35,489 $34,829
Return on Invested Capital 7.02% 17.20% 12.65% 13.78% 13.03% 12.94% 11.17% 13.63% 13.32%
FCF: NOPLAT‐∆ Invested Capital
NOPLAT $2,182.2 $5,268.0 $3,693.4 $4,503.6 $4,258.2 $4,260.2 $3,752.3 $4,836.0 $4,640.0
∆ Invested Capital (CapEX) (466) (1,422) 3,477 (4) 260 652 1,905 (660) 4
Free Cash Flow $2,648.4 $6,689.9 $216.6 $4,507.9 $3,997.9 $3,608.4 $1,847.2 $5,495.7 $4,635.8
EP=Beginning IC*(ROIC‐WACC)
Beginning IC $31,087 $30,621 $29,199 $32,676 $32,672 $32,932 $33,584 $35,489 $34,829
ROIC 7.02% 17.20% 12.65% 13.78% 13.03% 12.94% 11.17% 13.63% 13.32%
WACC (CV)
Economic Profit $112 $3,229 $1,749 $2,328 $2,083 $2,067 $1,516 $2,473 $2,320

Valero Energy Coporation
Weighted Average Cost of Capital (WACC) Estimation
CV
Risk Free 1.83%
Risk Premium 4.96%
Beta 1.13
Cost of Equity 7.46%
Debt Rating BBB
Default Spread 1.57%
Pre‐Tax Cost of Debt 3.40%
Tax Rate 21%
After‐Tax Cost of Debt 2.69%
Cost of Preferred 3.3%
E 41586
D 8294
PFD 98
MV Weight of Equity 83%
MV Weight of Debt 17%
MV Weight of Pfd 0%
Forward WACC 6.66%

Valero Energy Coporation
Discounted Cash Flow (DCF) and Economic Profit (EP) Valuation Models
In Millions $
Key Inputs: Date: 11/15/2019
CV Growth ‐4.06%
CV ROIC 13.32%
WACC 6.66%
1+WACC 106.66%
Cost of Equity 7.56%
Annual dividend yield 3.69%
NOPLAT 3693.44 4503.62 4258.25 4260.22 3752.28 4835.99 4639.96
gNOPLAT 21.94% ‐5.45% 0.05% ‐11.92% 28.88% ‐4.06%
ROIC 13.78% 13.03% 12.94% 11.17% 13.63% 13.32%
CapEX 2500.00 2500.00 2150.00 2042.50 2205.90 2316.20
EP 2327.69 2082.60 2067.24 1515.89 2472.73 2319.95
Fiscal Years Ending Dec. 31 2018A 2019E 2020E 2021E 2022E 2023E 2024E (CV)
T=0 1 2 3 4 5 6
DCF Model
Free Cash Flow to Discount 2004 1758 2110 1710 2630
Continuing Value (t=5) 56481 Discount CV by 5 years
PV of FCF Disscounted by WACC 1879 1546 1739 1321 1905 40918
Values of Operating Assets 49307
+Excess Cash 0
+Marketable Securities 0
‐PV of Operating Leases (1,406)
‐Current portion of debt and capital lease obligations (238)
+Deferred turnaround and catalyst costs, net 1,749
+Income tax receivables 343
+Investments in joint ventures 542
‐Debt and capital lease obligations, less current portion (8,871)
‐Other Long‐term Liabilities (2,867)
Value of Equity 38560
shares outstanding 418
Intrinsic Value per Share (Price FY) 92.33$
Intrinsic Value per Share (Price Today) 95.45$
Fiscal Years Ending Dec. 31 2018A 2019E 2020E 2021E 2022E 2023E 2024E (CV)
T=0 1 2 3 4 5 6
EP Model
Economic Profit to Discount 2328 2083 2067 1516 2473
Continuing Value (t=5) 21641 Discount CV by 5 years
PV of FCF Disscounted by WACC 2483 2369 2508 1962 3413 7348
Sum of PV of EP&CV 20083
+Beginning Invested capital 29199
Value of Operating Assets 49307
+Excess Cash 0
+Marketable Securities 0
‐PV of Operating Leases (1,406)
‐Current portion of debt and capital lease obligations (238)
+Deferred turnaround and catalyst costs, net 1,749
+Income tax receivables 343
+Investments in joint ventures 542
‐Debt and capital lease obligations, less current portion (8,871)
‐Other Long‐term Liabilities (2,867)
Value of Equity 38559
shares outstanding 418
Intrinsic Value per Share (Price FY) 92.33$
Intrinsic Value per Share (Price Today) 95.45$
Model Date 11/15/2019
Next FYE 12/31/2019
Last FYE 12/31/2018
Days in FY 365
Days to FYE 319
Elapsed Fraction 0.87

Valero Energy Coporation
Dividend Discount Model (DDM) or Fundamental P/E Valuation Model
Fiscal Years Ending Dec. 31 2018 2019E 2020E 2021E 2022E 2023E 2024E (CV)
T=0 1 2 3 4 5 6
WACC 6.66%
Cost of Equity 7.56%
CV ROE 6.78%
CV Growth (2024+) ‐4.36%
EPS 7.30$ 9.88$ 9.49$ 10.07$ 10.95$ 12.04$ 11.51$
g(EPS)% 35.34% ‐3.90% 6.03% 8.73% 9.97% ‐4.36%
Dividend to Discount 4.00 4.40 4.70 5.40 5.50 6.20
Continuing Value (t=5) 85.47574
PV of Dividend and CV 3.75 3.87 3.87 4.17 3.98 61.92
Intrinsic Value 81.57$
Intrinsic Value per Share (Price Today) 84.33$
Annual Dividend Yield 3.69%
Model Date 11/15/2019
Next FYE 12/31/2019
Last FYE 12/31/2018
Days in FY 365
Days to FYE 319
Elapsed Fraction 0.87

Valero Energy Coporation
Relative Valuation Models
EPS EPS BV Tangible Tangible
Ticker Company Price 2019E 2020E P/E 19 P/E 20 Equity BV Equity P/B P/B
HFC Hollyfrontier Crop $52.30 $5.15 $5.35 10.16 9.78 29.67 17.08 1.76 3.06
MPC Marathon Petroleum $61.85 $5.28 $7.82 11.71 7.91 30.17 18.30 2.05 3.38
CVX Chevron $116.45 $6.43 $6.96 18.11 16.73 79.91 77.50 1.46 1.50
XOM Exxon Mobil $69.19 $2.72 $3.75 25.44 18.45 42.50 42.50 1.63 1.63
PSX Phillips 66 $117.42 $8.36 $10.57 14.05 11.11 46.06 37.88 2.55 3.10
Average 15.89 12.80 1.89 2.53
VLO Valero Energy Coporation $97.62 $9.88 $9.49 9.9 10.3 46.66 45.06 2.09 2.17
Implied Relative Value:
P/E (EPS19) $ 157.02
P/E (EPS20) 121.49$
P/B 88.16$
P/Tangible BV 114.19$

Valero Energy Coporation
Key Management Ratios
Fiscal Years Ending 2016 2017 2018 2019E 2020E 2021E 2022E 2023E 2024E (CV)
Liquidity Ratios
Current ratio 2.02 1.74 1.65 1.84 1.73 1.74 1.79 1.83 1.83
Quick ratio 1.29 1.15 0.96 1.21 1.06 1.02 0.98 1.07 1.09
Activity or Asset‐Management Ratios
Receivables turnover ratio 14.30 14.66 16.41 15.61 16.22 16.13 15.16 15.03 15.91
Average collection period 25.53 24.90 22.25 23.38 22.50 22.62 24.08 24.29 22.94
inventory collection ratio 11.37 13.73 16.22 14.33 13.90 13.73 12.54 12.26 13.04
Average day inventory held 32.11 26.58 22.51 25.47 26.26 26.58 29.11 29.77 27.99
Payables turnover ratio 12.99 8.95 9.88 12.49 11.82 11.53 11.38 11.47 11.36
Average days payables outstandin 28.11 40.80 36.94 29.22 30.88 31.66 32.07 31.82 32.13
Asset turnover ratio 1.66 1.93 2.31 2.06 1.98 2.03 2.06 2.08 2.11
Financial Leverage Ratios
Debt to Equity ratio 1.30 1.26 1.29 1.40 1.24 1.20 1.22 1.23 1.26
Debt to total assets ratio 0.55 0.55 0.55 0.57 0.54 0.53 0.53 0.53 0.54
Times interest earned ratio 8.13 7.85 10.00 16.42 10.32 11.33 11.54 11.63 10.21
Profitability Ratios
Profit margin on sales 3.20% 4.43% 2.87% 3.65% 3.47% 3.51% 3.57% 3.63% 3.21%
Return on assets 6.05% 9.77% 7.35% 8.01% 7.60% 7.83% 8.04% 8.26% 7.51%
Return on shareholders' equity 5.30% 8.53% 6.62% 7.52% 6.87% 7.14% 7.35% 7.55% 6.78%
Payout Policy Ratios
Dividends payout ratio 44.76% 27.81% 39.82% 40.49% 46.34% 46.68% 49.33% 45.69% 53.85%

Present Value of Operating Lease Obligations (2018) Present Value of Operating Lease Obligations (2017) Present Value of Operating Lease Obligations (2016) Present Value of Operating Lease Obligations (2015) Present Value of Operating Lease Obligations (2014)
Operating Operating Operating Operating Operating
Fiscal Year Ending Dec. 31 Leases Fiscal Years Ending Dec. 31 Leases Fiscal Years Ending Dec. 31 Leases Fiscal Years Ending Leases Fiscal Years Ending Leases
2019 359 2018 359 2017 479 2016 430 2015 314
2020 245 2019 236 2018 321 2017 283 2016 229
2021 178 2020 148 2019 221 2018 200 2017 159
2022 146 2021 104 2020 162 2019 143 2018 131
2023 123 2022 74 2021 106 2020 100 2019 75
Thereafter 514 Thereafter 366 Thereafter 362 Thereafter 311 Thereafter 275
Total Minimum Payments 1565.0 Total Minimum Payments 1287 Total Minimum Payments 1651 Total Minimum Payments 1467 Total Minimum Payments 1183
Less: Interest 159.3 Less: Interest 122 Less: Interest 138 Less: Interest 121 Less: Interest 103
PV of Minimum Payments 1405.7 PV of Minimum Payments 1165 PV of Minimum Payments 1513 PV of Minimum Payments 1346 PV of Minimum Payments 1080
Capitalization of Operating Leases Capitalization of Operating Leases Capitalization of Operating Leases Capitalization of Operating Leases Capitalization of Operating Leases
Pre‐Tax Cost of Debt 2.69% Pre‐Tax Cost of Debt 2.69% Pre‐Tax Cost of Debt 2.69% Pre‐Tax Cost of Debt 2.69% Pre‐Tax Cost of Debt 2.69%
Number Years Implied by Year 6 Payment 4.2 Number Years Implied by Year 6 Payment 4.9 Number Years Implied by Year 6 Payment 3.4 Number Years Implied by Year 6 Payment 3.1 Number Years Implied by Year 6 Payment 3.7
Lease PV Lease Lease PV Lease Lease PV Lease Lease PV Lease Lease PV Lease
Year Commitment Payment Year Commitment Payment Year Commitment Payment Year Commitment Payment Year Commitment Payment
1 359 349.6 1 359 349.6 1 479 466.5 1 430 418.7 1 314 305.8
2 245 232.3 2 236 223.8 2 321 304.4 2 283 268.4 2 229 217.2
3 178 164.4 3 148 136.7 3 221 204.1 3 200 184.7 3 159 146.8
4 146 131.3 4 104 93.5 4 162 145.7 4 143 128.6 4 131 117.8
5 123 107.7 5 74 64.8 5 106 92.8 5 100 87.6 5 75 65.7
6 & beyond 123 420.4 6 & beyond 74 296.4 6 & beyond 106 299.1 6 & beyond 100 258.0 6 & beyond 75 226.4
PV of Minimum Payments 1405.7 PV of Minimum Payments 1164.8 PV of Minimum Payments 1512.5 PV of Minimum Payments 1345.9 PV of Minimum Payments 1079.7
2014 2015 2016 2017 2018
PV of Minimum Payment 1079.7 1345.9 1512.5 1164.8 1405.7
interest on operating lease 29.0 36.2 40.7 31.3
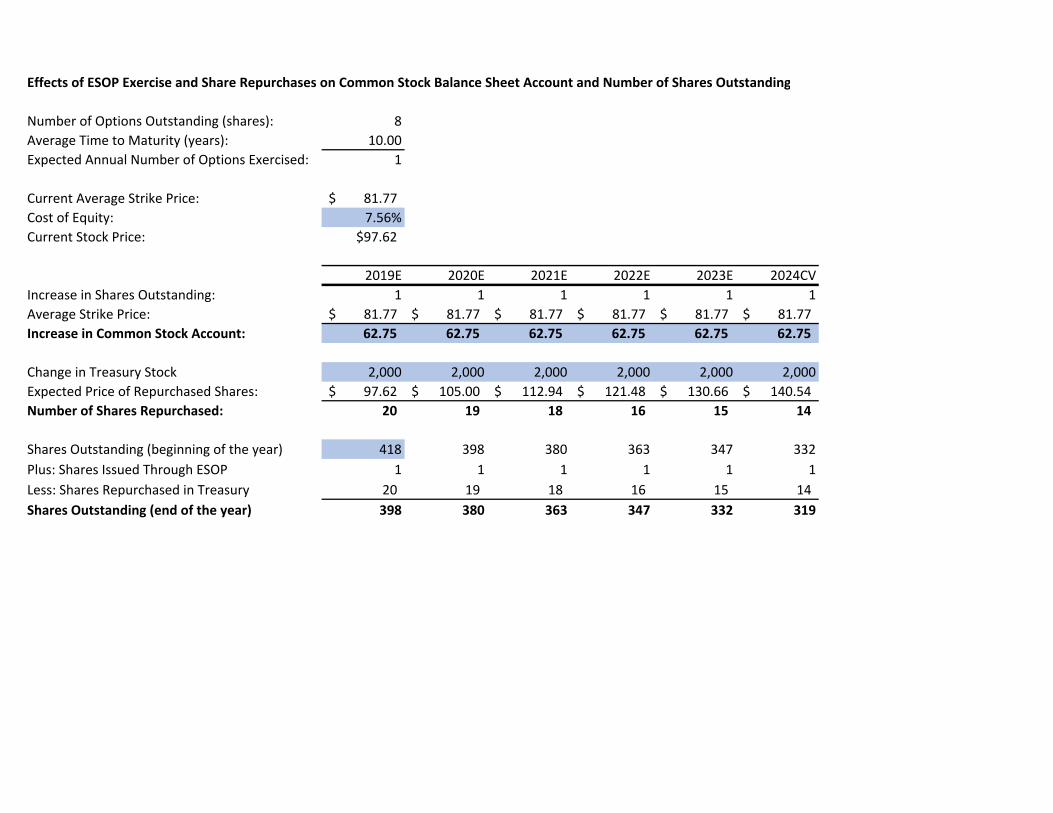
Effects of ESOP Exercise and Share Repurchases on Common Stock Balance Sheet Account and Number of Shares Outstanding
Number of Options Outstanding (shares): 8
Average Time to Maturity (years): 10.00
Expected Annual Number of Options Exercised: 1
Current Average Strike Price: 81.77$
Cost of Equity: 7.56%
Current Stock Price: $97.62
2019E 2020E 2021E 2022E 2023E 2024CV
Increase in Shares Outstanding: 1 1 1 1 1 1
Average Strike Price: 81.77$ 81.77$ 81.77$ 81.77$ 81.77$ 81.77$
Increase in Common Stock Account: 62.75 62.75 62.75 62.75 62.75 62.75
Change in Treasury Stock 2,000 2,000 2,000 2,000 2,000 2,000
Expected Price of Repurchased Shares: 97.62$ 105.00$ 112.94$ 121.48$ 130.66$ 140.54$
Number of Shares Repurchased: 20 19 18 16 15 14
Shares Outstanding (beginning of the year) 418 398 380 363 347 332
Plus: Shares Issued Through ESOP 1 1 1 1 1 1
Less: Shares Repurchased in Treasury 20 19 18 16 15 14
Shares Outstanding (end of the year) 398 380 363 347 332 319

VALUATION OF OPTIONS GRANTED IN ESOP
Ticker Symbol VLO
Current Stock Price $97.62
Risk Free Rate 1.83%
Current Dividend Yield 3.69%
Annualized St. Dev. of Stock Returns 29.86%
Average Average B‐S Value
Range of Number of Exercise Remaining Option of Options
Outstanding Options Shares(Millions) Price Life (yrs) Price Granted
Range 1 0.93996 87.23 10.00 22.96$ 22$
Range 2 3.65595 87.39 10.00 22.93$ 84$
Range 3 3.07736 73.43 10.00 26.67$ 82$
Total 7.67327 81.77$ 10.00 44.77$ 187.47$

Valero Energy Coporation Column1 Column2 Column3 Column4 Column5
COGS Forecast
Fiscal Years Ending Dec. 31 2014 2015 2016 2017 2018 2019E 2020E 2021E 2022E 2023E 2024CV
Refining:
Total refining revenues 126,004$ 84,521$ 71,968$ 90,657$ 113,615$ 104,019$ 100,160$ 99,820$ 101,786$ 105,012$ 108,605$
Refining COGS 71,512$ 63,405$ 80,865$ 102,489$ 91,568$ 88,171$ 87,871$ 89,603$ 92,442$ 96,148$
COGS as Percent of Sales 84.61% 88.10% 89.20% 90.21% 88.03% 88.03% 88.03% 88.03% 88.03% 88.03%
Operating Expenses 3,900$ 3,689$ 3,696$ 3,917$ 4,099$ 4,535.21$ 4,366.99$ 4,352.14$ 4,437.88$ 4,578.53$ 4,735.19$
Operating Expenses as Percent of Sales 4.36% 5.14% 4.32% 3.61% 4.36% 4.36% 4.36% 4.36% 4.36% 4.36%
Ethanol:
Total ethanol revenues 4,840$ 3,283$ 3,901$ 3,324$ 3,638$ 3,142$ 2,858$ 2,694$ 2,602$ 2,546$ 2,501$
Ethanol COGS 2,744$ 3,130$ 2,804$ 3,008$ 2,599$ 2,364$ 2,228$ 2,152$ 2,105$ 2,127$
COGS as Percent of Sales 83.58% 80.24% 84.36% 82.68% 82.71% 82.71% 82.71% 82.71% 82.71% 85.08%
Operating Expenses 487$ 448$ 415$ 443$ 470$ 396.87$ 360.96$ 340.24$ 328.58$ 321.51$ 315.82$
Operating Expenses as Percent of Sales 13.65% 10.64% 13.33% 12.92% 12.63% 12.63% 12.63% 12.63% 12.63% 12.63%
Renewable Dissel (New Segment):
2019 Q1 2019 Q2 2019 Q3
Total DGD revenues 252$ 222$ 212$ 915$ 1,372$ 1,921$ 2,593$ 3,241$ 3,728$
DGD COGS 224$ 189$ 164$ 813$ 1,197$ 1,645$ 2,216$ 2,762$ 3,243$
COGS as Percent of Sales 88.89% 85.14% 77.36% 88.87% 87.25% 85.62% 85.44% 85.22% 87.00%
Operating Expenses 19$ 17$ 18$ 72$ 108$ 152$ 205$ 256$ 294$
Operating Expenses as Percent of Sales 7.54% 7.66% 8.49% 7.90% 7.90% 7.90% 7.90% 7.90% 7.90%
Elimination of intersegment revenues 573$ (629)$ (766)$ (274)$ (556)$ (532)$ (454)$ (514)$ (500)$
Revenues 130,844$ 87,804$ 75,659$ 93,980$ 117,033$ 106,887$ 102,462$ 101,982$ 103,934$ 107,043$ 110,606$
Total Cost of Goods Sold 118,141$ 73,861$ 65,962$ 83,040$ 104,731$ 94,705$ 91,176$ 91,212$ 93,516$ 96,796$ 101,019$
Total operating expenses 4,387$ 4,137$ 4,111$ 4,360$ 4,569$ 5,004$ 4,836$ 4,844$ 4,971$ 5,156$ 5,345$

Valero Enery Coporation Column1 Column2 Column3 Column4 Column5
Depreciation Forecast
Fiscal Years Ending Dec. 31 2014 2015 2016 2017 2018 2019E 2020E 2021E 2022E 2023E 2024CV
Depreciation and amortization expense 1,690 1,842 1,894 1,986 2,069 2,091 2,121 2,149 2,148 2,154 2,167
Depreciation and depletion 1,200 1,302 1,324 1,336 1,399 1,440 1,460 1,479 1,478 1,482 1,491
Depreciation rate 4.87% 4.96% 5.05% 5.09% 4.99%
Amortization of intangible assets 490 540 570 650 670 652 661 670 669 671 675
Amortization Rate 2.02% 2.13% 2.46% 2.44% 2.26%
Property, plant, and equipment, net 26,735 26,703 26,472 27,480 28,848 29,257 29,635 29,623 29,708 29,887 30,158

Valero Energy Corporation Column1 Column2 Column3 Column4 Column5
Long‐term Debt Forecast
Fiscal Years Ending Dec. 31 2018 2019E 2020E 2021E 2022E 2023E 2024E
Public debt:
Valero Senior Notes Maturity Year
6.63% 2037 1500 1500 1500 1500 1500 1500 1500
3.40% 2026 1250 1250 1250 1250 1250 1250 1250
6.13% 2020 850 850 850
4.35% 2028 750 750 750 750 750 750 750
9.38% 2019 0 0 0 0 0 0 0
7.50% 2032 750 750 750 750 750 750 750
4.90% 2045 650 650 650 650 650 650 650
3.65% 2025 600 600 600 600 600 600 600
10.50% 2039 250 250 250 250 250 250 250
8.75% 2030 200 200 200 200 200 200 200
7.45% 2097 100 100 100 100 100 100 100
6.75% 2037 24 24 24 24 24 24 24
VLP Senior Notes
4.38% 2026 500 500 500 500 500 500 500
4.50% 2028 500 500 500 500 500 500 500
Gulf Opportunity Zone Revenue Bonds, Series 2010, 4.0% 2040 300 300 300 300 300 300 300
Debenture, 7.65% 2026 100 100 100 100 100 100 100
Other debt 50 50 50 50 50 50 50
Net unamortized debt issuance costs and other ‐80 ‐80 ‐80 ‐80 ‐80 ‐80 ‐80
New Debt Issued 3000
Total debt 8310 8294 11,294 8,294 7,444 7,444 7,444 7,444
Capital lease obligations 562 606 784 576 517 517 517 517
Total debt and capital lease obligations 8900 12078 8870 7961 7961 7961 7961
Less current portion 606 127 115 122 238 920 77 69 85 262 262
Debt and capital lease obligations, less current portion 8,662 11158 8793 7892 7876 7699 7699