kriegers flak offshore wind farm design basis foundations · 5 vattenfall vindkraft ab kriegers...
TRANSCRIPT

Kriegers Flak Offshore Wind Farm
Design Basis Foundations
Basic data for conceptual design of foundations
Status Concept Version B1
2008-01-29
Lars Bülow Jørgensen Ljjj and
Helge Gravesen, HlG, (VN-PT)
PYP
VATTENFALL VINDKRAFT AB

ii File: [Captia] KRF Design Basis Foundations 2007-01-29 (S) Design Basis Foundations Version: B1, 2008-01-29

i
Vattenfall Vindkraft AB Kriegers Flak Offshore Wind Farm
Company Org Document Doc no in Captia Version
Vattenfall Vindkraft AB PYP Report B1 Project Author Status
Kriegers Flak Offshore Wind Farm
Lars Bülow Jørgensen Ljjj and Helge Gravesen, HlG, (VN-PT)
Concept
Title Date Reviewed by
Design Basis Foundations 2008-01-29 Kim Ganshorn (VN-PT) Distribution Approved by
Göran Loman (VN-PY)
Revision log Version Date Ref Purpose Change since prev version
C1 2008-01-29 Ljjj, HlG
B1 2008-01-13 GRLO Rev figure 2.2

ii File: [Captia] KRF Design Basis Foundations 2007-01-29 (S) Design Basis Foundations Version: B1, 2008-01-29

iii Vattenfall Vindkraft AB Kriegers Flak Offshore Wind Farm
Contents
1 Revisions .............................................................................................................. 1
2 Introduction .......................................................................................................... 2
3 Design principles.................................................................................................. 5
4 Co-ordinate system............................................................................................... 6
5 Wind Turbine ....................................................................................................... 7
6 Foundation dimensions and tower interface......................................................... 8
7 Combined Loads ................................................................................................ 10
8 Other design criteria ........................................................................................... 16
9 Secondary constructions..................................................................................... 18
10 Geotechnical Design....................................................................................... 21
11 Monopile: Geotechnical Parameters............................................................... 28
12 GBS: Geotechnical Parameters ...................................................................... 31
13 References ...................................................................................................... 33

iv File: [Captia] KRF Design Basis Foundations 2007-01-29 (S) Design Basis Foundations Version: B1, 2008-01-29

1 Vattenfall Vindkraft AB Kriegers Flak Offshore Wind Farm
1 Revisions This document is the first version.

2 File: [Captia] KRF Design Basis Foundations 2007-01-29 (S) Design Basis Foundations Version: B1, 2008-01-29
2 Introduction This document is to be use by the Foundation Designer in connection with concep-tual design for wind turbine foundations for Kriegers Flak. This Design Basis cannot be used for the Tender design.
Geotechnical reports etc. are later included as annexes.
The Site Assessment has been made as a separate report.
The Foundation Designer may choose to comply fully or partly with the Design Basis.
To the extent that fully compliance with the Design Basis is deviated:
• Deviations shall be detailed stated
• Deviations shall be accepted by the Employer
The Design Basis applies for foundation concepts of:
• Concrete Gravity Base Structure (GBS),
• Steel monopile
• Jacket structure
• Concrete or steel tripod
Some of the specifications are only relevant for one of the foundation types this is indicated by the leading text of either GBS:, Monopile:, Jacket: or Tripod:. In certain cases common specifications for both jacket and tripod are given under the term Piled Structures:
The Design Basis includes a level of detail sufficient for the following:
• Conceptual design of foundation
• Conceptual design of appurtenances
• Specification of materials
• Specification of safety levels
The level of safety shall match the level presently achieved for land based wind farms. This shall be accomplished by using the codes specified in sub-clause 3.1. All demands, requirements and prerequisites shall be met when designing the founda-tions including any temporary structures and designs such as lifting points etc.

3 Vattenfall Vindkraft AB Kriegers Flak Offshore Wind Farm
Figure 2.1 Map of the western Baltic Sea south of Sweden and the site: Kriegers Flak II

4 File: [Captia] KRF Design Basis Foundations 2007-01-29 (S) Design Basis Foundations Version: B1, 2008-01-29
Figure 2.2 Location of the turbines.

5 Vattenfall Vindkraft AB Kriegers Flak Offshore Wind Farm
3 Design principles
3.1 Codes and standards The Design Basis is based on IEC 61400-3 and DNV-OS-J101 Design of Offshore Wind Turbine Structures/GL Guideline for certification of offshore wind turbines.
The overall hierarchy of the documents as given below and shall be governing for the design. Unless stated otherwise in the Design Basis all documents shall be used in the latest edition.
Regarding Steel structures
1. Design Basis for Foundations (this document).
2. IEC 61400-3: Design requirements for Offshore Wind Turbines.
3. DNV-OS-J101: “Design of Offshore Wind Turbine Structures”, 2007 or GL Guideline for certification of offshore wind turbines (latest version).
4. EuroCode no. 3: “Design of Steel structures”.
Regarding Concrete structures
1. Design Basis for Foundations (this document).
2. IEC 61400-3: Design requirements for Offshore Wind Turbines,
3. DNV-OS-J101: “Design of Offshore Wind Turbine Structures”, 2007 or GL Guideline for certification of offshore wind turbines (latest version).
4. DNV-OS-C502: “Offshore concrete Structures”, July 2004.
5. EuroCode no. 2: “Design of Concrete structures” 1992-1-1.
In case of conflict between the requirements, the above ranking shall be used.
3.2 General design conditions The design of the foundations shall ensure a lifetime of 25 in every aspect without planned replacement. The choice of structure, materials, operation and inspection programme shall be made accordingly.
Fatigue loads are to be based on repetition over 25 years.
Climate loads such as wind, waves etc. shall be determined based on a recurrence period of 50 years.
The safety of the foundation design will be implemented according to the partial safety factor method.

6 File: [Captia] KRF Design Basis Foundations 2007-01-29 (S) Design Basis Foundations Version: B1, 2008-01-29
4 Co-ordinate system All reference shall be according to the co-ordinate system presented in the figure below. Origin (0,0,0) is located in the centre of the turbine tower at level +0.0 rela-tive to Mean Sea Level (MSL). Minimum clearance from MSL Mean Sea Level to blade tip is 23 m. Interface between foundation and tower is found at level MSL +3.5 m.
Figure 4.1 Reference co-ordinate system.
MSL

7 Vattenfall Vindkraft AB Kriegers Flak Offshore Wind Farm
5 Wind Turbine
5.1 Wind Turbine layout For the concept design two turbine sizes shall be investigated: 3.6 MW and 5 MW.
In Table 5.1 are presented the main parameters for the reference wind turbines and towers. The wind turbine is pitch and frequency regulated. Clearance to the blade tip at MSL is 23 m. Foundation loads in the Design Basis is based on the reference turbines.
Table 5.1 Reference turbines.
Turbine size 3.6 MW 5 MW
Output power 3.6 MW 5 MW
Rotor diameter 106 m 126 m
Foundation – tower interface level acc. MSL 3.5 m 3.5 m
Hub height above foundation interface 72.5 m 82.5 m
Nacelle mass incl. Rotor 220 tons 410 tons
Tower top diameter/wall thickness 3.5 m/15 mm 4.5 m/20 mm
Tower bottom diameter/wall thickness 4.5 m/30 mm 6.0 m/35 mm
Tower mass 220 tons 300 tons

8 File: [Captia] KRF Design Basis Foundations 2007-01-29 (S) Design Basis Foundations Version: B1, 2008-01-29
6 Foundation dimensions and tower interface
6.1 GBS: Foundation – tower interface The tender design shall be made for a double sided tower flange with dimensions of embedded parts, according to Table 6.1. Final dimension will depend upon the wind turbine tower.
Anchor bolts are covered with tar, crimp-able plastic or alike in order to reduce fric-tion to the concrete, and improve the pre-stress conditions for the anchor bolts. Design of embedding and anchoring the bolts and anchor ring are the Foundation Designer responsibility. Both extreme, fatigue and pre-stressing loads shall be con-sidered.
Table 6.1 Foundation groups and numbers in each group for GBS.
Turbine Size 3.6 MW 5 MW
Number of anchor bolts M42 2 × 80 2 × 120
Tower bottom outer diameter 4 500 mm 6 000 mm
Length of anchor bolts 1 500 mm 1 500 mm
Pre-stressing of bolts 350 MPa 350 MPa
Figure 6.1 Sketch of double sided flange for GBS.

9 Vattenfall Vindkraft AB Kriegers Flak Offshore Wind Farm
6.2 Monopile and jacket: Foundation – tower interface The tender designed shall be made for a one sided flange with dimensions according to Table 6.2. Final dimension will depend upon the wind turbine.
Table 6.2 Foundation groups and numbers in each group for monopile and jacket.
Turbine size: 3.6 MW 5 MW
Number of bolts 100 160
Size of bolt holes DN 45 mm 45 mm
Tower bottom outer diameter 4 500 mm 6 000 mm

10 File: [Captia] KRF Design Basis Foundations 2007-01-29 (S) Design Basis Foundations Version: B1, 2008-01-29
7 Combined Loads Combined loads have been found according DNV-OS-J101 for load cases in four categories:
ULS Ultimate Limit State analyses
ALS Accidental Limit State analysis
SLS Serviceability Limit State Analyses including natural frequency analysis
FLS Fatigue Limit State Analysis including pile driveability
The above load cases have been investigated for the present structure. The result is summarized in two situations in the Design Basis:
• ULS loads
• FLS loads
GBS: Loads for calculation of crack width are found in sub-clause 8.7.
Load factors
Load factors according: IEC 61400-3 are used, as follows:
• Environmental ULS load: 1.35
• Environmental ULS load (abnormal wind load):1.10
• Environmental ALS load:1.10
• Environmental FLS load:1.00
• Gravity Load:1.00 (when conservative estimates are used)
The governing load for the foundation will be environmental load from wind, wave and currents.
The ULS load factor for waves may be reconsidered when the final foundation has been selected.
In the following design loads are specified – load factors are applied where applicable.
Foundation groups To ease calculation of the foundation loads for all foundations in the wind farm the foundations are grouped in three groups according the water depth ref. MSL at their position, according to Table 7.1. Foundation loads will be specified for each group. The loads can be inter- and extrapolated.

11 Vattenfall Vindkraft AB Kriegers Flak Offshore Wind Farm
Table 7.1 Foundation groups and numbers in each group.
Water depth at MSL
[m]
Numbers in the groups
Low 20 28
Medium 30 48
Deep 40 50
7.1 Turbine loads
Table 7.2 Turbine loads.
Turbine Design loads
Vertical load Extreme loads
Operational loads
Fatigue loads m=(4-5) N:1×10⁷
Tower bottom
Level [m]
[MN] F_ex [MN]
M_ex [MNm]
F_op [MN]
M_op [MNm]
F_eq [MN]
M_eq [MNm]
KRF 3.6 MW 15 4.4 1.42 89.9 0.85 54.0 0.35 19.2
KRF 5.0 MW 15 7.1 2.03 150.0 1.20 90.0 0.49 28.1
Table 7.3 Special design loads at 15m acc. MSL.
Special design cases
Torsion correlated with
M_ex
Torsion alone correlated to
0.7 M_ex
Crack and settling forces at tower
bottom
T_ex
[MNm] T_alone [MNm]
F_cr [MN]
M_cr [MNm]
KRF 3.6 MW 5.6 13 0.7 42
KRF 5.0 MW 7.9 18 1.0 70
The crack loads are found according the DNV-OS-J101 standard.

12 File: [Captia] KRF Design Basis Foundations 2007-01-29 (S) Design Basis Foundations Version: B1, 2008-01-29
7.2 GBS: Loads
GBS(Cone) 5 MW
-32,0-24,0-16,0-8,0
0,08,0
16,0
0 50 100 150 200 250 300 350
M (MNm)
elev
. rel
. MS
LMmax
ME
Mmax,wind
ME,wind
GBS(Cone) 5 MW
-32,0-24,0
-16,0-8,00,0
8,016,0
0 1 2 3 4 5 6 7 8 9 10 11 12
F (MN)
elev
. rel
. MS
L
Fmax
FE
Fmax,wind
FE,wind
Figure 7.1 GBS: Levels and schematic vertical load distribution.
Table 7.4 GBS: Loads.
GBS Design loads Extreme loads* Operational
loads Fatigue loads
m=(4-5) N:1×10⁷
Sea bed Depth [MN]
F_ex[MN]
M_ex [MNm]
F_op [MN]
M_op [MNm]
F_eq [MN]
M_eq [MNm]
KRF 3.6 MW −20 6.4 161 5.6 114 1.6 40
KRF 3.6 MW −32 10.4 214 7.2 136 2.7 53
KRF 5.0 MW −20 6.8 241 6.5 165 1.6 54
KRF 5.0 MW −32 10.8 293 10.3 204 2.7 67
*Add torsion as specified in Table 7.3

13 Vattenfall Vindkraft AB Kriegers Flak Offshore Wind Farm
7.3 Mono-pile: Loads The load graphs are extended so they include wind plus wave forces below sea bed, but not soil forces.
Monopile 5 MW
-48,0-40,0-32,0-24,0-16,0-8,00,08,0
16,0
0 50 100 150 200 250 300 350 400
M (MNm)
elev
. rel
. MS
L
Mmax
ME
Mmax,wind
ME,wind
Monopile 5 MW
-48,0-40,0-32,0-24,0-16,0-8,00,08,0
16,0
0 1 2 3 4 5 6 7 8 9 10
F (MN)
elev
. rel
. MS
L
Fmax
FE
Fmax,wind
FE,wind
Figure 7.2 Mono-pile: Levels and schematic vertical load distribution.
Table 7.5 Monopile: Loads.
Mono-pile Design loads
Extreme loads*
Operational loads
Fatigue loads m=(4-5) N:1×10⁷
Sea bed Depth
[m] F_ex[MN]
M_ex [MNm]
F_op [MN]
M_op [MNm]
F_eq [MN]
M_eq [MNm]
KRF 3.6 MW −20 4.0 153 2.7 104 1.2 41
KRF 3.6 MW −32 4.6 191 3.4 122 1.3 49
KRF 5.0 MW −20 4.4 236 3.5 154 1.2 53
KRF 5.0 MW −32 4.9 275 4.9 185 1.4 64
*Add torsion as specified in Table 7.3

14 File: [Captia] KRF Design Basis Foundations 2007-01-29 (S) Design Basis Foundations Version: B1, 2008-01-29
7.4 Jacket: Loads The load graphs are extended so they include wind plus wave forces below sea bed, but not soil forces.
Jacket(1.2/0.6) 5 MW
-48,0-40,0-32,0-24,0-16,0-8,00,08,0
16,0
0 50 100 150 200 250 300 350
M (MNm)
elev
. rel
. MS
L
Mmax
ME
Mmax,wind
ME,wind
Jacket(1.2/0.6) 5 MW
-48,0-40,0-32,0-24,0-16,0-8,00,08,0
16,0
0 1 2 3 4 5
F (MN)
elev
. rel
. MS
L
Fmax
FE
Fmax,wind
FE,wind
Figure 7.3: Jacket: Levels and schematic vertical load distribution.
Table 7.6 Jacket: Loads.
Jacket-pile Design loads Extreme loads* Operational loads
Fatigue loads m=(4-5) N:1×10⁷
Sea bed Depth
[m] F_ex [MN]
M_ex [MNm]
F_op [MN]
M_op [MNm]
F_eq [MN]
M_eq [MNm]
KRF 3.6 MW −20 2.7 146 1.9 93 0.5 35
KRF 3.6 MW −32 3.2 170 2.3 106 0.5 40
KRF 5.0 MW −20 3.1 231 2.5 142 0.6 53
KRF 5.0 MW −32 3.6 260 3.3 162 0.7 58
*Add torsion as specified in Table 7.3

15 Vattenfall Vindkraft AB Kriegers Flak Offshore Wind Farm
7.5 Ship impact loads The foundation and boat landing arrangement will be dimensioned for ship impact from service vessels and alike.
7.5.1 Ship impact ALS (Accidental Limit State) The foundations shall be able to withstand impact from vessels with a shock energy of 500 kJ and a static equivalent force of 4.9 MN at the boat landing area between level MSL and level MSL +5 m (acc. the design) corresponding to a vessel with a displacement of approximately 160 ton hitting a soft fender with a maximum defor-mation of 0.2 m with a velocity of 2.0 m/s hitting broadside or from bow/stern direc-tion. The load area is assumed to be: A = 0.2 m × 0.2 m.
7.5.2 Ship Impact ULS (Ultimate Limit State) The lower part of the boat landing shall be designed to withstand bow impact from vessels with a shock energy of 30 kJ and a static equivalent force of 300 kN between level MSL and level MSL +5 m (acc. the design) corresponding to a vessel with a displacement of approximately 160 ton hitting a soft fender with a maximum defor-mation of 0.2 m with a velocity of 0.5 m/s hitting broadside or from bow/stern direc-tion. The load area is assumed to be: A = 0.1 m × 0.1 m.

16 File: [Captia] KRF Design Basis Foundations 2007-01-29 (S) Design Basis Foundations Version: B1, 2008-01-29
8 Other design criteria
8.1 Natural frequency The stiffness of the foundation shall be sufficient to give a first natural frequency for the whole wind turbine structure and foundation including soil stiffness if the fol-lowing range:
Allowable frequency range:
For 3.6 MW: 0.31 Hz to 0.34 Hz
For 5.0 MW: 0.26 Hz to 0.29 Hz
The properties to be used for the turbine structure are found in sub-clause 5.1. Linear distribution of the tower diameter and material thickness shall be used.
8.2 Allowed settlement GBS: Maximum allowable settlement of the GBS foundation is 0.50°.
Monopile: Maximum allowable tilt of the mono-pile foundation is 0.25°.
8.3 Corrosion Corrosion allowance shall be included in the design.
8.4 Material coefficient According to EuroCode no. 2: “Design of concrete structures”, 1992-1-1 the safety factor materials are according to Table 8.1.
Table 8.1 Material safety factors for concrete structures.
ULS FLS and ALS SLS
Concrete 1.50 1.50 1.00
Reinforcement 1.15 1.15 1.00
8.5 Stiffness parameters The elasticity modulus is as the initial elasticity modulus according EuroCode 2.
The elasticity modulus is used without safety factor.
The foundation stiffness shall be calculated for the cracked structure.
8.6 Pre stressing of anchor bolts. Loads from pre-stressing of the anchor bolts acc. sub-clause 6.1 shall be taken into account.

17 Vattenfall Vindkraft AB Kriegers Flak Offshore Wind Farm
8.7 Crack width Crack width shall not exceed the figures in Table 8.2.
Crack width shall be calculated according to DNV-OS-J101 for operational loads as stated in sub-clause 7.1.
The Elasticity modulus of the concrete shall be found according to DNV-OS-J101.
The load for the first crack is found using the lower characteristic tensile strength (EuroCode 2 clause 3.1.2.3).
Table 8.2 Allowable crack width. Level acc. LAT [m] Crack width [mm]
Above 11 0.2
11 – (−4.0) 0.1
(-4.0 – (−15.0) 0.2
Below level (−15) 0.3
8.8 Fatigue The fatigue life shall be calculated according to Palmgren-Miner cumulative damage law. The allowable damage ratios are presented in Table 8.3.
Table 8.3 Allowable Palmgren-Miner damage sum. Level acc. LAT [m] PM sum
Above 11 1.0
11 – 0 0.5
Below 0 0.3
The use of Wöhler-curves shall be in accordance with the safety system for which they are valid. If Wöhler curves from DNV-OS-J101 / DNV-OS-C502 are used, the material parameter 1.15 shall be used.

18 File: [Captia] KRF Design Basis Foundations 2007-01-29 (S) Design Basis Foundations Version: B1, 2008-01-29
9 Secondary constructions
9.1 Loads – boat landing Loads from vessels should be according sub-clause 7.5.
9.2 Loads – wave loads to appurtenances Design should include appropriate account to slamming forces and include both extreme loads and fatigue loads.
9.2.1 Run-up The max run-up heights is estimated to Rmax = +13.7 m (rel MSL) (see Site Assess-ment).
9.2.2 Vertical velocity for vertical structures The vertical design velocity in a certain elevation h may be determined from:
U = (2 g (Rmax -h))0.5
where g = gravitational acceleration
9.2.3 Horizontal velocity for vertical structures The flow around a cylinder derived from potential flow theory is sketched on Figure 9.1. The maximum flow velocity around the cylinder is twice the free-stream veloc-ity. The real case is not exactly a potential flow and are governed by the particle ve-locity generated by the waves and the boat landing are not placed at the monopile surface, but never the less the maximum load on the boat landing elements are cal-culated based on a estimated velocity of two times the velocity found with no mono-pile structure involved (umax = U∞ = 6.0 m/s).
)sin(2)( θθ ⋅⋅= ∞UU
(P∞ = pressure without influence of structure)
Figure 9.1 Potential flow velocity around a cylinder/monopile.

19 Vattenfall Vindkraft AB Kriegers Flak Offshore Wind Farm
9.3 Extreme horizontal wave loads. Forces on the main structure are calculated on basis of Stream function calculations.
Stream function theory describes velocity field for U= Umax (< 6.0 m/s).
Account to distance from main cylinder on horizontal velocities is estimated as fol-lows relative to a distance x from the cylinder with diameter D:
U/Umax = (2x/D)2 -2(2x/D) +2 for x<D/2
U/Umax = 1 for x≥ D/2
The estimate above is valid for structures placed 90o relative to the incident wave di-rection, where the structure amplifies the wave velocity most (up to a 2 factor).
A conservative design could be to apply an extreme basis velocity (maximum wave + current) of 6 m/s from 0 m above MSL to +6.0 m above MSL and 4 m/s below MSL.
Forces on the Appurtenances are calculated (as drag forces) on basis following for-mulae (The form factor is equal to 1):
F = 0.5 ρ U2 A
If we consider a 0.4 m pipe section with a length of 1.5 m (A = 0.6 m2) exposed to a maximum velocity of 2 × 6 m/s = 12 m/s. The extreme load from the waves is esti-mated to
F = 0.5 ρ U2 A = 0.5 x 1010 x 122 x 0.6 = 44 kN.
9.4 Slamming force (vertical) The extreme vertical design forces (slamming force) from the waves are estimated as follows:
The vertical maximum velocity is calculated from:
1. Rmax = Maximum run-up (1/50 years) (above MSL).
2. A structure in elevation h (above MSL) is considered.
3. The maximum vertical velocity is estimated from:
• Uwave,vert. = (2 g (Rmax – h))0.5 , g = acceleration of gravity = 9.81 m/s2.
4. Slamming force Fsl= 0.5 ρ Cs A Uwave,vert.2 where ρ = water density, Cs = slam-
ming coefficient and A = area considered.
5. Slamming coefficients:
• Cylindrical structures: Cs = minimum 3.
• Triangular and rectangular structures: Cs =minimum 6.
• Horizontal platform: Cs = 10 for a load area of 0.5 m2 and Cs = 1.5 for the average load.

20 File: [Captia] KRF Design Basis Foundations 2007-01-29 (S) Design Basis Foundations Version: B1, 2008-01-29
• Cone platform: Cs = 6 for a load area of 0.5 m2 and Cs = 1.2 for the average load.
9.5 Fatigue loads Procedure for fatigue loads to appurtenances:
To be included later in conceptual design if appropriate.

21 Vattenfall Vindkraft AB Kriegers Flak Offshore Wind Farm
10 Geotechnical Design
10.1 General The geotechnical design shall be performed in accordance with DNV-OS-J101 ref. [1] or GL Guidelines ref. [10].
It is the task and the responsibility of the Contractor to analyse and interpret all available geotechnical information and reports from surveys, site investigations, laboratory testing etc. as included as annexes.
In order to ease the tender process, an interpretation has been carried out by the Employer and summarized in the Site Assessment and the following clauses.
10.2 ULS Analyses The partial coefficients for soil parameters and resistance parameters shall be:
ULS Plastic
• Angle of Internal Friction 1.2
• Undrained Shear Strength 1.3
• Pile Axial Bearing Capacity1.3
10.3 SLS Analysis, ALS Analysis and FLS Analysis Characteristic soil parameters shall be used in the ALS, SLS analysis, natural fre-quency analysis, fatigue analyses and the pile driveability study. The partial coeffi-cients shall be taken as unity.
10.4 Undrained Shear Strength Parameters from Cone Tip Resistance The in situ measured cone penetration tests shall be compared with the undrained tri-axial tests from the borings in order to determine the relationship between the cone resistance and the undrained shear strength, i.e. the Nk value. This relationship, ex-pressed by the Nk value, has then been used to determine undrained shear strengths from the CPT tests in clays.
The undrained shear strength, cu can be expressed by the following formula:
k
cu N
qc
σ−=
where qc is the net cone tip resistance σ is the total overburden pressure Nk is the cone factor
10.5 Friction Angle from the Cone Tip Resistance The interpretation of the angle of internal friction in sand can be carried out by the method described in ref. [7]. Here a relationship between the peak secant friction angle and the relative density for different grain-size characteristics is given. The friction angle shown in Figure 10.1 appears to an effective overburden stress of
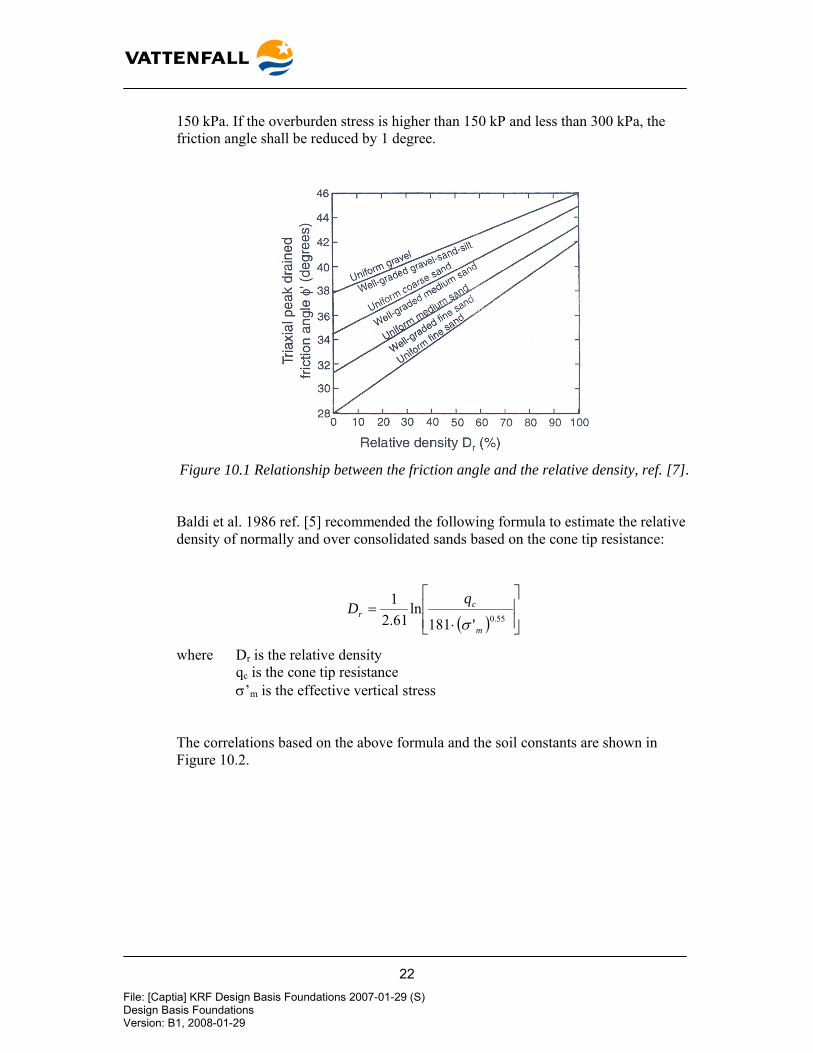
22 File: [Captia] KRF Design Basis Foundations 2007-01-29 (S) Design Basis Foundations Version: B1, 2008-01-29
150 kPa. If the overburden stress is higher than 150 kP and less than 300 kPa, the friction angle shall be reduced by 1 degree.
Figure 10.1 Relationship between the friction angle and the relative density, ref. [7].
Baldi et al. 1986 ref. [5] recommended the following formula to estimate the relative density of normally and over consolidated sands based on the cone tip resistance:
( ) ⎥⎥⎦
⎤
⎢⎢⎣
⎡
⋅=
55.0'181ln
61.21
m
cr
qD
σ
where Dr is the relative density qc is the cone tip resistance σ’m is the effective vertical stress
The correlations based on the above formula and the soil constants are shown in Figure 10.2.

23 Vattenfall Vindkraft AB Kriegers Flak Offshore Wind Farm
Figure 10.2 Relationship between cone tip resistance, vertical stresses and relative density, ref. [5].
These two relationships can be combined to a relationship between the angle of in-ternal friction and the cone tip resistance. The relation is depicted in Figure 10.3 for fine sand.

24 File: [Captia] KRF Design Basis Foundations 2007-01-29 (S) Design Basis Foundations Version: B1, 2008-01-29
Schmertmann, 1978 and Baldi et al. 1986
0
10
20
30
40
50
60
70
0 5 10 15 20 25 30 35 40Depth (m)
qc (M
Pa)
3536373839404142
Figure 10.3 Evaluation of Angle of Internal Friction in Fine Uniform Sand.
The correlation given in Figure 10.3 shall be used to interpret the angle of internal friction for the sand deposits. The friction angle will be limited to 42o.
This approach appears rational and conservative. The curves are implemented on all the CPT’s.
10.6 Preliminary proposal for geotechnical design profiles The soil investigations have not been finalized complete. Final interpretation of field test, coordination with geophysical investigation plus some of the more detailed laboratory tests has not been finalized.
On the basis of a relatively rough analysis the following preliminary estimate of simplified design soil profiles has been made in the Site Assessment (subject to revision when further data are available):
25 Vattenfall Vindkraft AB Kriegers Flak Offshore Wind Farm
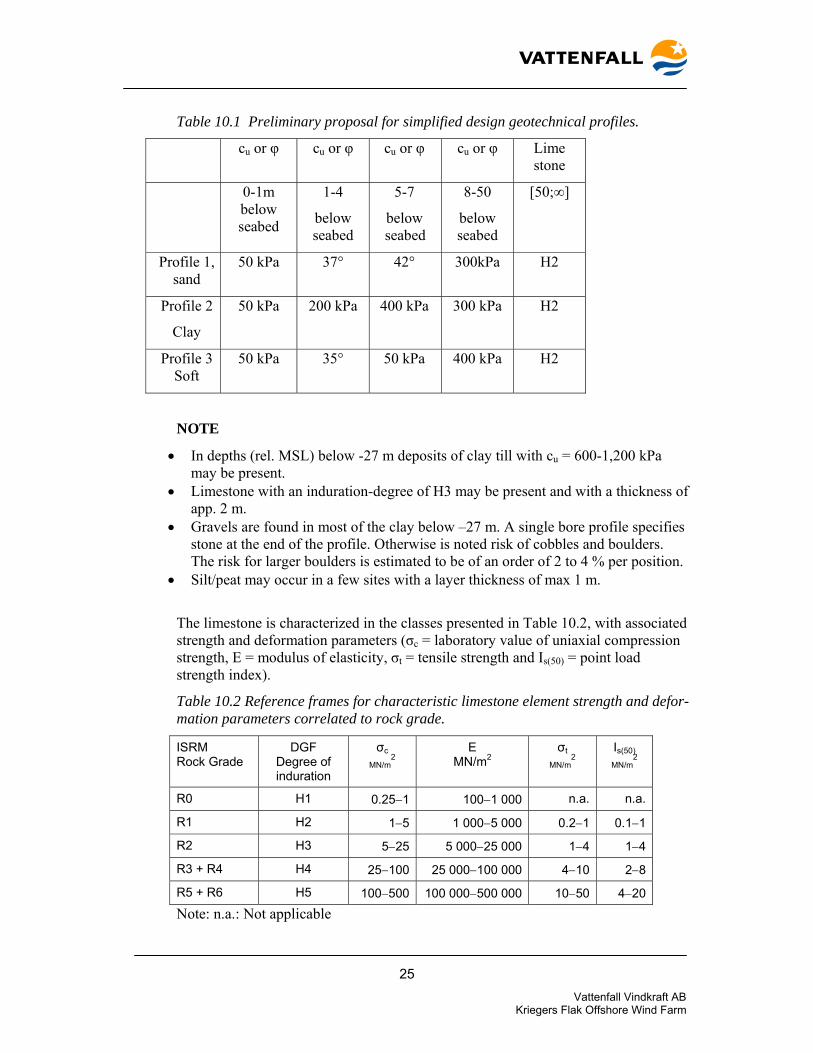
Table 10.1 Preliminary proposal for simplified design geotechnical profiles.
cu or φ cu or φ cu or φ cu or φ Lime stone
0-1m below seabed
1-4
below seabed
5-7
below seabed
8-50
below seabed
[50;∞]
Profile 1, sand
50 kPa 37° 42° 300kPa H2
Profile 2
Clay
50 kPa 200 kPa 400 kPa 300 kPa H2
Profile 3 Soft
50 kPa 35° 50 kPa 400 kPa H2
NOTE
• In depths (rel. MSL) below -27 m deposits of clay till with cu = 600-1,200 kPa may be present.
• Limestone with an induration-degree of H3 may be present and with a thickness of app. 2 m.
• Gravels are found in most of the clay below –27 m. A single bore profile specifies stone at the end of the profile. Otherwise is noted risk of cobbles and boulders. The risk for larger boulders is estimated to be of an order of 2 to 4 % per position.
• Silt/peat may occur in a few sites with a layer thickness of max 1 m.
The limestone is characterized in the classes presented in Table 10.2, with associated strength and deformation parameters (σc = laboratory value of uniaxial compression strength, E = modulus of elasticity, σt = tensile strength and Is(50) = point load strength index).
Table 10.2 Reference frames for characteristic limestone element strength and defor-mation parameters correlated to rock grade.
ISRM Rock Grade
DGF Degree of induration
σc
MN/m2
E MN/m2
σt
MN/m2
Is(50)
MN/m2
R0 H1 0.25−1 100−1 000 n.a. n.a.
R1 H2 1−5 1 000−5 000 0.2−1 0.1−1
R2 H3 5−25 5 000−25 000 1−4 1−4
R3 + R4 H4 25−100 25 000−100 000 4−10 2−8
R5 + R6 H5 100−500 100 000−500 000 10−50 4−20
Note: n.a.: Not applicable

26 File: [Captia] KRF Design Basis Foundations 2007-01-29 (S) Design Basis Foundations Version: B1, 2008-01-29
10.7 Dynamic Soil Spring Stiffness The initial, small strain modulus is denoted Go. In Figure 10.4 the G0/qc is depicted for uncemented quarts sand.
Figure 10.4 Gmax/qc, ref. [6].
The design value can be taken as:
75.0
'1200
−
⎥⎦
⎤⎢⎣
⎡⋅=
σc
c
o qqG
where Go is the small strain shear modulus qc is the cone tip resistance σ’ is the effective vertical stress
Valid for 310−≤ε %
For clay deposits the initial small strain modulus can be taken as:
% 10for 1000 3−<⋅= εuo cG

27 Vattenfall Vindkraft AB Kriegers Flak Offshore Wind Farm
where cu is the undrained shear strength.
10.8 Risk of Liquefaction due to Cyclic Loading The cyclic liquefaction resistance shall be evaluated for silty fine sand with low rela-tive density.
The possibility of wind and wave producing liquefaction in the foundation sands is similar in some respects to the problem of earthquake-induced liquefaction. Both cases involve cyclic shear stresses induced on horizontal planes. Further details: See Lee et al Ref. [6].
The NAVFAQ DM-7.3 approach can as an initial evaluation method be used.
For monopile foundation the loose silty sand will liquefy for lateral loading. In de-sign of monopile the soil deposits above the bottom of the loose silty sand shall be ignored. Bottom of the loose silty sand deposits at the actual turbine locations are in-dicated in the Site Assessment.

28 File: [Captia] KRF Design Basis Foundations 2007-01-29 (S) Design Basis Foundations Version: B1, 2008-01-29
11 Monopile: Geotechnical Parameters
11.1 Soil-Structure Interaction Generally, the following effects regarding soil and soil-structure interaction shall be taken into account in the entire analyses:
• Non-linear behaviour of the interaction between soil and monopile, laterally and axially.
• The length of the soil plug inside the monopile is taken as 0.9 times the length of the pile embedded in the soil due to compaction of the soil during pile driving.
11.2 Soil Curves
11.2.1 Axial Bearing Capacity, t-z and Q-W Curves The unit skin friction and the tip resistance shall be calculated in accordance with the DNV-approach using the characteristic soil parameters.
Cyclic t-z curves in accordance with DNV shall be used. Ref. [1] DNV:
The tip load-displacement curves, Q-W shall be taken as Ref. [4] API:
Table 11.1 Tip load displacement.
W/D Q/QP
0.002 0.25
0.013 0.50
0.042 0.75
0.073 0.90
0.1 1.00
Where W is axial tip deflection (mm) D is pile diameter (mm) Q is mobilized end bearing capacity (kN) Qp is total end bearing capacity (kN)
11.2.2 Lateral Bearing Capacity, ULS Elastic Analyses, p-y Curves The lateral bearing capacity shall be based on p-y data developed by the DNV-approach.
For clay the first point on multi-linearly curves shall be taken as y/yc = 0.1 and p/pu = 0.23 in order to get a better model for small strain behaviour. The approach is in line with the ISO approaches, ref. [3] as shown on Figure 11.1

29 Vattenfall Vindkraft AB Kriegers Flak Offshore Wind Farm
p-y Curve for Soft Clay
0
0.1
0.2
0.3
0.4
0.5
0 0.1 0.2 0.3 0.4 0.5 0.6 0.7 0.8 0.9 1y/yc
p/pu
Figure 11.1 p-y curves for clay, ref [3].
yc is calculated as:
Dyc ⋅⋅= 505.2 ε
ε50 is strain which occurs at one-half the maximum stress on laboratory undrained compression tests. D is the pile diameter.
The ε50 value for clay can be taken according to Table 11.2.
Table 11.2 Representative values for ε50 for unified criteria, ref. [8].
cu [kPa] ε50
12–25 0.02
25–50 0.01
50–100 0.007
100−200 0.005
200−400 0.004
The p-y curves specified for cyclic loading conditions shall be applied for represen-tation of the lateral support.

30 File: [Captia] KRF Design Basis Foundations 2007-01-29 (S) Design Basis Foundations Version: B1, 2008-01-29
11.2.3 Lateral and Axial Bearing, Fatigue Analysis, Spring Constant The lateral and axial bearing capacity in the fatigue analysis shall be modelled as spring constants.
The soil pile interaction relationship is normally a smooth curve. The spring con-stants used in the linear analysis shall be taken as the initial slope of the smooth curve.
11.3 Minimum Wall Thickness For piles that are to be installed by driving and hard driving (200 blows per 0.25 m) is anticipated, the minimum wall thickness used should not be less than, ref. [4] API:
10035.6 Dt +=
where t is the wall thickness of the pile D is the outside diameter of the pile
11.4 FLS – Driveability and Fatigue Analysis The driveability studies and driving fatigue analyses shall be carried out for the piles. Upper bound of the cone tip resistances shall be used.
The driveability and fatigue study shall be performed to investigate if the piles can be driven safely to the target penetration and to ensure that the fatigue damage, which can occurs during driving is acceptable.
11.4.1 Driveability Study The driveability study shall be performed using a dynamic analysis, which is fully capable of representing the stress wave propagation (inclusive reflection) through the pile. All sections in the pile shall be modelled. The analysis shall include a detailed model of the hammer based on hammer specific information.
11.4.2 Pile Driving Fatigue The installation induced partial fatigue damage shall be calculated by applying the following procedure:
Each pile is divided into a number of elements during the driveability analysis in or-der to specify maximum and minimum stress for each element at each depth analysed and for each stroke. The stress range is calculated from these stresses.
The accumulated damage for each element is calculated by adding the damages down to the actual driving depth.
31 Vattenfall Vindkraft AB Kriegers Flak Offshore Wind Farm
12 GBS: Geotechnical Parameters
12.1 Vertical Bearing Capacity The vertical bearing capacity analysis shall be carried out for the extreme design loading and ULS condition in accordance with DNV approach, ref. [1] or GL ap-proach, ref. [10].
12.2 Sliding Horizontal forces to be used for check of sliding failure shall be determined taking into account the combined action of horizontal force and torsional moment. The method is described in DNV.
The sliding resistance of the gravity base shall be determined according to DNV rules assuming that the strength parameters for intact soil apply.
In case of foundations are excavated into cohesive soils the weakening of the thin upper zone shall be taken into consideration.
12.3 Skirt Penetration Analyses The skirt penetration resistance shall be calculated based on cone tip resistance in ac-cordance with DNV.
12.4 Soil Reactions Installation load case and permanent load case shall be analysed.
12.4.1 Installation load case For the installation case the load case cover the period from first seabed contact until the under-base grouting operation has been completed and the grout has cured.
12.4.2 Permanent load case During the extreme event it is expected that the vertical loads on the skirts will tend to go over to the base. If settlement takes place after the extreme event the loads will tend to go back from the base to the skirts. Therefore the following two assumptions shall be used for the analysis of the foundation base:
1. All permanent loads are carried as a uniform vertical stress against the grout.
2. The skirts carry all the permanent vertical loads as skin friction.
12.4.3 ULS load case. The soil reaction on the contact face of the base slab shall be assumed to be distrib-uted according to the one assumption, out of the two described below, which gives the most severe loading on the base slap.
• Uniform distribution over an effective foundation area.
• Re-distribution contact pressure, calculated according to the theory of elasticity.

32 File: [Captia] KRF Design Basis Foundations 2007-01-29 (S) Design Basis Foundations Version: B1, 2008-01-29
12.5 Settlements For SLS design conditions, analyses of settlements and displacements shall be inves-tigated in accordance with DNV/GL.

33 Vattenfall Vindkraft AB Kriegers Flak Offshore Wind Farm
13 References
1. DNV Offshore Standard: DNV-OS-J101 “Design of Offshore Wind Turbine Structures”, 2007.
2. DNV Offshore Standard: DNV-OS-C502 “Offshore Concrete Structures”.
3. ISO/CD 19902 Fixed Steel Offshore Structures 2001.
4. American Petroleum Institute API (2000). API Recommended Practice for Plan-ning, Designing and Construction Fixed Offshore Platforms – Working stress Design API-RP2A-WSD, 21st edition, December 2000.
5. Baldim, G., Bellotti, R., Ghionna, V., Jamiolkowski, M. and Pasqualini, E. (1986). Interpretation of CPTs and CPTUs; 2end part: drained penetration og sands. Proceedings of the Fourth International Geotechnical Seminar, Singapore, 143-156.
6. Lee, L. Kenneth, Facht, A. John. Liquefaction Potential at Ekofisk Tank in North Sea. ASCE January 1975.
7. Schmertmann, J. H. (1978) Guidelines for Cone Penetration Test; Performance and Design. U.S. Department of Transportation. Federal Highway Administra-tion, Wash. D.C. FWHA-TS-78-209.
8. Sullivan, W.R., Reese, L. C. & Fenske, C. W. “Unified Method for Analysis of laterally loaded piles in clay” Institution of Civil Engineers. Numerical methods in offshore piling, London 1980, p. 135-146.
9. IEC 61.400-3: Ed.1 Wind turbines. Part 3. Design requirements for offshore tur-bines (CDV of august 2007).
10. GL (2004): Guideline for certification of offshore wind turbines.