ktb m ta - rochester institute of technologyedge.rit.edu/edge/p07105/public/documents/safety...
TRANSCRIPT
Kt
O 0.01 0.02 0.03 . _ 0.04 0.05 0.06 0.07rid
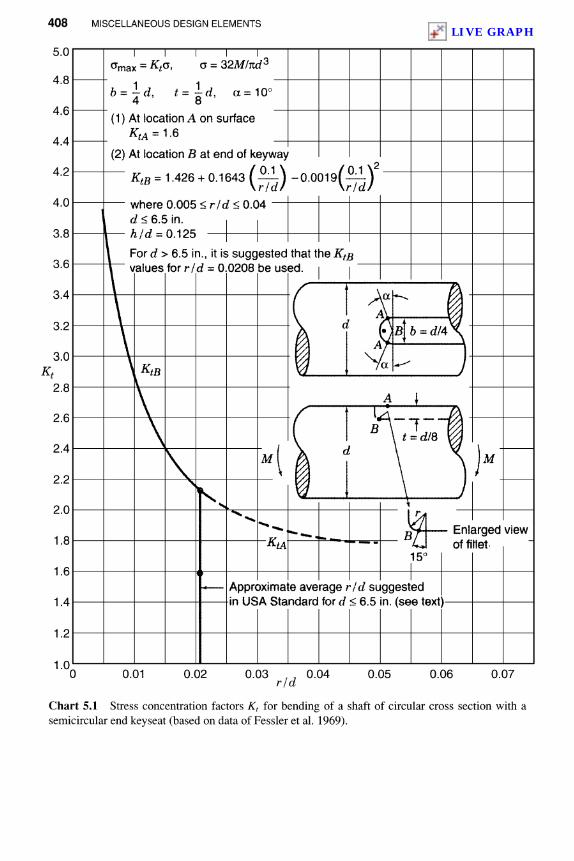
Chart 5.1 Stress concentration factors Kt for bending of a shaft of circular cross section with asemicircular end keyseat (based on data of Fessler et al. 1969).
Approximate average rid suggestedin USA Standard for d < 6.5 in. (see text)
KtB
Enlarged viewof fittet
M
KtA
M
(1) At location A on surface
KtA = 1-6
(2) At location B at end of keyway
For d > 6.5 in., it is suggested that the K&values for rid = 0.0208 be used.
LIVE GRAPH
KtorKts
rid
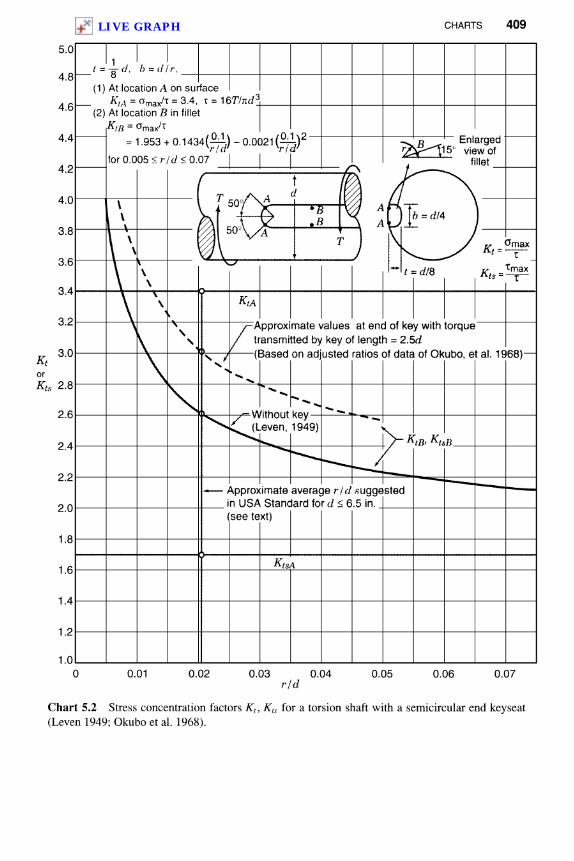
Chart 5.2 Stress concentration factors Kt, Kts for a torsion shaft with a semicircular end key seat
(Leven 1949; Okubo et al. 1968).
Approximate average rid .suggestedin USA Standard for d < 6.5 in.(see text)
KtsA
Without key—(Leven, 1949)
A A J—•{
K(B* %tsB
Approximate values at end of key with torquetransmitted by key of length = 2.5d(Based on adjusted ratios of data of Okubo, et at. 1968)
KtA
Enlargedview of
fillet
(1) At location A on surface
(2) At location B in fillet
LIVE GRAPH
Kt orKts
M/T TIM
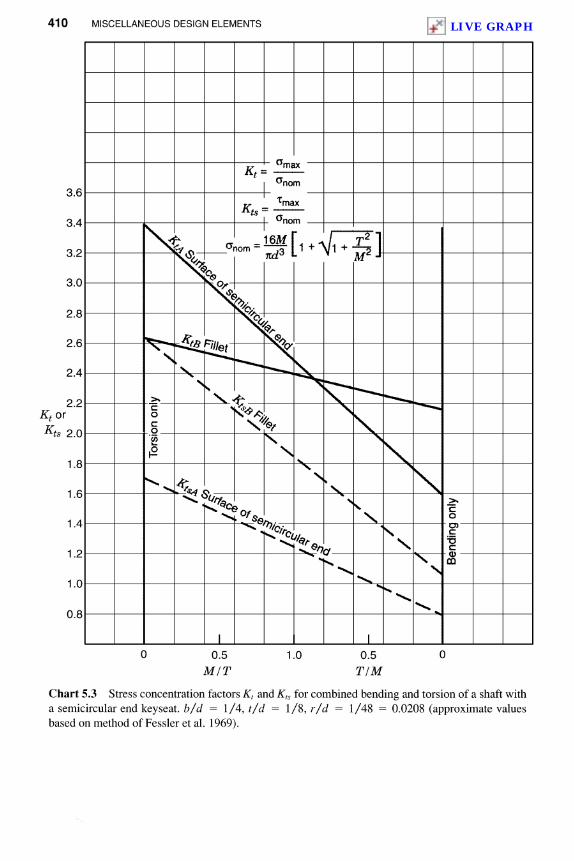
Chart 5.3 Stress concentration factors K1 and Kts for combined bending and torsion of a shaft witha semicircular end keyseat. b/d = 1/4, t/d = 1/8, r/d = 1/48 = 0.0208 (approximate valuesbased on method of Fessler et al. 1969).
Tor
sion
onl
y
Ben
ding
onl
y
LIVE GRAPH
Kfs
rid
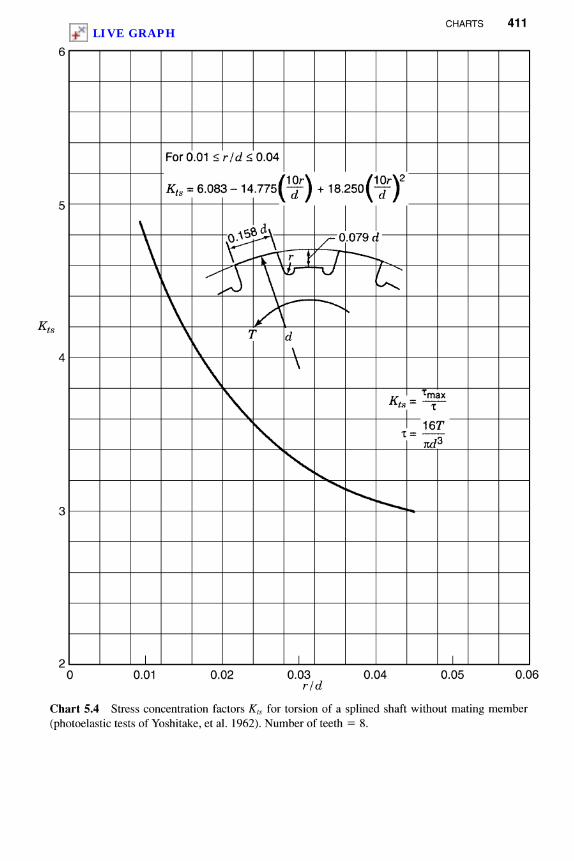
Chart 5.4 Stress concentration factors Kts for torsion of a splined shaft without mating member(photoelastic tests of Yoshitake, et al. 1962). Number of teeth = 8.
LIVE GRAPH
O 0.1 0.2 0.3 0.4 0.5 e/t 0.6 0.7 0.8 0.9 1.0
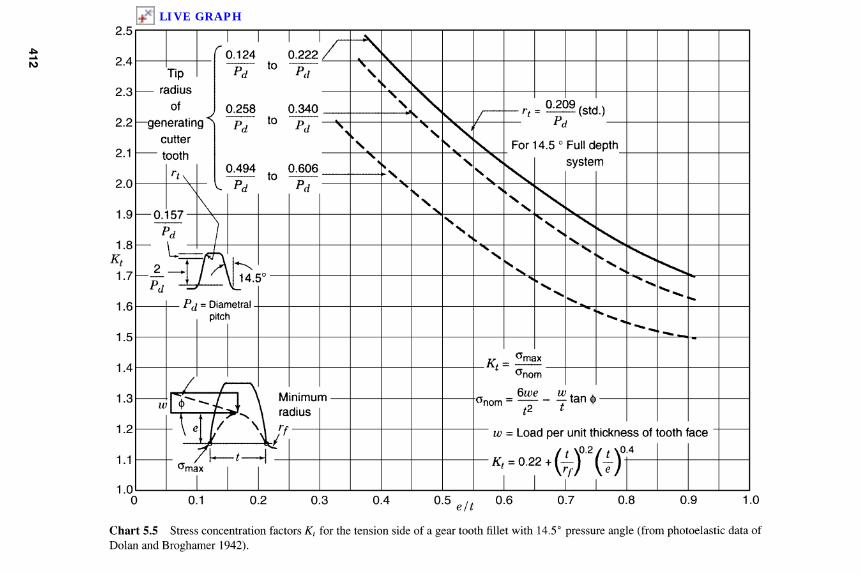
Chart 5.5 Stress concentration factors Kt for the tension side of a gear tooth fillet with 14.5° pressure angle (from photoelastic data ofDolan and Broghamer 1942).
Kt
For 14.5 0FuII depthsystem
w = Load per unit thickness of tooth face
Tipradius
ofgenerating
cuttertooth
PfI - Diametralpitch
Minimumradius
LIVE GRAPH

e / t
Chart 5.6 Stress concentration factors Kt for the tension side of a gear tooth fillet, 20° pressure angle (from photoelastic data of Dolanand Broghamer 1942).
Kt
w = Load per unit thickness of tooth face
20° Full depth system
Not standardized
20° Stub system
Tipradius
ofgenerating
cuttertooth
Diametralpitch
Minimumradius
LIVE GRAPH
rfpd
Number of teeth
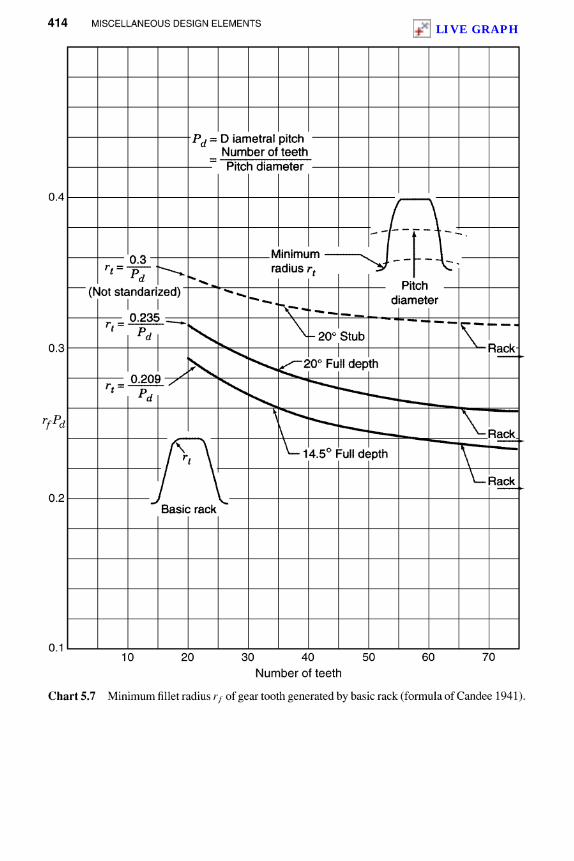
Chart 5.7 Minimum fillet radius rf of gear tooth generated by basic rack (formula of Candee 1941).
Basic rack
Full depth
Full depth
Pitchdiameter
Pd = D iametral pitchNumber of teethPitch diameter
Minimumradius rt
20° StubRack
(Not standarized)
Rack.
Rack
LIVE GRAPH
Kt
O 0.1 rfjt 0.2 0.3
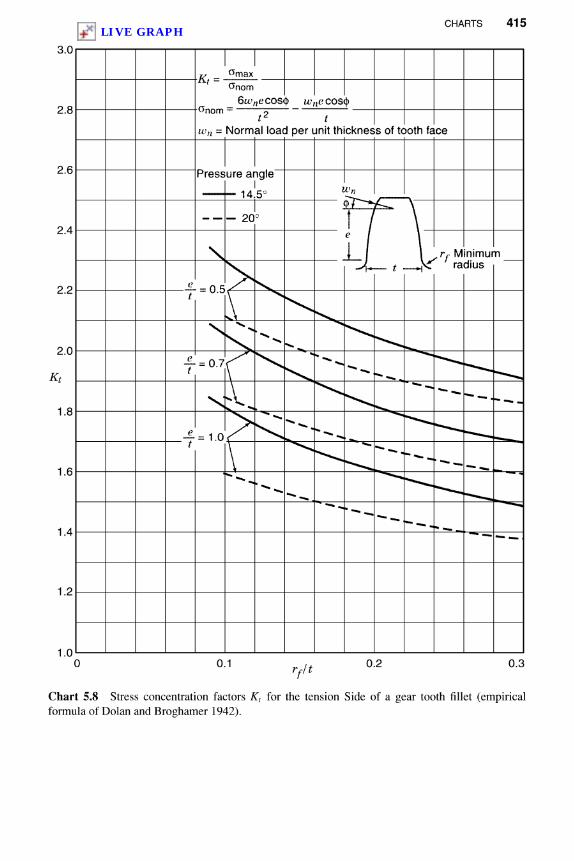
Chart 5.8 Stress concentration factors Kt for the tension Side of a gear tooth fillet (empiricalformula of Dolan and Broghamer 1942).
Minimumradius
Pressure angle
wn - Normal load per unit thickness of tooth face
i^/T~
14.5°
20°
LIVE GRAPH
Kt
r/t
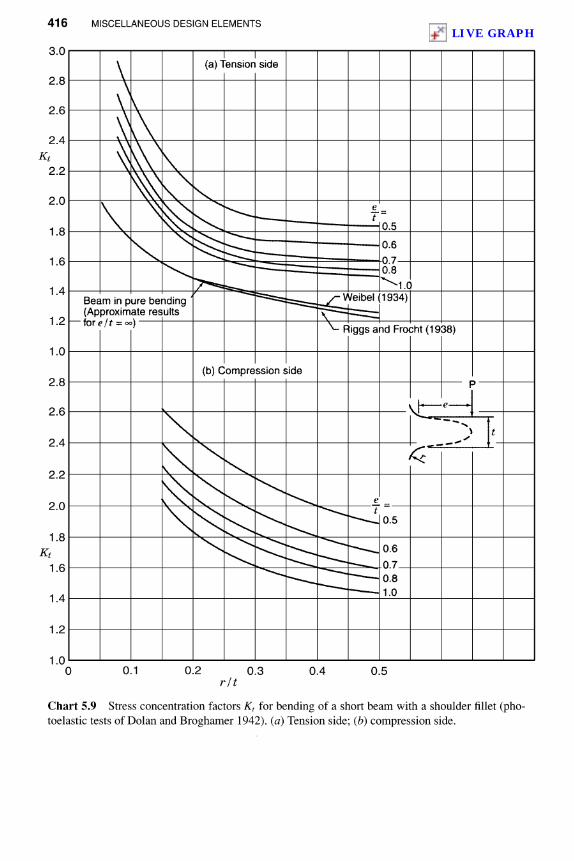
Chart 5.9 Stress concentration factors Kt for bending of a short beam with a shoulder fillet (pho-toelastic tests of Dolan and Broghamer 1942). (a) Tension side; (b) compression side.
(b) Compression side
(a) Tension side
Beam in pure bending(Approximate resultsfore/f = 00)
Weibel(1934)
Riggs and Frocht (1938)
Kt
LIVE GRAPH

KtA
H/d
Chart 5.1Oa Stress concentration factors for a T-Head (photoelastic tests of Hetenyi 1939b and1943). (a) r/d = 0.05.
Dashed lineKtA=KtB
(a) rid = 0.05
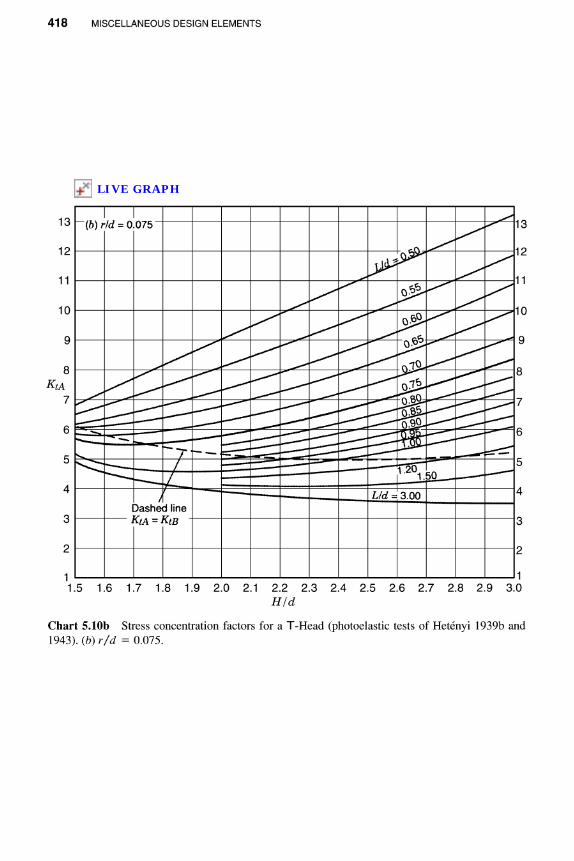
For tension K(A For bending KtB
LIVE GRAPH
KtA
HId
Chart 5.1Ob Stress concentration factors for a T-Head (photoelastic tests of Hetenyi 1939b and1943). (b) r/d = 0.075.
(b) r/d = 0.075
Dashed lineKtA = KtB
LIVE GRAPH
KtA
HIh
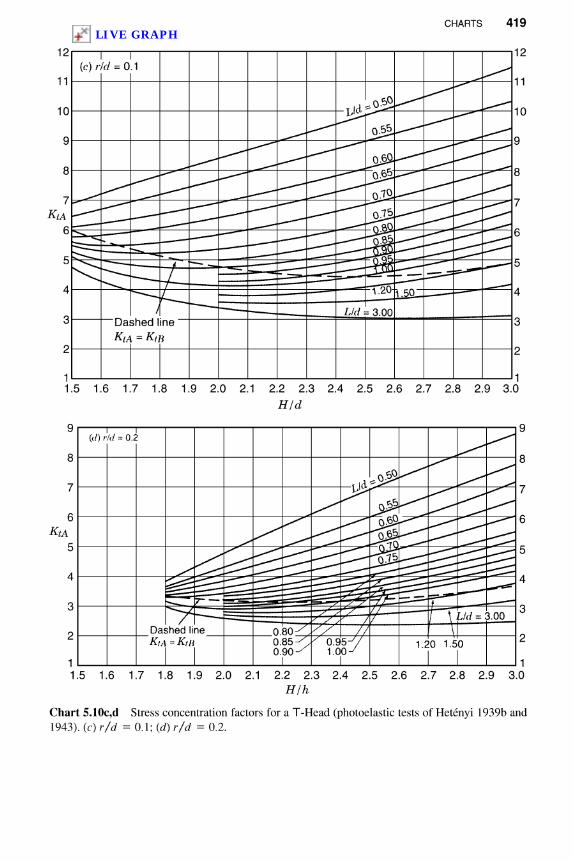
Chart 5.10c,d Stress concentration factors for a T-Head (photoelastic tests of Hetenyi 1939b and1943). (c) r/d =0.1; (d) r/d = 0.2.
Dashed line'KtA=KtB
(t/) rid = 0.2
Dashed lineKtA=K(B
KtA
HId
(c) r/c/ = 0.1
LIVE GRAPH

O 0.1 0.2 0.3 0.4 0.5 0.6 0.7 0.8 0.9 1.0x/(d-r)
Chart 5.1Oe Stress concentration factors for a T-Head (photoelastic tests of Hetenyi 1939b and 1943). (e) Variable location of concentratedreaction P/2.
KtA
(e) Variable location of concentrated reaction P/2
LIVE GRAPH
0.02 0.1 p 0.5 1 2Id /L2
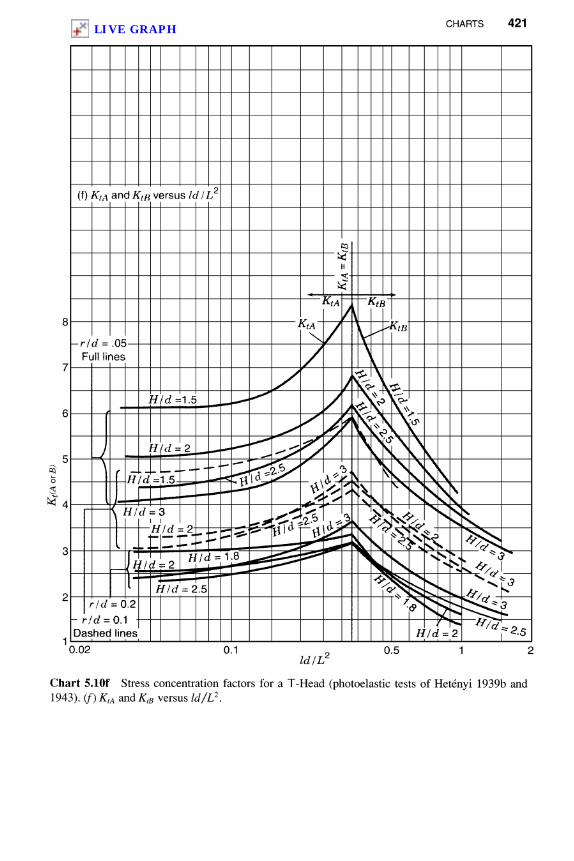
Chart 5.1Of Stress concentration factors for a T-Head (photoelastic tests of Hetenyi 1939b and1943). (/) KtA and KtB versus Id/L2.
Dashed lines
Full lines
(f) KfA and KtK versus IdIL2
Kt(A
orB
)
LIVE GRAPH
d/H
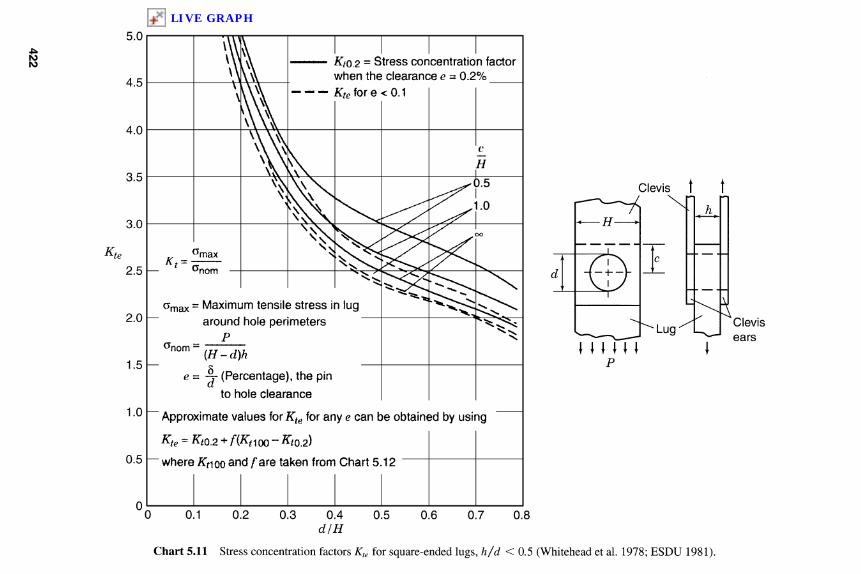
Chart 5.11 Stress concentration factors Kte for square-ended lugs, h/d < 0.5 (Whitehead et al. 1978; ESDU 1981).
Kte
Clevisears
Kto.2 = Stress concentration factorwhen the clearance e = 0.2%Kte tor e< 0.1
Clevis
Maximum tensile stress in lugaround hole perimeters
Lug
e = 4- (Percentage), the pinto hole clearance
Approximate values for Kie for any e can be obtained by using
Kte = io.2 + f(Knvo~ KtQ.2)
where /T^ QO ^nd /"are taken from Chart 5.12
LIVE GRAPH

d/H
Chart 5.12 Stress concentration factors Kte for round-ended lugs, h/d < 0.5 (Whitehead et al. 1978; ESDU 1981).
%te
HI2radius
KtQ.2 = Stress concentration factor whenthe clearance e = 0.2%
^100 = Stress concentration factor whenthe load P is applied uniformly along thethickness of a lug at the contact line betweenbetween the lug hole and pin (point A)
(Percentage), the pin to hole clearance
LIVE GRAPH

s_^8
O 0.5 1.0 h 1.5 2.0 2.5
d~
Chart 5.13 Stress concentration factors K'te for thick lugs. Square or round ended lugs with h/d >0.5 and 0.3 < d/H < 0.6 (Whitehead et al. 1978; ESDU 1981).
£pln = Modulus of elasticity of pinE = Modulus of elasticity of lug
K'te = Stress concentration factor for h/d > 0.5
Kte - Stress concentration factor for h Id < 0.5taken from Chart 5.11 and 5.12
LIVE GRAPH
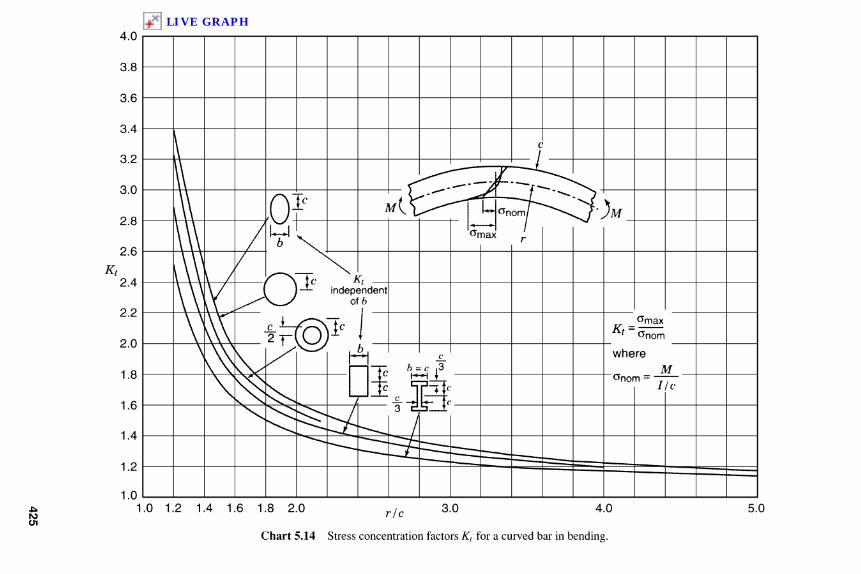
1.0 1.2 1.4 1.6 1.8 2.0 r/c 3.0 4.0 5.0
Chart 5.14 Stress concentration factors K1 for a curved bar in bending.
KtK1
independentof ft
LIVE GRAPH

(^ wor
Kts
Spring index c = d/a
Chart 5.15 Stress factors Cw and Kts for helical compression or tension springs of round or squarewire (from mathamatical relations of Wahl 1963).
Square wire
Kts Stress concentration factor
Cw Wahl correction factor
Round wire G6hner(1932)
LIVE GRAPH
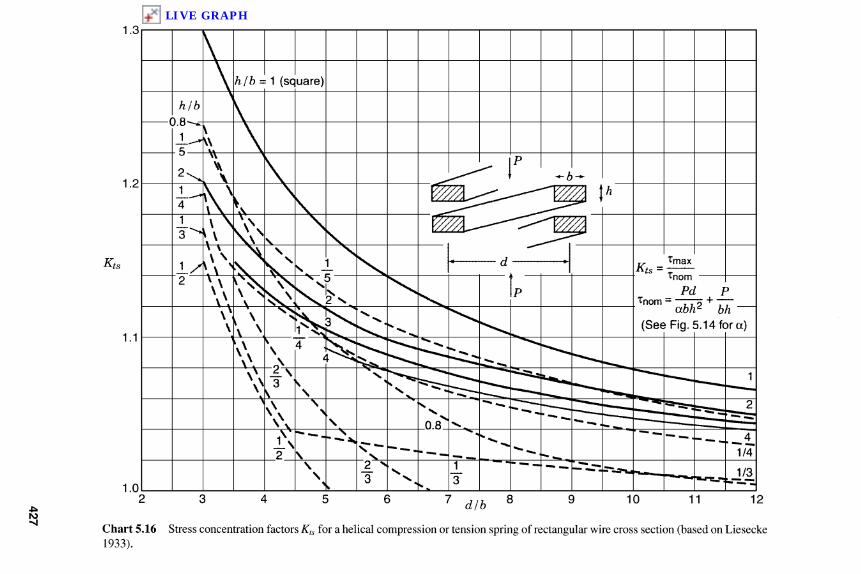
2 3 4 5 6 7 d/b 8 9 10 11 12
Chart 5.16 Stress concentration factors Kts for a helical compression or tension spring of rectangular wire cross section (based on Liesecke1933).
Kts
/i/6 = 1 (square)
(See Fig. 5.14 for a)
LIVE GRAPH
Kt
Spring index c = d/a
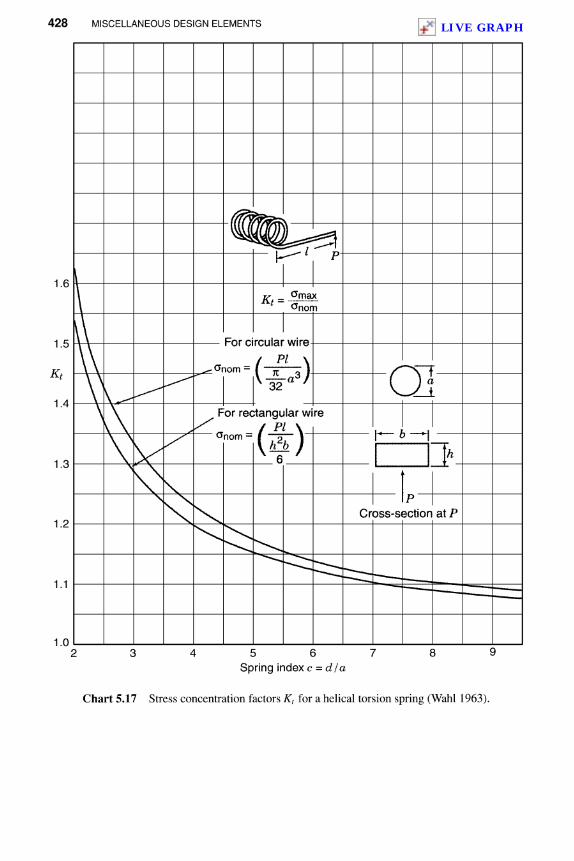
Chart 5.17 Stress concentration factors Kt for a helical torsion spring (Wahl 1963).
Cross-section at P
For circular wire
For rectangular wire
LIVE GRAPH
Kt
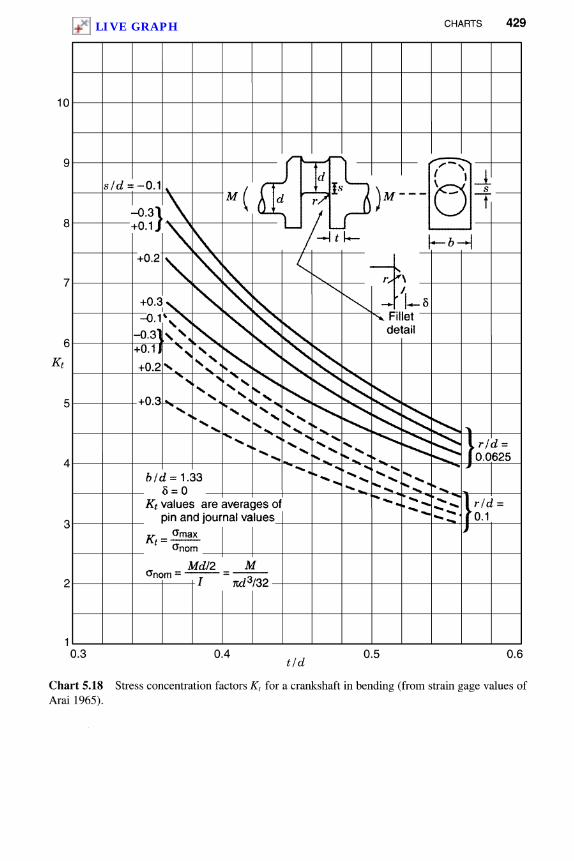
0.3 0.4 , 7 0.5 0.6t/d
Chart 5.18 Stress concentration factors Kt for a crankshaft in bending (from strain gage values ofArai 1965).
Kt values are averages ofpin and journal values
Filletdetail
LIVE GRAPH

Kt
rid
Chart 5.19 Stress concentration factors Kt for a crankshaft in bending (strain gage values of Arai1965). See figure of Chart 5.18 for notation.
Kt values are averageof pin and journal values
fe/d=1.33, f /d = 0.562, 6 = 0
LIVE GRAPH
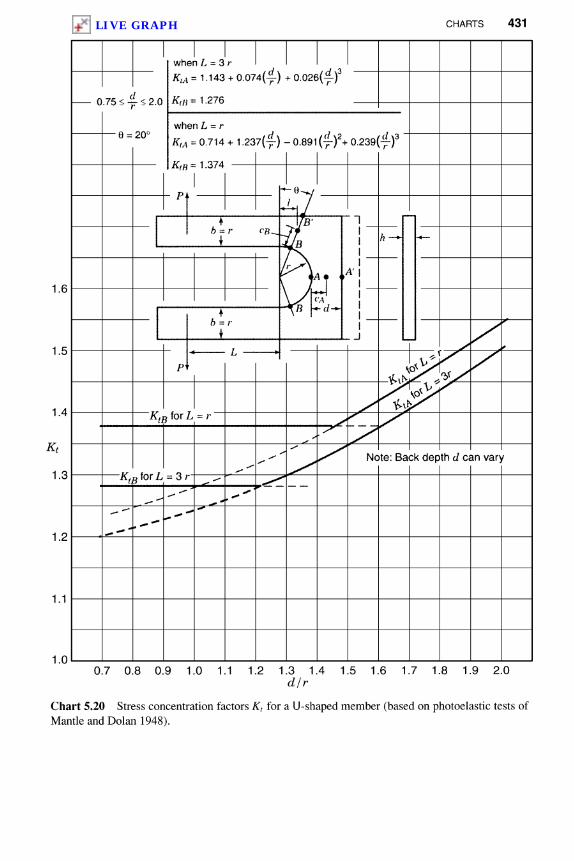
Kt
d/r
Chart 5.20 Stress concentration factors Kt for a U-shaped member (based on photoelastic tests ofMantle and Dolan 1948).
Note: Back depth d can vary
KtB for L = r
KtB for L = 3 r
LIVE GRAPH
O 0.1 0.2 0.3 0.4 0.5 r/d 0.6 0.7 0.8 0.9 1.0
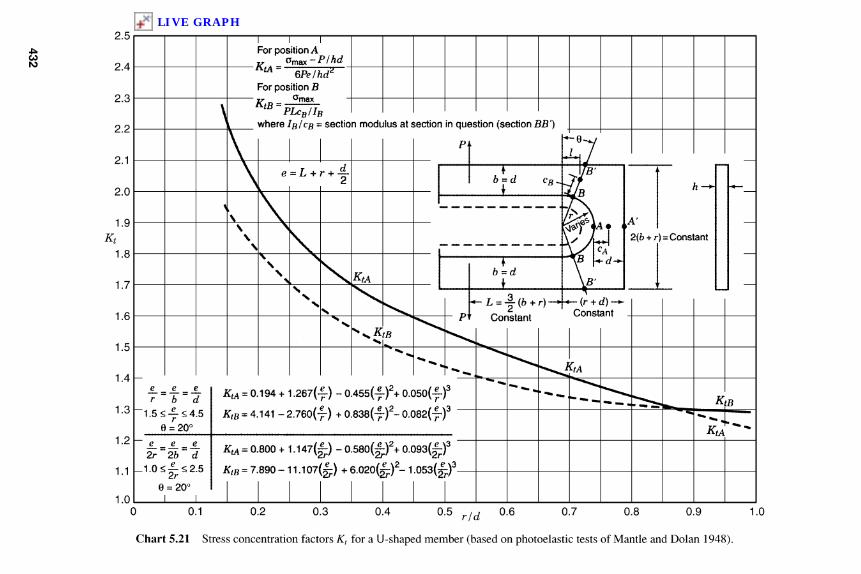
Chart 5.21 Stress concentration factors Kt for a U-shaped member (based on photoelastic tests of Mantle and Dolan 1948).
Kt
Constant
For position Av Grnax-P/hdKtA= SPe/hd*For position Bv °maxKtB~~ PL^TBwhere IR/eg = section modulus at section in question (section BB')
Constant
Constant
LIVE GRAPH
Kts
O 0.5 1.0 1.5r/h
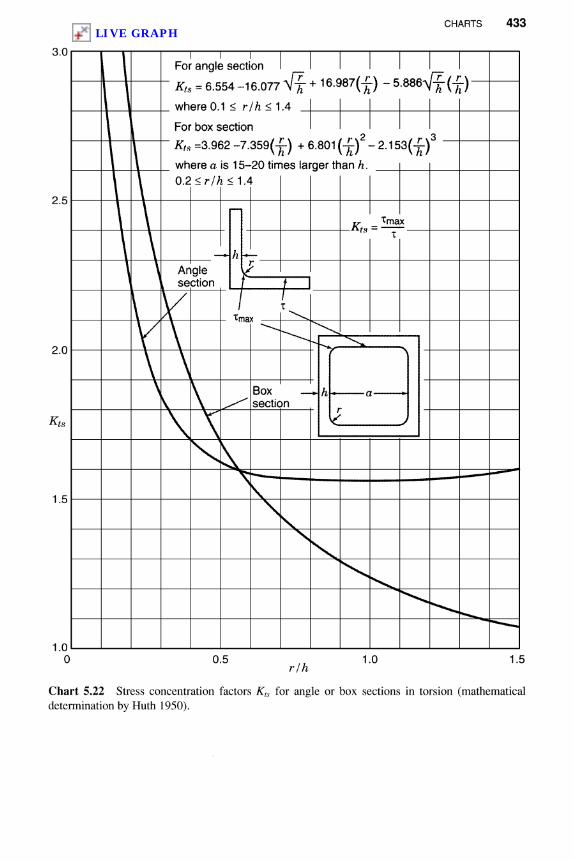
Chart 5.22 Stress concentration factors Kts for angle or box sections in torsion (mathematicaldetermination by Huth 1950).
tmax
Boxsection
Anglesection
For angle section
For box section
LIVE GRAPH
Kt
#1 /R2
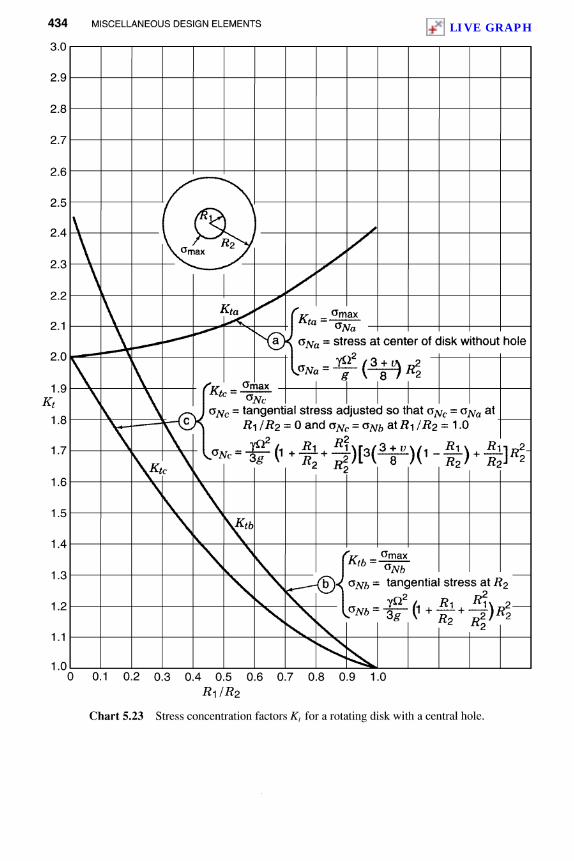
Chart 5.23 Stress concentration factors K1 for a rotating disk with a central hole.
tangential stress adjusted so that
tangential stress at R2
stress at center of disk without hole
LIVE GRAPH

Kt
RQ/R2
Chart 5.24 Stress concentration factors K1 for a rotating disk with a noncentral hole (photoelastictests of Barnhart, Hale, and Meriam 1951).
where o - tangential stress in a solid disk at radius of point A
JR1 is the radius of the hole
LIVE GRAPH
Kt
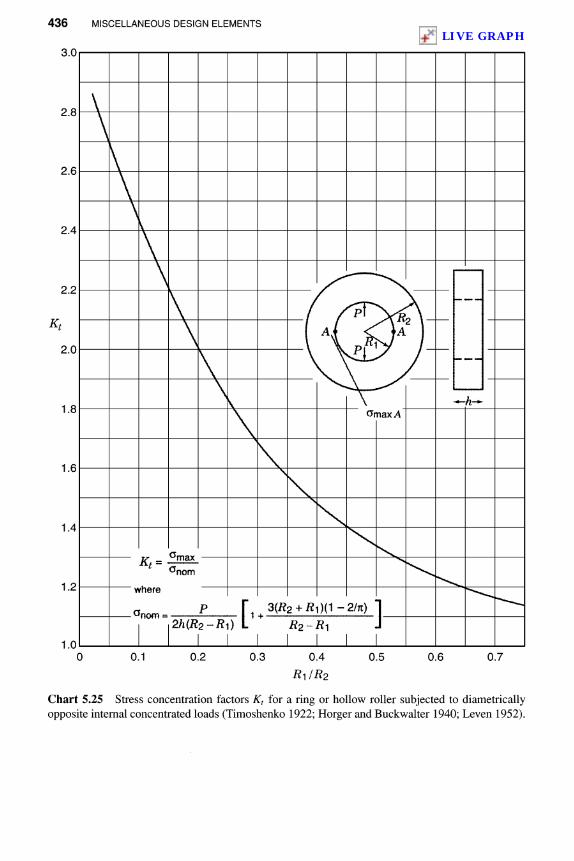
R\IRi
Chart 5.25 Stress concentration factors Kt for a ring or hollow roller subjected to diametricallyopposite internal concentrated loads (Timoshenko 1922; Horger and Buckwalter 1940; Leven 1952).
LIVE GRAPH
Kt
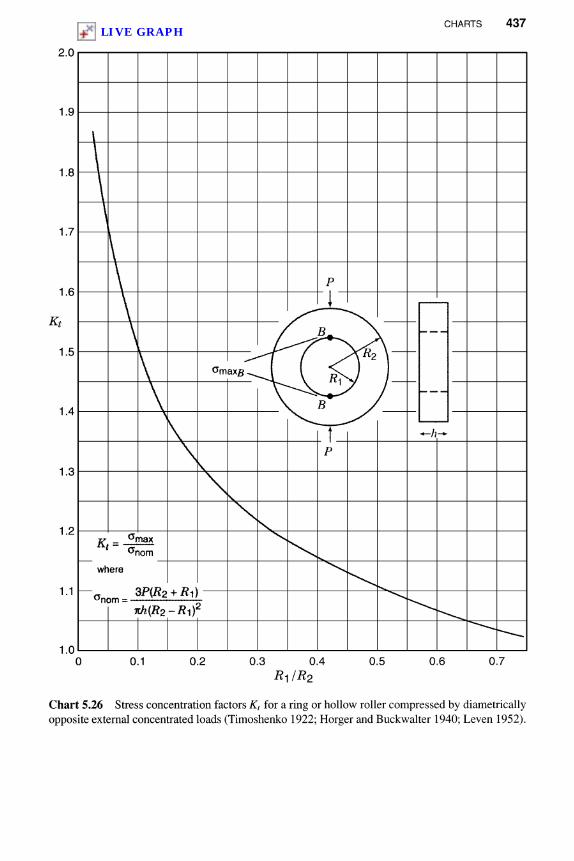
Rt/RZChart 5.26 Stress concentration factors K, for a ring or hollow roller compressed by diametricallyopposite external concentrated loads (Timoshenko 1922; Horger and Buckwalter 1940; Leven 1952).
LIVE GRAPH

R\IRzChart 5.27 Stress concentration factors K, for a cylinder subject to internal pressure (based on Lame solution, Pilkey 1994).
Kt
LIVE GRAPH
Kt
n/d
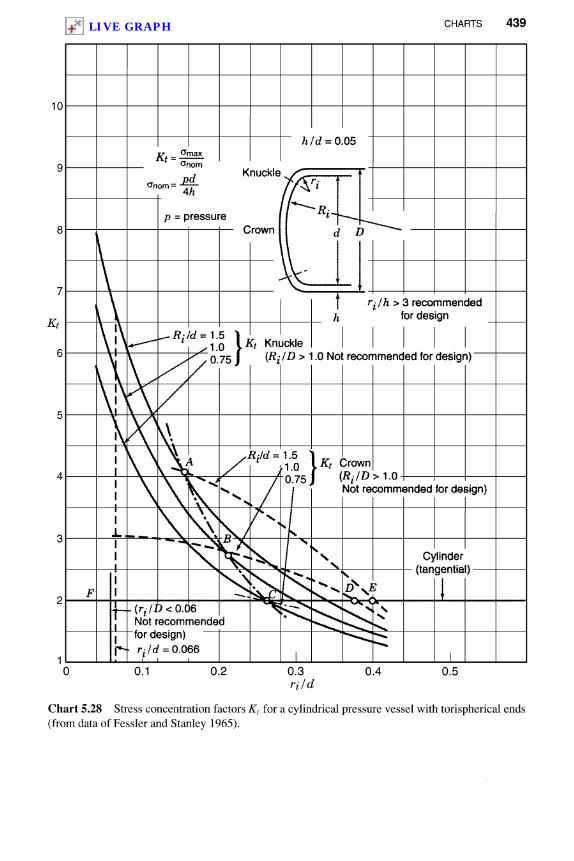
Chart 5.28 Stress concentration factors Kt for a cylindrical pressure vessel with torispherical ends(from data of Fessler and Stanley 1965).
Not recommendedfor design)
Crown(R1 /D > 1.0Not recommended for design)
Cylinder(tangential)
Knuckle
pressureCrown
3 recommendedfor design
Knuckle(RI ID > 1.0 Not recommended for design)
LIVE GRAPH
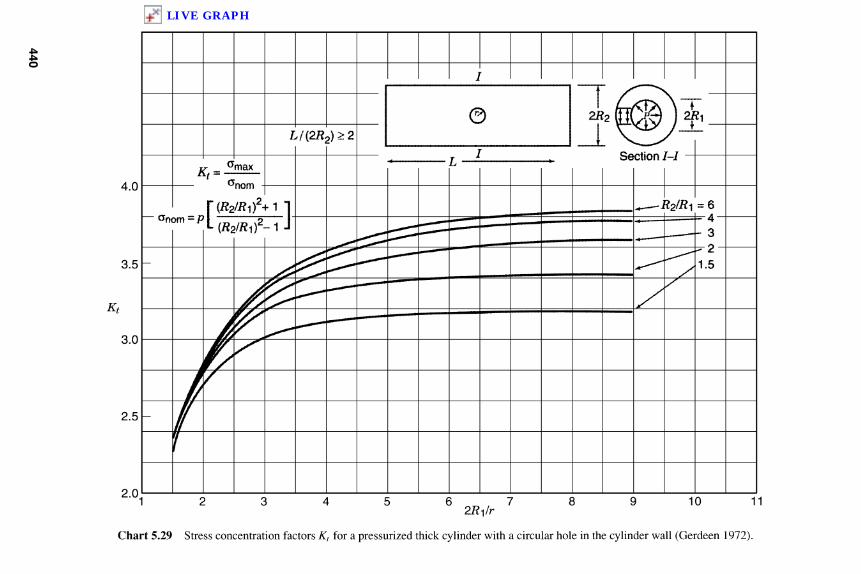
1 2 3 4 5 6 , 7 8 9 1 0 1 12Ri/r
Chart 5.29 Stress concentration factors Kt for a pressurized thick cylinder with a circular hole in the cylinder wall (Gerdeen 1972).
Kt
64-32-
1.5
Section /-/
LIVE GRAPH