kyocera corporation 1. results for the year ended … · kyocera corp. products/...
TRANSCRIPT
1
KYOCERA CORPORATIONKYOCERA CORPORATIONKYOCERA CORPORATIONKYOCERA CORPORATION
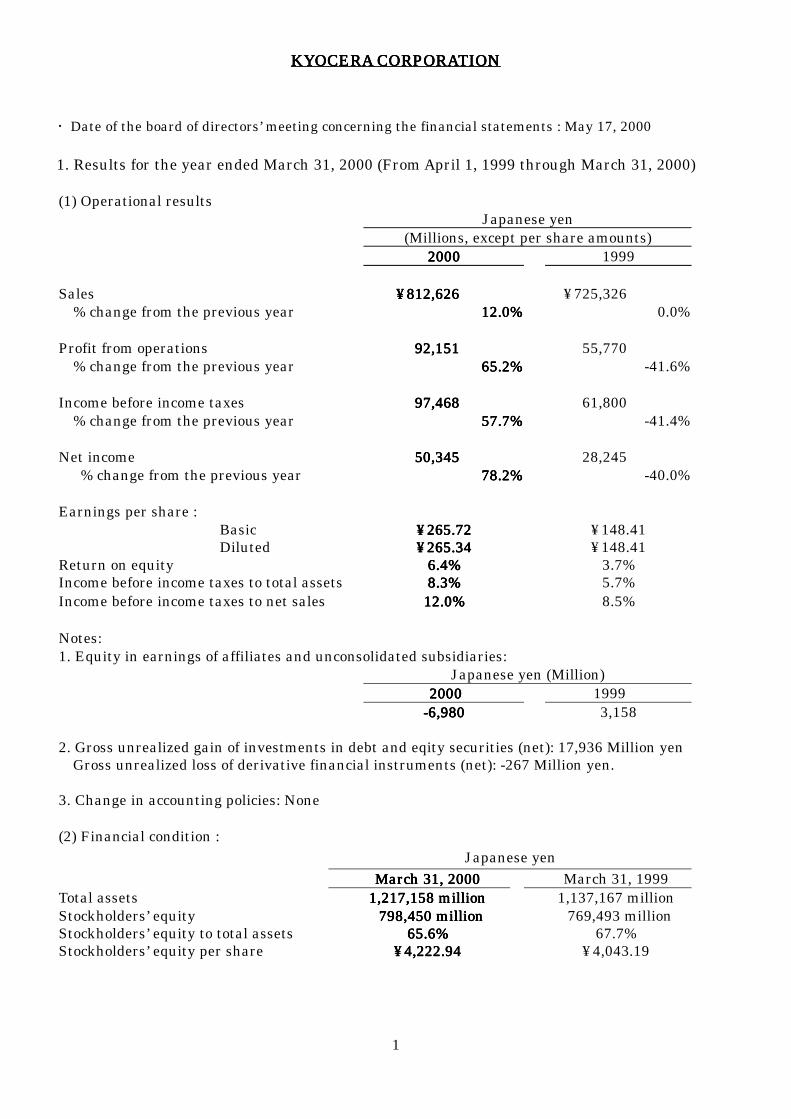
・ Date of the board of directors’ meeting concerning the financial statements : May 17, 2000 1. Results for the year ended March 31, 2000 (From April 1, 1999 through March 31, 2000)
(1) Operational resultsJapanese yen
(Millions, except per share amounts)2000200020002000 1999
Sales ¥812,626¥812,626¥812,626¥812,626 ¥725,326 % change from the previous year 12.0%12.0%12.0%12.0% 0.0% Profit from operations 92,15192,15192,15192,151 55,770 % change from the previous year 65.2%65.2%65.2%65.2% -41.6%
Income before income taxes 97,46897,46897,46897,468 61,800 % change from the previous year 57.7%57.7%57.7%57.7% -41.4% Net income 50,34550,34550,34550,345 28,245 % change from the previous year 78.2%78.2%78.2%78.2% -40.0%
Earnings per share : Basic ¥265.72¥265.72¥265.72¥265.72 ¥148.41 Diluted ¥265.34¥265.34¥265.34¥265.34 ¥148.41Return on equity 6.4%6.4%6.4%6.4% 3.7%Income before income taxes to total assets 8.3%8.3%8.3%8.3% 5.7%Income before income taxes to net sales 12.0%12.0%12.0%12.0% 8.5%
Notes:1. Equity in earnings of affiliates and unconsolidated subsidiaries:
Japanese yen (Million)2000200020002000 1999
-6,980-6,980-6,980-6,980 3,158
2. Gross unrealized gain of investments in debt and eqity securities (net): 17,936 Million yenGross unrealized loss of derivative financial instruments (net): -267 Million yen.
3. Change in accounting policies: None
(2) Financial condition :Japanese yen
March 31, 2000March 31, 2000March 31, 2000March 31, 2000 March 31, 1999Total assets 1,217,158 million1,217,158 million1,217,158 million1,217,158 million 1,137,167 millionStockholders’ equity 798,450 million 798,450 million 798,450 million 798,450 million 769,493 millionStockholders’ equity to total assets 65.6%65.6%65.6%65.6% 67.7%Stockholders’ equity per share ¥4,222.94¥4,222.94¥4,222.94¥4,222.94 ¥4,043.19
2
(3) Cash flow :Japanese yen
2000200020002000 1999Net cash provided by operating activities 107,930107,930107,930107,930 125,525
Net cash used in investing activities -73,748-73,748-73,748-73,748 -50,525
Net cash used in financing activities -19,867-19,867-19,867-19,867 -19,042
Cash and cash equivalents at end of the year 178,944178,944178,944178,944 172,417
(4) Scope of consolidation and application of the equity method : Number of consolidated subsidiaries : 94
Number of subsidiaries accounted for by the equity method : 7
Number of affiliates accounted for by the equity method : 20
(5) Changes in scope of consolidation and application of the equity method :
Consolidation Equity method
Increase 8 companies 2 companies
Decrease 0 company 8 companies
2. Projection for the year ending March 31, 2001 : Japanese yen (Millions, except per share amounts)
Six months endingSix months endingSix months endingSix months endingSeptember 30, 2000September 30, 2000September 30, 2000September 30, 2000
Year endingYear endingYear endingYear endingMarch 31, 2001March 31, 2001March 31, 2001March 31, 2001
Net Sales ¥510,000¥510,000¥510,000¥510,000 ¥1,100,000¥1,100,000¥1,100,000¥1,100,000 Income before income taxes 51,00051,00051,00051,000 132,000 132,000 132,000 132,000 Net income 24,000 24,000 24,000 24,000 64,500 64,500 64,500 64,500
Note : Projected annual earnings per share : ¥339.94Earnings per share amounts were computed base on Statement of FinancialAccounting Standards No. 128.Diluted earnings per share in year ending March 31, 2001 will be computed onthe average number of shares of common stock outstanding in year endedMarch 31, 2000.

Products
Leasing KLC(Finance and
Products office renting)Products
KCCS (Sales)Office renting KRD
(Office renting)Products DDI(Telecommunication
services)Products DDI Pocket (Tele- Domestic
communication services)Products HKC (Hotel operation/
KSC (Sales) maintenance)Products KIC (Insurance /
travel agent)KPS(Succor team)
Products Taito(Amusement )KMC
Products (Information services)KSS (Electronic components
Parent company Products Manufacturing/Sales)
Kyocera Corp. Products/ KAI(Manufacturing/Sales) Products
Raw materials(Manufacturing/
Sales) Products KII North(Regional headquarters) America
ProductsKEI (Sales)
Products
KFG (Sales) ProductsProducts KFS (Sales)
KFL (Sales) Products
KEE (Sales) KEG EuropeKEF (Sales) (Regional headquarters)
Products KEU (Sales)KEIS (Sales) YKG (Sales)KEB (Sales) YAG (Sales)
YAU (Sales)Products KYU (Sales)
KYF (Sales)
Products KAP (Sales)KAP/LTD (Sales)KMS (Sales)
ProductsYHK (Sales)
Products Asia/PIAZZA Australia
Products (Real estate renting)KEA (Sales)
Raw materials
Products
Semi-ProductsRaw materials
Products SKO (Sales)SKRD
Products/ (Real estate renting)Raw materials
Products/Raw materialsProducts/Raw materials TPC (sales) South
AmericaNote: “Ceramic and related products” includes following items.
CentralAmerica
Middle East
AVX(Manufacturing/Sales)
TPC(Sales)
TPC(Manufacturing/Sales)
AVX(Manufacturing/Sales)
AVX(Manufacturing/Sales)
ELCO(Manufacturing/Sale
KPTK(Manufacturing/Sale
SKE(Manufacturing/Sales)
Products
Leasing and Finance
Products
PTKI (Manufacturing)
Geographicareas
ELCO(Manufacturing/Sales)
KSI(Manufacturing/Sales)
Business lines
Ceramic and related products Electronic equipment Optical instruments Others
UOI(Manufacturing/Sales)
Semi-ProductsRaw materials
KOP(Manufacturing/Sales)
KOI(Sales)
Products
KICC(Manufacturing/Sales
KWC(Manufacturing/Sales)
Products
AVX(Manufacturing/Sales)
TPC(Manufacturing/Sales)
KYB(Manufacturing/Sales)
Scope of the group companiesKyocera group consists of Kyocera corp., one hundred one (101) subsidiaries, and 20 affiliates. Below is a outline chart by business line and geographic area.
Fine ceramic parts, semiconductor parts, electronic components, cutting tool, jewelry, BIOCERAM, soaler systems, applied ceramic products and others.
Exp
ort
ing
serv
ice
AVX (Manufactuering Maquiladora)KMX (Manufactuering Maquiladora)
Office renting
Factory renting
Products
3

4
Financial PerformanceFinancial PerformanceFinancial PerformanceFinancial Performance
1. Financial Performance for the Year Ended March 31, 2000
The Company (Kyocera Corporation and its group companies) faced serious market and economicconditions during the past fiscal year. A rise in the value of the yen in relation to the U.S. dollar andDeutsche mark created a negative impact on net sales and pre-tax income totaling approximately 67billion yen and 28.5 billion yen, respectively. Nonetheless, the Company made significantimprovements in most segments, particularly electronic components and semiconductor parts,thanks to stronger demand from communication and information equipment markets worldwide.As a result, consolidated sales for the year ended March 31, 2000 rose to 812,626 million yen, anincrease of 12.0% over the prior year.
In addition, increasing of sales and productivity improvements were made during this period.Consequently, operating profit increased 65.2% over the prior year, to 92,151 million yen, while pre-tax profit increased 57.7%, to 97,468 million yen, and net income increased 78.2%, to 50,345 millionyen.
(1) Segment Results
① Sales of Ceramic and related productsThis segment’s sales increased 16.1%, to 544,260 million yen. This segment’s operating profit rose90.9%, to 95,054 million yen due to increase of sales for Kyocera Corporation (Kyocera) and AVXCorporation (AVX) and productivity improvements.Detailed results for each product line follow.
1) Fine ceramic partsSales: 58,811 million yen (up 9.0% from the prior year)The semiconductor industry’s strong recovery led to a significant increase in sales of ceramiccomponents for semiconductor fabrication equipment. Sales of ceramic components for fiber-opticcommunication systems posted a strong gain as well.
2) Semiconductor partsSales: 150,693 million yen (up 22.9% from the prior year)The expansion of the mobile phone market led to stronger sales of SMD (Surface-Mounted Device)ceramic packages for surface-acoustic wave (SAW) filters and crystal-related electronic components.Sales of ceramic packages for optical communication devices expanded as well.
3) Electronic componentsSales: 271,283 million yen (up 14.0% from the prior year)Rising global demand for mobile phones and personal computers led to increased sales of capacitors,connectors, and oscillator products, such TCXOs (temperature-compensated crystal oscillators) andVCOs (voltage-controlled oscillators). AVX, a U.S. subsidiary, also achieved a substantial salesincrease.
5
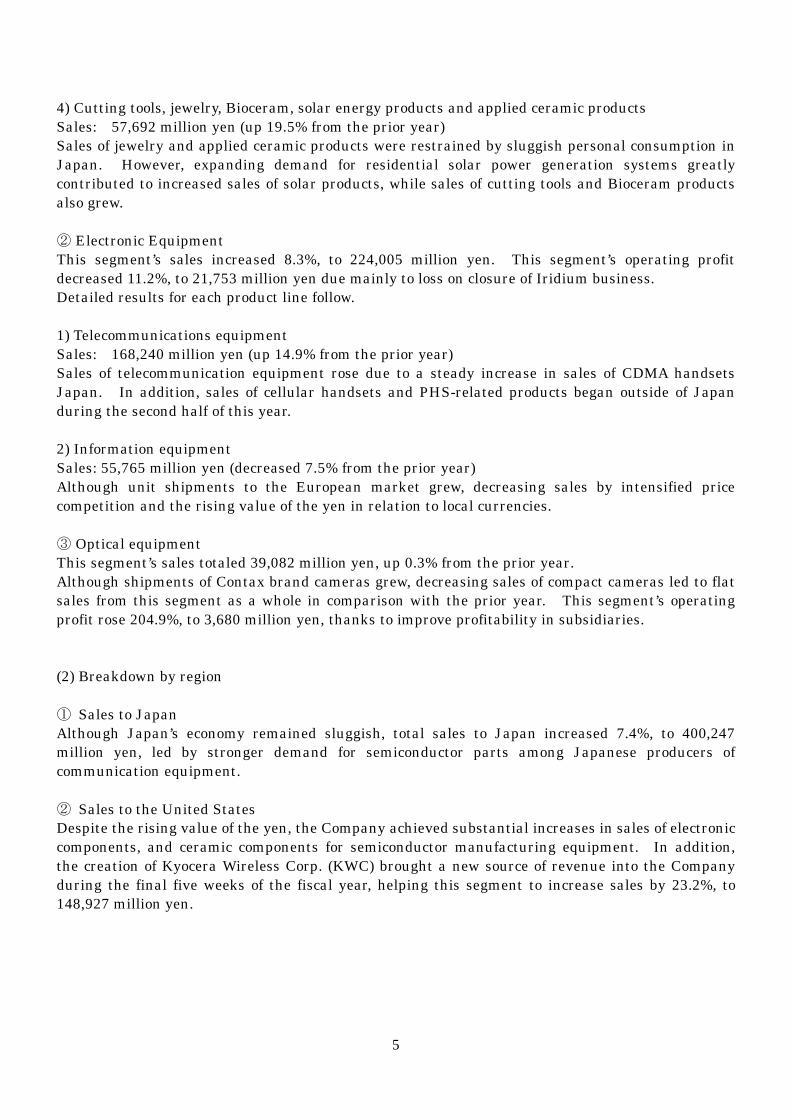
4) Cutting tools, jewelry, Bioceram, solar energy products and applied ceramic productsSales: 57,692 million yen (up 19.5% from the prior year)Sales of jewelry and applied ceramic products were restrained by sluggish personal consumption inJapan. However, expanding demand for residential solar power generation systems greatlycontributed to increased sales of solar products, while sales of cutting tools and Bioceram productsalso grew.
② Electronic EquipmentThis segment’s sales increased 8.3%, to 224,005 million yen. This segment’s operating profitdecreased 11.2%, to 21,753 million yen due mainly to loss on closure of Iridium business.Detailed results for each product line follow.
1) Telecommunications equipmentSales: 168,240 million yen (up 14.9% from the prior year)Sales of telecommunication equipment rose due to a steady increase in sales of CDMA handsetsJapan. In addition, sales of cellular handsets and PHS-related products began outside of Japanduring the second half of this year.
2) Information equipmentSales: 55,765 million yen (decreased 7.5% from the prior year)Although unit shipments to the European market grew, decreasing sales by intensified pricecompetition and the rising value of the yen in relation to local currencies.
③ Optical equipmentThis segment’s sales totaled 39,082 million yen, up 0.3% from the prior year.Although shipments of Contax brand cameras grew, decreasing sales of compact cameras led to flatsales from this segment as a whole in comparison with the prior year. This segment’s operatingprofit rose 204.9%, to 3,680 million yen, thanks to improve profitability in subsidiaries.
(2) Breakdown by region
① Sales to JapanAlthough Japan’s economy remained sluggish, total sales to Japan increased 7.4%, to 400,247million yen, led by stronger demand for semiconductor parts among Japanese producers ofcommunication equipment.
② Sales to the United StatesDespite the rising value of the yen, the Company achieved substantial increases in sales of electroniccomponents, and ceramic components for semiconductor manufacturing equipment. In addition,the creation of Kyocera Wireless Corp. (KWC) brought a new source of revenue into the Companyduring the final five weeks of the fiscal year, helping this segment to increase sales by 23.2%, to148,927 million yen.
6
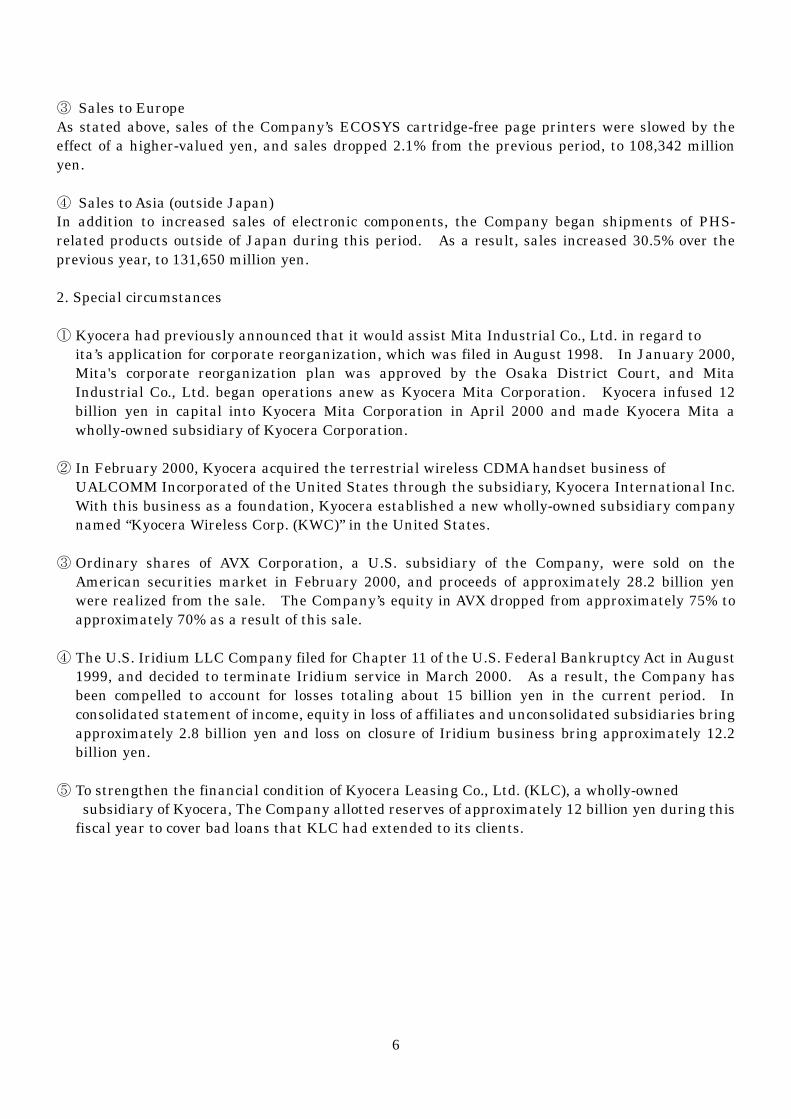
③ Sales to EuropeAs stated above, sales of the Company’s ECOSYS cartridge-free page printers were slowed by theeffect of a higher-valued yen, and sales dropped 2.1% from the previous period, to 108,342 millionyen.
④ Sales to Asia (outside Japan)In addition to increased sales of electronic components, the Company began shipments of PHS-related products outside of Japan during this period. As a result, sales increased 30.5% over theprevious year, to 131,650 million yen.
2. Special circumstances
① Kyocera had previously announced that it would assist Mita Industrial Co., Ltd. in regard toita’s application for corporate reorganization, which was filed in August 1998. In January 2000,Mita's corporate reorganization plan was approved by the Osaka District Court, and MitaIndustrial Co., Ltd. began operations anew as Kyocera Mita Corporation. Kyocera infused 12billion yen in capital into Kyocera Mita Corporation in April 2000 and made Kyocera Mita awholly-owned subsidiary of Kyocera Corporation.
② In February 2000, Kyocera acquired the terrestrial wireless CDMA handset business ofUALCOMM Incorporated of the United States through the subsidiary, Kyocera International Inc.With this business as a foundation, Kyocera established a new wholly-owned subsidiary companynamed “Kyocera Wireless Corp. (KWC)” in the United States.
③ Ordinary shares of AVX Corporation, a U.S. subsidiary of the Company, were sold on theAmerican securities market in February 2000, and proceeds of approximately 28.2 billion yenwere realized from the sale. The Company’s equity in AVX dropped from approximately 75% toapproximately 70% as a result of this sale.
④ The U.S. Iridium LLC Company filed for Chapter 11 of the U.S. Federal Bankruptcy Act in August1999, and decided to terminate Iridium service in March 2000. As a result, the Company hasbeen compelled to account for losses totaling about 15 billion yen in the current period. Inconsolidated statement of income, equity in loss of affiliates and unconsolidated subsidiaries bringapproximately 2.8 billion yen and loss on closure of Iridium business bring approximately 12.2billion yen.
⑤ To strengthen the financial condition of Kyocera Leasing Co., Ltd. (KLC), a wholly-owned subsidiary of Kyocera, The Company allotted reserves of approximately 12 billion yen during thisfiscal year to cover bad loans that KLC had extended to its clients.
7
Non-consolidated resultsOn a non-consolidated basis, sales increased 12.0% compared with the prior year, to 507,802 millionyen. Operating profit increased 46.0%, to 55,013 million yen; recurring profit increased 33.6%, to69,471 million yen; and current net income increased 41.7%, to 39,296 million yen.
3. Cash flow
Net cash provided by operating activities totaled 107,930 million yen (a 14.0% decrease from theprior year). Net cash used in investing activities and net cash used in financing activities amountedto 73,748 million yen (a 46.0% increase from the prior year), and 19,867 million yen (a 4.3% increasefrom the prior year), respectively. In fiscal 2000, appreciation of the yen against the U.S. dollarmade a negative effect to transaction on cash and cash equivalents totaled 7,788 million yen.Consequently, Cash and cash equivalents at ended of this fiscal year increased 3.8% from fiscal 1999,to 178,944 million yen.The decrease for net cash provided by operating activities was due mainly to increase tradereceivables and inventories, although notes and accounts payable increased.Although, the Company gained approximately 34.5 billion yen cash from stock selling of AVX, our netcash used in investing activities increased due mainly to purchase of available-for-sale-securitiesand acquired the companies which became our fully-owned subsidiaries, such as Kyocera Solar, Inc.and KWC. Increasing a net cash used in financing activities was attributable to payingapproximately 9.7 billion yen for buy treasury stock for inaugurating the stock option program,nonetheless net cash gain from excess of issuance over payment in long-term debt, amounted to 8.8billion yen.

8
Management PoliciesManagement PoliciesManagement PoliciesManagement Policies
1. Basic management policies and targeted management indices
The Company's goal is to grow continuously, both by developing its individual business units and byconsolidating its strength as a group. To achieve this goal, the Company's policy will be to create newtechnologies, new products and new markets in areas that improve communication, environmentalprotection and the quality of life. For the benefit of our shareholders and the greater KyoceraGroup, we are concentrating our efforts within these areas to create a valuable enterprise with apre-tax margin of at least 15%.
2. Specific management policies
(1) Efficient resource management① The Company will regularly review its operations to clarify which businesses to expand and which
to abolish. Resources will be allocated aggressively to business units which offer greatestshareholder value and best promote the Company’s future growth.
② Each business division shall adopt a unified decision-making structure and accelerate management decision making.
③ The Company will emphasize efficient cash flow in such areas as capital investment, inventory control and the reduction of lead times.
(2) Emphasizing consolidated results① The Company will pursue intra-group synergies by further reinforcing connections between its
major business divisions and their associated group companies.The Company will begin tomeasure profit on a consolidated product-line basis to improve results.
② The Company will structure development, production and sales systems at optimum locations worldwide to build a stronger global business system.
(3) Focusing on shareholder value① The Company will pursue increased shareholder value (as reflected in the Company’s market
capitalization and the share price of Kyocera stock) as an important management objective. Wewill make concentrated efforts to expand future profits and cash flow, and to improve our effectivereturn on equity.
② Kyocera will use a new incentive stock option program to align the interests of shareholders with those of Kyocera management and employees.
9
3. Basic policy relating to profit distribution
Since our original listing as a publicly traded company, Kyocera has worked to increase dividends pershare while improving the company’s performance. To reward our shareholders, Kyocera has issuedincreased dividends through stock splits or stock dividends. Kyocera intend to increase dividendsfurther by improving cash flow, with a dividend of 60 yen per share as the basis. Kyocera willdistribute the fruits of our performance upon making an overall judgment of the results.
At the same time, since the Company will continue to make aggressive strategic investments, we willmaintain sufficient cash to permit important investment opportunities to be seized as they arise.These investments will focus on fields in which the Company plans strategic business expansion.We are confident that this strategy to attain continuous growth will relate favorably to the interestsof our shareholders.
Upon shareholder approval at the general meeting of shareholders to be held June 29, 2000, theKyocera's dividend for the current period will be set at 30 yen per share. Together with the interimdividend already paid, the total dividend for the fiscal year ended March 31, 2000 will be 60 yen pershare, the same as last year.
10
Future Prospects and StrategiesFuture Prospects and StrategiesFuture Prospects and StrategiesFuture Prospects and Strategies
1. Prospects for the next fiscal yearAlthough currency exchange rates and other economic factors remain uncertain, the Japaneseeconomy is expected to continue a gradual recovery trend throughout the next fiscal year. Inaddition, worldwide demand for mobile phones and PCs is predicted to continue growing rapidly.
Under these circumstances, and on the premise that foreign currency rates will be US$1 = 102 yen,DM 1 = 51 yen, Kyocera expects consolidated sales for the fiscal year ending March 31, 2001 toincrease 35.4%, to 1.1 trillion yen, with pre-tax income increasing 35.4%, to 132 billion yen, and netincome will increasing 28.1%, to 64.5 billion yen.
Segment sales forecasts for the year ending March 31, 2001 are as follows:
(1) Ceramic and related products① Fine ceramic partsAs economic recovery extends to Japan’s manufacturing industries, the Company anticipates risingdemand for ceramic parts used in semiconductor fabrication equipment, liquid crystal displays,fiber-optic networks and general industrial applications.
② Semiconductor partsGlobal production of mobile phones will continue to increase, bringing greater demand for theCompany’s SMD packages. The expanding deployment of fiber-optic networks is also expected tobring additional demand for ceramic optical-device packages.
③ Electronic componentsThe Company will expand production and promote sales of high-capacity multilayer ceramic chipcapacitors, oscillator parts and module products for use in communication and informationequipment. We will make aggressive efforts to introduce new, miniaturized products of exceptionalperformance.
④ Cutting tools, jewelry, Bioceram, solar systems and applied ceramic productsWe will strive to expand sales of cutting tools by developing new markets and introducing newproducts. New efforts will also be made to expand sales of solar power generation systems forresidential use, and to increase sales of Bioceram products for medical and dental applications.
(2) Electronic equipment① Telecommunication equipmentWith the additional revenue of KWC, the Company expects a substantial increase in sales over thenext fiscal year. To increase revenues in Japan, Kyocera will begin sales of new products such asCDMA data communication terminals with wireless application protocol (WAP) capability. OutsideJapan, the Company will promote sales of PHS-related products to Asian markets and CDMAterminals to the United States and South Korea.

11
② Information equipmentWith the addition of Kyocera Mita Corporation, the Company expects a substantial increase inrevenue from this segment. To expand sales of copiers, printers and fax equipment, the Company willpursue joint development and marketing efforts with Kyocera Mita, integrating our respectiveproduction and sales operations.
(3) Optical InstrumentsThe Company will strive to expand sales of Contax brand cameras and high-resolution digitalcameras in Japan and other developed markets, while working to increase sales of compact camerasin other regions of the world.
On a non-consolidated basis, we expect sales for the year ending March 31, 2001 to increase 7.7%, to547 billion yen. Operating profits will increase 7.4%, to 59.1 billion yen; recurring profits willincrease 8.4%, to 75.3 billion yen; and net income will decrease 91.1%, to 3.5 billion yen due to anamortization of unrecognized net benefit obligation for employee retirement pan amounting to 69.3billion yen during the first half of fiscal 2001.
2. Future strategies
The Kyocera Group will work to create a components business, an equipment business and a servicenetwork business which will become leaders in markets that facilitate global telecommunications,protect the environment and enhance the quality of human life. Further, the company willreinforce its business operations in strategic areas by bringing in new resources from outside theKyocera Group, with an emphasis on Internet-related businesses.
In regard to the components business, the Kyocera Group (centered on Kyocera Corporation, AVX,and Kyocera Elco Corporation) will concentrate on expanding market share and improving profits bysupporting the mobile communication and optical communication markets. To reinforce overseasproduction, a new plant in Shanghai, China is preparing to begin production in October 2000.
In regard to the equipment business, sales from KWC and Kyocera Mita Corporation will be addedduring the next period, bringing a substantial increase in total revenue. With our purchase of theterrestrial wireless CDMA handset business of QUALCOMM Incorporated, we have gained a newposition as a major supplier of CDMA handsets in the United States, South Korea and Japan, whereCDMA services already have a firm foothold. We will develop this business globally using the so-called “Third Generation” mobile communication products and services.
In regard to Kyocera Mita Corporation, the fusion of Kyocera's printer business and Kyocera Mita'scopier machine business is expected to bring a synergistic effect in global development,manufacturing and sales.
In the service network business, we are developing markets with DDI, a communication carriercompany, and Kyocera Communication Systems Co., Ltd., which conducts content distributionservices for mobile communication terminals. This business structure will enable the Company tobenefit from the rapid expansion of Internet use in Japan as millions of consumers begin to demandwireless on-line services.
12
It must be reported that, on February 17, 2000, the Ministry of International Trade and Industrydetermined pursuant to the Law regarding Appropriation of Budgetary Subsidies, etc. that (i)certain of the Ministries decisions to provide subsidies to Kyocera will be cancelled and Kyocera willbe required to return subsidies received in connection with such cancelled decisions, (ii) execution ofany agreement with Kyocera involving provision of subsidies or consignment fees other thansubsidies will be suspended for a period from February 17, 2000 to February 16, 2003, and (iii)Kyocera will be excluded from nomination to participate in competitive bidding among nominatedparties conducted by the Ministry of International Trade and Industry for a period from February 17,2000 to November 16, 2003, due to Kyocera's "diversion of subsidies to purposes other than thoseprescribed", "use of property of a subsidized business for purposes other than those of the subsidies",and "violation of obligations to maintain books and records", etc. in connection with "Subsidies forDevelopment and Practical Use of New Power Generation Technologies (Non-Polluting SolarTechnology Power Generation System for Vehicles)" received by Kyocera for the fiscal years from1990 to 1994.
It also must be reported that, on March 30, 2000, the New Energy and Industrial TechnologyDevelopment Organization decided that (i) Kyocera must return consignment fees diverted topurposes other than the prescribed purposes, (ii) execution of a consignment contract with Kyoceraand the decision to provide subsidies to Kyocera shall be suspended for a period from March 30, 2000to March 29, 2003, and (iii) execution of any agreement with Kyocera relating to purchase and sale,contract, procurement of services or lease shall be suspended for a period from March 30, 2000 toDecember 29, 2000, because Kyocera was in violation of the standard terms and conditions of itsconsignment agreement with such Organization and diverted the consignment fee to purposes otherthan those of such consignment, etc. and, as a result, such Organization was required by theMinistry of International Trade and Industry to take appropriate action concomitant with the actiontaken by such Ministry.
The Company hereby expresses sincere apologies for causing trouble to the shareholders and societyand for the concerns arising from this series of occurrences. The Company will take thoroughmeasures to prevent any future repetition of such disgraceful events.
Forward Looking StatementsThe Company’s projections of sales and profits set forth in this document are based on a series ofprojections and estimates regarding the economies of Japan and various other countries, includingestimates and projections concerning the ceramics, semiconductor, electronic parts,telecommunications, information and optical equipment industries, with which the Company and itsgroup companies are related in their business activities, and the fluctuation in the exchange ratesbetween various currencies (particularly, between the Japanese yen and the United States dollar,Deutsche mark and Euro) and other factors, which are made based on the information available tothe Company as of the date of this document. These projections and estimates will be affected bymarket performance, the impact of competition, the introduction and success of new products andservices, and market conditions around the world for the information- and communication-relatedindustries, among other factors. Therefore, the reader should note that the actual results of salesand profits may vary significantly from the projected sales and profit as set forth in this document.
13
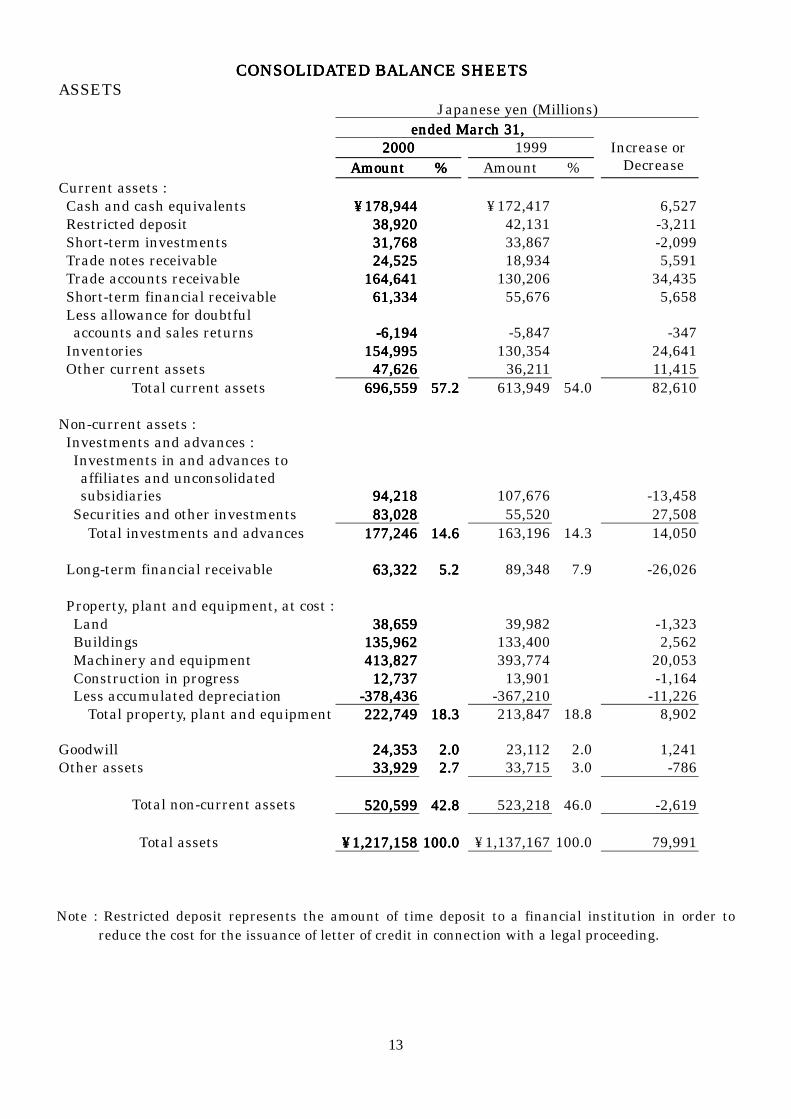
CONSOLIDATED BALANCE SHEETSCONSOLIDATED BALANCE SHEETSCONSOLIDATED BALANCE SHEETSCONSOLIDATED BALANCE SHEETSASSETS
Japanese yen (Millions)ended March 31,ended March 31,ended March 31,ended March 31,
2000200020002000 1999 AmountAmountAmountAmount %%%% Amount %
Increase or Decrease
Current assets : Cash and cash equivalents ¥178,944¥178,944¥178,944¥178,944 ¥172,417 6,527 Restricted deposit 38,92038,92038,92038,920 42,131 -3,211 Short-term investments 31,76831,76831,76831,768 33,867 -2,099 Trade notes receivable 24,52524,52524,52524,525 18,934 5,591 Trade accounts receivable 164,641164,641164,641164,641 130,206 34,435 Short-term financial receivable 61,33461,33461,33461,334 55,676 5,658 Less allowance for doubtful accounts and sales returns -6,194-6,194-6,194-6,194 -5,847 -347 Inventories 154,995154,995154,995154,995 130,354 24,641 Other current assets 47,62647,62647,62647,626 36,211 11,415
Total current assets 696,559696,559696,559696,559 57.257.257.257.2 613,949 54.0 82,610
Non-current assets : Investments and advances : Investments in and advances to affiliates and unconsolidated subsidiaries 94,21894,21894,21894,218 107,676 -13,458 Securities and other investments 83,02883,02883,02883,028 55,520 27,508 Total investments and advances 177,246177,246177,246177,246 14.614.614.614.6 163,196 14.3 14,050
Long-term financial receivable 63,32263,32263,32263,322 5.25.25.25.2 89,348 7.9 -26,026
Property, plant and equipment, at cost : Land 38,65938,65938,65938,659 39,982 -1,323 Buildings 135,962135,962135,962135,962 133,400 2,562 Machinery and equipment 413,827413,827413,827413,827 393,774 20,053 Construction in progress 12,73712,73712,73712,737 13,901 -1,164 Less accumulated depreciation -378,436-378,436-378,436-378,436 -367,210 -11,226 Total property, plant and equipment 222,749222,749222,749222,749 18.318.318.318.3 213,847 18.8 8,902
Goodwill 24,35324,35324,35324,353 2.02.02.02.0 23,112 2.0 1,241Other assets 33,92933,92933,92933,929 2.72.72.72.7 33,715 3.0 -786
Total non-current assets 520,599520,599520,599520,599 42.842.842.842.8 523,218 46.0 -2,619
Total assets ¥1,217,158¥1,217,158¥1,217,158¥1,217,158 100.0100.0100.0100.0 ¥1,137,167 100.0 79,991
Note : Restricted deposit represents the amount of time deposit to a financial institution in order toreduce the cost for the issuance of letter of credit in connection with a legal proceeding.

14
LIABILITIES AND STOCKHOLDERS’ EQUITYJapanese yen (Millions)
ended March 31,ended March 31,ended March 31,ended March 31,2000200020002000 1999
AmountAmountAmountAmount %%%% Amount %Increase orDecrease
Current liabilities : Short-term bank loans ¥93,604¥93,604¥93,604¥93,604 ¥77,192 16,412 Current portion of long-term debt 17,94417,94417,94417,944 18,658 -714 Trade notes and accounts payable 83,71883,71883,71883,718 64,730 18,988 Construction notes and other payable 36,66736,66736,66736,667 33,761 2,906 Accrued payroll and bonus 22,42922,42922,42922,429 18,779 3,650 Accrued income taxes 37,37237,37237,37237,372 16,391 20,981 Accrued expenses 16,57116,57116,57116,571 12,188 4,383 Other current liabilities 12,57812,57812,57812,578 9,522 3,056 Total current liabilities 320,883320,883320,883320,883 26.426.426.426.4 251,221 22.1 69,662
Non-current liabilities : Long-term debt 21,09021,09021,09021,090 36,103 -15,013 Accrued pension and severance costs 33,74033,74033,74033,740 41,208 -7,468 Long-term deferred taxes 568568568568 1,258 -690 Other non-current liabilities 6,9106,9106,9106,910 9,756 -2,846 Total non-current liabilities 62,30862,30862,30862,308 5.15.15.15.1 88,325 7.7 -26,017 Total liabilities 383,191383,191383,191383,191 31.531.531.531.5 339,546 29.8 43,645
Minority interests in subsidiaries 35,51735,51735,51735,517 2.92.92.92.9 28,128 2.5 7,389
Stockholders’ equity : Common stock 115,703115,703115,703115,703 115,703 0 Additional paid-in capital 157,768157,768157,768157,768 157,768 0 Legal reserve 16,05016,05016,05016,050 14,630 1,420 Retained earnings 553,560553,560553,560553,560 516,015 37,545 Accumulated other comprehensive income -35,518-35,518-35,518-35,518 -34,623 -895 Treasury stock -9,113-9,113-9,113-9,113 - -9,113 Total stockholders’ equity 798,450798,450798,450798,450 65.665.665.665.6 769,493 67.7 28,957
Total liabilities and stockholders’ equity ¥1,217,158¥1,217,158¥1,217,158¥1,217,158 100.0100.0100.0100.0 ¥1,137,167 100.0 79,991
Note : Accumulated other comprehensive incomeended March 31,ended March 31,ended March 31,ended March 31,
2000200020002000 1999Unrealized gain on securities, net 10,390 10,390 10,390 10,390 5,343Foreign currency transaction adjustments -45,908 -45,908 -45,908 -45,908 -32,740Minimum pension liability adjustments ---- -7,226
15
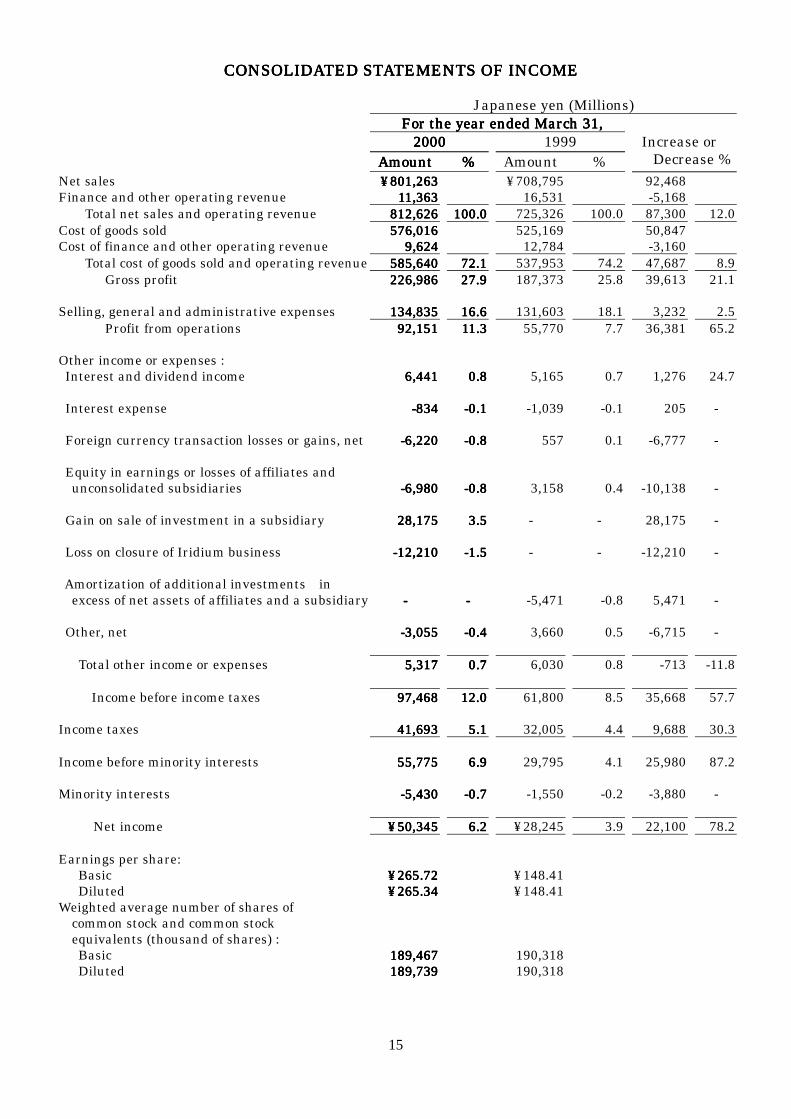
CONSOLIDATED STATEMENTS OF INCOMECONSOLIDATED STATEMENTS OF INCOMECONSOLIDATED STATEMENTS OF INCOMECONSOLIDATED STATEMENTS OF INCOME
Japanese yen (Millions)For the year ended March 31,For the year ended March 31,For the year ended March 31,For the year ended March 31,
2000200020002000 1999 AmountAmountAmountAmount %%%% Amount %
Increase or Decrease %
Net sales ¥801,263¥801,263¥801,263¥801,263 ¥708,795 92,468Finance and other operating revenue 11,36311,36311,36311,363 16,531 -5,168 Total net sales and operating revenue 812,626812,626812,626812,626 100.0100.0100.0100.0 725,326 100.0 87,300 12.0Cost of goods sold 576,016576,016576,016576,016 525,169 50,847Cost of finance and other operating revenue 9,6249,6249,6249,624 12,784 -3,160 Total cost of goods sold and operating revenue 585,640585,640585,640585,640 72.172.172.172.1 537,953 74.2 47,687 8.9 Gross profit 226,986226,986226,986226,986 27.927.927.927.9 187,373 25.8 39,613 21.1
Selling, general and administrative expenses 134,835134,835134,835134,835 16.616.616.616.6 131,603 18.1 3,232 2.5 Profit from operations 92,15192,15192,15192,151 11.311.311.311.3 55,770 7.7 36,381 65.2
Other income or expenses : Interest and dividend income 6,4416,4416,4416,441 0.80.80.80.8 5,165 0.7 1,276 24.7
Interest expense -834-834-834-834 -0.1-0.1-0.1-0.1 -1,039 -0.1 205 -
Foreign currency transaction losses or gains, net -6,220-6,220-6,220-6,220 -0.8-0.8-0.8-0.8 557 0.1 -6,777 - Equity in earnings or losses of affiliates and unconsolidated subsidiaries -6,980-6,980-6,980-6,980 -0.8-0.8-0.8-0.8 3,158 0.4 -10,138 -
Gain on sale of investment in a subsidiary 28,17528,17528,17528,175 3.53.53.53.5 - - 28,175 -
Loss on closure of Iridium business -12,210-12,210-12,210-12,210 -1.5-1.5-1.5-1.5 - - -12,210 -
Amortization of additional investments in excess of net assets of affiliates and a subsidiary ---- ---- -5,471 -0.8 5,471 -
Other, net -3,055-3,055-3,055-3,055 -0.4-0.4-0.4-0.4 3,660 0.5 -6,715 -
Total other income or expenses 5,3175,3175,3175,317 0.70.70.70.7 6,030 0.8 -713 -11.8
Income before income taxes 97,46897,46897,46897,468 12.012.012.012.0 61,800 8.5 35,668 57.7 Income taxes 41,69341,69341,69341,693 5.15.15.15.1 32,005 4.4 9,688 30.3
Income before minority interests 55,77555,77555,77555,775 6.96.96.96.9 29,795 4.1 25,980 87.2
Minority interests -5,430-5,430-5,430-5,430 -0.7-0.7-0.7-0.7 -1,550 -0.2 -3,880 -
Net income ¥50,345¥50,345¥50,345¥50,345 6.26.26.26.2 ¥28,245 3.9 22,100 78.2
Earnings per share: Basic Diluted
¥265.72¥265.72¥265.72¥265.72¥265.34¥265.34¥265.34¥265.34
¥148.41¥148.41
Weighted average number of shares of common stock and common stock equivalents (thousand of shares) : Basic Diluted
189,467189,467189,467189,467189,739189,739189,739189,739
190,318190,318
16
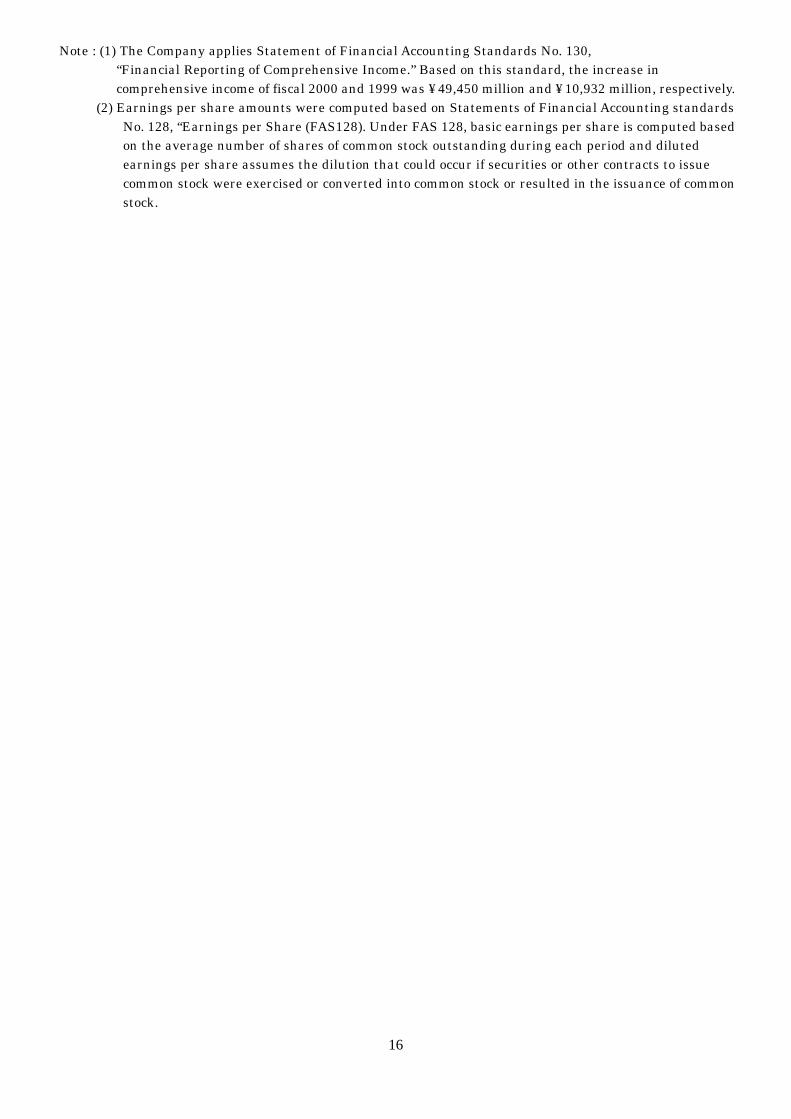
Note : (1) The Company applies Statement of Financial Accounting Standards No. 130,“Financial Reporting of Comprehensive Income.” Based on this standard, the increase incomprehensive income of fiscal 2000 and 1999 was ¥49,450 million and ¥10,932 million, respectively.
(2) Earnings per share amounts were computed based on Statements of Financial Accounting standardsNo. 128, “Earnings per Share (FAS128). Under FAS 128, basic earnings per share is computed basedon the average number of shares of common stock outstanding during each period and dilutedearnings per share assumes the dilution that could occur if securities or other contracts to issuecommon stock were exercised or converted into common stock or resulted in the issuance of commonstock.

17
Consolidated Statements of StockholdersConsolidated Statements of StockholdersConsolidated Statements of StockholdersConsolidated Statements of Stockholders’’’’ Equity Equity Equity Equity
( Yen in millions except number of shares in thousands)
Number of Shares Common Stock Commonstock
Treasurystock
Additionalpaid-inCapital
Legalreserve
Retainedearnings
Total Accumulateand Other
ComprehensiveIncome
ComprehensiveIncome
Balance, March 31, 1998 (190,318) 115,703 - 157,768 13,347 500,472 -17,310
Net income for the year 28,245 28,245
Accumulated and othercomprehensive income
-17,313 -17,313
Total comprehensive income forthe year 10,932
Cash dividends -11,419
Appropriation for legal reserve 1,283 -1,283
Balance, March 31, 1999 (190,318) 115,703 - 157,768 14,630 516,015 -34,623
Net income for the year 50,345 50,345
Accumulated and othercomprehensive income -895 -895
Total comprehensive income forthe year 49,450
Cash dividends -11,380
Appropriation for legal reserve 1,420 -1,420
Purchase of treasury stock (1,325) -9,714
Sales of treasury stock from excersise of stock option (82)
601
Balance, March 31, 2000 (189,075) 115,703 -9,113 157,768 16,050 553,560 -35,518

18
Consolidated Statements of Cash FlowsConsolidated Statements of Cash FlowsConsolidated Statements of Cash FlowsConsolidated Statements of Cash FlowsJapanese yen ( Millions)
For the year ended March 31, 2000 2000 2000 2000 1999
Cash flows from operating activities :Net income ¥50,345 ¥28,245Adjustments to reconcile net income to net cash
provided by operating activities :Depreciation and amortization 58,324 55,266Provision for doubtful accounts 9,274 6,845Losses on valuation of inventories 6,776 7,641Deferred income taxes -19,281 -4,592Minority interests 5,430 1,550Equity in earnings or losses of affiliates
and unconsolidated subsidiaries 6,980 -3,158 Gain on sale of investment in a subsidiary -28,175 - Amortization of additional investments in excess
of net assets of subsidiary and affiliates - 5,471Foreign currency adjustment 6,194 -386Changes in assets and liabilities :
Increase or decrease in trade receivables -38,706 30,324 Increase or decrease in inventories -20,451 9,744 Increase in other current assets -759 -4,298 Increase in notes and accounts payable 28,613 1,479 Increase or decrease in accrued income taxes 20,897 -9,610 Increase or decrease in other current liabilities 9,634 -1,205 Increase in other non-current liabilities 9.998 7,117 Other, net 2,819 -4,908 Net cash provided by operating activities 107,930 125,525Cash flows from investing activities :
Payments for purchases of available-for-sale securities
-60,205 -9,018
Payments for purchases of investments and advances
-959 -12,728
Sales and maturities of available-for-sale securities 49,533 86,335 Payments for purchase of property, plant and equipment -66,783 -64,341 Proceeds from sales of investment in a subsidiary 34,467 - Acquisition of businesses, net of cash acquired -30,556 -5,934 Payment for purchases of intangible assets -2,885 -6,587 Restricted cash -848 -41,010 Other, net 4,488 2,758 Net cash used in investing activities -73,748 50,525Cash flows from financing activities : Increase in short-term debt 16,997 3,781 Proceeds from issuance of long-term debt 20,454 14,418 Payments of long-term debt -35,567 -25,087 Dividends paid -12,198 -12,253 Purchase of treasury stock -9,714 - Other, net 161 99 Net cash used in financing activities -19,867 -19,042Effect of exchange rate changes on cash and cash equivalents -7,788 -5,059Net increase or decrease in cash equivalents 6,527 50,899Cash and cash equivalents at beginning of year 172,417 121,518Cash and cash equivalents at end of year ¥178,944 ¥172,417

19
SEGMENT INFORMATIONSEGMENT INFORMATIONSEGMENT INFORMATIONSEGMENT INFORMATION
1. Industry segment information : Japanese yen (Millions)2000200020002000 1999
AmountAmountAmountAmount AmountIncrease or
Decrease %Total net sales and operating revenue: Ceramic and related products ¥544,260¥544,260¥544,260¥544,260 ¥468,620 75,640 16.1 Electronic equipment 224,005224,005224,005224,005 206,751 17,254 8.3 Optical instruments 39,08239,08239,08239,082 38,978 104 0.3 Finance and other operating revenue 11,36311,36311,36311,363 16,531 -5,168 -31.3 Adjustments and eliminations -6,084-6,084-6,084-6,084 -5,554 -530 -
¥812,626¥812,626¥812,626¥812,626 ¥725,326 87,300 12.0Operating profit : Ceramic and related products ¥95,054¥95,054¥95,054¥95,054 ¥49,790 45,264 90.9 Electronic equipment 21,75321,75321,75321,753 24,506 -2,753 -11.2 Optical instruments 3,6803,6803,6803,680 1,207 2,473 204.9 Finance and other operating revenue -8,335-8,335-8,335-8,335 -2,010 -6,325 -
¥112,152¥112,152¥112,152¥112,152 ¥73,493 38,659 52.6
Corporate ¥-34,166¥-34,166¥-34,166¥-34,166 ¥-7,480 -26,686 -Equity in earnings -6,980-6,980-6,980-6,980 3,158 -10,138 -Gain on sales of investment in a subsidiary 28,17528,17528,17528,175 - 28,175 -Amortization of additional investments in excess of net assets of affiliates ---- -5,471 5,417 -Interest expense -834-834-834-834 -1,039 205 -Adjustments and eliminations -879-879-879-879 -861 -18 - Income before income taxes ¥97,468¥97,468¥97,468¥97,468 ¥61,800 35,668 57.7
Identifiable assets : Ceramic and related products ¥448,897¥448,897¥448,897¥448,897 ¥404,864 44,033 10.9 Electronic equipment 148,812148,812148,812148,812 103,034 45,778 44.4 Optical instruments 34,50434,50434,50434,504 34,375 129 0.4 Finance and other operating revenue 169,437169,437169,437169,437 179,202 -9,765 -5.4
801,650801,650801,650801,650 ¥721,475 80,175 11.1
Corporate ¥374,825¥374,825¥374,825¥374,825 ¥372,891 1,934 0.5Investments in and advances to affiliates and unconsolidated subsidiaries 94,21894,21894,21894,218 107,676 -13,458 -12.5Adjustments and eliminations -53,535-53,535-53,535-53,535 -64,875 11,340 - Total assets ¥1,217,158¥1,217,158¥1,217,158¥1,217,158 ¥1,137,167 79,991 7.0
Depreciation and amortization : Ceramic and related products ¥41,243¥41,243¥41,243¥41,243 ¥41,489 -246 -0.6 Electronic equipment 9,6379,6379,6379,637 8,117 1,520 18.7 Optical instruments 2,5012,5012,5012,501 2,234 267 12.0 Finance and other operating revenue 3,5013,5013,5013,501 2,001 1,500 75.0 Corporate 1,4601,4601,4601,460 1,425 35 2.5 Total ¥58,342¥58,342¥58,342¥58,342 ¥55,266 3,076 5.6
Capital expenditures : Ceramic and related products ¥53,580¥53,580¥53,580¥53,580 ¥42,235 11,345 26.9 Electronic equipment 6,5876,5876,5876,587 5,521 1,066 19.3 Optical instruments 1,4221,4221,4221,422 2,926 -1,504 -51.4 Finance and other operating revenue 1,2451,2451,2451,245 201 1,044 519.4 Corporate 1,8971,8971,8971,897 7,490 -5,593 -74.7 Total ¥64,731¥64,731¥64,731¥64,731 ¥58,373 6,358 10.9
20
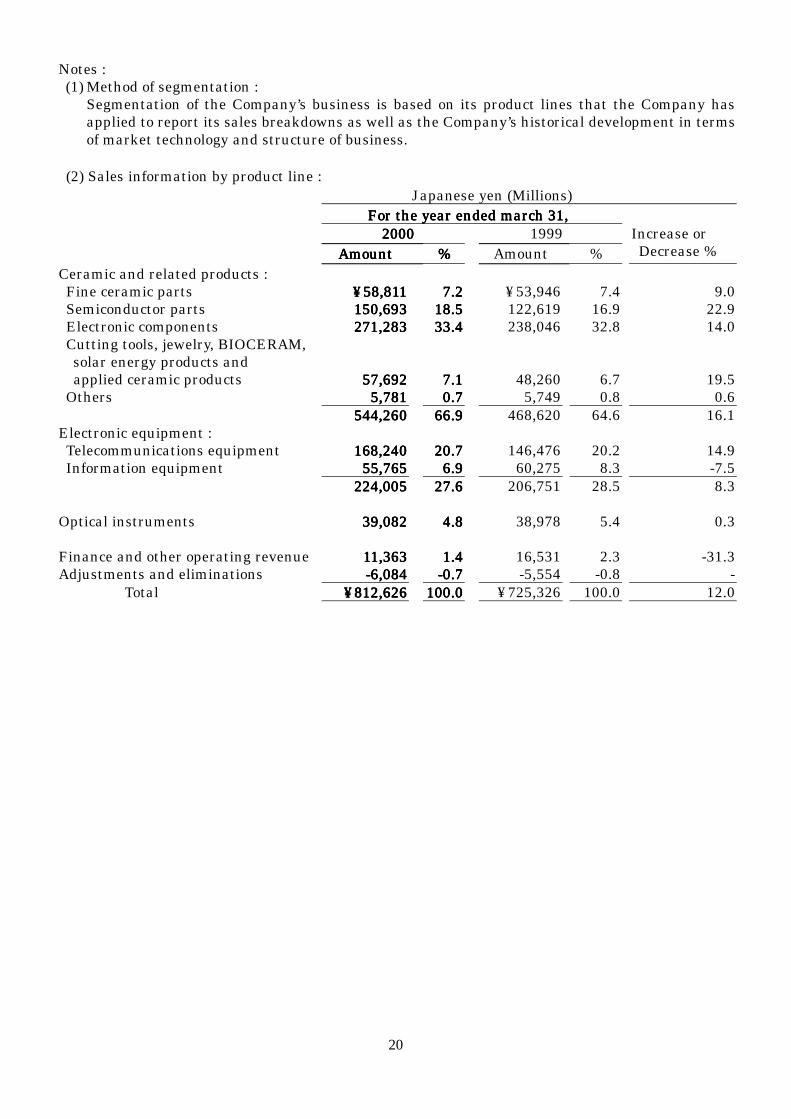
Notes :(1) Method of segmentation :
Segmentation of the Company’s business is based on its product lines that the Company hasapplied to report its sales breakdowns as well as the Company’s historical development in termsof market technology and structure of business.
(2) Sales information by product line : Japanese yen (Millions)
For the year ended march 31,For the year ended march 31,For the year ended march 31,For the year ended march 31, 2000 2000 2000 2000 1999
AmountAmountAmountAmount %%%% Amount %Increase or Decrease %
Ceramic and related products : Fine ceramic parts ¥58,811¥58,811¥58,811¥58,811 7.27.27.27.2 ¥53,946 7.4 9.0 Semiconductor parts 150,693150,693150,693150,693 18.518.518.518.5 122,619 16.9 22.9 Electronic components 271,283271,283271,283271,283 33.433.433.433.4 238,046 32.8 14.0 Cutting tools, jewelry, BIOCERAM, solar energy products and applied ceramic products 57,69257,69257,69257,692 7.17.17.17.1 48,260 6.7 19.5 Others 5,7815,7815,7815,781 0.70.70.70.7 5,749 0.8 0.6
544,260544,260544,260544,260 66.966.966.966.9 468,620 64.6 16.1Electronic equipment : Telecommunications equipment 168,240168,240168,240168,240 20.720.720.720.7 146,476 20.2 14.9 Information equipment 55,76555,76555,76555,765 6.96.96.96.9 60,275 8.3 -7.5
224,005224,005224,005224,005 27.627.627.627.6 206,751 28.5 8.3
Optical instruments 39,08239,08239,08239,082 4.84.84.84.8 38,978 5.4 0.3
Finance and other operating revenue 11,36311,36311,36311,363 1.41.41.41.4 16,531 2.3 -31.3Adjustments and eliminations -6,084-6,084-6,084-6,084 -0.7-0.7-0.7-0.7 -5,554 -0.8 - Total ¥812,626¥812,626¥812,626¥812,626 100.0100.0100.0100.0 ¥725,326 100.0 12.0

21
MAJOR PRODUCTS
Product lines Major products
Fine ceramic parts Parts for telecommunication equipment, Parts for audiovisual equipment, Parts for office automation equipment,Parts for home electronic equipment, Parts for semiconductorfabrication equipment, Parts for liquid crystal displaysfabrication equipment, Parts for fiber-optic communicationequipment, Automotive parts, Parts for general manufacturingindustry, Single crystal sapphire, Parts for gas turbine
Semiconductor parts Layer packages, Built-up packages, Cerdips, Thin-film packages,Metallized products, Lids, Packages for Surface Mount Devices,Packages for fiber-optic communication, Organic packages
Electronic components Chip capacitors, Chip resistors, Ceramic resonators, Filters,SAW (Surface Acoustic Wave) Devices, Quartz products, TCXO,VCO, Ceramic Circuit Board, Thermal printheads, AmorphousSilicon Drums, Liquid crystal displays, LED print head
Cutting tools, jewelry,BIOCERAM,Solar energy productsand applied ceramicproducts
Cutting tools, Wear parts, Dental and orthopedic implants,Dental materials, Medical equipment, Home and industrial usephtovoltaic generating systems, Home and industrial use solarsystem, Home use heat pump, Solar cells and modules, Solar-cell-applied equipment, Jewelry, Ceramic housings for watches,Ceramic knives, Ceramic scissors, Accessories, Tableware
Ceramic and
related products
Others Plastics for special applications, Bi-products
Telecommunications Equipment
Cellular handsets, PHS-related productsElectronicequipment Information
EquipmentPage printers
Optical instruments Single-lens reflex cameras, Compact cameras, Digital cameras,Applied optical equipment (Medical and surveillance cameras,etc.)
Finance and otheroperating revenue
Leasing, credit finance, real estate renting andOther services
2. Segment information by geographic areas :Japanese yen (Millions)
For the year ended March 31,For the year ended March 31,For the year ended March 31,For the year ended March 31,2000200020002000 1999
AmountAmountAmountAmount AmountIncrease orDecrease %
Japan ¥400,247¥400,247¥400,247¥400,247 49.349.349.349.3 ¥372,698 51.4 27,549 7.4
United States of America 148,927148,927148,927148,927 18.318.318.318.3 120,900 16.7 28,027 23.2
Europe 108,342108,342108,342108,342 13.313.313.313.3 110,689 15.2 -2,347 -2.1
Asia 131,650131,650131,650131,650 16.216.216.216.2 100,919 13.9 30,731 30.5
Others 23,46023,46023,46023,460 2.92.92.92.9 20,120 2.8 3,340 16.6
Consolidated net sales ¥812,626¥812,626¥812,626¥812,626 100.0100.0100.0100.0 ¥725,326 100.0 87,300 12.0
Sales outside Japan ¥412,379¥412,379¥412,379¥412,379 ¥352,628 59,751 16.9
Overseas sales ratio to consolidated net sales 50.7%50.7%50.7%50.7% 48.6%

22
INVESTMENTS IN DEBT AND EQUITY SECURITIES :INVESTMENTS IN DEBT AND EQUITY SECURITIES :INVESTMENTS IN DEBT AND EQUITY SECURITIES :INVESTMENTS IN DEBT AND EQUITY SECURITIES :
Available-for-sale securities are recorded at fair value, with unrealized gains and losses excluded fromincome and reported in other comprehensive income, net of tax. Held-to-maturity securities are recordedat amortized cost. Equity securities which do not have readily determinable fair value are recorded at cost.Investments in debt and equity securities at March 31, 2000 and 1999, included in short-terminvestments (current assets) and in securities and other investments (non-current assets) aresummarized as follows :
(Million yen)March 31,
2000 1999
Cost AggregateFair Value
GrossUnrealized
Gains
GrossUnrealized
LossesCost Aggregate
Fair Value
GrossUnrealized
Gains
GrossUnrealized
Losses
Available-for-sale securities :
Corporate debt securities 48,732 48,395 216 553 ¥27,956 ¥27,569 ¥108 ¥495
Equity securities 16,669 34,810 18,434 293 18,623 30,551 14,747 2,819
Other debt securities 20,185 20,295 111 1 21,758 20,299 72 1,531
Total available-for-sale securities 85,586 103,500 18,761 847 68,337 78,419 14,927 4,854
Held-to-maturity securities :
Corporate debt securities 7,000 7,035 35 14 7,000 7,065 65 -
Total held-to-maturity securities 7,000 7,035 35 14 7,000 7,065 65 -
Total investments in debt and equity securities 92,586 110,535 18,796 861 ¥75,337 ¥85,484 14,992 4,845
Note: Cost represents amortized cost for debt securities and acquisition cost for equity securities.

23
DERIVATIVE FINANCIAL INSTRUMENTSDERIVATIVE FINANCIAL INSTRUMENTSDERIVATIVE FINANCIAL INSTRUMENTSDERIVATIVE FINANCIAL INSTRUMENTS
Kyocera enters into foreign currency swap agreements to hedge certain assets and liabilitiesdenominated in foreign currencies. The aggregate contract amounts of the agreements were ¥1,331 and¥1,190 at March 31, 2000 and 1999, respectively. Foreign currency forward contracts are also used to hedge certain assets and liabilities denominated inforeign currencies. The aggregate contract amounts of the agreements for buying and selling were¥36,130 and ¥4,881 at March 31, 2000, and 41,990 and 8,804 at 1999, respectively. Interests swap and options agreements are used to reduce market risk exposures from fluctuation ininterest rates. The aggregate contract amounts of agreements were ¥112,716 and ¥101,716 at March 31,2000 and 1999, respectively. Metal delivery contracts were utilized by a foreign subsidiary to hedge market risks from fluctuation inmetal prices. The aggregates contract amounts of agreements were ¥620 at March 31, 2000. Although Kyocera may be exposed to losses in the event of non-performance by counterparties orcurrency rate movements, it does not anticipate significant losses from the agreements described above.
The fair value of financial instruments and the methods and assumptions used to estimate the fair valuewere as follows :
(Million yen)March 31,
2000 1999CarryingAmount
Fair ValueCarryingAmount
Fair Value
Currency swaps (a) -22 -2 -69 -69
Foreign currency forward contracts (a) -817 385 -309 44
Interest swaps and options (a) 194 -600 330 -1,080
Metal delivery contracts (b) - -50 - -
(a) The fair value was estimated based on quotes from financial institutions.(b) The fair value was based on quoted market prices.

24
Basis of Basis of Basis of Basis of preparationpreparationpreparationpreparation of this financial statement of this financial statement of this financial statement of this financial statement
1. Scope of consolidation and application of the equity method :
Major consolidated subsidiaries : AVX CORPORATION, KYOCERA AMERICA, INC., KYOCERA ELCO CORPORATION
Major unconsolidated subsidiaries applied for equity method:KYOCERA INTERNATIONAL COMPANY
Major affiliates applied for equity method:DDI CORPORATION which has its own subsidiariessuch as KANSAI CELLULAR CO., LTD.,DDI POCKET TELEPHONE INC.,
TAITO CORPORATION, KINSEKI, LTD.
2. Changes in scope of consolidation and application of the equity method :
Consolidation Equity method
Increase 8 companies 2 companies
Decrease 0 company 8 companies

26
KYOCERA CORPORATIONKYOCERA CORPORATIONKYOCERA CORPORATIONKYOCERA CORPORATION
1. Date of the board of directors’ meeting concerning the financial statements : May 17, 20002. Date of the general meeting of shareholders : June 29, 20003. Results for the year ended March 31, 2000 (From April 1, 1999 through March 31, 2000)(1) Operational results :
Japanese yen (Millions, except per share amounts) Year ended March 31,Year ended March 31,Year ended March 31,Year ended March 31,
2000200020002000 1999
Net sales ¥¥¥¥507507507507,,,,802802802802 ¥453,595 % change from the previous year 12.0% 12.0% 12.0% 12.0% -7.8% Profit from operations 55,01355,01355,01355,013 37,690 % change from the previous year 46.046.046.046.0%%%% -35.4%
Recurring profit 69,47169,47169,47169,471 52,009 % change from the previous year 33.6%33.6%33.6%33.6% -28.4% Net income 39,29639,29639,29639,296 27,738 % change from the previous year 41.741.741.741.7%%%% -24.2%
Earnings per share ¥¥¥¥206.48206.48206.48206.48 ¥145.75
Return on equity 5.4% 5.4% 5.4% 5.4% 4.0% Recurring profit to total assets 8.1% 8.1% 8.1% 8.1% 6.4% Recurring profit to net sales 13.7% 13.7% 13.7% 13.7% 11.5%
Notes : 1. Average number of shares outstanding during the year :
2000200020002000 1999 111190909090,,,,318,300318,300318,300318,300 190,318,300
2. Change in accounting policies : See to “Summary of major accounting policies”.
(2) Dividend information : Japanese yen
Year ended March 31,Year ended March 31,Year ended March 31,Year ended March 31,2000200020002000 1999
Year-end dividends per share ¥30.00¥30.00¥30.00¥30.00 ¥30.00 Interim dividends per share ¥30.00¥30.00¥30.00¥30.00 ¥30.00 Annual dividends per share ¥¥¥¥66660.000.000.000.00 ¥60.00 Annual aggregate amount of dividends paid ¥11,341 million¥11,341 million¥11,341 million¥11,341 million ¥11,419 million Payout ratio 28.9%28.9%28.9%28.9% 41.2% Dividends to stockholders’ equity 1.5% 1.5% 1.5% 1.5% 1.6%
27
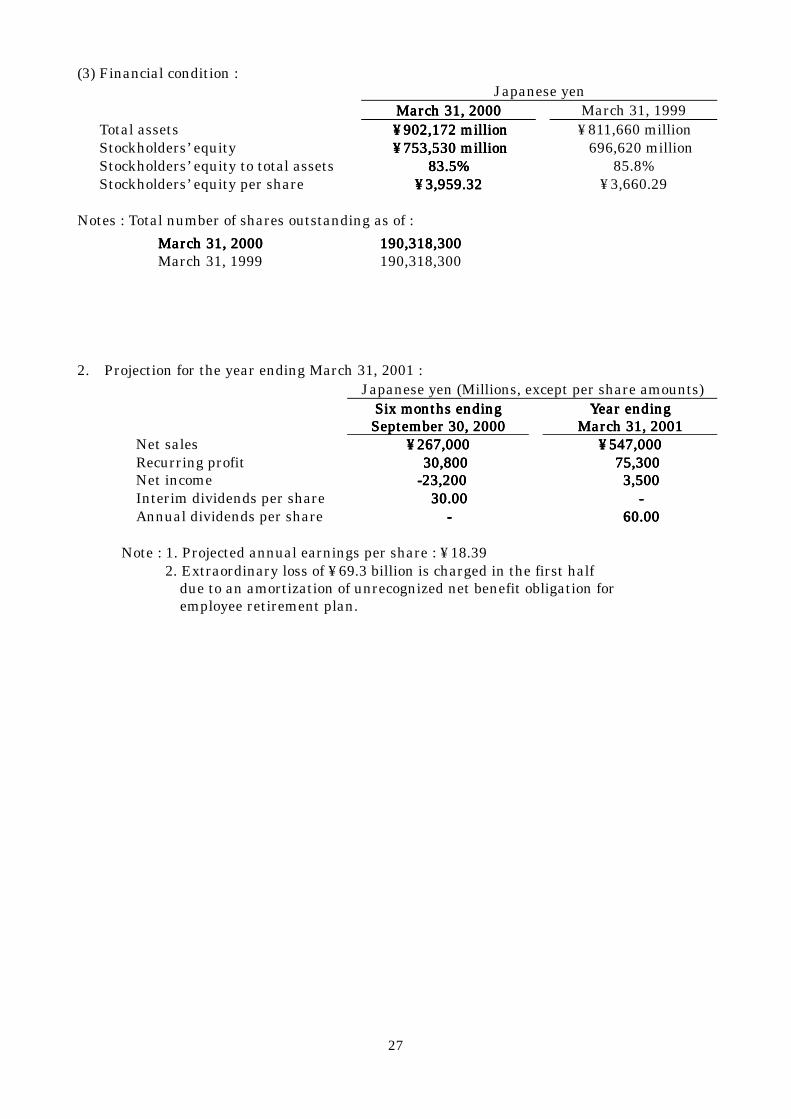
(3) Financial condition : Japanese yen
March 31, March 31, March 31, March 31, 2000200020002000 March 31, 1999 Total assets ¥¥¥¥902,172 million902,172 million902,172 million902,172 million ¥811,660 million Stockholders’ equity ¥753,530 million¥753,530 million¥753,530 million¥753,530 million 696,620 million Stockholders’ equity to total assets 88883.53.53.53.5%%%% 85.8% Stockholders’ equity per share ¥3,¥3,¥3,¥3,959.32959.32959.32959.32 ¥3,660.29
Notes : Total number of shares outstanding as of :
March 31, 2000March 31, 2000March 31, 2000March 31, 2000 190,318190,318190,318190,318,300,300,300,300 March 31, 1999 190,318,300
2. Projection for the year ending March 31, 2001 : Japanese yen (Millions, except per share amounts)
Six months endingSix months endingSix months endingSix months endingSeptember 30, 2000September 30, 2000September 30, 2000September 30, 2000
Year endingYear endingYear endingYear endingMarch 31, 2001March 31, 2001March 31, 2001March 31, 2001
Net sales ¥267,000¥267,000¥267,000¥267,000 ¥547,000¥547,000¥547,000¥547,000 Recurring profit 30,800 30,800 30,800 30,800 75,30075,30075,30075,300 Net income -23,200 -23,200 -23,200 -23,200 3,5003,5003,5003,500 Interim dividends per share 30.0030.0030.0030.00 ---- Annual dividends per share - - - - 60.00 60.00 60.00 60.00
Note : 1. Projected annual earnings per share : ¥18.39 2. Extraordinary loss of ¥69.3 billion is charged in the first half due to an amortization of unrecognized net benefit obligation for employee retirement plan.

28
BALANCE SHEETSBALANCE SHEETSBALANCE SHEETSBALANCE SHEETSASSETS
Japanese yen (Millions)as of March 31,as of March 31,as of March 31,as of March 31,
2000200020002000 1999 AmountAmountAmountAmount %%%% Amount %
Increase or Decrease
Current assets : Cash and bank deposits ¥59,529 ¥108,494 -48,964 Trade notes receivable 53,192 41,933 11,258 Trade accounts receivable 93,251 82,552 10,699 Marketable securities 105,704 69,309 36,395 Treasury stock 113 4 109 Finished goods and purchased merchandise 23,185 31,457 -8,272 Raw materials 22,161 16,783 5,378 Work in process 22,648 17,617 5,030 Supplies 1,222 1,641 -418 Deferred income taxes 24,369 - 24,369 Short-term loans 13,245 37,116 -23,871 Other accounts receivable 4,272 2,268 2,003 Other current assets 1,215 1,135 79 Allowance for doubtful accounts -779 -1,014 235
Total current assets 423,331 46.9 409,299 50.4 14,031
Fixed assets : Tangible fixed assets : Buildings 43,950 46,217 -2,266 Structures 2,650 2,890 -239 Machinery and equipment 50,651 41,418 9,232 Vehicles 62 56 5 Tools, furniture and fixtures 9,015 9,977 -961 Land 28,374 26,791 1,583 Construction in progress 1,623 6,249 -4,626 Total tangible fixed assets 136,327 15.1 133,600 16.5 2,727 Intangible assets : Patent rights and others 3,973 3,583 390 Total intangible assets 3,973 0.5 3,583 0.4 390 Investments and other assets : Investments in securities 124,592 107,192 17,399 Investments in subsidiaries 135,129 110,238 24,891
Equity investments(other than shares) in subsidiaries 8,977 7,429 1,548
Long-term loans 34,340 31,227 3,113 Long-term prepaid expenses 3,884 5,952 -2,067 Deferred income taxes 18,882 - 18,882 Treasury stock 9,113 - 9,113 Other investments 11,089 4,986 6,102 Allowances for doubtful accounts -7,470 -1,849 -5,621
Total investments and other assets 338,539 37.5 265,177 32.7 73,362
Total fixed assets 478,841 53.1 402,361 49.6 76,480
TOTAL ¥902,172 100.0 ¥811,660 100.0 90,512
Note : Software costs previously reported as “long-term prepaid expenses” have been reclassified to intangible assets on the balance sheet.
29
LIABILITIES Japanese yen (Millions)as of March 31,as of March 31,as of March 31,as of March 31,
2000200020002000 1999 AmountAmountAmountAmount %%%% Amount %
Increase or Decrease
Current liabilities : Trade notes payable ¥5,034 ¥8,520 -3,486 Trade accounts payable 51,658 42,419 9,238 Other payables 42,181 26,392 15,788 Accrued income taxes and enterprise taxes 26,600 11,200 15,400 Accrued expenses 6,890 6,182 708 Deposits received 2,393 1,914 479 Reserve for employees’ bonuses 10,700 10,700 -
Reserve for product warranty 586 767 -180 Reserve for losses on sales returns 234 265 -31 Notes payable for the purchase of equipment 502 4,985 -4,483 Other current liabilities 254 47 207 Total current liabilities 147,035 16.3 113,394 14.0 33,641 Fixed liabilities : Reserve for directors’ retirement expenses 1,264 1,310 -46 Other fixed liabilities 343 335 7 Total fixed liabilities 1,607 0.2 1,645 0.2 -38 Total liabilities 148,642 16.5 115,039 14.2 33,602
STOCKHOLDERS’ EQUITY
Common stock 115,703 12.8 115,703 14.2 -
Legal reserves : Capital surplus Paid-in surplus 173,744 173,744 -
Surplus from merger 742 742 -
Total capital surplus 174,487 174,487 -
Legal revenue reserves 15,439 14,272 1,166 Total legal reserves 189,926 21.1 188,759 23.3 1,166 Retained earnings: Reserve for special depreciation 3,282 5,615 -2,333 Reserve for research and development 1,000 1,000 -
Reserve for dividends 1,000 1,000 -
Reserve for retirement benefits 300 300 -
Reserve for overseas investments 1,000 1,000 -
General reserve 369,828 354,828 15,000 Unappropriated retained earnings 71,489 28,413 43,075 Total retained earnings 447,900 49.6 392,157 48.3 55,742 Total stockholders’ equity 753,530 83.5 696,620 85.8 56,909 TOTAL ¥902,172 100.0 ¥811,660 100.0 90,512

30
STATEMENTS OF INCOMESTATEMENTS OF INCOMESTATEMENTS OF INCOMESTATEMENTS OF INCOME
Japanese yen (Millions)For the year ended March 31,For the year ended March 31,For the year ended March 31,For the year ended March 31,
2000200020002000 1999 AmountAmountAmountAmount %%%% Amount %
Increase or Decrease %
Recurring profit and loss : Operating income and expenses : Net sales ¥507,802¥507,802¥507,802¥507,802 100.0100.0100.0100.0 ¥453,595 100.0 54,207 12.0 Cost of sales 379,283379,283379,283379,283 74.774.774.774.7 339,786 74.9 39,497 11.6 Selling, general and administrative expenses 73,50573,50573,50573,505 14.514.514.514.5 76,119 16.8 -2,613 -3.4 Profit from operations 55,10355,10355,10355,103 10.810.810.810.8 37,690 8.3 17,323 46.0
Non-operating income and expenses : Non-operating income : Interest and dividend income 14,22014,22014,22014,220 2.82.82.82.8 14,816 3.3 -595 -4.0 Gain from fluctuations of foreign exchange rates - - 298 0.1 -298 -
Other non-operating income 7,6527,6527,6527,652 1.51.51.51.5 3,814 0.8 3,837 100.6 Total non-operating income 21,87221,87221,87221,872 4.34.34.34.3 18,928 4.2 2,943 15.6
Non-operating expenses : Interest expense 25252525 0.00.00.00.0 19 0.0 6 33.7 Loss from fluctuations of foreign exchange rates 4,5544,5544,5544,554 0.90.90.90.9 - - 4,554 -
Other non-operating expenses 2,8342,8342,8342,834 0.50.50.50.5 4,590 1.0 -1,756 -38.3 Total non-operating expenses 7,4147,4147,4147,414 1.41.41.41.4 4,609 1.0 2,804 60.9 Recurring profit 69,47169,47169,47169,471 13.713.713.713.7 52,009 11.5 17,462 33.6
Extraordinary profit and loss : Extraordinary profit 35,35135,35135,35135,351 6.96.96.96.9 138 0.0 35,213 -
Extraordinary loss 38,68238,68238,68238,682 7.67.67.67.6 292 0.1 38,390 -
Income before income taxes 66,14066,14066,14066,140 13.013.013.013.0 51,855 11.4 14,285 27.5Income taxes and enterprise taxes 41,00341,00341,00341,003 8.18.18.18.1 24,117 5.3 16,885 70.0Income taxes adjustment -14,159-14,159-14,159-14,159 -2.8-2.8-2.8-2.8 - - -14,159 -
Net income 39,29639,29639,29639,296 7.77.77.77.7 ¥27,738 6.1 11,558 41.7
Unappropriated retained earnings brought forward from the previous year 6,9616,9616,9616,961 6,956Cumulative effect on prior years of a change in accounting for income taxes 29,09229,09229,09229,092 -
Reversal of special depreciation reserve due to adoption of accounting for deferred taxes 2,3762,3762,3762,376 -
Interim dividends 5,669 5,669 5,669 5,669 5,709Amount appropriated for reserve in respect of interim dividends 566566566566 570Unappropriated retained earnings at the end of the year ¥71,489¥71,489¥71,489¥71,489 ¥28,413Note : In this fiscal year, Kyocera adopted accounting for deferred tax. As a result of the adoption of
the new accounting method, net income and retained earnings increased by ¥14,159 millionand by ¥45,627 million, respectively.

31
PROPOSED APPROPRIATION OF RETAINED EARNINGSPROPOSED APPROPRIATION OF RETAINED EARNINGSPROPOSED APPROPRIATION OF RETAINED EARNINGSPROPOSED APPROPRIATION OF RETAINED EARNINGS
Japanese yen (Millions)For the year ended March 31,For the year ended March 31,For the year ended March 31,For the year ended March 31,
2000200020002000 1999
Increase or Decrease
Unappropriated retained earnings ¥71,489¥71,489¥71,489¥71,489 ¥28,413 43,075Reversal of reserves : Reversal of reserve for special depreciation 729729729729 1,257 -528 Total ¥72,218¥72,218¥72,218¥72,218 ¥29,671 42,547
To be appropriated as follows : Legal reserves 600600600600 600 -
Dividends (30 yen per share) 5,6715,6715,6715,671 5,709 -37
Officers’ bonuses (Note) 100100100100 100 -
Reserve for special depreciation 986986986986 1,300 -314
General reserve 35,00035,00035,00035,000 15,000 20,000
Unappropriated retained earnings Carried forward to the next year 29,86029,86029,86029,860 6,961 22,899
Note : Statutory auditors‘ bonuses of 3 million yen and 2 million yen are included in officers’bonuses in 2000 and 1999, respectively.

32
1. Summary of major accounting policies :
(1) Valuation of securities :Marketable securities are stated at the lower of cost or market. Cost is determined by themoving average method. Other securities are stated at cost determined by the movingaverage method.
(2) Valuation of inventories:
Finished good, merchandise, and work in process:Finished goods and work in process are stated at the lower of cost or market, the cost beingdetermined by the retail inventory method. Merchandise are stated at the lower of cost ormarket, the cost being determined by last purchase method.
Raw materials, Supplies:Row materials and supplies are valued at last purchase prices, except that raw materialsfor telecommunications equipment and information equipment are valued at cost beingdetermined by the first-in, first-out method.
(3) Depreciation of fixed assets :Tangible fixed assets : The declining balance method.Intangible assets : The straight-line method.
(4) Accounting for allowance and accrualAllowance for doubtful accounts :
Allowance for doubtful accounts are provided at an estimated amount of probable baddebts in addition to the maximum deductible limit established by the Japanese corporateincome tax law.
Accrued employees‘ bonuses :Accrued employees’ bonuses are provided based upon the amounts expected to be paidwhich is determined by actual payment of preceeding year.
(5) Lease transactions :Finance lease other than those which are deemed to transfer the ownership of leasedassets to lessees are accounted for by the method similar to that applicable to anordinary operating lease.
(6) In this fiscal year, the Company changed its accounting method of prior service costs for theemployee pension fund. Prior service cost had been recognized at the time of actual paymentsin previous years. Under the new method, those costs were recognized when incurred. Thischange was made to provide appropriate recognition of prior service costs and to enhancefinancial stability of the Company resulting from comprehensive review of its pension planunder current market condition of plan assets and increase in unamortized prior service cost.The impact of this change was to decrease income before income taxes by JPY 4,335 million.
(7) Consumption taxes are separately identified from each transaction.
33
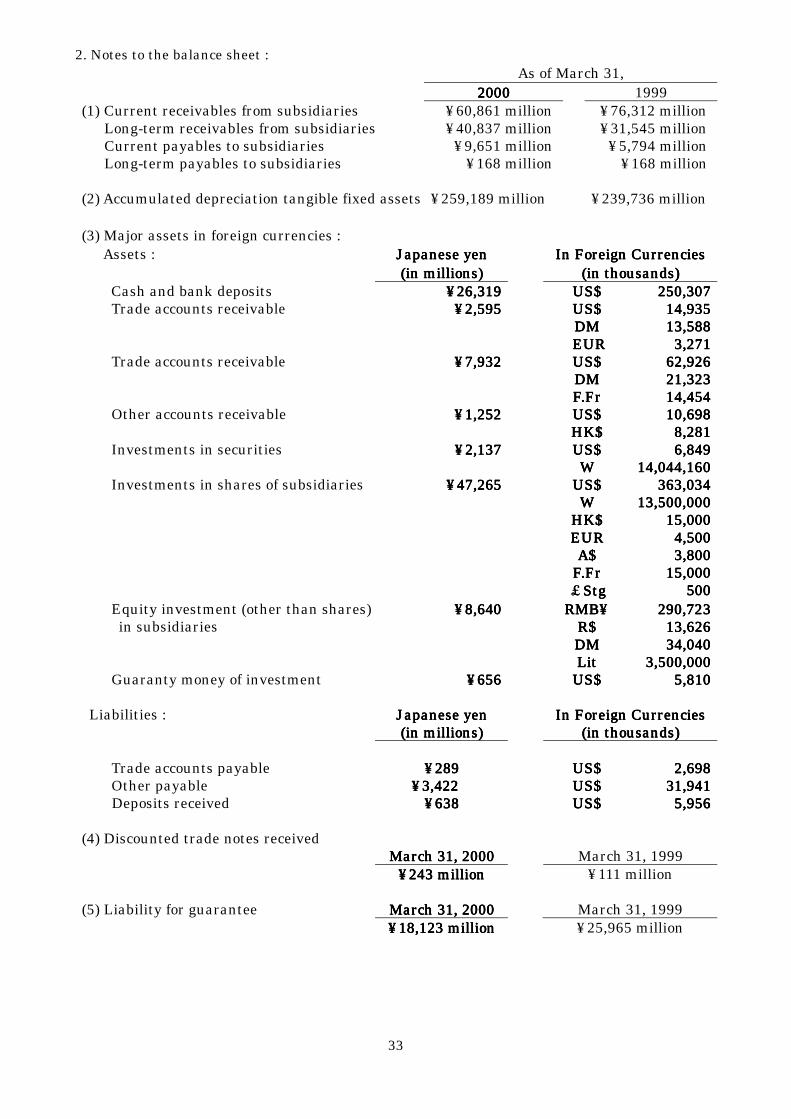
2. Notes to the balance sheet :As of March 31,
2000200020002000 1999(1) Current receivables from subsidiaries ¥60,861 million ¥76,312 million
Long-term receivables from subsidiaries ¥40,837 million ¥31,545 million Current payables to subsidiaries ¥9,651 million ¥5,794 million Long-term payables to subsidiaries ¥168 million ¥168 million
(2) Accumulated depreciation tangible fixed assets ¥259,189 million ¥239,736 million
(3) Major assets in foreign currencies : Assets : Japanese yenJapanese yenJapanese yenJapanese yen In Foreign CurrenciesIn Foreign CurrenciesIn Foreign CurrenciesIn Foreign Currencies
(in millions)(in millions)(in millions)(in millions) (in thousands)(in thousands)(in thousands)(in thousands) Cash and bank deposits ¥26,319 ¥26,319 ¥26,319 ¥26,319 US$US$US$US$ 250,307250,307250,307250,307
Trade accounts receivable ¥2,595¥2,595¥2,595¥2,595 US$US$US$US$ 14,93514,93514,93514,935DMDMDMDM 13,58813,58813,58813,588
EUR EUR EUR EUR 3,2713,2713,2713,271 Trade accounts receivable ¥7,932¥7,932¥7,932¥7,932 US$US$US$US$ 62,92662,92662,92662,926
DMDMDMDM 21,32321,32321,32321,323F.FrF.FrF.FrF.Fr 14,45414,45414,45414,454
Other accounts receivable ¥1,252 ¥1,252 ¥1,252 ¥1,252 US$ US$ US$ US$ 10,69810,69810,69810,698HK$HK$HK$HK$ 8,2818,2818,2818,281
Investments in securities ¥2,137 ¥2,137 ¥2,137 ¥2,137 US$ US$ US$ US$ 6,8496,8496,8496,849WWWW 14,044,16014,044,16014,044,16014,044,160
Investments in shares of subsidiaries ¥47,265 ¥47,265 ¥47,265 ¥47,265 US$US$US$US$ 363,034363,034363,034363,034WWWW 13,500,00013,500,00013,500,00013,500,000
HK$HK$HK$HK$ 15,00015,00015,00015,000EUREUREUREUR 4,5004,5004,5004,500A$A$A$A$ 3,8003,8003,8003,800
F.FrF.FrF.FrF.Fr 15,00015,00015,00015,000££££StgStgStgStg 500500500500
Equity investment (other than shares) ¥8,640 ¥8,640 ¥8,640 ¥8,640 RMB¥RMB¥RMB¥RMB¥ 290,723290,723290,723290,723 in subsidiaries R$R$R$R$ 13,62613,62613,62613,626
DMDMDMDM 34,04034,04034,04034,040LitLitLitLit 3,500,0003,500,0003,500,0003,500,000
Guaranty money of investment ¥656¥656¥656¥656 US$ US$ US$ US$ 5,8105,8105,8105,810
Liabilities : Japanese yenJapanese yenJapanese yenJapanese yen In Foreign CurrenciesIn Foreign CurrenciesIn Foreign CurrenciesIn Foreign Currencies(in millions)(in millions)(in millions)(in millions) (in thousands)(in thousands)(in thousands)(in thousands)
Trade accounts payable ¥289¥289¥289¥289 US$ US$ US$ US$ 2,6982,6982,6982,698 Other payable ¥3,422 ¥3,422 ¥3,422 ¥3,422 US$ US$ US$ US$ 31,94131,94131,94131,941
Deposits received ¥638¥638¥638¥638 US$ US$ US$ US$ 5,9565,9565,9565,956
(4) Discounted trade notes receivedMarch 31, 2000March 31, 2000March 31, 2000March 31, 2000 March 31, 1999
¥243 million¥243 million¥243 million¥243 million ¥111 million
March 31, 2000March 31, 2000March 31, 2000March 31, 2000 March 31, 1999(5) Liability for guarantee¥18,123 million¥18,123 million¥18,123 million¥18,123 million ¥25,965 million
34
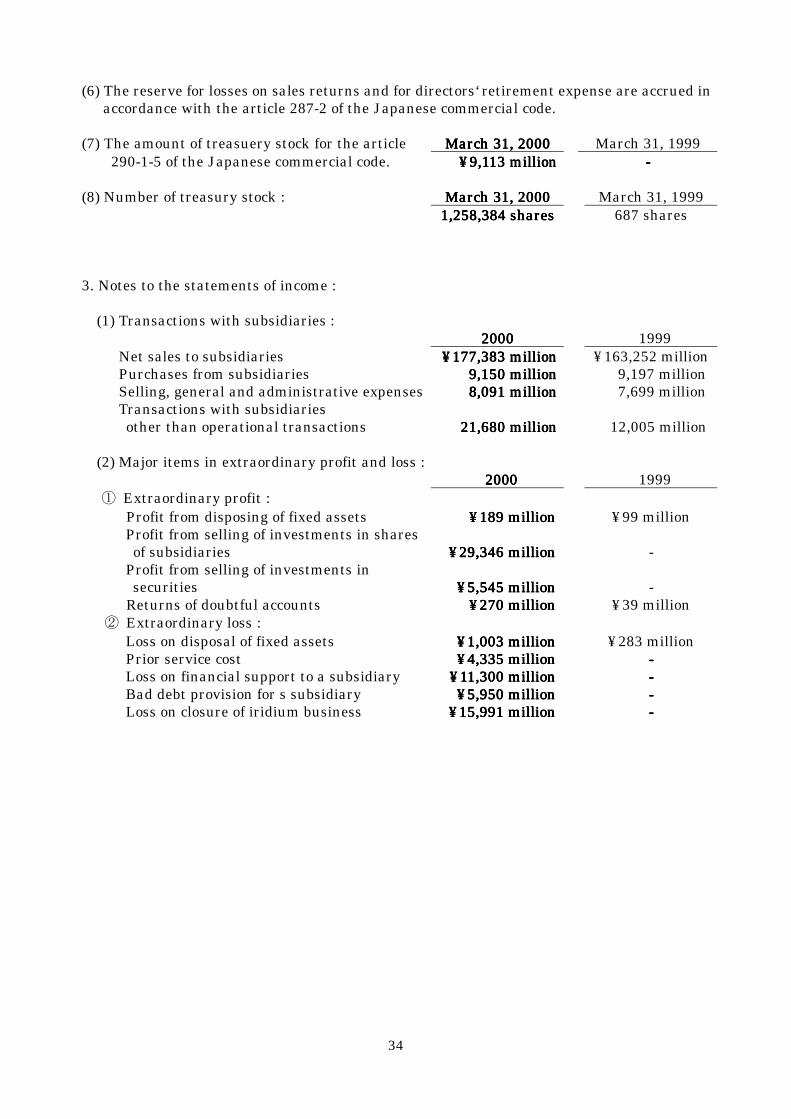
(6) The reserve for losses on sales returns and for directors‘ retirement expense are accrued inaccordance with the article 287-2 of the Japanese commercial code.
(7) The amount of treasuery stock for the article March 31, 2000March 31, 2000March 31, 2000March 31, 2000 March 31, 1999 290-1-5 of the Japanese commercial code. ¥9,113 million¥9,113 million¥9,113 million¥9,113 million ----
(8) Number of treasury stock : March 31, 2000March 31, 2000March 31, 2000March 31, 2000 March 31, 19991,258,384 shares1,258,384 shares1,258,384 shares1,258,384 shares 687 shares
3. Notes to the statements of income :
(1) Transactions with subsidiaries : 2000200020002000 1999 Net sales to subsidiaries ¥177,383 million¥177,383 million¥177,383 million¥177,383 million ¥163,252 million Purchases from subsidiaries 9,150 million 9,150 million 9,150 million 9,150 million 9,197 million Selling, general and administrative expenses 8,091 million 8,091 million 8,091 million 8,091 million 7,699 million Transactions with subsidiaries other than operational transactions 21,680 million21,680 million21,680 million21,680 million 12,005 million
(2) Major items in extraordinary profit and loss : 2000 2000 2000 2000 1999
① Extraordinary profit : Profit from disposing of fixed assets ¥189 million ¥189 million ¥189 million ¥189 million ¥99 million
Profit from selling of investments in shares of subsidiaries ¥29,346 million¥29,346 million¥29,346 million¥29,346 million - Profit from selling of investments in securities ¥5,545 million ¥5,545 million ¥5,545 million ¥5,545 million -
Returns of doubtful accounts ¥270 million¥270 million¥270 million¥270 million ¥39 million ② Extraordinary loss :
Loss on disposal of fixed assets ¥1,003 million¥1,003 million¥1,003 million¥1,003 million ¥283 million Prior service cost ¥4,335 million ¥4,335 million ¥4,335 million ¥4,335 million ---- Loss on financial support to a subsidiary ¥11,300 million¥11,300 million¥11,300 million¥11,300 million ---- Bad debt provision for s subsidiary ¥5,950 million ¥5,950 million ¥5,950 million ¥5,950 million ---- Loss on closure of iridium business ¥15,991 million¥15,991 million¥15,991 million¥15,991 million ----

35
4. Notes for lease transaction :
Future lease payments at the latest balance sheet date :Japanese yen (Millions)
2000200020002000 1999(1) Leased property costs, accumulated
depreciation and balance of leased property
Cost 5,5515,5515,5515,551 5,482 Accumulated depreciation 3,4543,4543,4543,454 3,379 Net balance of leased property 2,0972,0972,0972,097 2,102
(2) Future lease payment at the latest balancesheet date
Due within one year 983 983 983 983 955 Due after one year 1,1891,1891,1891,189 1,206 Total 2,1722,1722,1722,172 2,162
(3) Lease payment, depreciation and interests Japanese yen (Millions)Japanese yen (Millions)Japanese yen (Millions)Japanese yen (Millions)2000200020002000 1999
Lease payments 1,2601,2601,2601,260 1,277 Depreciation 1,1521,1521,1521,152 1,162 Interests 111 111 111 111 109
(4) Calculation of depreciation : Using straight-line method.
(5) Calculation of interests Using sum of digits method applying to the difference between total lease payments and
estimated cost (fair market value) of leased property.
36
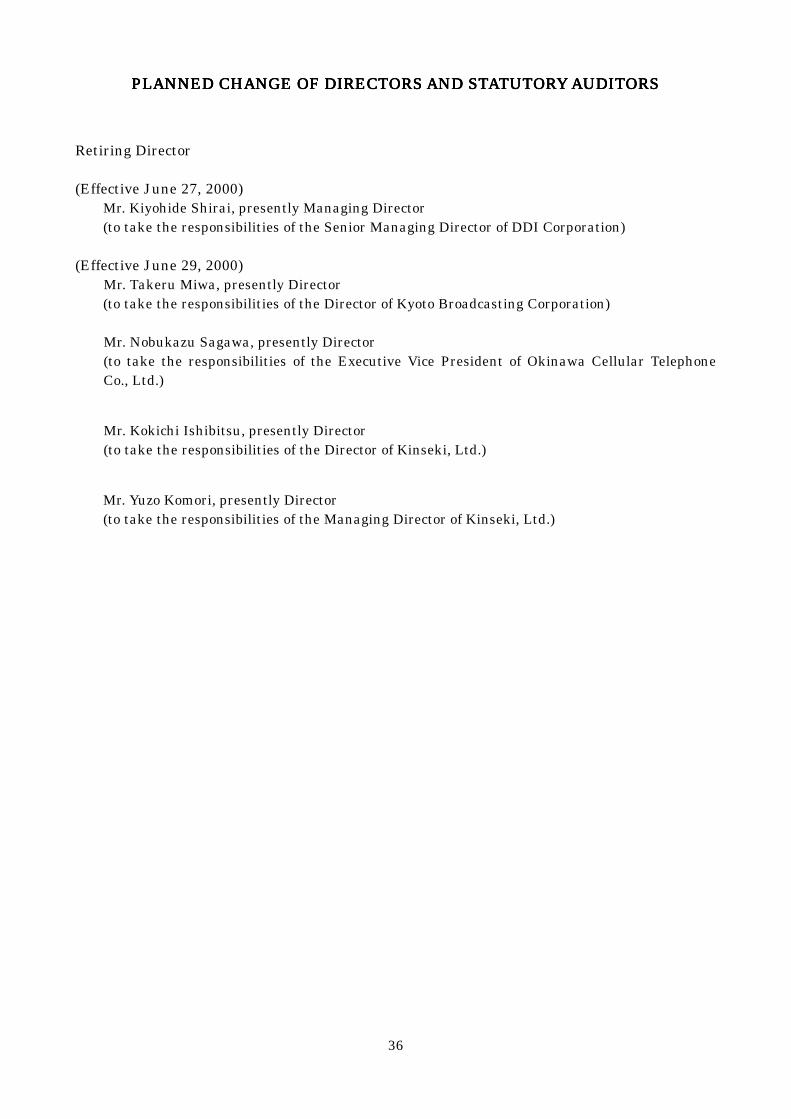
PLANNED CHANGE OF DIRECTORS AND STATUTORY AUDITORSPLANNED CHANGE OF DIRECTORS AND STATUTORY AUDITORSPLANNED CHANGE OF DIRECTORS AND STATUTORY AUDITORSPLANNED CHANGE OF DIRECTORS AND STATUTORY AUDITORS
Retiring Director
(Effective June 27, 2000)Mr. Kiyohide Shirai, presently Managing Director(to take the responsibilities of the Senior Managing Director of DDI Corporation)
(Effective June 29, 2000)Mr. Takeru Miwa, presently Director(to take the responsibilities of the Director of Kyoto Broadcasting Corporation)
Mr. Nobukazu Sagawa, presently Director(to take the responsibilities of the Executive Vice President of Okinawa Cellular TelephoneCo., Ltd.)
Mr. Kokichi Ishibitsu, presently Director(to take the responsibilities of the Director of Kinseki, Ltd.)
Mr. Yuzo Komori, presently Director(to take the responsibilities of the Managing Director of Kinseki, Ltd.)