kzn cc bpo report - 1
TRANSCRIPT

0
�������������������� �������������
�������� ��������������������
�����������
�� ���������
���������������� � ������������������������������������� �������

1
CONTENTS
Executive Summary .................................................................................................. 4
Key Numbers ............................................................................................................ 5
About Durban and KwaZulu-Natal ............................................................................ 6
1. Introduction........................................................................................................... 8
2. Global Market and Trends ..................................................................................... 9
2.1. Market Size .................................................................................................... 9
2.2. Trends ............................................................................................................ 9
2.3. Major Competitors........................................................................................ 11
2.4. Generic Success Factors................................................................................ 15
3. South African Profile........................................................................................... 17
3.1. Trends in the South African Market .............................................................. 17
3.2. Regional Profile............................................................................................ 18
4. Durban and KwaZulu-Natal Sector Performance Analysis................................... 20
4.1. Sector Profile................................................................................................ 20
4.2. Operations .................................................................................................... 26
4.3. Human Resources ......................................................................................... 30
5. Durban and KwaZulu-Natal Environmental Profile and Trends .......................... 38
5.1. Introduction .................................................................................................. 38
5.2. Economic Development................................................................................ 39
5.3. Telecommunications and Information Technology........................................ 41
5.4. Labour and Skills.......................................................................................... 42
5.5. Infrastructure ................................................................................................ 45
5.6. Location ....................................................................................................... 46
Appendix A: Methodology ...................................................................................... 49
Appendix B: Population Statistics ........................................................................... 50
Appendix C: Business Indicators ............................................................................. 52
Appendix D: Call Centre/BPO Operations in KwaZulu-Natal.................................. 60
Appendix E: Exchange Rates................................................................................... 62
Appendix F: Contact Details.................................................................................... 63
List of Sources ........................................................................................................ 64

2
LIST OF FIGURES
Figure 1: Split of South African call centres according to location........................... 18
Figure 2: Medium and large call centre versus pocket call centres ........................... 20
Figure 3: Year of establishment ............................................................................... 21
Figure 4: Industry of operation ................................................................................ 22
Figure 5: Average firm outsourced versus captive orientation.................................. 23
Figure 6: Average firm international versus domestic orientation by turnover.......... 23
Figure 7: Functions performed................................................................................. 24
Figure 8: Use of language........................................................................................ 25
Figure 9: Inbound versus outbound calls.................................................................. 26
Figure 10: International versus domestic calls ......................................................... 27
Figure 11: Communication channels utilised ........................................................... 28
Figure 12: Frequency of client satisfaction measurement ......................................... 29
Figure 13: Employment race profile ........................................................................ 31
Figure 14: Employment gender profile .................................................................... 31
Figure 15: Attrition by employee category............................................................... 32
Figure 16: Average tenure by employee category .................................................... 33
Figure 17: Frequency of performance appraisals...................................................... 34
Figure 18: Hours of training per annum by employee category ................................ 34
Figure 19: Recruitment source................................................................................. 35
Figure 20: Agent recruitment requirements.............................................................. 36
Figure 21: Supervisor/team leader recruitment requirements ................................... 36
Figure 22: Manager Recruitment requirements ........................................................ 37
Figure 23: Economic development performance ...................................................... 39
Figure 24: Telecommunications and information technology performance .............. 41
Figure 25: Labour and skills performance................................................................ 43
Figure 26: Infrastructure performance ..................................................................... 45
Figure 27: Location performance............................................................................. 46

3
LIST OF TABLES
Table 1: Economic classification of call centre/BPO host countries ......................... 11
Table 2: Comparative rankings for international business indices ............................ 12
Table 3: Contact centre and BPO international investment environment comparison 13
Table 4: Country sector profile ................................................................................ 14
Table 5: Sector operational profile........................................................................... 15
Table 6: South African provincial comparison......................................................... 19
Table 7: Location of call centre operations .............................................................. 22
Table 8: Average working hours per month for staff................................................ 26
Table 9: Voice and data costs .................................................................................. 42
Table 10: Agent salaries in Rands............................................................................ 43
Table 11: Average office rental costs in Rands per m2 ............................................. 46
4
EXECUTIVE SUMMARY
Both Durban and KwaZulu-Natal have a well-established and yet rapidly growing call
centre industry. KwaZulu-Natal has a Gross Geographic Product (GGP) of US$
12,364 billion and is placed as the province with the second largest economy in South
Africa. Of the total 3.1 million people living in Durban itself, 943,538 speak English
as a first language while 23% have completed their secondary schooling or have a
tertiary qualification.
There are 67 call centre operations in KwaZulu-Natal employing a total of 7,573
people and serving a variety of sectors, the most prevalent of which are financial
services, ICT & telecommunications, retail and insurance. In total, 20% of call centre
capacity is orientated towards outsourcing. Further to this the amount of experience
and skills in these sectors can be considered to be substantial given that the average
number of years since establishment is 12 years. The growth projections for the
industry are also very promising. It is anticipated that the total number of operations
will increase to 83 over the next two years.
The average number of seats per KwaZulu-Natal operation is 120 and the median
number of calls handled per month is 53,006. A full 37% of all calls are international
in either origin or destination, highlighting the mix of offshore and domestic focus
that exists within the industry. A strong service culture can be considered to be
present, with an average 93% customer retention since establishment reported. This is
generally supported by factors such as strong employee performance management
practices at all levels and a low average external voluntary agent attrition rates of just
7%. In addition the average ratio of agent to supervisors is 6.1:1 and the ratio of
supervisors to managers is 6.5:1.
Contributory factors which have supported the establishment and growth of the
regional call centre industry include the comparatively low cost of rental space and
agents. A grade office space is available at an average monthly rental of R61.36
(£5.34) per m2, while the average cost of an agent per hour is R30.76 (£2.67).
Additional factors which have played a role in the development of the industry’s
offshore provision of services include the region’s strong cultural affinity to the UK
and similar English speaking markets, and time zone compatibility with Europe.

5
KEY NUMBERS
South Africa Sector Overview
Gross domestic Product (GDP) $160 billion Profile
Population 45 million Average percentage of
outsourcing 20%
Purchasing Power Parity (PPP)
(International Dollars) 10 960 Average seats per call centre 119.9
Estimated number of call centre
employees 79 000
Average employment per call
centre 128.3
Durban / KwaZulu-Natal Overview Projected employment growth
over next two years 91%
Gross Geographic Product (GGP)
for KwaZulu-Natal $12 billion
Average years since
establishment of operation 12
Population of KwaZulu-Natal 9.6 million Major international market UK
Population of Durban 2.81 million Operations
Unemployment in KZN 26.5% Primary language of service
provision English
People with tertiary qualifications
in KZN 6.9% Modal days of operation 365
English home language speakers
in KwaZulu-Natal 1 285 011 Median calls handled per month 53,006
Number of call centres 67 International calls as % of total
calls 37.1%
Number of seats 8 034 Voice telecoms cost per month R 236 216
Number of call centre employees 7 572 Average client retention since
establishment 92.6%
Agent cost per hour R 30.76 (£2.67) Human Resources
Projected salary increase for
agents in 2006 6%
Hours worked per month by
agents 167.2
International call cost per minute R 0.40 Agent external voluntary
attrition rate 6.9%
National call cost per minute R 0.44 Agents per team leader/
supervisor 6.1
Cost of 2 Mb line per month R 121 600 Team leaders/ supervisors per
manager 6.5
Monthly cost of A grade office
space per m2
R 61.36
(£ 5.34)

6
ABOUT DURBAN AND KWAZULU-NATAL
Welcome to the first report on the
Durban / KwaZulu-Natal call centre
environment. It is with great pleasure
that I share with you the depth of
experience and wealth of potential that this independently researched report
highlights.
My new appointment here at KZNonSOURCE is indicative of the focus and
commitment that the city has to the development of the region as a contact centre
service hub, to productively use the human capital that has developed alongside the
region’s world-class manufacturing, tourism, commercial and financial services
sectors.
Tasked primarily with attracting potential investors and clients to the city and the
region, KZNonSOURCE is confident that multinational company leaders will
recognise the benefits of the Durban operating environment, as have other global
companies who make the city their home, such as Unilever, Grindrod and Bell
Equipment.
This trend is also being observed in nationally operating corporates, who are
increasingly recognising the value proposition of Durban and KwaZulu-Natal and
migrating their operations to the region. Examples include Africa’s largest mobile
phone operator, MTN; the national mobile phone operator, Cell C; as well as the
financial services provider, Nedbank.
Our organisation is supported in its role by associated bodies such as the Durban
Investment Promotion Agency and Trade and Investment KwaZulu-Natal. However,
it is the close relationship and commitment to excellence and service delivery
exhibited by local and provincial government and city management that makes me
most confident of the local industry’s future. Indeed, I believe that the outsourcing

7
and internationally-focussed contact centre work emerging in the city is the beginning
of an influx of such opportunities, as international companies recognise the high
calibre of Durban’s service providers and personnel over and above the general
benefits of the South African operating environment and position.
The South African Contact Centre Community (SACCCOM) is an umbrella body for
the national industry that is tasked with highlighting the attractiveness of South Africa
as a call centre locale, particularly to the culturally-similar markets of the UK and
USA. Under their auspices, KZNonSOURCE is positioned to sell potential investors
who are considering South Africa on the particular benefits of our beautiful and
thriving UniCity.
Of course, my confidence in the development of Durban and KwaZulu-Natal is also
due to the amount of energy and resources that KZNonSOURCE has motivated to be
used on the development and support of the local industry, such as the development of
the Skills Development Academy, which has been implemented to ensure that we are
able to meet the increasing demand for trained operators, managers and supervisors.
I look forward to sharing our vision and strategy with you as we develop, and
introducing introduce investors and interested parties to the benefits of our city.
William Goldstone
Chief Executive Officer, KZNonSOURCE

8
1. INTRODUCTION
In recent years South Africa has become recognised as a key offshore contender for
call centre and business process outsourcing business. The purpose of this report is to
explore and define Durban and KwaZulu-Natal’s sector through the establishment of
baseline data for key indicators on the industry.
Within the broader goal of understanding and driving industry decision-making, the
aims of the research include:
• The identification of key strategic advantages that will promote Durban and
KwaZulu-Natal as a captive or outsourced operations destination to
international investors
• The provision of comparable measures across regions and sectors that will
allow local industry stakeholders to gauge industry trends and internal
performance
• The provision of factual and comprehensive insight into the industry for use
by local government in making development support decisions and developing
strategy.
To achieve these aims the report explores the global market and trends that are
shaping it before considering the positioning of South Africa relative to its major
competitors. The report then moves on to an analysis of Durban and KwaZulu-Natal
within South Africa, along with the profile and performance of the local sector.
Lastly, the report evaluates the performance of KwaZulu-Natal according to a set of
key investment drivers.

9
2. GLOBAL MARKET AND TRENDS
2.1. Market Size
A single figure for the total global market size of call centres and business process
outsourcing is not a practicable measure, although the aspects that can be quantified
offer insight into the likely size.
If one considers the global balance of payments figures for 2001, the total market for
all offshore service exports was estimated at $32 billion, mostly supplied by Ireland,
India, Canada and Israel. This figure however includes all service exports and is
limited to those countries that actually capture offshore service exports as an industry
classification. Within the 2003 figures for the USA, most noticeable was the increase
in the categories of computer and data processing services and accounting, auditing
and bookkeeping (UNCTAD, 2004). This represents a figure of US $1,8 billion per
annum. Research by Deloitte found that the world’s 100 largest financial institutions
expect to shift base cost to the value of $350 billion to international locations by 2008
(Gentle, 2003).
While the global figure cannot be calculated from these numbers alone, the figures do
suggest the market is both substantial and growing.
2.2. Trends
The global trends that are shaping the industry can be divided into those that motivate
companies to outsource and those that influence development in potential host nations
as nearshore and offshore destinations.
2.2.1. Trends Motivating Outsourcing
The triggers for considering outsourcing are brought about primarily under four
broad circumstances, in addition to the cost and profitability considerations, which are
taken for granted (Bousfield, 2003). Briefly, these include:

10
Mergers and acquisitions and the resulting rationalisation of operations
• Industry-wide changes such as deregulation
• Company-wide continuous improvement and process re-engineering
• Expansion and the resulting need to rationalise disperse localities and
resources.
2.2.2. Trends Influencing Development in Outsourcing Host Nations
In terms of trends amongst host nations, while there are a great number of trends to
incorporate, there are seven fundamental areas of change and development that
provide the most impetus and direction for the call centre and business process
outsourcing (BPO) industry, whether serving captive or outsourced markets (c.f
UNCTAD, 2004, AT Kearney, 2004, Merchants, 2005). These trends include:
• Intelligent networks and modern ICT capabilities that have facilitated the
match between a demand for cost savings and the availability of lower cost
host countries
• The quest by companies for new sources of cheap personnel and requisite
skills, that has in many cases been met by the proactive support of
governments when it comes to training and skills development
• The presence and promotion of existing skill sets and service potential have
frequently motivated location choice, following which foreign direct
investment (FDI) has been forthcoming from multi-national companies
• Agglomeration has resulted in the more established host countries gaining skill
and advanced services
• ‘Single-point service’ offering requirements by client firms have stimulated
consolidation and the increasing prominence of multi-national outsourcing
service providers
• Protection of intellectual property (IP) is gaining increasing prominence as
companies that outsource are looking to shift increasingly more sensitive and
demanding services to international locations based on capabilities and cost
savings

11
• Trends that could limit growth in locations, particularly those such as India
where growth has been extremely rapid, include demand for skilled and
experienced agents outstripping supply, and growing concerns regarding the
loss of mid to higher level white collar job functions in countries such as the
US.
2.3. Major Competitors
2.3.1. Defining South Africa’s Competitors
The global market can be distinguished by individual countries who are engaged in
contact centre and BPO activities on a scale that elicits either marked economic
changes, political pre-eminence, or both.
While these countries can be grouped according to geographic and economic zones,
for the purposes of analysis they have been subjectively grouped according to
economic value classification by virtue of their perceived ability to easily the required
levels of customer empathy and associated identification with the customer and
quality of service.
Table 1: Economic classification of call centre/BPO host countries
Mid to high-end value chain economies Ireland, South Africa, Israel, Philippines1
UK, Canada, Singapore, USA
Mass-market low value economies India
China
Source: Catalyst, 2005, unless otherwise indicated
While there are currently a large number of countries marketing themselves as
outsourcing destinations, for the purposes of this study the focus will be on countries
perceived to be English speaking competitors. To this end, Ireland can be identified as
a developed country which has become a benchmark in the global outsourcing trend,
as well as Israel, the Philippines and India which are perceived to be direct developing
economy competitors in terms of service provision in English.
1 The placement of the Philippines as a mid-to high-end value chain economy by B&M Analysts is by
virtue of its close cultural similarities with the USA (The Department of Trade and Industry, 2004).

12
2.3.2. Comparative Rankings for International Business Indices
In terms of South Africa’s position in the global call centre and business process
outsourcing market, international business indices find South Africa to hold a
consistently reliable position amidst the variable performances of competitor nations.
This deduction derives from the basket of indices presented in Table 2, where South
Africa is fairly consistently placed in the midst of the four competitors despite the
generally inconsistent ranking of the competitors themselves from one measure to the
next.
For each index, the first figure given (between 1 and 5) is limited to South Africa and
the four chosen comparators, and represents a performance ranking of only these
countries in relation to each other. The second figure represents the ranking of each
country in the overall index, with (n) denoting the number of countries included in the
total measure. Additional detail and explanations of these indices may be found in
Appendix E.
Table 2: Comparative rankings for international business indices
South Africa
Ireland India Israel Philip-pines
Business Competitiveness Indicator (n=103)2
3 (25)
2 (22)
4 (30)
1 (21)
5 (70)
Growth Competitiveness Index (n=103)3
3 (41)
2 (30)
3 (55)
1 (19)
5 (76)
AT Kearney Offshore Attractiveness Index (n=24)4
3 (17)
4 (23)
1 (1)
5 (24)
2 (6)
TI Corruption Perception Index (n=146)5
3 (44)
1 (17)
4 (90)
2 (26)
5 (102)
Moody’s Ratings6
4 (Baa1)
1 (Aaa)
5 (Baa3)
2 (A2)
3 (B)
2.3.3. Operating Environment Comparison
The socio-economic and infrastructural environment more specific to the
attractiveness of the call centre industry is also important in that it impacts greatly on
2 Source: World Economic Forum: Global Competitiveness Report 2004 3 Source: World Economic Forum: Global Competitiveness Report 2004 4 Source: AT Kearney: Offshore Location Attractiveness Index 2004 5 Source: Transparency International: Corruption Perception Index 2004 6 Source: Moody’s Investor Services 2005

13
the approach to foreign direct investment, marketing and support of the call centre and
BPO industry.
South Africa once again performs in a fairly stable position in terms of the various
measures presented in Table 23. Two factors in particular which differentiate South
Africa when compared to lesser developed economies are the strong intellectual
property (IP) protection laws, of which the favourable Software Piracy rankings are
indicative, and the reasonably high standard of living, of which the Purchasing Power
Parity (PPP) is indicative.
The same method of ranking and presentation of ratings has been used as in Table 2
above. Additional detail on these indices may also be found in Appendix E.
Table 3: Contact centre and BPO international investment environment comparison
South Africa
Ireland India Israel Philip-pines
Standard Corporate Sector Taxation
2 (30%)
1 (12.5%)
5 (41%)
4 (36%)
3 (32%)
Purchasing Power Parity (PPP) (International Dollars) PPP ranking (n= 208)7
3 (10,960)
1 (33,170)
4 (3,100)
2 (23,510)
5 (1,170)
Unemployment 4 (31.2%)
1 (2%)
Not available
2 (10.5%)
3 (10.7%)
Network Readiness Index (n=104)8
3 (34)
2 (22)
4 (39)
1 (18)
5 (67)
Software Piracy Rankings (n=103)9
2 (37%)
3 (38%)
5 (74%)
1 (33%)
4 (71%)
2.3.4. National Call Centre and BPO Sector Comparison
For ease of reference, the sector comparison across the five countries has been broken
down into sections dealing with sector profile (including size, markets served and
functions performed) and operational profile (including costs and staffing measures
such as attrition).
If call centres are considered separately from the more broadly defined concept of
7 World Bank (2005) 8 World Economic Forum (2004-2005) 9 Business Software Alliance (2005)

14
BPO, South Africa can be considered to have the second largest sector by
employment. While this is somewhat surprising given the late entry of South Africa
into the offshore outsourcing market, this may be explained by the well developed
domestic banking and telecommunication markets, both of which are defined as being
the top markets served by the South African call centre sector.
Table 4: Country sector profile
South Africa10
Ireland11 India12 Israel13 Philip-pines14
Estimated number of call centres (total)
535 110 Not available
500 200
Estimated number of call centre employees
79,000 28,000 403,00015 11,000 32,000
Most prevalent outsource country serviced
UK USA UK
USA UK
USA Europe
USA Malaysia Australia
Singapore Top sectors serviced
Financial services
Telecoms Medical
Telecoms IT
Telecoms E-commerce
IT Healthcare Insurance Travel & tourism
Telesales IT
HR Legal
services Financial services
Outsourcing bureaus Telecoms
Media Utilities Retail
Wholesale
Primary activities Customer service Account handling Technical support
Customer service Sales
Provide info
Customer Services
Provide info
Sales Customer
service Provide
info
Telesales Customer
service Technical support
Collections
Table 5 quantifies the operational competitiveness position of South Africa. Agent
salary costs, while higher than those in India and the Philippines, can be considered to
be considerably lower than those of Israel and Ireland. Similarly, the average rate of
attrition in South Africa is far lower than that of any of the comparators. This
10 Mitial Research (2003) 11 TOSCA (2004) 12 Scope Marketing and Information Systems (2001) 13 Catalyst (2005) 14 ACA Research (2003) 15 Employment refers to both ITES and call centre industries

15
indirectly implies that the relative annual investment in training and recruitment at a
South African call centre can be considered to be lower than that of the other
countries.
Table 5: Sector operational profile
South Africa
Ireland India Israel Philip-pines
Cost per seat / hour (USD) 13.84 7.00 19.00 4.39 Agent salaries / month (USD) 693 2, 670 141 800 236
Average agent tenure (months) 14.7%16 24 36 19
Average rate of attrition 6% 30% 22% 30% 15% Sources: As per Table 4 above
2.4. Generic Success Factors
Although a number of trends in the global contact centre market have been
highlighted, there appear to be four specific factors contributing to the success of
countries as outsourcing locations.
2.4.1. Government interventions
These tend to be structured around both short term inhibitors to growth as well as
future threats. For example, many countries have recognised the need for a large
labour pool who speak fluent English, have technical or computer skills, and are thus
addressing this from primary school to college-level educational institutions (AT
Kearney, 2004). Concurrent to this, governments are ensuring that skills training is
available to agents who are currently in or entering the industry to ensure that there is
no significant lag likely to the locality’s of competitive advantage.
2.4.2. Incentives to Encourage MNCs and FDI
Host countries are united in the favourable investment environments that they have
created for foreign direct investment and multi-national companies. While some (such
as Ireland) have placed no provisos on this investment in terms of either ownership or
16 Merchants (2005) figure for Africa

16
local participation, others (such as the Philippines) have insisted on skills transfer to
the local population (Tosca, 2004; ACA Research, 2003).
2.4.3. Co-operation and Consolidation
Successful outsourcing host nations have recognised their own areas of skill and
weakness, and marketed themselves accordingly. In some cased this has led to
agreements with those nations who have the skills that they lack in order to become
single-point service suppliers to their clients. For example, India makes use of
Singapore for IP-sensitive operations in recognition of its weak legislated intellectual
property protection (AT Kearney, 2004).
2.4.4. Cost versus Non-cost Based Positioning
While host countries recognise that cost will always be a motivating factor in
offshoring decisions, the industry has developed a level of sophistication where
differentiation and sustainability are measured in terms of quality and end-user
satisfaction measures, as opposed to simple cost calculations. This allows for focussed
development efforts and competition that takes into account all aspects of service
delivery. This has led to the type of positioning illustrated in Table 1.

17
3. SOUTH AFRICAN PROFILE
3.1. Trends in the South African Market
The London-based consultancy Control Risks Group is quoted as saying that South
Africa has a positive business environment with low political and security risk. It also
praises government policy and business governance, and claims that South Africa is
setting the trend for Africa (Financial Times Business, 2005).
This sentiment is reflected in the country’s strong investment rating, as well as
evidence of foreign direct investment into the country in a broad spectrum of
categories. The orientation towards global outsourcing is set to further grow as South
Africa is increasingly becoming more attractive as a ‘tier 2’ destination to countries
such as the United Kingdom as a result of unmet demand in ‘tier 1’ countries such as
India andChina.. This represents a direction of growth for the national industry in
addition to the one presented in Table 1, namely that of a mid- to high-end value
economy.
This is particularly encouraging in light of the fact that almost half of the opportunity
is anticipated to fall within the financial services and insurance sectors, and the
international indices discussed above reflect South Africa as strong within these areas
and still improving.
While South Africa offers a 30% to 40% cost saving over countries such as the United
Kingdom, it is still more costly than India and China, which could be an inhibiting
factor to industry growth. Despite this however South Africa is also increasingly
recognised as being able to differentiate itself on the basis of quality as opposed to
just cost when compared to destinations such as India and China.

18
3.2. Regional Profile
The South African Call Centre Community (SACCCOM) is an umbrella organisation
that has been established to promote the South African industry as a whole. To date,
however, the majority of marketing, promotion and development of the industry has
been undertaken by the individual organisations representing Gauteng
(ContactinGauteng), the Western Cape (CallingtheCape) and KwaZulu-Natal
(KZNonSOURCE).
Turning to the relative concentration of South Africa’s call centre industry, research
undertaken in 2002 indicated that the industry was clustered largely into three regions,
namely those mentioned above. Further to this it was estimated that 10.1% of the
industry was located in KwaZulu-Natal (Mitial Research, 2002).
All other (Including PE)
11%
Gauteng (JHB & Pretoria)
63%KwaZulu-Natal
(Durban & other)10%
Western Cape (Cape Town)
16%
Figure 1: Split of South African call centres according to location
Although the relative distribution is unlikely to have changed since 2002, the actual
number of call centres can be expected to be significantly out of date and are hence is
not supplied. Primary research undertaken for this report however identified a more
realistic figure which is presented in the next section.

19
Table 6 shows a comparative profile of the three regions in question. With the highest
population of the three regions, KwaZulu-Natal also has the second highest GDP and
functionally literate population over 20 years old. KwaZulu-Natal also has the highest
number of English first language speakers which places it in a strong position to serve
offshore English-speaking markets.
Table 6: South African provincial comparison
Durban KwaZulu-Natal Gauteng Western Cape
Gross Geographic Product (1999)17 R 47 752 bn18 R 80 366 bn R 200 181 bn R 75 157 bn
Population (2001) 3.09 m 9.43 m 8.84 m 4.52 m
English home language speakers
943 538 1 285 011 1 105 192 874 660
Population female (2004)
1.6 m (2001) 5.02m 4.39 m 2.33 m
Functional literate population over 20yrs old (2001)
1.47 m 3.08 m 4.82 m 2.25 m
% Population unemployed (2004)
43.01% (2001) 26.5 % 21.9 % 17.0 %
Economically active people aged 15-65 (2004)
56.98 % 35.2 % 50.4 % 53.6 %
Percentage of people with matric certification (2001)
16.58 % 19.8 % 28.0 % 23.4 %
Percentage of people with a tertiary qualification (2001)
5.96 % 6.9 % 12.6 % 11.2 %
Source: Statistics South Africa website unless otherwise indicated
17 Statistics South Africa, 1999 18 WEFA Forecast 2002, as found in South African Cities Network (2005)

20
4. DURBAN AND KWAZULU-NATAL SECTOR PERFORMANCE
ANALYSIS
4.1. Sector Profile
4.1.1. Size and Growth
A total of 67 call centres were identified to be operating in KwaZulu-Natal. The
average employment amongst the sample survey participants of 119.9 implies that the
total employment within the sector is approximately 7,572. The average number of
seats per contact centre was slightly higher at 128.3, indicating that the total number
of seats is approximately 8,034. A full 71.4% of the call centres have more than 20
seats and can therefore be classed as medium or large call centres.
Pocket call centres28.6%
Medium & large call centres
71.4%
Figure 2: Medium and large call centre versus pocket call centres
The projected growth in turnover over the next year amongst the sample of firms
surveyed was 28.0%. In addition to this the average growth in employment and
number of seats is expected to increase by 54.7% and 65.8% respectively over the
course of the next two years. The increase of seats in tandem with employment is

21
essential in ensuring that there is enough capacity to deal with growth in the size of
the industry, however it is also evident that surplus seat capacity will remain.
Most of the surveyed operations are fairly new, with a substantial number (47.6%) of
them having been established in the past 5 years and 19.0% in the past two years. This
suggests that the industry is firstly fairly well established, but that it is also growing
very rapidly through the establishment of a number of Greenfield operations.
0
5
10
15
20
25
30
35
40
45
50
2000 - 2005 1995 - 1999 1990 - 1994 1985 - 1989 - 1984
Year of establishment
Per
cent
age
Figure 3: Year of establishment
Given that the number of call centre operations grew by 23.5% from 2003 to 2005, it
is reasonable to estimate that similar growth in Greenfield operations should be
expected from 2005 to 2007. A conservative estimate of total growth through to 2007
would therefore result in sector employment and seats reaching approximately 14,000
and 16,000 respectively, and the total number of contact centre operations increasing
to 83.

22
4.1.2. Location of Operations
Most of the call centre operations are located in the Durban CBD (44.8%), while the
remaining 55.2% are scattered around Pinetown/Westville (17.9%), Umhlanga/ Mt
Edgecombe (19.4%); Pietermaritzburg (7.5%). A further 10.4% are found in areas
other than those specified.
Table 7: Location of call centre operations
Durban CBD Pietermaritz-
burg
Umhlanga/
Mt Edgecombe
Pinetown/
Westville
Other
44.8% 7.5% 19.4% 17.9% 10.4%
4.1.3. Market and Orientation
The industry of operation and the number of companies operating in a particular
industry are given in Figure 4 below. The findings show that most of the companies
are operating in the financial, retail, ICT & telecommunications, and insurance
industries.
0 5 10 15 20 25 30 35 40
Financial Services
ICT & Telecommunications
Retail
Insurance
Government
Medical
Pharmaceuticals
Publishing
Security
Tourism
Vehicle Fleets
Manufacturing
Legal
Petrochemicals
Tobacco
Education
Gaming
Indu
stry
of o
pera
tion
Percentage
Figure 4: Industry of operation

23
Figure 5 highlights that the industry has a 20% outsourcing orientation on average,
meaning that on average 20% of turnover is derived from outsourcing work.
However it should be noted that the outsourcing orientation of individual firms varies
greatly from just 1% to 100%, but that 18.1% of the operations operate exclusively as
outsourcers. Amongst the firms that offer outsourcing services to one extent or
another the average number of clients served is 21.4.
Captive80.0%
Outsourced20.0%
Figure 5: Average firm outsourced versus captive orientation
Domestic96.3%
International3.7%
Figure 6: Average firm international versus domestic orientation by turnover

24
Figure 6 shows that the sector has a strong domestic focus at present when evaluated
by the un-weighted average turnover generated from offshore services, with 96.3% of
turnover on average being derived from domestic clients. The international markets
served include the UK, the Benelux states, Botswana, Italy, Mauritius, Namibia,
Swaziland and Zimbabwe, although the most significant foreign market by far is the
UK.
4.1.4. Operating Profile
Companies serve various functions as indicated in Figure 13. The most prominent
functions are customer services (90.9%), e-mails (72.2%), sales (68.2) and data
capture (45.5%). As illustrated in Figure 7, some functions are performed by few
companies, indicating a diverse set of competencies within the region.
0 10 20 30 40 50 60 70 80 90 100
Customer services
E-mails
Sales
Data capture
Correspondence management
Technical support
Credit Collection
Credit Card administration
Data Cleansing
Insurance/medical/other policy administration
Appointment setting
Securities administration
Financial accounting
Monitors alarm signals
Conducting surveys
Planning
New business processing
Ope
ratio
n
Percentage
Figure 7: Functions performed
Languages were rated to evaluate which languages are mostly used when serving
clients. In this regard it was established that all operations use English as their
primary medium of communication, highlighting a clear proficiency in the use of
English. However, it was also established that strong competencies exist in additional

25
domestic languages. Figure 8 illustrates that in addition to English numerous call
centres serve their clients in Afrikaans, IsiZulu and IsiXhosa.
Limited foreign language skills are apparent, thus restricting the ability to service
clients outside of those whose communication medium is English.
0 10 20 30 40 50 60 70 80 90 100
English
Afrikaans
IsiZulu
IsiXhosa
Sesotho
Portuguese
Italian
French
Hungarian
Use
of l
angu
age
Percentage
Figure 8: Use of language
An analysis of the number of days worked per annum highlights that although the
average number of days for call centres is 311.6, the mode of the sample is 365 days,
with 20% of firms comprising the mode.
Further to the above, while a staggered shift system is generally the norm, 18.2% of
the sample can be considered to operate on a 24/7 basis. The hourly utilisation during
weekdays is only 54.4% (typically 08:00 to 17:00) indicating a large excess in
available capacity.
On average, managers work 171.5 hours per month, while supervisors and agents
work 170.9 and 167.2 hours respectively. South African legislation is fairly flexible
regarding working hours and overtime and restrictions on working hours and overtime
does not apply in cases where staff receive more than R89,000 a year or R7,417 per
month.

26
Table 8: Average working hours per month for staff
Category Agents Supervisors Managers Hours 167.2 170.9 171.5
4.2. Operations
4.2.1. Call Volumes and Costs
The median number of calls handled by a single call centre is 53,006 per month,
although the maximum number is considerably higher than the median as a result of a
small number of large call centre handling extremely large call volumes.
At an aggregate level, 60.2% of all individual calls are outbound while 39.8% are
inbound. The significance of the measurement of total calls as opposed to the median
or average for firms is evident in the domestic versus international call volume
comparison (Figure 10). The measurement of offshore versus domestic turnover
presented in Figure 6 reflected a very low offshore orientation of the sector as it was
an un-weighted average of the orientation of each surveyed firms. Figure 10,
however, captures more the significant scale of those firms that are operating
internationally.
Outbound60.2%
Inbound39.8%
Figure 9: Inbound versus outbound calls

27
Domestic62.9%
International37.1%
Figure 10: International versus domestic calls
Lastly, the average expenditure on voice telecommunications per month is R 236,216,
while the average spend on data services is R 35,335. Specific call and data costs
available to firms are covered in more detail in the next section.
4.2.2. Call handling Statistics
Both call resolution and call abandonment are commonly used as international
performance metrics. On average, firms have a 76.9% first call resolution
performance. This is an interesting measure and one that needs to be considered in
conjunction with the function performed by a call centre and the context within which
it is being used by management. For example, certain query types may by their very
nature necessitate a resolution post the first call but may still be logged as an inability
to resolve on a first call basis. Abandonment rates clearly differ significantly between
the international and domestic markets served. Interestingly, abandonment rates
amongst the KwaZulu-Natal based firms when serving the domestic market average
4.0%, considerably higher than the 1.9% that they report for their international
markets. In this regard it is important to take note that the domestic average is brought
down considerably by the inclusion of call centres operating in, and making use of,
cellular network services.

28
The average time to an operator excluding IVR or voice recognition is 24.4 seconds.
While this measure is once again strongly influenced by factors as basic as available
seats, staffing levels, the market served and type of queries handles amongst others, it
is indicative of a general service-orientated culture in the sector.
Also relating to the handling of calls is the continuity of and reliability of operations.
In this regard 95.5% of the respondents indicated that they use a hot backup system
and at each of the firms with hot backup systems backups take place daily or more
frequently.
The average percentage downtime per company is 1.9% of total operational time, with
individual company percentage downtime varying from 0% to 10%. Problems that
result in downtime primarily relate to power failures and server problems.
4.2.3. Communication Channels
Figure 11 represents the communication channels from the most used to the least
used. It is clear that there is high penetration and hence a suggested competency in the
sector for all the areas explored. Interestingly, however, no firms have adopted speech
recognition technology to date.
0 10 20 30 40 50 60 70 80 90 100
Voice
Fax
SMS
Internet
Postal mail
Face-to-face
IVR
WAP/GPRS
Com
mun
icat
ion
chan
nel
Percentage
Figure 11: Communication channels utilised

29
4.2.4. Customer Satisfaction
There are varying performances in regard to the customer retention indicator. Half of
the companies have managed to retain 75-80% of the customers, while the other half
retained 98-100% of their customers since establishment. In a highly competitive
environment, it is important for companies to measure their client’s satisfaction in
order to enhance their customer retention and as such it is encouraging to note that the
average customer retention rate since establishment for the sector is 92.6%.
Although companies conduct surveys according to their need for information on
certain issues that are essential to their competitiveness, it is important for companies
to have ongoing assessments. This is particularly true in the services sector, where the
needs of clients have to be constantly monitored and catered for if companies want to
retain their customers. Companies that do not conduct client satisfaction
measurements are likely to remain complacent. The same applies to companies that
do not have ongoing monitoring systems, as they are likely to adopt retroactive rather
than proactive approaches in their dealings with challenges presented by their market.
0.0
5.0
10.0
15.0
20.0
25.0
30.0
Weekly ormore often
Monthly Quarterly Bi-annually Annually Less thanannually
Never
Frequency
Per
cent
age
Figure 12: Frequency of client satisfaction measurement

30
In this regard, it is evident that strong customer retention performance is supported by
strong client satisfaction measurement practices. The timing of measurement varies
considerably amongst the sample, with 9.1% of firms undertaking it as frequently as
weekly. What is extremely encouraging though is that 86.3% do undertake client
satisfaction performance measurements in one form or another on a systematic basis.
4.3. Human Resources
4.3.1. Employment Profile
The sector is clearly a large employer of Previously Disadvantaged Individuals
(PDIs)19, and it is encouraging to note that the majority of companies (81.8%) are
working towards achieving employment equity profiles more representative of that of
the demographic profile of the province through formal employment equity plans20 .
Asians currently constitute 55% of all agents working in this sector, as illustrated in
Figure 13. This is followed by Blacks (28,1%), Coloureds (10.7%) and Whites
(6.1%).
At the supervisory level, Asians still remains dominant (46.1%), whilst Blacks
constitutes 16.9%, Coloureds, 16.3% and Whites, 15.2% of employees working as
supervisors/team leaders. A majority of managers in this sector are however White
(42.6%) and Asian (38.9%) with Coloureds and Blacks constituting 5.6% and 13.0%
of the total respectively.
The number of women agents (70.9%) employed in this sector is more than twice that
of males (29.1%). Interestingly though, despite the high number of women at the level
of agents, this number declines significantly as one moves up the hierarchy. For
instance, at the supervisory/team leader category women constitute 26.9% of the total,
with males constituting 73.1%.
19 PDI’s refer to those individuals of population groups that were discriminated against prior to
democracy in 1994 20 Employment equity refers to the practice of realigning employee race, gender and disability profiles
to be representative of the country’s corresponding demographic profile

31
0%
10%
20%
30%
40%
50%
60%
70%
80%
90%
100%
Employee Category
Per
cent
age
Coloured 10.7 16.3 5.6
White 6.1 15.2 42.6
Asian 55.0 46.1 38.9
Black 28.1 16.9 13.0
Agents Supervisors Managers
Figure 13: Employment race profile
The situation at the management level also reflects an unexpected imbalance in
gender representation, although favouring women this time. 63% of managers are
women, while 37% are male.
0%
10%
20%
30%
40%
50%
60%
70%
80%
90%
100%
Employee Category
Per
cent
age
Female 70.9 26.9 63.0
Male 29.1 73.1 37.0
Agents Supervisors Managers
Figure 14: Employment gender profile

32
The survey also revealed that there are an insignificant proportion of disabled persons
employed in the sector, at only 0.3% at an agent level and none at either a supervisory
or management level.
Of additional interest is that the average age of agents is 27.1 years and that 59% of
employees are from areas that could be classified as ‘previously disadvantaged’21.
4.3.2. Attrition and Tenure
As can be expected, staff attrition is the highest among agents at an average of 15.3%
per annum for 2004/2005. It is however important to distinguish between the three
different types of attrition, namely forced, external and voluntary, and internal and
voluntary. Figure 15 shows that only 7.5% of attrition is external and voluntary.
Both supervisor and management attrition can be considered negligible at just 8.0%
and 0.5% in total respectively.
0
2
4
6
8
10
12
14
16
18
Employee category
Per
cent
age
Forced attrition per annum 0.9 0.0 0.0
External & voluntary attrition perannum
7.5 2.4 0.2
Internal & voluntary attrition perannum
6.9 5.6 0.3
Agents Team leaders/supervisors Managers
Figure 15: Attrition by employee category
21 Previously disadvantaged areas are those formal and informal settlements that suffered socially and
economically under pre-democratic governance in South Africa, and are thus earmarked for upliftment

33
As can be expected from the low attrition rates presented above, average tenure
periods are high. The average length of tenure for an agent is 62.8 months, although it
is important to note that there is significant variance within the sample of firms. Given
that these measures are indicative of job satisfaction, and hence commitment to a
firm, this variance can be largely attributed to varying company cultures and
management practices.
0
10
20
30
40
50
60
70
80
90
Employee category
Mon
ths
Average tenure (months) 62.8 80.6 82.6
Agents Team leaders/supervisors Managers
Figure 16: Average tenure by employee category
4.3.3. Training and performance management
The data indicates that 60-70% of companies have performance-related compensation
for all employment categories (agents, supervisors and managers), which further
correlates with frequent performance appraisals. For example, 59.1% of agents and
52.4% of supervisors receive performance appraisals on a monthly or more frequent
basis.
A clear focus on productivity and service delivery therefore also exists, which is
reinforced by the average ratio of 6.1 agents per supervisor/team leader and 6.4
managers per supervisor/team leader.
A breakdown of hours spent on training indicates that agents receive an average of
65.2 hours of training per annum, while supervisors receive 75.7 hours and managers

34
receive 55.9 hours. There is a definite practical orientation to the agent-level training
as the average number of seats dedicated to training amongst the surveyed population
of call centres is 6.5.
0
5
10
15
20
25
30
35
40
45
50
Frequency
Per
cent
age
Agents 22.7 36.4 18.2 9.1 9.1 4.5
Supervisors 4.8 47.6 19.0 14.3 9.5 4.8
Weekly or more often Monthly Quarterly Bi-annually Annually
Less frequent or never
Figure 17: Frequency of performance appraisals
0
10
20
30
40
50
60
70
80
Agents Team leaders/supervisors Managers
Employee category
Hou
rs o
f tra
inin
g pe
r an
num
Figure 18: Hours of training per annum by employee category

35
It was estimated that the average cost to train an employee to competency is slightly
over R19,000, although this will differ considerably depending on the job
requirements and minimum skill and experience requirements when recruiting.
4.3.4. Recruitment
Figure 19 shows that employees are most commonly sourced via direct recruitment
and that where this is not the case recruitment agencies are used. No firms make use
of training providers, whilst very few have taken advantage of the SETA’s learnership
programme at this point (this may be attributed to the fact that the first set of students
who have been through the learnership programme have only recently graduated).
An analysis of the minimum educational levels of agents in Figure 20 indicates that
most of the firms (66.7%) require agents to pass Grade 12. This requirement does
however differ significantly from one firm to the next, with some firms requiring a
qualification as high as a post-matric diploma to be considered for an agent position.
0%
10%
20%
30%
40%
50%
60%
70%
80%
90%
100%
Agents Team leaders/supervisors Managers
Employee Category
Per
cent
age
SETA learnersDirect employmentRecruitment agency
Figure 19: Recruitment source

36
Grade 1012%
Grade 1256%
Call centre certificate3%
Diploma3%
Degree0%
In-house training26%
Figure 20: Agent recruitment requirements
Figure 21 shows that while Grade 12 remains the predominant requirement at a
supervisor level, the importance of formal certificates and diploma qualifications
increases considerably. At a management level this remains the case, with Grade 12
constituting the minimum requirement 45% of the time, although at this level a degree
becomes a minimum requirement 22% of the time.
Grade 106%
Grade 1249%
Call centre certificate6%
Diploma11%
Degree11%
In-house training17%
Figure 21: Supervisor/team leader recruitment requirements

37
These finding suggest two things. The first is that career progression within the
industry even with very limited formal training is possible, and secondly that there is
a need for in-house training and learnership-type programmes to ensure that the
supervisors and managers are adequately equipped to deal with the challenges that
face them.
Grade 100%
Grade 1245%
Call centre certificate11%
Diploma11%
Degree22%
In-house training11%
Figure 22: Manager Recruitment requirements

38
5. DURBAN AND KWAZULU-NATAL ENVIRONMENTAL PROFILE AND
TRENDS
5.1. Introduction
An environmental profile and trends analysis was undertaken to unpack how Durban
and KwaZulu-Natal perform as call centre investment and operating locations. The
process used for this analysis incorporated the following:
Step 1: Identification of key investment drivers: Surveys and interviews with UK-
based executives of multi-national call centre and outsourcing operations as
well as interviews with South African-based senior mangers and executives of
multi-national call centres that have already invested in South Africa.
Step 2: Evaluation of investment performance: Executives and senior managers from
five major Durban-based call centre operations were interviewed and asked to
provide ratings of the performance of their operating environment for each of
the investment drivers identified.
The first step of the process yielded a total of 22 investment drivers which were
classified into the following categories:
• Telecommunications and information technology
• Labour and skills
• Infrastructure
• Investment support and economic environment
• Geographic location
The sections that follow outline the environmental ratings while also providing insight
into the factors which are presently or will in the future influence the ratings.
For each driver 1 represents ‘very poor’ performances, 5 ‘moderate’ performance and
10 ‘excellent performance’.

39
5.2. Economic Development
Economic development
1.0
2.0
3.0
4.0
5.0
6.0
7.0
8.0
9.0
10.0
Pol
itica
l &ec
onom
icst
abili
ty
Ince
ntiv
es
Dev
elop
men
tag
ency
sup
port
Pre
senc
e of
an
esta
blis
hed
call
cent
re in
dust
ry
Figure 23: Economic development performance
5.2.1. Political and Economic Stability
International ratings agency Standard & Poor's has recently raised South Africa's
long-term credit rating from A to A+ in response to the country's improved economic
stability and reduced vulnerability to external shocks. The new rating places the
country three levels above the entry-level investment grade rating and above that of
Mexico and on a par with that of Poland and Thailand. More specifically, Standard &
Poor’s was quoted as follows: “The ratings on South Africa are supported by the
sovereign's prudent macroeconomic policies, a moderate debt burden, and strong and
stable political institutions” (SouthAfrica.info, 2005).
5.2.2. Presence of an Established Call Centre Industry
With 67 call centre operations and an average age of 12 years it is surprising to note
the fairly low rating for this criterion. With a conservative projected employment
40
growth rate of roughly 100% over the next two years this is again an indicator that can
be expected to see some change in future.
5.2.3. Development Agency Support and Incentives
There are two main investment agencies providing support to this sector. The first is
the Durban Investment Promotion Agency (DIPA) whose stated purpose is to
“facilitate sustainable investment in Durban for the benefit of all”.
In addition to the above, the province also has a specific focus on trade and
investment promotion via Trade and Investment KwaZulu-Natal (TIKZN). TIKZN is
tasked with stimulating trade and actively seeking both foreign and local direct
investment.
The primary vehicle for both of these entities to engage with the industry is
KZNonSOURCE, a specialised call centre association formed for the province in
2004. The first permanent CEO of KZNonSOURCE was appointed in July 2005 and,
with the strong support of both provincial and City governments, the scope and depth
of support to the industry provided by KZNonSOURCE can be expected to increase
significantly.
The present focus of KZNonSOURCE is four-fold:
• Skills development: A major programme is underway to establish a Skills
Development Academy (SDA) in Durban. The SDA is expected to produce
1,000 learners a year with qualifications and training aimed at agents,
supervisors and managers.
• Incentives: At present the Department of Trade and Industry (DTI) offers a set
of incentives that are generally linked to depreciation of assets. Opportunities
for sector specific incentives at a provincial or municipal level are being
explored.

41
• Marketing: Durban and KwaZulu-Natal are actively promoted as an
investment location both locally and internationally.
• Client liaison: Establishing and building relationship with existing operations
in the industry plays an important part in the institutionalisation and success of
joint industry initiatives.
5.3. Telecommunications and Information Technology
1.0
2.0
3.0
4.0
5.0
6.0
7.0
8.0
9.0
10.0
Suitability of technologies Availability of serviceproviders
Availability of IT Skills
Figure 24: Telecommunications and information technology performance
5.3.1. Telecommunication Trends and Costs
South Africa’s telecoms industry has begun a deregulation process that will offer end-
users more competitive services. While the historical monopoly, Telkom, can be
considered to have built a national infrastructure that is rated as one of global
standing, the deregulation process can be expected to yield significant benefit to the
call centre industry.

42
The deregulation process has taken on multiple fronts. The most significant of these
has been the licensing of a Second Network Operator (SNO) and the liberalisation
allowing Value Added Network Service providers (VANS) to provide VOIP in
addition to carrying data.
At the time of this research the SNO had been licensed but had yet to make public any
service offerings. Once up and running however the service and price offerings are
expected to improve the competitiveness landscape for firms.
As of 1 February 2005 VANS have also been able to offer VOIP solutions to
corporate clients. This has generally resulted in more competitive long distance call
costs. The major competitors in this field include DataPro, Internet Solutions, Storm,
Telkom and UUNet. A survey of voice and data service providers revealed that the
lowest international call rate was R0.402 per minute while the lowest cost of a 2 Mb
leased line between Durban and London was R121,600 per month.
Table 9: Voice and data costs
International National Local 2 Mb leased line
(Durban-London)
Lowest
available cost
R0.402
per minute
R0.44
per minute
R0.307
per minute
R121,600
per month
5.4. Labour and Skills
5.4.1. Agent and Supervisor Availability and Skills
The inter-regional analysis showed that there are 841,000 unemployed people in
KwaZulu-Natal and that the total number of people with a tertiary qualification is 348,
744. The establishment of the Skills Development Academy by KZNonSOURCE
should contribute significantly to the skill level and skill pool of available candidates.

43
Labour & skills
1.0
2.0
3.0
4.0
5.0
6.0
7.0
8.0
9.0
10.0
Ava
ilabi
lity
ofag
ents
Ava
ilabi
lity
ofsu
perv
isor
s
Ski
ll le
vel o
fav
aila
ble
agen
ts
Ski
ll le
vel o
fav
aila
ble
supe
rvis
ors
Com
petit
ive
labo
ur c
osts
Dom
estic
lang
uage
ski
lls
Fore
ign
lang
uage
ski
lls
Cul
tura
l aff
inity
to c
lient
mar
ket
Att
ritio
n &
sta
fftu
rnov
er
Figure 25: Labour and skills performance
5.4.2. Labour Costs
Labour costs in Durban are generally viewed to be more competitive than those of
either Cape Town or Johannesburg. Table 10, which is indicative of national salaries
for agents handling inbound calls at the time of placement, however suggests that at a
provincial level average agent salaries in KwaZulu-Natal are lower than those in
Gauteng, but that there is not much of a differentiation between KwaZulu-Natal and
the Western Cape. Differences that do exist seem to be specific to the level at which
the agent is being employed rather than an overall cost advantage in either location.
Table 10: Agent salaries in Rands22
Average Lower 25% Middle 50% Top 25%
Gauteng23 6,419 4,009 – 4,821 4,821 – 6,039 6,039 – 9,389
Western Cape 5,070 3,502 – 4,415 4,415 – 5,227 5,227 – 8,120
KwaZulu-Natal 5,140 3,553 – 4,263 4,263 – 5,887 5,887 – 7,866
Source: Kelly salary survey 2004
22 Salary figures represent basic remuneration and exclude fringe benefits and bonuses such as a 13th
cheque. 23 Un-weighted average of central and north Johannesburg, East Rand, West Rand and Pretoria rates

44
Supplementary primary research indicates that the average agent in KwaZulu-Natal
earns R30.70 per hour (£2.67) or approximately R5,157 per month based on a 168
hour month, although the entry level wage can potentially be as low as R23.00 (£2.00)
or approximately R3,864 per month. The average rate is therefore 70.2% cheaper than
that of an agent in Ireland. The lowest paying sectors are generally considered to be
those of leisure, media and retail, while the highest paying are considered to be those
of cellular telecommunications and electricity.
Average supervisor costs are in the region of R10,067 per month while entry level
costs are R4,800. By comparison, managers earn on average R20,000 per month but
can cost as little as R15,000 per month.
Increases for agents in the coming year are expected to average 6.0%, while increases
for supervisors and managers are expected to increase by 6.5%.
5.4.3. Cultural Affinity to Client Market and Language Skills
Cultural affinity to market needs to be separated into affinity to domestic market and
affinity to foreign market. In relation to cultural affinity to domestic market KwaZulu-
Natal is well placed. 80.9% of the population speak IsiZulu as a home language, while
13.6% speak English, 2.3% speak IsiXhosa and 1.3% Afrikaans. Collectively this
means that 63% of South Africa’s population could be served in their home language
and by agents who share their culture with ease. Further to this, home language
speakers for each of the other official languages are also available.
Historically, South Africa can be considered to have fairly strong cultural ties with the
UK, and Durban benefits from having Leeds (in the UK) as its sister city. Further to
this, the developed state of the economy, especially when compared to countries such
has India, allows for agents to far better relate to UK and US based customers.
Outside of the connection to English speaking (i.e. typically the UK and US) markets,
however, the extent of cultural affinity to offshore market is somewhat weaker.
5.4.4. Staff attrition and Turnover
The findings from the previous section highlight that the average agent attrition rate
inclusive of forced and voluntary attrition is 11.6%, while the average tenure of

45
agents is 62.8 months. This rate compares extremely favourably to the performance of
the comparator countries of Ireland, India, Israel or the Philippines.
5.5. Infrastructure
1.0
2.0
3.0
4.0
5.0
6.0
7.0
8.0
9.0
10.0
Availability and cost of premises Local public transport
Figure 26: Infrastructure performance
5.5.1. Cost and Suitability of Premises
In terms of physical locations, South Africa has first-world office space in business
parks in all regions, as well as urban renewal incentives for CBD locations in many
cases. Comparative costs for both Grade A and Grade B office space in the three
major metropolitan areas where call centres tend to be clustered are illustrated in
Table 11.
Grade A office space in Durban at R 61.36 (£5.34) per m2 compares very favourably
to the cost of office space locations internationally.

46
Table 11: Average office rental costs in Rands per m2 24
Durban
& Environs Johannesburg
& environs Cape Town & Environs
Grade A 61.36 57.62 62.46
Grade B 47.58 50.02 48.58 Source: SAPOA (2004/5)
5.5.2. Local Public Transport
South Africa has a developed road system and international airports in all major
centres. Local public transport is perceived to be a problem however in that
commuters must rely on privately-operated minibus taxis due to the limited routes of
the municipal bus services.
5.6. Location
Geographic location
1.0
2.0
3.0
4.0
5.0
6.0
7.0
8.0
9.0
10.0
Tim
e zo
neco
mpa
tibili
tyw
ith m
arke
t
Pro
xim
ity to
dom
estic
clie
nts
Acc
essa
bilit
y by
air
Cul
tura
l aff
inity
to e
x-pa
tin
vest
ors
&m
anag
emen
t
Qua
lity
of li
fe
Ple
asan
ten
viro
nmen
t to
visi
t
Figure 27: Location performance
24 Based on an un-weighted basket of rentals for each metropolitan area.

47
5.6.1. Time Zone Compatibility with Markets
South Africa has a maximum time difference of two hours with Europe, which makes
it well placed to compete with the United Kingdom’s current near-shoring operations.
In addition, potential also exists for potential operations to use their excess capacity to
service the USA market on the basis of a ‘follow the sun’ strategy.
5.6.2. Proximity to Domestic Clients
Durban has the second highest GDP and second highest population of all cities in
South Africa. A number of national and regional headquarters are consequently based
in the city. Examples of these include Unilever and Spar.
5.6.3. Accessibility by Air
Flight times between Durban International Airport and Johannesburg International
Airport are 1 hour, while flight times to and from Cape Town International Airport
are approximately 2 hours 5 minutes. At present no direct flights between Europe are
in place, although International flight times between London/Frankfurt and
Johannesburg are around 10 hours 40 minutes.
5.2.5. Cultural Affinity to Ex-pat Investors and Management, Quality of Life and
Pleasantness of Environment to Visit
Cultural affinity to ex-pats is difficult to define and quantify without a specific
cultural group as a reference point. However, despite the average rating provided for
this measure, the following should be noted:
• Language: South Africa can be considered to have fairly strong cultural lies
with the UK as well as other European countries from which emigrants have
historically been received. Although there are eleven official languages,
English has been the language of business since 1994. There are 943,538
English first-language speakers in Durban (35% of the total population) and
1,285,011 in KwaZulu-Natal. The English spoken is similar to that of the
United Kingdom and the USA which eases communication.

48
• Weather: The climate of the region is typified by warm, humid summers with
high rainfalls, and mild dry winters, meaning that the weather does not impede
business activities, and residents can enjoy an outdoor lifestyle year-round.
The average temperature in January is 22.70C and 12.60C in July, while
rainfall averages 137mm in January and 12mm in July. Durban enjoys an
average of 320 days of sunshine per year.
• Developed state of economy: The World Bank PPP index ranks the country
74th out of 208 countries. This highlights that even were an ex-pat to earn an
equivalent South African salary they would more likely enjoy a lifestyle
according to which they are accustomed than if they were based in India
(145th), or the Philippines (126th).
KwaZulu-Natal is also accustomed to hosting tourists, receiving an estimated 13.8
million domestic tourists and 1.2 million foreign tourists during 2003. 21% of the
foreign tourists were from the UK, while 12% were from Germany and 11% from the
US and Canada. 62% of all foreign visitors were on holiday while 22% were on
business. Further to this, Durban is accustomed to hosting major international events
such as the annual Tourism Indaba, at the city’s world-class International Conference
Centre (ICC).
49
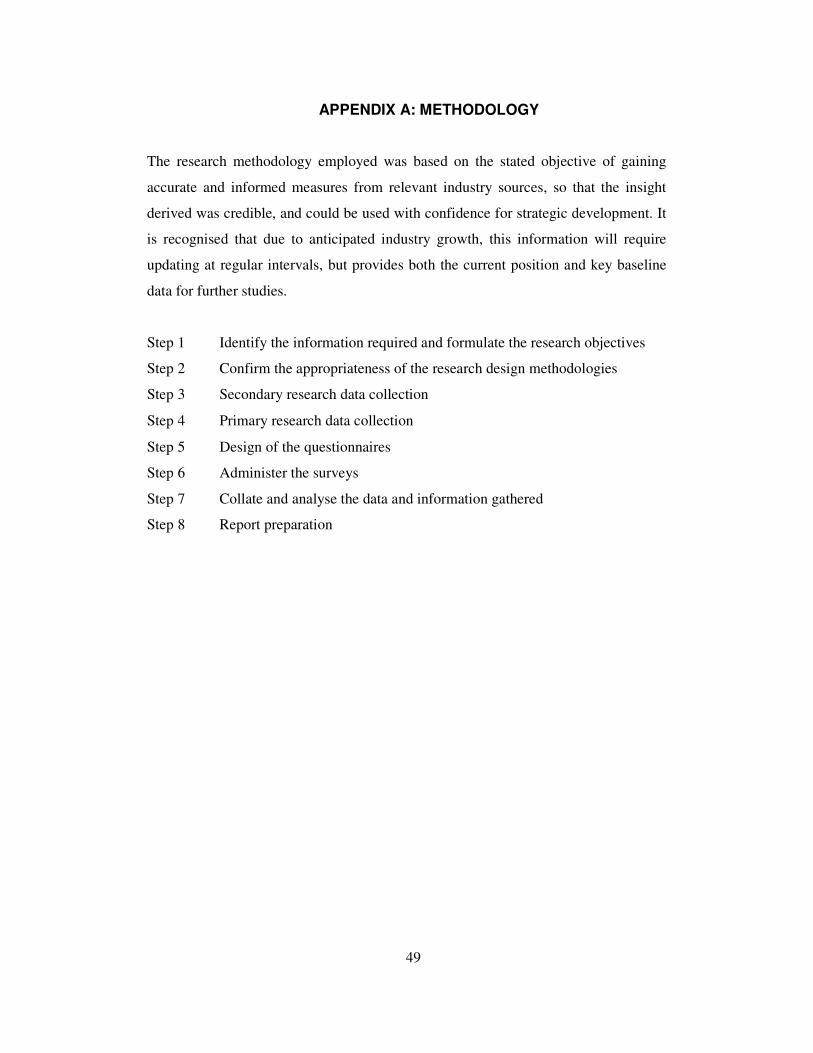
APPENDIX A: METHODOLOGY
The research methodology employed was based on the stated objective of gaining
accurate and informed measures from relevant industry sources, so that the insight
derived was credible, and could be used with confidence for strategic development. It
is recognised that due to anticipated industry growth, this information will require
updating at regular intervals, but provides both the current position and key baseline
data for further studies.
Step 1 Identify the information required and formulate the research objectives
Step 2 Confirm the appropriateness of the research design methodologies
Step 3 Secondary research data collection
Step 4 Primary research data collection
Step 5 Design of the questionnaires
Step 6 Administer the surveys
Step 7 Collate and analyse the data and information gathered
Step 8 Report preparation

50
APPENDIX B: POPULATION STATISTICS
General population breakdown KwaZulu-Natal Number % of South African population
Total population of South Africa 44 053 891 100.0
Total population of KwaZulu-Natal 8 386 546 19.0
Total population of Durban 2 715 381 6.0
Source: Statistics South Africa Census 1999
Breakdown of population for KwaZulu-Natal and Durban by race KwaZulu-Natal Durban
Number % of KZN Number % of DBN
African 6 880 717 81.74 1 734 016 63.14
Coloured 117 949 1.40 73 164 2.67
Asian 790 811 9.39 599 088 21.82
White 558 189 6.63 316 087 11.52
Unspecified 69 425 0.82 23 571 0.85
Total 8 417 091 100 2 745 926 100
Source: Statistics South Africa Provinicial Survey 2006
KwaZulu-Natal population age breakdown Male Female Total
20-24 10.3% 866 960 10.2% 858 543 1 725 503
25-29 8.1% 681 784 8.4% 707 035 1 388 819
30-34 6.7% 563 945 7.5% 631 281 1 195 226
35-39 5.9% 496 608 6.3% 530 276 1 026 884
40-44 4.8% 404 020 5.0% 420 854 824 874
Total 35.8% 3 013 317 37.4% 3 147 989 616 106
Source: Statistics South Africa provincial survey published 1999
Durban population age breakdown Male Female Total
15 – 34 19.46% 601331 20.27% 626 239 1 227 570
35 - 64 13.27% 410129 15.18% 468 970 879 099
Total 32.73% 1011460 35.45% 1 095 209 2 106 669
Source: Statistics South Africa Census 2001: eThekwini Metropolitan

51
English language speakers in KwaZulu-Natal English 1st Language speakers 925 671
English 2nd Language Speakers 1 890 000
Learners currently studying English (Grade 8 – 12) 1 001 284
Sources: 1st and 2nd language speakers: KZNonSOURCE;
English learners: KZN Department of Education
Breakdown of population for KwaZulu-Natal and Durban by disability KwaZulu-Natal Durban
Number % of KZN Number % of DBN
Sight 110 937 1.31 21 960 0.79
Hearing 67 004 0.79 13 114 0.47
Communication 17 971 0.22 4 090 0.15
Physical 123 853 1.47 34 243 1.25
Intellectual 45 451 0.55 12 288 0.44
Emotional 55 883 0.66 13 930 0.50
Multiple 49 489 0.59 12 716 0.46
Total 470 588 5.6 101 341 4.06
Sources: Statistics South Africa: KZN: Census 2001; Durban: eThekwini Metropolitan Statistics 2001
SA number of disabled person in South: 2 255 982

52
APPENDIX C: BUSINESS INDICATORS
The Growth Competitiveness Index and the Business Competitiveness Index
2004
The two measures are currently used together in the World Economic Forum’s Global
Competitiveness Report.
The medium-term macroeconomic focus of the Growth Competitiveness Index
(Lopez-Claros, 2004, xii-xiv25) uses three measures for its overall ranking, including
measures of the macroeconomic environment, the state of a country’s public
institutions, and the country’s technological readiness. This is comprised of both
publicly available hard data and qualitative opinion of business leaders. Further to
this, countries are separated into core and non-core economies for the technology
measure, so that those countries that need to lead in the development of new
technologies are weighted differently to those countries that need to adopt the
technologies developed elsewhere. Further weightings are used to ensure that the
results are accurate and comparable, and details of these can be found in the World
Economic Forum Global Competitiveness Report or from the website at
www.weforum.org/.
Of interest in the 2004 measure is that South Africa improved its ranking, leading the
rest of Africa in competitiveness, while India’s position dropped primarily due to its
large fiscal deficit. The Philippines regressed by ten places, indicating a significant
deterioration in all aspects of the measure. Ireland maintained its position in 30th
place, while Israel improved by one ranking.
The Business Competitiveness Index (BCI) by professor M Porter measures the
current sustainable levels of production in a country by “evaluating underlying
microeconomic conditions” as these are the drivers of wealth creation. Of the two
25 LOPEZ-CLAROS, A, 2004 Global Competitiveness Report 2003-2004, as taken from the executive
summary pages xii-xiv.

53
measures included, the first is the degree of sophistication of the operating practices
and strategies of companies. The second measures the quality of the microeconomic
business environment in which companies compete26.
While India ranks 14 places behind South Africa, it improved its position by 8 places
over one year, which is attributed to “increased company sophistication and
strengthened clusters” (Lopez-Claros, 2004, page xv27).
26 LOPEZ-CLAROS, A, 2004. Global Competitiveness Report 2003-2004, as taken from the executive
summary pages xiv-xv.
27 As above.

54
AT Kearney’s 2004 Offshore Location Attractiveness Index
With the aim of providing companies exploring offshoring with a measure of the
viability of different offshore locations, the annual index takes into consideration
financial structure, people skills and availability, and business environment28 (see the
table below for a detailed breakdown).
Country Evaluation by Category Category Sub-Categories Metrics
Compensation Costs • Average wages • Median compensation costs for relevant
positions (such as call centre representatives, IT Programmers and local operations managers.)
Infrastructure costs • Includes occupancy, electricity and telecommunications systems
• Travel to major customer destinations
Financial
structure (40%)
Tax and regulatory costs • Relative tax burden, costs of corruption and fluctuating exchange rates
Cumulative business
process experience and
skills
• Existing IT and BPO market size • Contact Centre and IT – quality rankings • Quality rankings of management and IT
training
Labour force availability • Total workforce • University – educated workforce
Education and
Language
• Scores on standardized education and language tests
People skills and
availability
(30%)
Attrition rates • Relative BPO growth and unemployment rates
Country environment
(includes economic and
political aspects)
• Investor and analyst rating of overall business and political environment
• A.T. Kearney’s Foreign Direct Investment Confidence Index ™
• Extent of bureaucracy • Government support for the information
and communications technology (ICT) sector
Country infrastructure • Blended metric of infrastructure quality (telecommunications, IT services)
Cultural adaptability • Personal interaction score from A.T. Kearney’s Globalization Index™
Business
environment
(30%)
Security of intellectual
property (IP)
• Investor ratings of IP protection and ICT Laws
• Software piracy rates Source: A.T. Kearney, 2004
28 A T KEARNEY, 2004. 2004 Offshore Location Attractiveness Index. Making offshore Decisions.
AT Kearney

55
South Africa is placed 17th out of the 24 countries in the overall rankings, well ahead
of both Ireland and Israel. However, this ranking moves up to 10th place when one
looks at the people skills and availability category, which includes measures of
language, education, employee retention, size and availability of labour and BPO
experience. In addition, South Africa is in 15th place for financial structure measures,
which include tax and regulatory environment, infrastructure costs, and compensation.
The 18th place overall position holds true in the business environment category, which
measures IP security, cultural adaptability, country infrastructure and country risk.
(see the figure below for overall index positions).
A.T. Kearney Offshore Location Attractiveness Index 2004
3.72
3.32
3.09
2.64
1.47
3.59
3.17
1.00
2.99
2.88
2.71
1.59
3.44
3.12
3.25
3.06
2.83
1.11
1.84
3.65
3.25
1.12
0.62
1.66
3.07
1.31
0.93
1.77
2.02
2.63
0.92
1.41
2.48
1.68
1.57
1.68
2.24
1.19
1.26
1.08
1.33
1.21
2.13
1.99
0.7
0.51
2.05
2.48
1.74
0.73
2.09
1.36
0.73
0.92
1.36
0.94
0.86
1.94
0.70
0.88
0.90
1.38
0.57
0.74
0.74
0.67
0.94
1.58
0.88
0.35
0.89
1.38
1.39
1.06
0.64
IndiaChina
MalaysiaCzech Republic
SingaporePhillipines
BrazilCanada
ChilePoland
HungaryNew Zealand
ThailandMexico
ArgentinaCotsa Rica
South AfricaAustraliaPortugalVietnamRussiaSpain
IrelandIsrael
Turkey
Financial Structure
Business Environment
People Skills and Availability
Note: The numbers in the bars are index numbers. The weight distribution for the three categories is 40:30:30,
meaning that the financial structure is rated on a scale of 1 to 4, and that business environment, and people skills
and availability are on a scale of 1 to 3.
Source: A.T. Kearney, 2004

56
The Transparency International Corruption Perceptions Index 2004
The CPI index relates to “perceptions of the degree of corruption as seen by business
people and country analysts, both resident and non-resident” (Transparency
International, 2004). The 2004 study includes 146 countries, which receive a rating
between one and ten, with ten being a clean score. The index summates 18 surveys
provided to Transparency International between 2002 and 2004, and are conducted by
12 independent institutions, which include:
Information international Columbia University Economist intelligence Unit
Freedom House, Nations in
Transit
World Markets research
Centre
World competitiveness
Report of the Institute of
management Development
Multinational Development
Bank
Merchant International Group Political & Economic Risk
Consultancy, Hong Kong
Gallup International on
behalf of Transparency
International
Global Competitiveness
Report of the World
Economic Forum
Business Environment and
Enterprise Performance
Survey
Both India and the Philippines are considered to be highly corrupt nations, falling in
the lower 60 countries included, while South Africa is placed 44th overall.
Government’s current stance on dealing with corruption suggests that this ranking has
the potential to improve going forward, which is of particular significance in light of
the importance of protection of intellectual property to potential outsourcing
investors. For more information or to view the index table, visit
www.transparency.org/.

57
Moody’s ratings
This rating scale uses U.S municipal or tax-exempt issuers or issues as the
comparators, as a measure of creditworthiness of governments. The rankings are
configured as shown in the table below.29
Guide to Moody’s ratings Aaa Issuers or issues rated Aaa demonstrate the strongest creditworthiness relative to
other U.S. municipal or tax-exempt issuers or issues.
Aa Issuers or issues rated Aa demonstrate the very strong creditworthiness relative to
other U.S. municipal or tax-exempt issuers or issues.
A Issuers or issues rated A present above-average creditworthiness relative to other
U.S. municipal or tax-exempt issuers or issues.
Baa Issuers or issues rated Baa represent average creditworthiness relative to other U.S.
municipal or tax-exempt issuers or issues.
Ba Issuers or issues rated Baa demonstrate below-average creditworthiness relative to
other U.S. municipal or tax-exempt issuers or issues.
B Issuers or issues rated B demonstrate weak creditworthiness relative to other U.S.
municipal or tax-exempt issuers or issues.
Caa Issuers or issues rated B demonstrate very weak creditworthiness relative to other
U.S. municipal or tax-exempt issuers or issues.
Ca Issuers or issues rated B demonstrate extremely weak creditworthiness relative to
other U.S. municipal or tax-exempt issuers or issues.
C Issuers or issues rated B demonstrate the weakest creditworthiness relative to other
U.S. municipal or tax-exempt issuers or issues.
Source: Moody’s Investors’ Service 2005
South Africa has recently been upgraded to a rating of Baa1, which is just one notch
below the coveted A rating category. Current comparator rankings include Ireland
Aaa, Israel A2, India Baa3 and Philippines B.
29 MOODY’S INVESTORS’ SERVICE (2005). Guide to Moody’s ratings, rating processes and rating
practices. www.moodys.com

58
The Network Readiness Index 2004 - 2005
Part of the World Economic Forum’s annual Global Information Technology Report
written by Professor Klaus Schwab, the Network Readiness Index (NRI) measures the
“degree of preparation of a nation or community to participate in and benefit from
ICT developments” (Dutta, Jain, 2005, ix30) across 104 nations. The index comprises
three component parts that result in a holistic gauge of network readiness. These
include the ICT environment offered by the country, the readiness of the community’s
key stakeholders (individuals, business or government) and the usage of ICT’s among
these stakeholders.
When looking at the current rankings, two important points should be noted:
� South Africa’s rating improved, while Ireland was static and Israel dropped.
� While both India and the Philippines improved their positions, South Africa is still
ranked above them both.
For more information, visit www.weforum.org/.
30DUTTA, JAIN, 2005. “An analysis of the Diffusion and Usage of information and Communication
Technologies of Nations” in The Global information Technology Report 2004-2005, World Economic
Forum as taken from the Executive Summary page ix.

59
BSA / IDC Software Piracy Rankings 2005
With a total of 83 countries included, the study is compiled “using proprietary
statistics for software and hardware shipments, more than 7000 interviews in 23
countries [and] enlisted IDC analysts in over 50 countries to review local market
conditions.”31
The table below highlights South Africa against the comparator countries, although a
complete list of the rankings can be found at www.bsa.org/globalstudy.
Selected Software Piracy Rankings, 2005 Israel 33%
South Africa 37%
Ireland 38%
Philippines 71%
India 74%
South Africa Israel and Ireland all fall within the top 20 countries in the study for
lowest piracy rates. Of particular interest is the mention made of South Africa’s
position above the median, although it was once considered to be a high piracy locale,
as well as the attention given to India, as the high piracy rate is considered to be major
restraint for their packaged software BPO industry.
31 BUSINESS SOFTWARE ALLIANCE, 2005. Second annual BSA and IDC global software piracy
study. www.bsa.org/globalstudy.

60
APPENDIX D: CALL CENTRE/BPO OPERATIONS IN KWAZULU-NATAL
Firm Name Call Centre/ BPO
Operations in KZN
Survey
Participant
3 - C 1
ADT 1 �
Alpha Pharm 1 �
Amawundlu Investment Holdings 1
BizWorks 1
Blake 3 �
Brian Adams Associates 1
Business Connection 4
Butterworths 1
Cell C 1 �
CellTalk 1
Choicetech 1
Chubb Security 1
Club Leisure 3 �
Coin Armed Reaction 1
Comparex 1
Consumer Credit 2 �
Credcor 1
Damelin 1
Direct Channel Marketing 1 �
Discovery Health 1
Edcon 1 �
Enforce Security 1
Eskom 1 �
eThekwini Municipality - Electricity 1 �
eThekwini Municipality - Emergency Services 1
eThekwini Municipality - Engineering 1
eThekwini Municipality - Treasury 1
eThekwini Municipality - Water & Sanitation 1
Franke Kitchens 1
Gold Circle 1 �
Hotline 2
Hullett Aluminium 1 �

61
Independent Newspapers 2 �
I-talk Cellular 1
Moody, Ford & Partners 1
Mr Price Group 1
MTN 1 �
Nature Conservation / KZN Wildlife 1
Nedbank 1 �
Optima Holidays 1
Pharos 1 �
Relyant Retail 1 �
Rewards 1
SA Homeloans 2 �
SAA 1
SARS 1
Select Online 1 �
Sovereign 1 �
Standard Bank 1 �
Telkom 4
Transtel 1
Unilever 1 �
Total 67 22

62
APPENDIX E: EXCHANGE RATES
The following exchange rates were used:
Currency Rands per unit
US$ 6.50
GBP 11.50

63
APPENDIX F: CONTACT DETAILS
This report was produced for KZNonSOURCE by B&M Analysts.
For further information please contact:
KZNonSOURCE
William Goldstone
Chief Executive Officer
KZNonSOURCE
26th Floor, Old Mutual Centre
303 West Street Durban
4000
South Africa
PO Box 1203
Durban 4000
South Africa
Tel: + 27 (0)31 336 2516
Fax: + 27 (0)31 336 2641
E-mail: [email protected]
www.kznonsource.co.za
B&M Analysts
Douglas Comrie
Operations Director
B&M Analysts
1st Floor, 8 Old Main Road
Hillcrest
3610
South Africa
PostNet Suite 10139
Private Bag X1005
Hillcrest 3650
South Africa
Tel: + 27 (0)31 765 3870
Fax: +27 (0)31 765 3873
E-mail: [email protected]
www.bmanalysts.com

64
LIST OF SOURCES
ACA RESEARCH (2003). The 2003 Philippines call centre industry benchmark
study. An operational overview of the call centre market.
Callcentres.net: Sydney
AT KEARNEY (2004). 2004 Offshore location attractiveness index. Making offshore
decisions. AT Kearney, Inc: Chicago
BOUSFIELD, P (2003). The case for call centre outsourcing. Interactive Marketing,
vol. 5 no. 2. Reference 1463 – 5178. Henry Stewart
Publications.
BUSINESS SOFTWARE ALLIANCE (2005). Second annual BSA and IDC global
software piracy study. BSA: http://www.bsa.org/globalstudy
CATALYST (2005). Jerusalem, Israel. A world class location for business process
outsourcing and contact centres. Startup Jerusalem: Jerusalem
CONTROL RISKS GROUP (2005). Foreign Direct Investment: South Africa.
Financial Times Business: http://www.fdimagazine.com/news
THE DEPARTMENT OF TRADE AND INDUSTRY (2004). Research Study into
the BPO / CC Industry in South Africa: Summary of Secondary
Research as input to the Study.
DUTTA, S, JAIN, A (2005). An analysis of the diffusion and usage of information
and communication technologies of nations. The Global
Information Technology Report. World Economic Forum:
http://www.weforum.org/site/homepublics.nsf

65
GENTLE, C (2003). The cusp of a revolution. How offshoring will transform the
financial services industry. Deloitte Research: London
KELLY (2004). The Kelly Salary Survey 2004. Kelly: http://www.kelly.co.za
LOPEZ-CLAROS, A, (2004). Global Competitiveness Report 2003-2004. World
Economic Forum:
http://www.weforum.org/site/homepublics.nsf
MERCHANTS (2005). Global contact centre benchmarking report. Dimension Data:
London
MOODY’S INVESTORS’ SERVICE (2005).
http//www.moodys.com/cust/default.asp
MITIAL RESEARCH (2002). South Africa 2002/3 call centre country report. Mitial
Research: Johannesburg
SAPOA (2004/5). Office vacancy surveys June, September, December 2004;
March 2005. South African Property Owners Association:
Johannesburg
SOUTH AFRICAN CITIES NETWORK (2005). WEFA forecast 2002. South
African Cities Network: http://www.sacities.net/left/profiles
durban.stm
SOUTHAFRICA.INFO (2005). S & P Boosts SA’s credit rating.
http://www.SouthAfrica.info/pls/procs/iac.
STATISTICS SOUTH AFRICA (1999). Provincial Profile 1999: Gauteng.
STATISTICS SOUTH AFRICA (website). www.statssa.gov.za.

66
TOSCA (2004). D1 Inventory report: Ireland. Tosca: http://www.cwu.ie
TRANSPARENCY INTERNATIONAL (2004). Corruption Perceptions Index 2004.
Transparency International: http://www.transparency.org
UNCTAD (2004). World Investment Report 2004. The shift towards services.
United Nations Conference on Trade and Development: New
York and Geneva
WORLD BANK (2005). World Development Indicators Database. World Bank:
http://worldbank.com
WORLD ECONOMIC FORUM (2005). Global Competitiveness report 2004.
World Economic Forum:
http://www.weforum.org/site/homepublics.nsf
WORLD ECONOMIC FORUM (2005). Global Information Technology Report
2004-2005 Network Readiness Index. World Economic Forum:
http://www.weforum.org/site/homepublics.nsf