l ab or m arket i ndustr y profile florida aviation...
TRANSCRIPT

FloridaAviation &
Industry
2017 Edition
Source: Florida Department of Economic Opportunity, Bureau of Labor Market Statistics
L a b o r M a r k e t I n d u s t r y P r o f i l e
Aerospace

Florida Aviation and Aerospace Industry Cluster
Florida’s aviation and aerospace industry cluster is comprised of the aviation industry (Part I) and the aerospace industry (Part II). Some of the largest industry sectors by employment within the aviation and aerospace industry include: scheduled passenger air transportation; other support activities for air transportation; other airport operations; and search, detection, and navigation instruments manufacturing.
The aviation and aerospace industry had 2,233 establishments in June 2016, with
employment of 98,496. Employment was up 5,490 jobs (+5.9 percent) from June 2015.
Aviation and Aerospace employment reached a low of 78,102 jobs in October 2004 and
has increased since that time. From its trough in October 2004, this industry has gained
20,394 jobs (+26.1 percent).
Source: Florida Department of Economic Opportunity, Bureau of Labor Market Statistics, Quarterly Census of Employment and Wages program (QCEW).
2
Florida Aviation Industry, Part I
Florida has a rich history of aviation firsts, being the site of the first night flight in aviation history (Tampa, 1911) and having the world’s first scheduled airline service (St. Petersburg to Tampa, 1914). Florida is the birthplace of commercial aviation and the air transportation hub of the Western Hemisphere, according to Enterprise Florida, Inc. Florida commercial airports accommodate more than 144.9 million passengers annually. The aviation industry in Florida includes air transportation, support activities for air transportation, and flight training.
The aviation industry includes the following detailed subsectors: scheduled passenger
and freight air transportation; nonscheduled chartered passenger and freight air
transportation; other nonscheduled air transportation; air traffic control; other airport
operations; other support activities for air transportation; and flight training.
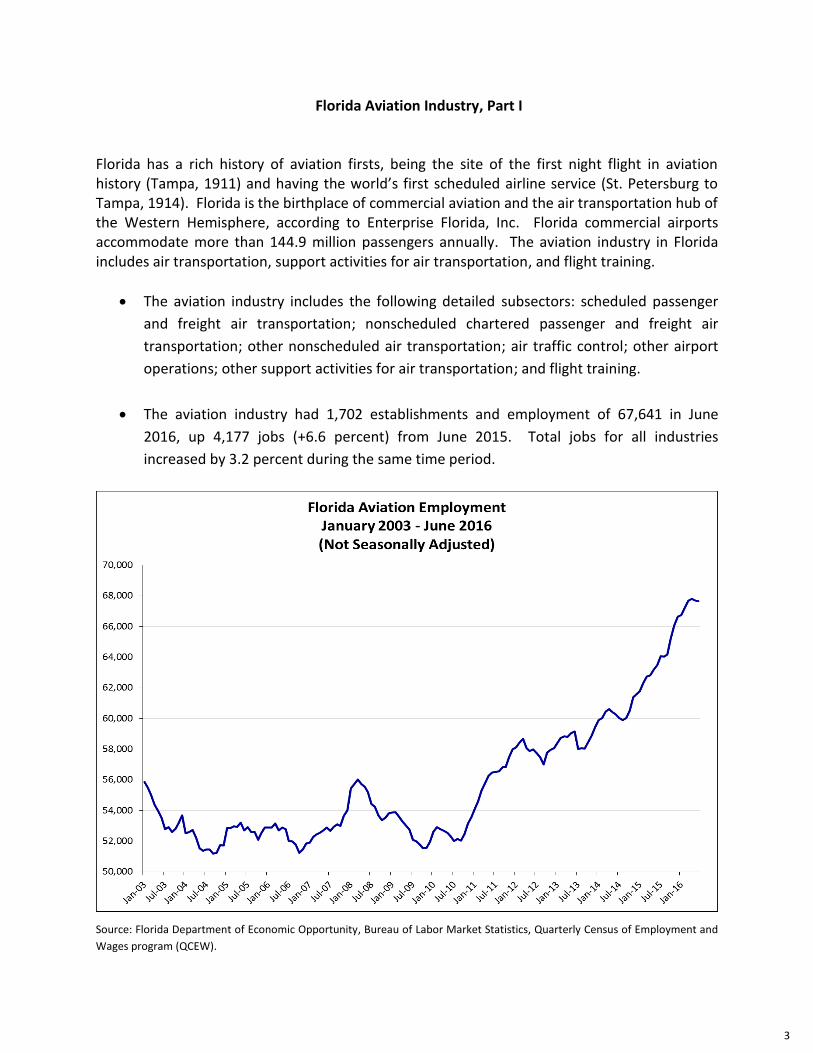
The aviation industry had 1,702 establishments and employment of 67,641 in June
2016, up 4,177 jobs (+6.6 percent) from June 2015. Total jobs for all industries
increased by 3.2 percent during the same time period.
Source: Florida Department of Economic Opportunity, Bureau of Labor Market Statistics, Quarterly Census of Employment and
Wages program (QCEW).
3
Florida aviation employment was on a downward trend from March 2008 to October 2009, but it has shown an upward trend since its October 2009 trough. Employment increased by 16,116 jobs (+31.3 percent) from October 2009 to June 2016. Total employment for all industries increased by 15.0 percent over the same time period, a modest growth rate in comparison to aviation.
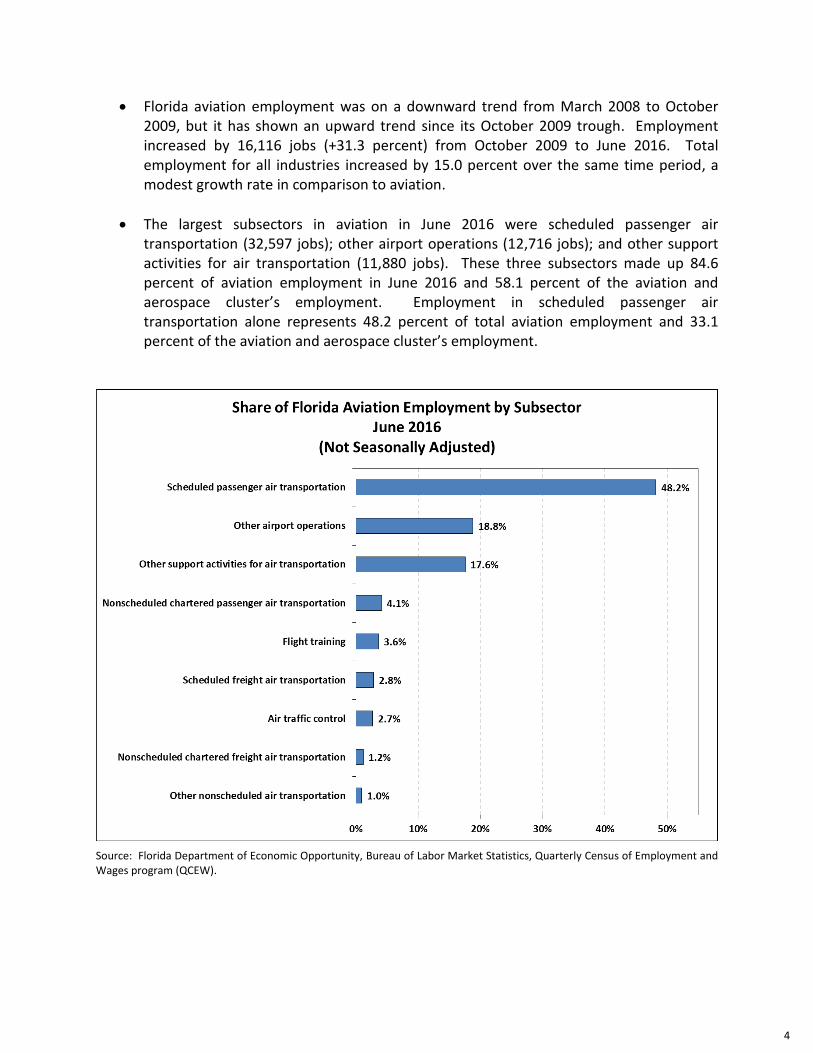
The largest subsectors in aviation in June 2016 were scheduled passenger air transportation (32,597 jobs); other airport operations (12,716 jobs); and other support activities for air transportation (11,880 jobs). These three subsectors made up 84.6 percent of aviation employment in June 2016 and 58.1 percent of the aviation and aerospace cluster’s employment. Employment in scheduled passenger air transportation alone represents 48.2 percent of total aviation employment and 33.1 percent of the aviation and aerospace cluster’s employment.
Source: Florida Department of Economic Opportunity, Bureau of Labor Market Statistics, Quarterly Census of Employment and Wages program (QCEW).
4

Within the aviation industry, scheduled passenger air transportation gained the most jobs over the year in June 2016 (+1,911 jobs, +6.2 percent). The subsector losing the most jobs over the year in aviation was scheduled freight air transportation (-126 jobs, -6.1 percent).
Source: Florida Department of Economic Opportunity, Bureau of Labor Market Statistics, Quarterly Census of Employment and Wages Program.
Aviation’s 2015 average annual wage increased more than the average wage for all industries over the year. The 2015 average annual wage for workers in the aviation industry was $62,514, an increase of $1,825 (+3.0 percent) from 2014. The average annual wage for all industries grew by $1,430 (+3.2 percent) over the year.
The aviation industry’s 2015 average annual wage exceeded the average annual wage for all industries by $16,274 (+35.2 percent). The average annual wage difference in 2014 was $15,879 (+35.4 percent).
The air traffic control subsector had an average annual wage of $100,712 in 2015, the highest in aviation. Other airport operations had the lowest average annual wage in
5
2015 ($34,803). Eight of the nine subsectors in aviation had 2015 average annual wages exceeding $50,000. Compared to the average annual wage for all industries in 2015 ($46,240), most aviation subsectors had relatively high average annual wages.
All Education and Training Levels
Source: Florida Department of Economic Opportunity, Bureau of Labor Market Statistics, Long Term Projections Program, forecast to 2024. Projections to the year 2024 assume continued economic recovery.
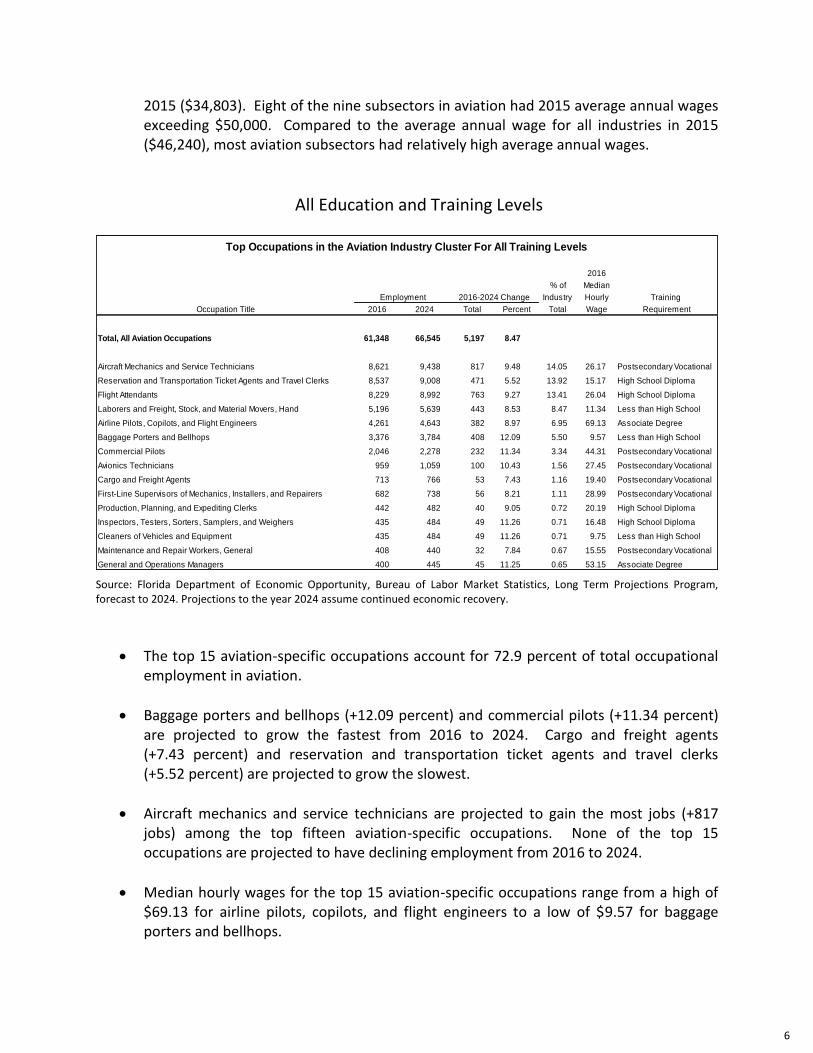
The top 15 aviation-specific occupations account for 72.9 percent of total occupational employment in aviation.
Baggage porters and bellhops (+12.09 percent) and commercial pilots (+11.34 percent) are projected to grow the fastest from 2016 to 2024. Cargo and freight agents (+7.43 percent) and reservation and transportation ticket agents and travel clerks (+5.52 percent) are projected to grow the slowest.
Aircraft mechanics and service technicians are projected to gain the most jobs (+817 jobs) among the top fifteen aviation-specific occupations. None of the top 15 occupations are projected to have declining employment from 2016 to 2024.
Median hourly wages for the top 15 aviation-specific occupations range from a high of $69.13 for airline pilots, copilots, and flight engineers to a low of $9.57 for baggage porters and bellhops.
2016
% of Median
Employment Industry Hourly Training
Occupation Title 2016 2024 Total Percent Total Wage Requirement
Total, All Aviation Occupations 61,348 66,545 5,197 8.47
Aircraft Mechanics and Service Technicians 8,621 9,438 817 9.48 14.05 26.17 Postsecondary Vocational
Reservation and Transportation Ticket Agents and Travel Clerks 8,537 9,008 471 5.52 13.92 15.17 High School Diploma
Flight Attendants 8,229 8,992 763 9.27 13.41 26.04 High School Diploma
Laborers and Freight, Stock, and Material Movers, Hand 5,196 5,639 443 8.53 8.47 11.34 Less than High School
Airline Pilots, Copilots, and Flight Engineers 4,261 4,643 382 8.97 6.95 69.13 Associate Degree
Baggage Porters and Bellhops 3,376 3,784 408 12.09 5.50 9.57 Less than High School
Commercial Pilots 2,046 2,278 232 11.34 3.34 44.31 Postsecondary Vocational
Avionics Technicians 959 1,059 100 10.43 1.56 27.45 Postsecondary Vocational
Cargo and Freight Agents 713 766 53 7.43 1.16 19.40 Postsecondary Vocational
First-Line Supervisors of Mechanics, Installers, and Repairers 682 738 56 8.21 1.11 28.99 Postsecondary Vocational
Production, Planning, and Expediting Clerks 442 482 40 9.05 0.72 20.19 High School Diploma
Inspectors, Testers, Sorters, Samplers, and Weighers 435 484 49 11.26 0.71 16.48 High School Diploma
Cleaners of Vehicles and Equipment 435 484 49 11.26 0.71 9.75 Less than High School
Maintenance and Repair Workers, General 408 440 32 7.84 0.67 15.55 Postsecondary Vocational
General and Operations Managers 400 445 45 11.25 0.65 53.15 Associate Degree
Top Occupations in the Aviation Industry Cluster For All Training Levels
2016-2024 Change
6
None of the top fifteen occupations require a bachelor’s degree, but 8 require training beyond high school.
Bachelor’s Degree or Higher
Source: Florida Department of Economic Opportunity, Bureau of Labor Market Statistics, Long Term Projections Program, forecast to 2024. Projections to the year 2024 assume continued economic recovery.
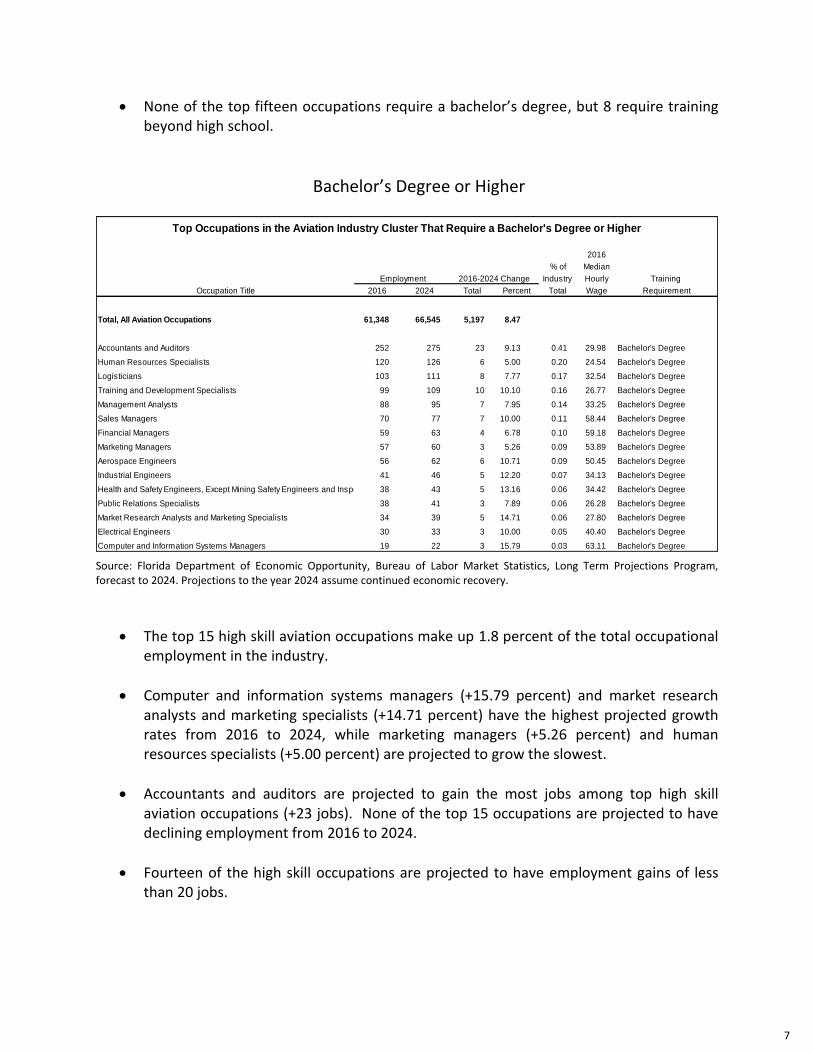
The top 15 high skill aviation occupations make up 1.8 percent of the total occupational employment in the industry.
Computer and information systems managers (+15.79 percent) and market research analysts and marketing specialists (+14.71 percent) have the highest projected growth rates from 2016 to 2024, while marketing managers (+5.26 percent) and human resources specialists (+5.00 percent) are projected to grow the slowest.
Accountants and auditors are projected to gain the most jobs among top high skill aviation occupations (+23 jobs). None of the top 15 occupations are projected to have declining employment from 2016 to 2024.
Fourteen of the high skill occupations are projected to have employment gains of less than 20 jobs.
2016
% of Median
Employment Industry Hourly Training
Occupation Title 2016 2024 Total Percent Total Wage Requirement
Total, All Aviation Occupations 61,348 66,545 5,197 8.47
Accountants and Auditors 252 275 23 9.13 0.41 29.98 Bachelor's Degree
Human Resources Specialists 120 126 6 5.00 0.20 24.54 Bachelor's Degree
Logisticians 103 111 8 7.77 0.17 32.54 Bachelor's Degree
Training and Development Specialists 99 109 10 10.10 0.16 26.77 Bachelor's Degree
Management Analysts 88 95 7 7.95 0.14 33.25 Bachelor's Degree
Sales Managers 70 77 7 10.00 0.11 58.44 Bachelor's Degree
Financial Managers 59 63 4 6.78 0.10 59.18 Bachelor's Degree
Marketing Managers 57 60 3 5.26 0.09 53.89 Bachelor's Degree
Aerospace Engineers 56 62 6 10.71 0.09 50.45 Bachelor's Degree
Industrial Engineers 41 46 5 12.20 0.07 34.13 Bachelor's Degree
Health and Safety Engineers, Except Mining Safety Engineers and Inspectors 38 43 5 13.16 0.06 34.42 Bachelor's Degree
Public Relations Specialists 38 41 3 7.89 0.06 26.28 Bachelor's Degree
Market Research Analysts and Marketing Specialists 34 39 5 14.71 0.06 27.80 Bachelor's Degree
Electrical Engineers 30 33 3 10.00 0.05 40.40 Bachelor's Degree
Computer and Information Systems Managers 19 22 3 15.79 0.03 63.11 Bachelor's Degree
Top Occupations in the Aviation Industry Cluster That Require a Bachelor's Degree or Higher
2016-2024 Change
7

Median hourly wages for the top 15 high skill aviation occupations range from a high of $63.11 for computer and information systems managers to a low of $24.54 for human resources specialists.
All of the top 15 high skill aviation occupations require a bachelor’s degree.
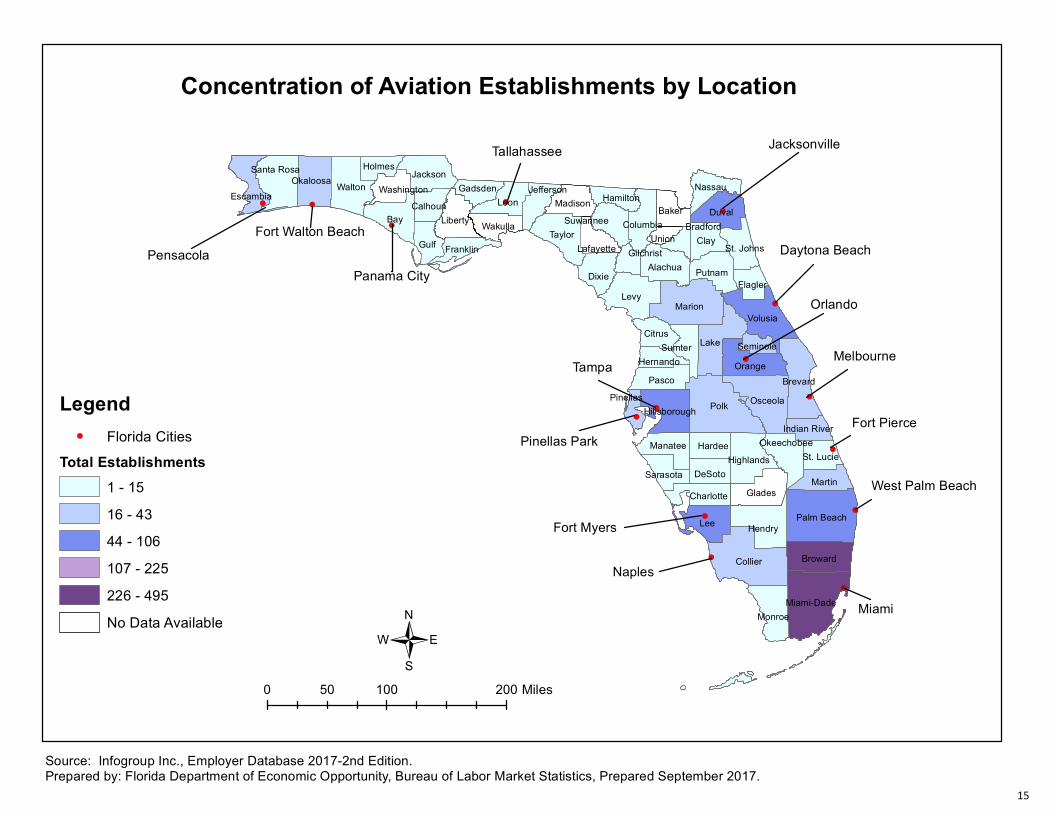
Aviation employment is concentrated in the southeast, central, and northeast parts of Florida with the largest number of jobs found in Miami-Dade, Broward, Orange, Palm Beach, Hillsborough, Brevard, and Duval counties.
8
Florida Aerospace Industry, Part II
Florida is known as the premier location in the world for space technologies. Virtually every major aerospace company and defense contractor from the U.S. and abroad has operations in Florida. The state has been a center for aerospace research and testing since 1946. Florida’s aerospace industry includes search, detection, and navigation instrument manufacturing; aerospace product and parts manufacturing; and satellite communications.
The aerospace industry includes the following detailed subsectors: search, detection, and navigation instruments manufacturing; aircraft manufacturing; aircraft engine and engine parts manufacturing; other aircraft parts and auxiliary equipment manufacturing; guided missile and space vehicle manufacturing; guided missile and space vehicle propulsion unit and other parts manufacturing; other guided missile and space vehicle parts and auxiliary equipment manufacturing; and satellite telecommunications.
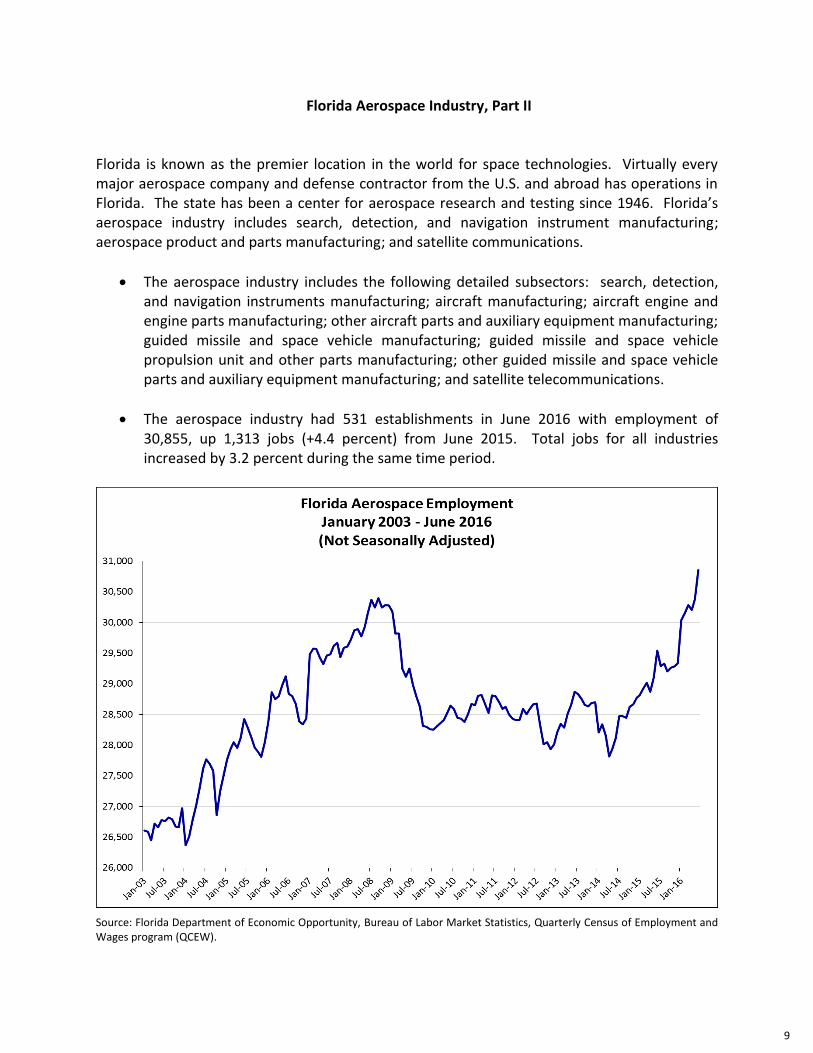
The aerospace industry had 531 establishments in June 2016 with employment of 30,855, up 1,313 jobs (+4.4 percent) from June 2015. Total jobs for all industries increased by 3.2 percent during the same time period.
Source: Florida Department of Economic Opportunity, Bureau of Labor Market Statistics, Quarterly Census of Employment and Wages program (QCEW).
9
Aerospace employment was on an upward trend from January 2003 to September 2008, peaking at 30,395 jobs in September 2008. From September 2008 to January 2010 the industry followed a negative trend, losing 2,141 jobs (-7.0 percent). Employment stabilized from January 2010 to July 2012, before dropping to the most recent low of 27,817 jobs in April 2014. From this low, aerospace employment has shown some improvement, gaining 3,038 jobs (+10.9 percent) by June 2016.
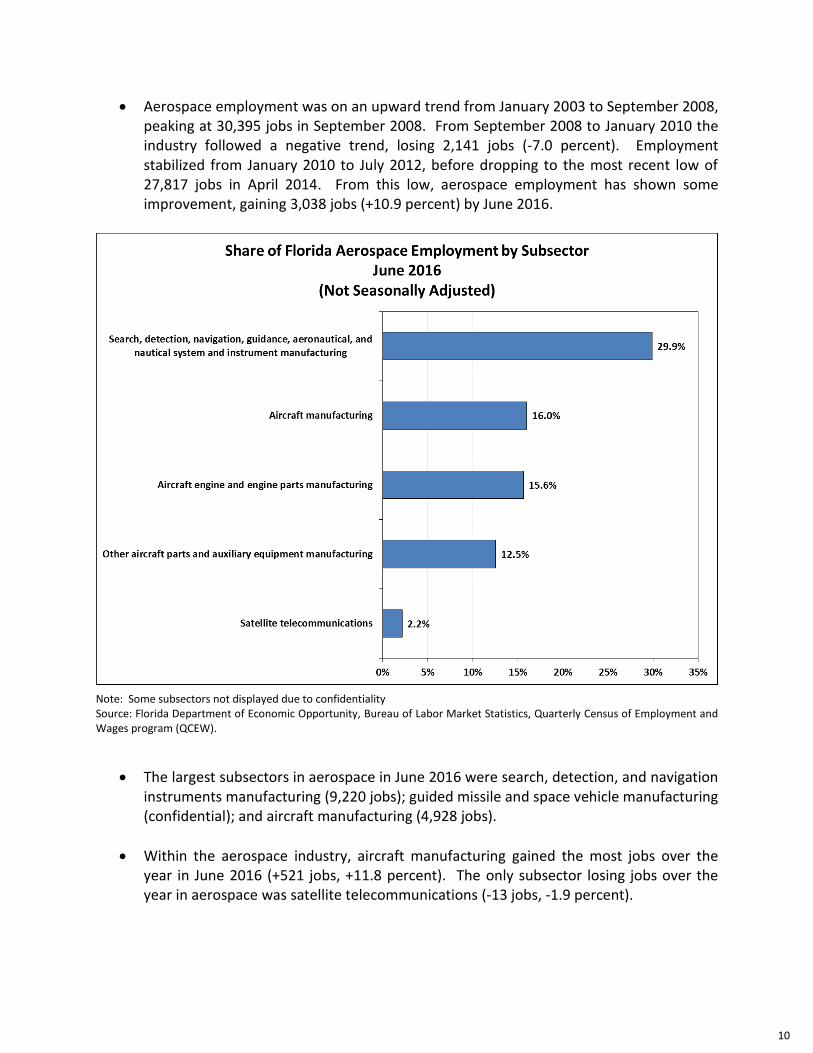
Note: Some subsectors not displayed due to confidentiality Source: Florida Department of Economic Opportunity, Bureau of Labor Market Statistics, Quarterly Census of Employment and Wages program (QCEW).
The largest subsectors in aerospace in June 2016 were search, detection, and navigation instruments manufacturing (9,220 jobs); guided missile and space vehicle manufacturing (confidential); and aircraft manufacturing (4,928 jobs).
Within the aerospace industry, aircraft manufacturing gained the most jobs over the year in June 2016 (+521 jobs, +11.8 percent). The only subsector losing jobs over the year in aerospace was satellite telecommunications (-13 jobs, -1.9 percent).
10
Source: Florida Department of Economic Opportunity, Bureau of Labor Market Statistics, Quarterly Census of Employment and Wages program (QCEW).
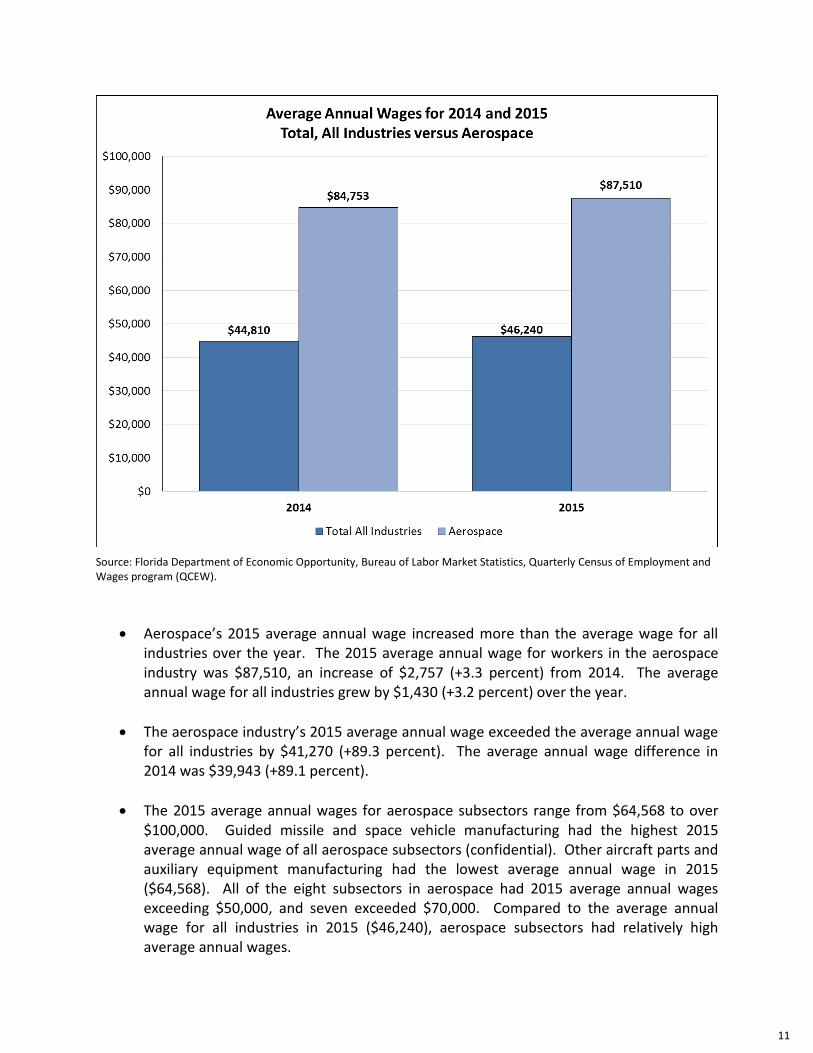
Aerospace’s 2015 average annual wage increased more than the average wage for all industries over the year. The 2015 average annual wage for workers in the aerospace industry was $87,510, an increase of $2,757 (+3.3 percent) from 2014. The average annual wage for all industries grew by $1,430 (+3.2 percent) over the year.
The aerospace industry’s 2015 average annual wage exceeded the average annual wage for all industries by $41,270 (+89.3 percent). The average annual wage difference in 2014 was $39,943 (+89.1 percent).
The 2015 average annual wages for aerospace subsectors range from $64,568 to over $100,000. Guided missile and space vehicle manufacturing had the highest 2015 average annual wage of all aerospace subsectors (confidential). Other aircraft parts and auxiliary equipment manufacturing had the lowest average annual wage in 2015 ($64,568). All of the eight subsectors in aerospace had 2015 average annual wages exceeding $50,000, and seven exceeded $70,000. Compared to the average annual wage for all industries in 2015 ($46,240), aerospace subsectors had relatively high average annual wages.
11
All Education and Training Levels
Source: Florida Department of Economic Opportunity, Bureau of Labor Market Statistics, Long Term Projections Program, forecast to 2024. Projections to the year 2024 assume continued economic recovery.
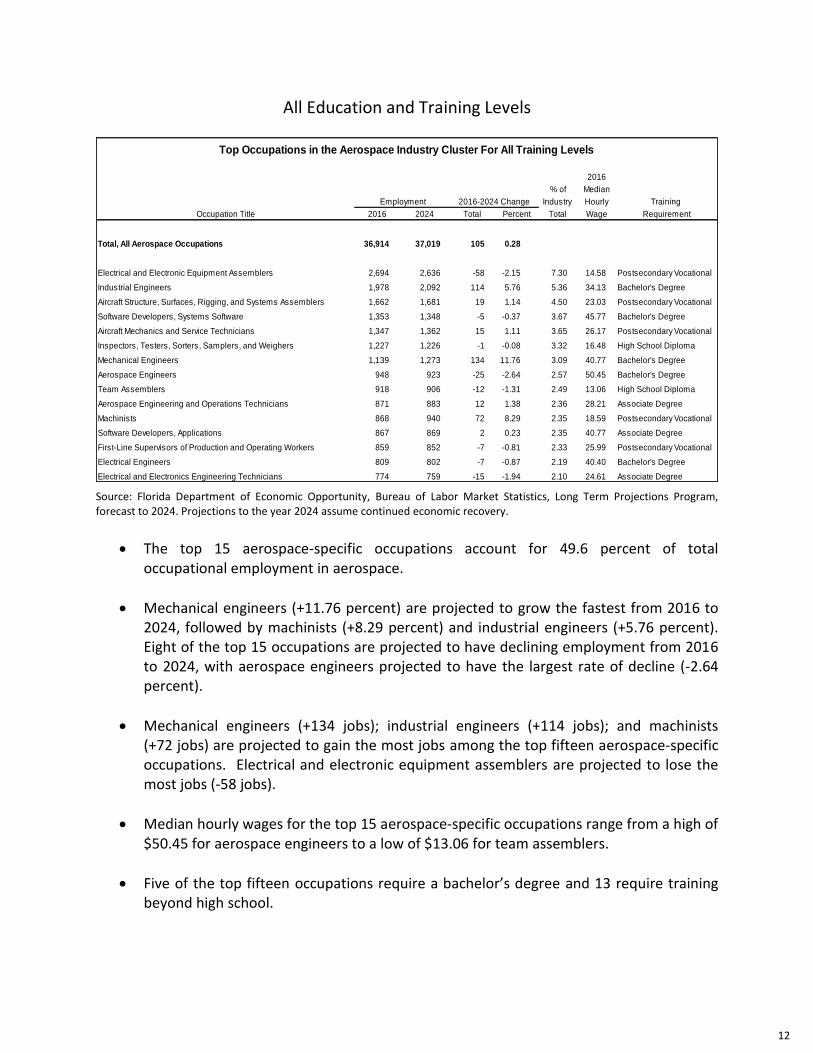
The top 15 aerospace-specific occupations account for 49.6 percent of total occupational employment in aerospace.
Mechanical engineers (+11.76 percent) are projected to grow the fastest from 2016 to 2024, followed by machinists (+8.29 percent) and industrial engineers (+5.76 percent). Eight of the top 15 occupations are projected to have declining employment from 2016 to 2024, with aerospace engineers projected to have the largest rate of decline (-2.64 percent).
Mechanical engineers (+134 jobs); industrial engineers (+114 jobs); and machinists (+72 jobs) are projected to gain the most jobs among the top fifteen aerospace-specific occupations. Electrical and electronic equipment assemblers are projected to lose the most jobs (-58 jobs).
Median hourly wages for the top 15 aerospace-specific occupations range from a high of $50.45 for aerospace engineers to a low of $13.06 for team assemblers.
Five of the top fifteen occupations require a bachelor’s degree and 13 require training beyond high school.
2016
% of Median
Employment Industry Hourly Training
Occupation Title 2016 2024 Total Percent Total Wage Requirement
Total, All Aerospace Occupations 36,914 37,019 105 0.28
Electrical and Electronic Equipment Assemblers 2,694 2,636 -58 -2.15 7.30 14.58 Postsecondary Vocational
Industrial Engineers 1,978 2,092 114 5.76 5.36 34.13 Bachelor's Degree
Aircraft Structure, Surfaces, Rigging, and Systems Assemblers 1,662 1,681 19 1.14 4.50 23.03 Postsecondary Vocational
Software Developers, Systems Software 1,353 1,348 -5 -0.37 3.67 45.77 Bachelor's Degree
Aircraft Mechanics and Service Technicians 1,347 1,362 15 1.11 3.65 26.17 Postsecondary Vocational
Inspectors, Testers, Sorters, Samplers, and Weighers 1,227 1,226 -1 -0.08 3.32 16.48 High School Diploma
Mechanical Engineers 1,139 1,273 134 11.76 3.09 40.77 Bachelor's Degree
Aerospace Engineers 948 923 -25 -2.64 2.57 50.45 Bachelor's Degree
Team Assemblers 918 906 -12 -1.31 2.49 13.06 High School Diploma
Aerospace Engineering and Operations Technicians 871 883 12 1.38 2.36 28.21 Associate Degree
Machinists 868 940 72 8.29 2.35 18.59 Postsecondary Vocational
Software Developers, Applications 867 869 2 0.23 2.35 40.77 Associate Degree
First-Line Supervisors of Production and Operating Workers 859 852 -7 -0.81 2.33 25.99 Postsecondary Vocational
Electrical Engineers 809 802 -7 -0.87 2.19 40.40 Bachelor's Degree
Electrical and Electronics Engineering Technicians 774 759 -15 -1.94 2.10 24.61 Associate Degree
Top Occupations in the Aerospace Industry Cluster For All Training Levels
2016-2024 Change
12

Bachelor’s Degree
Source: Florida Department of Economic Opportunity, Bureau of Labor Market Statistics, Long Term Projections Program, forecast to 2024. Projections to the year 2024 assume continued economic recovery.
The top 15 high skill aerospace occupations make up 25.2 percent of the total occupational employment in the industry.
Mechanical engineers (+11.76 percent) and market research analysts and marketing specialists (+6.16 percent) have the highest projected growth rates from 2016 to 2024. Nine of the top 15 high skill occupations are projected to have declining employment from 2016 to 2024, with human resources specialists projected to have the largest rate of decline (-3.07 percent).
Mechanical engineers are projected to gain the most jobs among top high skill aerospace occupations (+134 jobs). Aerospace engineers (-25 jobs) are projected to lose the most jobs from 2016 to 2024.
Median hourly wages for the top 15 high skill aerospace occupations range from a high of $63.11 for computer and information systems managers to a low of $24.54 for human resources specialists.
All of the top 15 high skill aerospace occupations requires a bachelor’s degree.
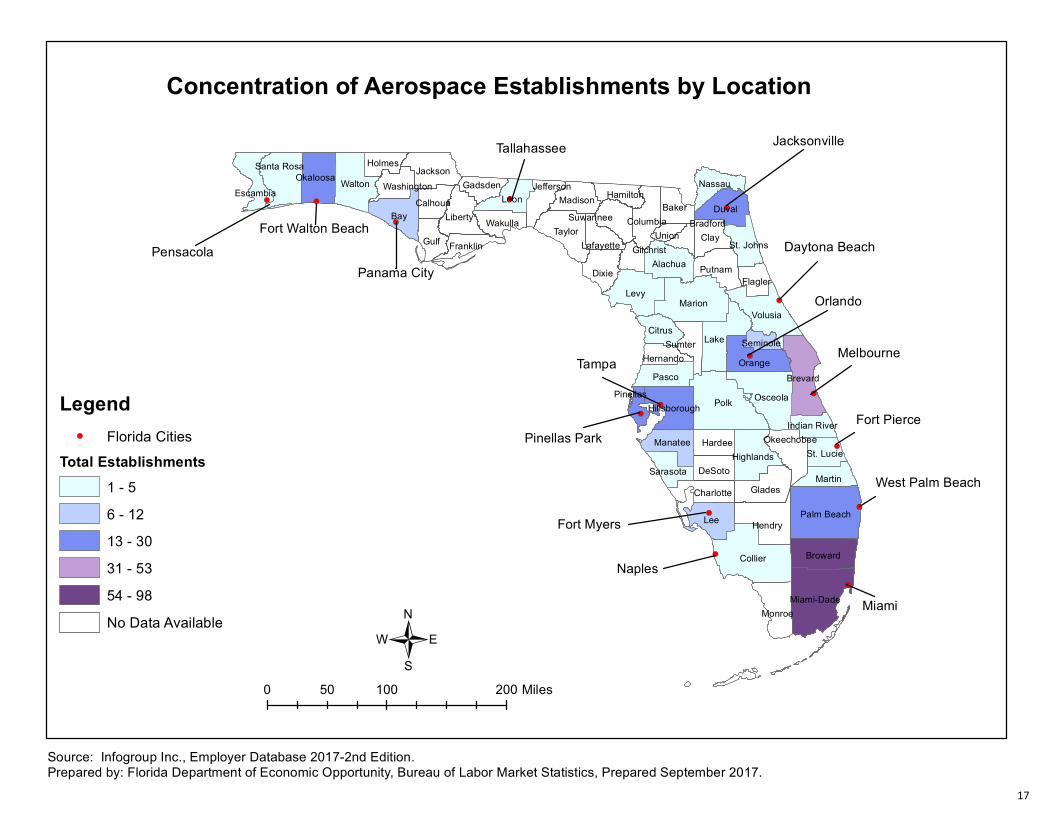
Aerospace employment is concentrated along the coast in south, central, northeastern and northwestern Florida with the largest number of jobs found in Brevard, Orange, Palm Beach, Pinellas, Broward, Miami-Dade, and Okaloosa counties.
2016
% of Median
Employment Industry Hourly Training
Occupation Title 2016 2024 Total Percent Total Wage Requirement
Total, All Aerospace Occupations 36,914 37,019 105 0.28
Industrial Engineers 1,978 2,092 114 5.76 5.36 34.13 Bachelor's Degree
Software Developers, Systems Software 1,353 1,348 -5 -0.37 3.67 45.77 Bachelor's Degree
Mechanical Engineers 1,139 1,273 134 11.76 3.09 40.77 Bachelor's Degree
Aerospace Engineers 948 923 -25 -2.64 2.57 50.45 Bachelor's Degree
Electrical Engineers 809 802 -7 -0.87 2.19 40.40 Bachelor's Degree
Architectural and Engineering Managers 634 627 -7 -1.10 1.72 59.00 Bachelor's Degree
Financial Analysts 375 380 5 1.33 1.02 34.18 Bachelor's Degree
Computer and Information Systems Managers 372 371 -1 -0.27 1.01 63.11 Bachelor's Degree
Logisticians 350 351 1 0.29 0.95 32.54 Bachelor's Degree
Electronics Engineers, Except Computer 339 331 -8 -2.36 0.92 43.64 Bachelor's Degree
Accountants and Auditors 317 316 -1 -0.32 0.86 29.98 Bachelor's Degree
Technical Writers 198 199 1 0.51 0.54 29.07 Bachelor's Degree
Management Analysts 186 185 -1 -0.54 0.50 33.25 Bachelor's Degree
Human Resources Specialists 163 158 -5 -3.07 0.44 24.54 Bachelor's Degree
Market Research Analysts and Marketing Specialists 146 155 9 6.16 0.40 27.80 Bachelor's Degree
Top Occupations in the Aerospace Industry Cluster That Require a Bachelor's Degree or Higher
2016-2024 Change
13

!(
!(!(!(
!(
!(
!(
!(
!(
!(
!(
!(!(
!(
!(
PensacolaFort Walton Beach
Panama City
TallahasseeJacksonville
Tampa
Pinellas Park
Fort Myers
Naples
Daytona Beach
Orlando
Melbourne
Fort Pierce
West Palm Beach
Miami
Polk
Collier
LevyMarion
Lake
Bay
Lee
Osceola
Palm Beach
Taylor
Volusia
Walton
Brevard
Miami-Dade
Hendry
Duval
Dixie
Clay
Leon
Broward
Gulf
Glades
Orange
Liberty
Monroe
Pasco
Alachua
Jackson
Highlands
Putnam
Martin
Citrus
Baker
Manatee
Nassau
Madison
Hardee
DeSoto
Wakulla
Charlotte
Flagler
St. Lucie
Franklin
Holmes
Lafayette
HamiltonGadsdenOkaloosa
Santa Rosa
Hillsborough
Columbia
Sumter
Escambia
St. Johns
Calhoun
Okeechobee
Jefferson
Sarasota
Suwannee
Washington
Hernando
Indian River
Gilchrist
Union
Pinellas
Seminole
Bradford
Concentration of Aviation Employment
Legend!( Florida Cities
Employment1 - 1,1031,104 - 4,4784,479 - 10,97510,976 - 23,489No Data Available
Source: Florida Department of Economic Opportunity, Bureau of Labor Market Statistics, Quarterly Census of Employment and Wages(QCEW) Program, 2016q2.
/0 100 20050 Miles
Prepared by: Florida Department of Economic Opportunity, Bureau of Labor Market Statistics, September 2017.14
!(
!(!(!(
!(
!(
!(
!(
!(
!(
!(
!(!(
!(
!(
PensacolaFort Walton Beach
Panama City
Tallahassee Jacksonville
Tampa
Pinellas Park
Fort Myers
Naples
Daytona Beach
Orlando
Melbourne
Fort Pierce
West Palm Beach
Miami
Polk
Collier
LevyMarion
Lake
Bay
Lee
Osceola
Palm Beach
Taylor
Volusia
Walton
Brevard
Miami-Dade
Hendry
Duval
Dixie
Clay
Leon
Broward
Gulf
Glades
Orange
Liberty
Monroe
Pasco
Alachua
Jackson
Highlands
Putnam
Okaloosa
Martin
Citrus
Baker
Santa Rosa
Manatee
Nassau
Hillsborough
Madison
Hardee
Columbia
DeSoto
Wakulla
Charlotte
Sumter
Escambia
Flagler
St. Johns
Calhoun
St. LucieOkeechobee
Franklin
Jefferson
Sarasota
Suwannee
Holmes
Lafayette
HamiltonGadsdenWashington
Hernando
Indian River
GilchristUnion
Seminole
Bradford
Pinellas
Concentration of Aviation Establishments by Location
Legend!( Florida Cities
Total Establishments1 - 1516 - 4344 - 106107 - 225226 - 495No Data Available
/0 100 20050 Miles
Source: Infogroup Inc., Employer Database 2017-2nd Edition.Prepared by: Florida Department of Economic Opportunity, Bureau of Labor Market Statistics, Prepared September 2017.
15

!(
!(!(!(
!(
!(
!(
!(
!(
!(
!(
!(!(
!(
!(
PensacolaFort Walton Beach
Panama City
TallahasseeJacksonville
Tampa
Pinellas Park
Fort Myers
Naples
Daytona Beach
Orlando
Melbourne
Fort Pierce
West Palm Beach
Miami
Polk
Collier
LevyMarion
Lake
Bay
Lee
Osceola
Palm Beach
Taylor
Volusia
Walton
Brevard
Miami-Dade
Hendry
Duval
Dixie
Clay
Leon
Broward
Gulf
Glades
Orange
Liberty
Monroe
Pasco
Alachua
Jackson
Highlands
Putnam
Martin
Citrus
Baker
Manatee
Nassau
Madison
Hardee
DeSoto
Wakulla
Charlotte
Flagler
St. Lucie
Franklin
Holmes
Lafayette
HamiltonGadsdenOkaloosa
Santa Rosa
Hillsborough
Columbia
Sumter
Escambia
St. Johns
Calhoun
Okeechobee
Jefferson
Sarasota
Suwannee
Washington
Hernando
Indian River
Gilchrist
Union
Pinellas
Seminole
Bradford
Concentration of Aerospace Employment
Legend!( Florida Cities
Employment1 - 544545 - 1,7471,748 - 4,6564,657 - 8,499No Data Available
Source: Florida Department of Economic Opportunity, Bureau of Labor Market Statistics, Quarterly Census of Employment and Wages(QCEW) Program, 2016q2.
/0 100 20050 Miles
Prepared by: Florida Department of Economic Opportunity, Bureau of Labor Market Statistics, September 2017.16
!(
!(!(!(
!(
!(
!(
!(
!(
!(
!(
!(!(
!(
!(
PensacolaFort Walton Beach
Panama City
Tallahassee Jacksonville
Tampa
Pinellas Park
Fort Myers
Naples
Daytona Beach
Orlando
Melbourne
Fort Pierce
West Palm Beach
Miami
Polk
Collier
LevyMarion
Lake
Bay
Lee
Osceola
Palm Beach
Taylor
Volusia
Walton
Brevard
Miami-Dade
Hendry
Duval
Dixie
Clay
Leon
Broward
Gulf
Glades
Orange
Liberty
Monroe
Pasco
Alachua
Jackson
Highlands
Putnam
Okaloosa
Martin
Citrus
Baker
Santa Rosa
Manatee
Nassau
Hillsborough
Madison
Hardee
Columbia
DeSoto
Wakulla
Charlotte
Sumter
Escambia
Flagler
St. Johns
Calhoun
St. LucieOkeechobee
Franklin
Jefferson
Sarasota
Suwannee
Holmes
Lafayette
HamiltonGadsdenWashington
Hernando
Indian River
GilchristUnion
Seminole
Bradford
Pinellas
Concentration of Aerospace Establishments by Location
Legend!( Florida Cities
Total Establishments1 - 56 - 1213 - 3031 - 5354 - 98No Data Available
/0 100 20050 Miles
Source: Infogroup Inc., Employer Database 2017-2nd Edition.Prepared by: Florida Department of Economic Opportunity, Bureau of Labor Market Statistics, Prepared September 2017.
17