l- fluctuations of t~e pageos - nasa
TRANSCRIPT

, . .I
I
!'
I . L -
\ t
FURTHER DETERMINATIONS OF THE MAGNITUDE AND BRIGHTNESS
FLUCTUATIONS OF T ~ E PAGEOS SATELLITE
I BY S. H. GENATT
J. E. MOYE E. G. REID
H. E. WALKER
i
SEPTEMBER.1966 I 1,
GODDARD SPACE FLIGHT CENTER
, I - -
c4 (ACCESSION NUMBER) (THRUI 0
1 I
\ ' \ ' 2
b
i IPAOESI 4
( 2
I

FURTHER DETERMINATIONS OF THE MAGNI'I'UDE AND BRIGHTNESS FLUCTUATIONS
O F THE PAGEOS SATELLITE
A p p r o v e d : A
S. H. G e n a t t J. E . Moye E. G. R e i d H. E. Walker ,'
H e a d , Optical S y s t e m s B r .
-;I. - R o b e r t J. C o a t e s C h i e f , A d v a n c e d D e v e l o p m e n t D i v .
/GODDARD SPACE FLIGHT CENTER
G r e e n b e l t , M a r y l a n d

FURTHER DETERMINATIONS OF THE MAGNITUDE AND BRIGHTNESS FLUCTUATIONS
OF THE PAGEOS SATELLITE
S. H. Genatt J. E. Moye E. G. Reid H. E Walker
Advanced Development Division
ABSTRACT
A passage of the PAGEOS satellite was observed electro-optically
on July 13, 1966. this pass was computed to be +l.7 magnitude and its periodic brightness fluctuations were determined to be 39 seconds. These values compare
with +2.i magnitude and 116 seconds period deduced from a passage on June 25, 1966.
The maximum brightness of PAGEOS reached during
The observed reflecting qualities of PAGEOS are unlike those of a perfect sphere leading to the conclusion that the satellite is
deformed .

??URTHER DETERMINATIONS OF THE MAGNITUDE AND BRIGHTNESS FLUCTUATIONS
OF THE PAGEOS SATELLITE
INTRODUCTION A previous paper by Genatt and Moyel discussed a determination of
the magnitude and brightness fluctuations o r the PAGEOS satellite derived
during the first 48 hours orbit of the satellite. In that determination,
a magnitude of +2.1 was derived as the brightest that the satellite
appeared to reach during its fluctuations, and a period for the vari-
ations of 116 seconds was deduced. It was thought instructive some weeks later to attempt to see j u s t
how steady the magnitude of PAGEOS was holding and how inflexible was the
period of its fluctuations. A change in observed brightness of the 100- foot balloon satellite could be interpreted in terms of deformations which
at'fect the effective visible area. A change in its fluctuation period would be igterpreted as a combination of spin rate changes and spacing
of reflectirg deformations over the portion of the sphere being observed.
The Tracki9g Experiment
On July 13, 1966, at approximately 08 h 17" Universal Time, the PAGEOS satellite started a pass across the horizon of the Goddard Optical Research
Facllity. Equipment used to track this pass was essentially that described
in the aforementioned paper; i.e., the RADOT tracking telescope with the
smaller QJestar telescope mounted upon it and boresighted to it, the 56 TVP phototube behind the focal plane of the Questar upon which fell the light
of PAGEOS and comparison stars, and a Mosely X-Y recorder which continuously recorded the brightness of PAGEOS and comparison stars.
A Grediction of this passage was received from the h t a Systems Division
prior to the pass.
north, comparison stars of spectral types borderi-q that of the sun were selected as close as possible to the satellite's trajectory. These stars were to be
used to determine the magnitude of PAGEOS. 1.
Noting that the pass proceeded from the south to west to
Since the passage was predicted to
"A Determination of the Magnitude and Brightness Fluctuations of the PAGEOS Satellite" by S. H. Genatt and J. E GSFC .
Moye, Document No. X-524-66-337,

- 2 -
end near mornir?g t w i l i g h t , a l l comparison stars were observed and t h e i r l i g h t
recorded p r i o r t o t h e beginning of t h e pass .
obtained of t h e nine comparison stars observed during t h i s t r i a l .
Figure 1 i l l u s t r a t e s t h e recordings
The sk ie s through which t h e t r a j e c t o r y advanced both before and during t h e
These e f f e c t s were pass were covered with thir i haze and t h i n s c a t t e r e d clouds.
permit ted t o be absorbed i n the recordings s ince it was presumed t h a t they
would a f f e c t both s a t e l l i t e and stars al i .ke, and a d d i t i o n a l l y t h a t t h e e f f e c t s
of t he haze would be averaged out i.n t he number of comparison stars employed.
PAGEOX asd Compari.so:rl S t a r s Recordkgs
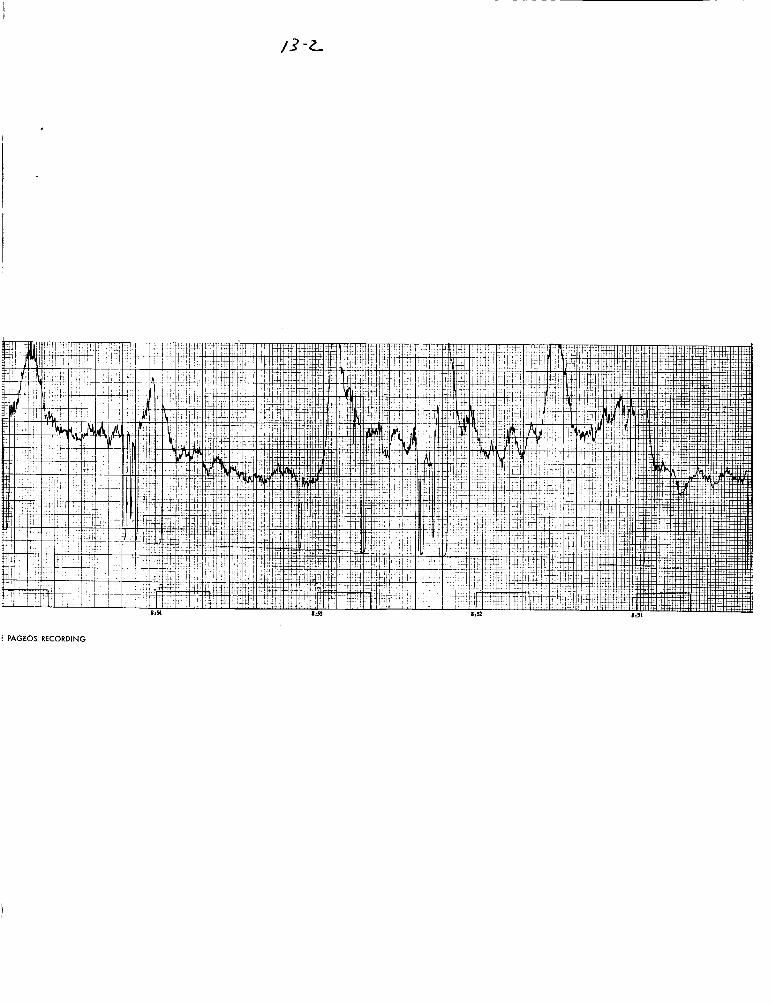
Figure 2., a, b , c , a9d d, i s a reproduct ion of t h e l i g h t recording obtained - of PAGEOS during th;s pass .
a r e the background skyl ight devo2.d of v i s i b l e stars p lus tube noise .
I-? both Figures 1 and 2, t h e minima of t.he curves
The cha r t rec0rdf:i.g of Pageos w a s run at, a speed t o make The x-axis have
-2 sca1.c of o:.,e i?c? equal t o t.en seconds of t.i.me wh.'ile t he y-axis scale w a s one
.1.:.ich equa.1 +,o 20 m:il l ivol t s . Most of ,:;hj s pass was +;:racked au tomat ica l ly by t h e RADOT ins tmment locking
i t s e l f i;po.-i t..k.e l ight . of t h e sst,el,i.te ar.d mechar! i.ca1.l.y pr in . t ing out. each second
where -i.ts opttc a x i s w a s p0.i.nt;ir.g i n a l o c a l X-P coordi2ate system.
where t h e sat ,e l i . i . te was morneatarCy l o s t to t h e -rarrow ang:le s ix a r c minutes
.f.!e.-kd of r r i e w of' the M O T due t o clouds or inadver ten t operatow m.ista.ke or by
j :fjte?it i o r d eject;ic:n of +,he sate.!.li.te t o measure background skylight. a r e i rd i ca ted
by +,:!le l i g h t curve droppizg t o a m:inimum and r i s h g ra.p:i.d;y a few seconds l a t e r .
The ins tances
The I'AGEOS rerordirig f o r t . h i s pass i s simi.;ar i.3 s e v e r a l r e spec t s t o t h e
?recordir:g obtaimed 01: Ju.?e 25.
t h a t of t.he b r igh t r e s s of a poin t source approac?L.i2g and ther. reced-i.r,g from an
observer . Superi.mposed or? t h i s b a s i c curve are per:l.odic rises In int ,ensi . ty of
the l . ight I
somewkere b?t.ween 30 an.d 40 seconds whereas it had been determired t o be 11.6
&t,h t r a c i n g s show a curve which resembles
A vi.su.a.1 lnspec t ion of t h e curve f o r ,July -13 shows t.he per iod t o be
seconds 0r1 t T l ~ ? l e 27 I
The p r d - i ( . t e d t , r a j ec to ry agrees qu:i.te wei l with t;Pe observed FtADOT d - a t a
cou.sidering t%at PAGEOS i s a s a t e l l . i t e which provides t h e predi c+;i.ng pe.rsonncl

- 3 -
with very little observed data since it is a completely passive satellite.
The following table lists the predicted values at arbitrary times during the
pass with the corresponding M O T observed values after both are corrected
for the same parameters. -- Table 1
Time Predicted Data U.T. Alt. Azim . Alt . Azlm.
h m s
RADOT B t a - .
53020 201020 54047 201055 08 36 00 08 40 00 68.46 219.70 69.16 220.31
08 45 00 74.99 300.07 75 * 33 299 37 08 52 00 50 -23 346.35 51.60 345 73 08 56 00 36.51 353.08 38.17 352.58
The Magnitude of PAGEOS Examination of the FXDOT printout reveals that the satellite reached its
maximum altitude and minimum slant range somewhere between the times of
08h 42m 37' and 08h 43m 45'. h located at 08
that time point which showed a sharp flash was chosen to determine the magnitude
of PAGEDS at its highest elevation apd supposedly its greatest brightness. This
flash occurred at 08 RADOT was tracking at this time and indicated that it was pointbg to an
altitude of 71086.
Since the portion of the sky where PAGEDS was
43m 00' was cloudy, the tracing of the satellite closest to
h 46m 21' and was 8.55 inches above the background sky level.
The three comparison stars whose altitudes when they were observed were
closest to that of the satellite at its peak were used to determine The magnitude
of PAGEOS.
and 1 Pegasi, magnitude +4.27; whose respective altitudes when observed were 7201; 7504; and 6804. The three readings above background sky level as related to the three stars were 3.66 inches; 1.80 inches; and 0.73 inches.
These stars were€ Cygni, magnitude +2.64; Cygni, magnitude +3.40; s Wien the normal magnitude formula,
L1 k2
m - m = -2.5 log - 1 2

w a s employed t o determine the magnitude of PAGEOS, the t h r e e equations
appeared as follows, 8 .55 -2.64 = -2 .5 l og 7 6
m p ~ ~ . 3. -3.40 - -2.5 log 7, 8.55
( 2 ) m ~ ~ ~ . 1. 0
8.55 (3 ) mpAG. -4.27 = -2 .5 1% - 0.73 giv ing answers of + l .72 , +l.7l, arid +1.60 whose mean is +1.68 or using
f i r s t decimals orly +1.7. The poirlt or- t he bas lc PAGEOS curve, ( t h e curve devoid of t h e f l a s h e s )
d i r e c t l y below t h e peak f l a s h had a reading of 6.70 inches above t h e back-
ground sky l e v e l .
t he res-4'Ltirlg magLt1,des were +1.98, 1-1.97, and +1.86 o r an averege of +1.94. O?e cbservat i 0.1 here i s t Fa t WVP- +ke PAGEOS s a t e l l L t e f luc tua ted i n b r igh tness
dur:-g t h i s pass , the individiAal f l a s h e s appeared t o be one-quarter of a
magnitude b r l g r t e r tpa., what t h e s a t e l l i t e would be a t t h a t po in t i f it d id
ilot exhibi t f ,asni g pffei-ts .
Whei t h i s vaiiie was i n s e r t e d i n t o the above t h r e e equat ions,
The probable reasoris that, PAGEOS appeared b r i g h t e r during t h i s pass than
the e a r l i e r one a re t h e followir,g:
1. Or, ,luLy 13, 1966, t,Le mi- ' ,mm1 sLa5t range d i s t a c c e t o t h e s a t e l l i t e
w a s approximately L480 ki Lometers wnereas on .Jure 25, 1966, t h e
minimum rar;ge was 4844 ki lometers . Wnex these two values of d i s t ance - a r e inser ted irtci t h e slaqt ra9ge term, ( 5 l o g g), i n t h e formula
V f o r specular ?ef;ectios, Fig. ;V, t h e d i f f e rence i n magnitude due t o
t h e d i f f e r e n t d i s tances only i s O.;7. P r a c t i c a l l y the e n t i r e pass of J u l y 13 took p lace w e s t of t h e meridian.
A s a r e s u l t , a much l a r g e r a r e a of t he s a t e l l i t e w a s v i s i b l e t o view
than dLtrivg the Ju?e 25 pass whicp- took p lace east of t h e horizon,
s ince i T i each pass t h e sun w a s below t h e horizon i n t h e e a s t .
2.

We
portion In
At this -
- 5 -
may compute the increased brightness of the 12% diffuse refLecLivity
due to phase angle, P, in the following manner. the June 25 pass, the time under consideration was 08 time, the celestial coordinates of the sun and PAGEOS were approximately
h llm U.T.
as follows:
I . GHASUN 4
= 302' 0%
DECm = +23O 24' D E C ~ ~ ~ = +37O 36 4
The angular distance, d, between the sun and PAGEOS, was therefore,
d = 74?2 0
Substituting the computed value of d, 74.2, from above into the formula
for phase, P, we get, 1 - COS d
2 P =
P = 0.364 Repeatifig the same equations with the parameters of the July 1 3 Fass,
at 08' 46m U.T., which were,
D E C ~ ~ ~ = +21° 53 1 f
DECpAG = 49' 48
we obtain, d = 10204 P = 0.607
In other words, if PAGEOS were a perfect sphere, 36.4% of its surface would have been illuminated during the time of concern in the June 25 pass
while 60.7% of its surface would have been illuminated during the cor- respondi-rg time in the July 13 pass.
The difference in magnitude due to the change in phase only between
the two passes would have been,

I - 6 -
60 7 @nl = -2.5 l o g % 3 .
= 0.55
!he d i f fe rence i n b r i g h t e s t magnitude reached between t h e two passes
w a s approximately 0.4.
d i f f e rence i n d is tance , while t h e remainder 0.23 magnitude i s only ha l f of
t he expected magnitude change due t o t h e d i f f e rence i n phase. Because of
t h i s l a t t e r f a c t , it appears t h a t PAGEOS i s deformed s u f f i c i e n t l y so t h a t
it d e f i n i t e l y does not r e f l e c t l i g h t as does a p e r f e c t sphere.
2
r i s t h e pred ic ted s l an t range of t he s a t e l l i t e i n k l lometers .
of t h e curve w a s t o show how t h e br ightness of t he s a t e l l i t e would vary
during t h l s pass i f d i s t a r c e alone were the s o l e cause of i t s varying
br ightr iess .
as tLle s a t e l l i t e moves away from RADOT than as it approaches. This i s
exzicily what, t he r e x r d e d Curve of PAGEOS shows when it i s examined i n i t s
erlti re ty .
O f t h i s , 0.17 magnitude can be explained by a
2 ??.le Normalized l / r Curve
Figure 3 i s a curve of l/r p l o t t e d aga ins t t i m e during t h e pass , where
The purpose
As may be seer,, t h e i n t e n s i t y f a l l s o f f a l i t t l e more r a p i d l y
SpecLlar Reflect ion Magnitude
Since t h e ma te r i a l making up t h e body of t h e s a t e l l i t e r e f l e c t s l i g h t
1" a specular rnaf,ner arld has arl albedo which i s 8811, specklar approximately,
a curve of howthemagrAtude might vary during tke pass w a s p l o t t e d us ing
L;le predic ted s1a. t ranges and t h e assumed re f l ec t ance , Figure 4. formula employed f o r t h e magn?itl,de w a s one given by Koskela
The 1 l . e . y
.2.5 l o g r + 1.505 + A
w k r e t h e individual parameters a r e def ined on Figure 4. This curve resembles 2 the l / r curve i n t h a t t he br ightness drops more r a p i d l y a s t h e s a t e l l i t e
I~,OVFE away from t,?e observer than as it r i s e s when it approaches.
1. ConLribLtion t o Astrodynamlcs "A Dpamic Analysis and Prel iminary Design of Giidarice f o r Lurisr Vehicles" Vol. I V , S t e l l a r Magr,itudes by P. E. Koskela, Aeronutronl c Publicat iog C-590, September, 1959.
. .-

- 7 -
I The brightest magnitude reached on this curve is +2.44 while the average greatest brightness computed earlier was +1.68 giving a difference of +0.76 magnitude. reflectance formula gave a magnitude about 0.6 fainter than the satellite reached.
On the June 25, 1966 pass, it was also noticed that this specular
~ - -
I In an attempt to determine if changing the constant, 1.505, would make the theoretical curve resemble true conditions more closely, the curve was redrawn substituting +0.75 for the constant, +l. 505, (dashed graph). Points were
taken from the PAGEOS recording where periodic flashes occurred and their
magnitudes computed using as a basis the magnitude +1.68 for a deflection above background sky of 8.55 inches.
-..
The circled points are the resulting magnitudes.
The difference between the dashed line graph and an imaginary curve drawn
through the dots appears to be a timing error. It the imaginary curve were moved to the left an amount equal to about 5 minutes of time, there would be a. fair agreement between the new formula and observed magnitudes.
The Power Spectrum Analysis
As in the earlier discussion oftk June 25 pass of PAGEOS, an attempt was
made here to determine the period in the fluctuating brightness by a more rigorous
method than manually measuring from peak-to-peak.
the data was thereby performed.
in the previous paper mentioned.
A power spectrum analysis on A brief explanation of this technique was given
Values were taken from the PAGEOS recording at each five seconds of time h h between the interval 08 31m 50' and 09 OOm 00'. At those five second points
where the record had dropped to a minimum, an extrapolated smooth value was
used. They were taken at this interval because it was obvious by a visual
inspection of the record that the period was somewhere over 30 seconds. A power spectrum analysis does not extract periods which are shorter than twice
the interval between points.
Figure 5 shows the relative power of two graphs derived using two different frequency resolutions. The lower graph has twice the frequency resolution of
the upper and this fact is reflected in the greater number of periods exhibited.
- 8 -
Figure 6 i l l u s t r a t e s t h e two curves of Figure 5 a f t e r each curve had
undergone a numerical f i l t e r i n g .
frequency response of t h e f i l t e r . The X-axis reads both t h e frequency i n
ryc l e s per second and t h e per iod. Relat ive power i s on t h e Y-axis. As
may be seen, t h e period of t h e f l u c t u a t i o n s averages out t o 39 seconds.
The top curve of Figure 6 i s the e f f e c t i v e
I Conclusions
1. PAGEOS i s d e f i n i t e l y deformed which expla ins it not behaving as a
p e r f e c t sphere i n i t s r e f l e c t i n g q u a l i t i e s .
bea r t h i s out both from t h e s tandpoint of expected br ightness aga ins t observed
and a l s o from t%e f luc tua t ions il: i t s br ightness .
The passes on June 25 and on July 13
2 . The s a t e l l i t e r o t a t e s bu t t h e per iod i s indeterminate as of now. It
appeays t o be a mult iple of approximately 39 seconds.
3. Since t h e p robab i l i t y of the r o t a t i o n rate of t h e ba l loon changing
between ,Turie arld J d y i s extremely small, it seems t h a t t h e r e are deformed
Z I - E Z ~ 0'- tLe s a t e l l i t e equal ly spaced along t h e su r face . These areas cause
g!i?ts of su i l i gh t t o be given o f f and r e s u l t i n f l u c t u a t i o n s i n t h e b r i g h t -
ness of t he s a t e l l i t z .
secorLds on ;wie 25 and 39 secoyds on J u l y 13.
1 Tie per iods of t hese observed f l u c t u a t i o n s were 116
I 4. The specular r e f l e c t i o n formila quoted by Koskela appears t o r ep resen t
c b s e r w d 'crightvesses sonewhat b e t t e r when t h e cors taFt +C.75 i s employed i n
tble formula igstead of t1.505.
e
l -.
The authors wish to thank Messrs. J. R. Cook and J. D. Stewart of Scientific Data Systems and Bendix Field Engineering respectively for
operating the RADOT instrument during the passage and Mr. B. J. Conrath of the Planetary Radiations Branch for performing the power spectrum analysis on the data.


igwe 1 . The Cornpariron Stan Recordiyl.

FIGURE za r t

E PAGEOS RECORDING

FIGURE 2 b

4
THE PAGEOS RECORDING

FIGURE 2 c TH
/ 3 -L
i PAGEOS RECORDING

4
c
FIGURE Z d THE PAGEOS R

ZORDING

f
I
Q In
/ 5-
m

B
0
/ I I
I I
O 1
I i o I I I I I I
Q \ \ \ \ \ \ \ \ \ \ \ \
0
\
\ \
\
\ \
\ \ 9
a

I7

Lu M u- .: I-
Lu o! W L
Z
u- n 0 3 I- Lu I I-
o Z - I- 3 0 a 5 U z #-- -0