l hov l 1983 - geologyontario.mndmf.gov.on.ca digital recorder 4. ... with channel identification...
TRANSCRIPT

l 42c"ieNEeen NAMEIGOS8811 NAMEIGOS 010
l
l
l
M REPORT ON
l
COMBINED HELICOPTER-BORNE
MAGNETIC, ELECTROMAGNETIC,
AND VLF-EM SURVEY
HONEV ON FALLS CLAIMS
NAMEIGOS TOWNSHIP, ONTARIO
l
l
l
l HOV l 1983
M MINING LANOi it
l
l byAERODAT LIMITED
l July, 1983
for
DENVER SILVER INC.
5 7/x l rt-

42C10NE0011 NAMEIGOS801I NAMEIGOS 010C
-V*' ~
11111111111111111
r TABLE OF CONTENTS
1. INTRODUCTION
2. SURVEY AREA/CLAIM NUMBERS AND LOCATIONS
3. AIRCRAFT EQUIPMENT
3.1 Aircraft
3.2 Equipment
3.2.1 Electromagnetic System
3.2.2 VLF-EM
3.2.3 Magnetometer
3.2.4 Magnetic Base Station
3.2.5 Radar Altimeter
3.2.6 Tracking Camera
3.2.7 Analog Recorder
3.2.8 Digital Recorder
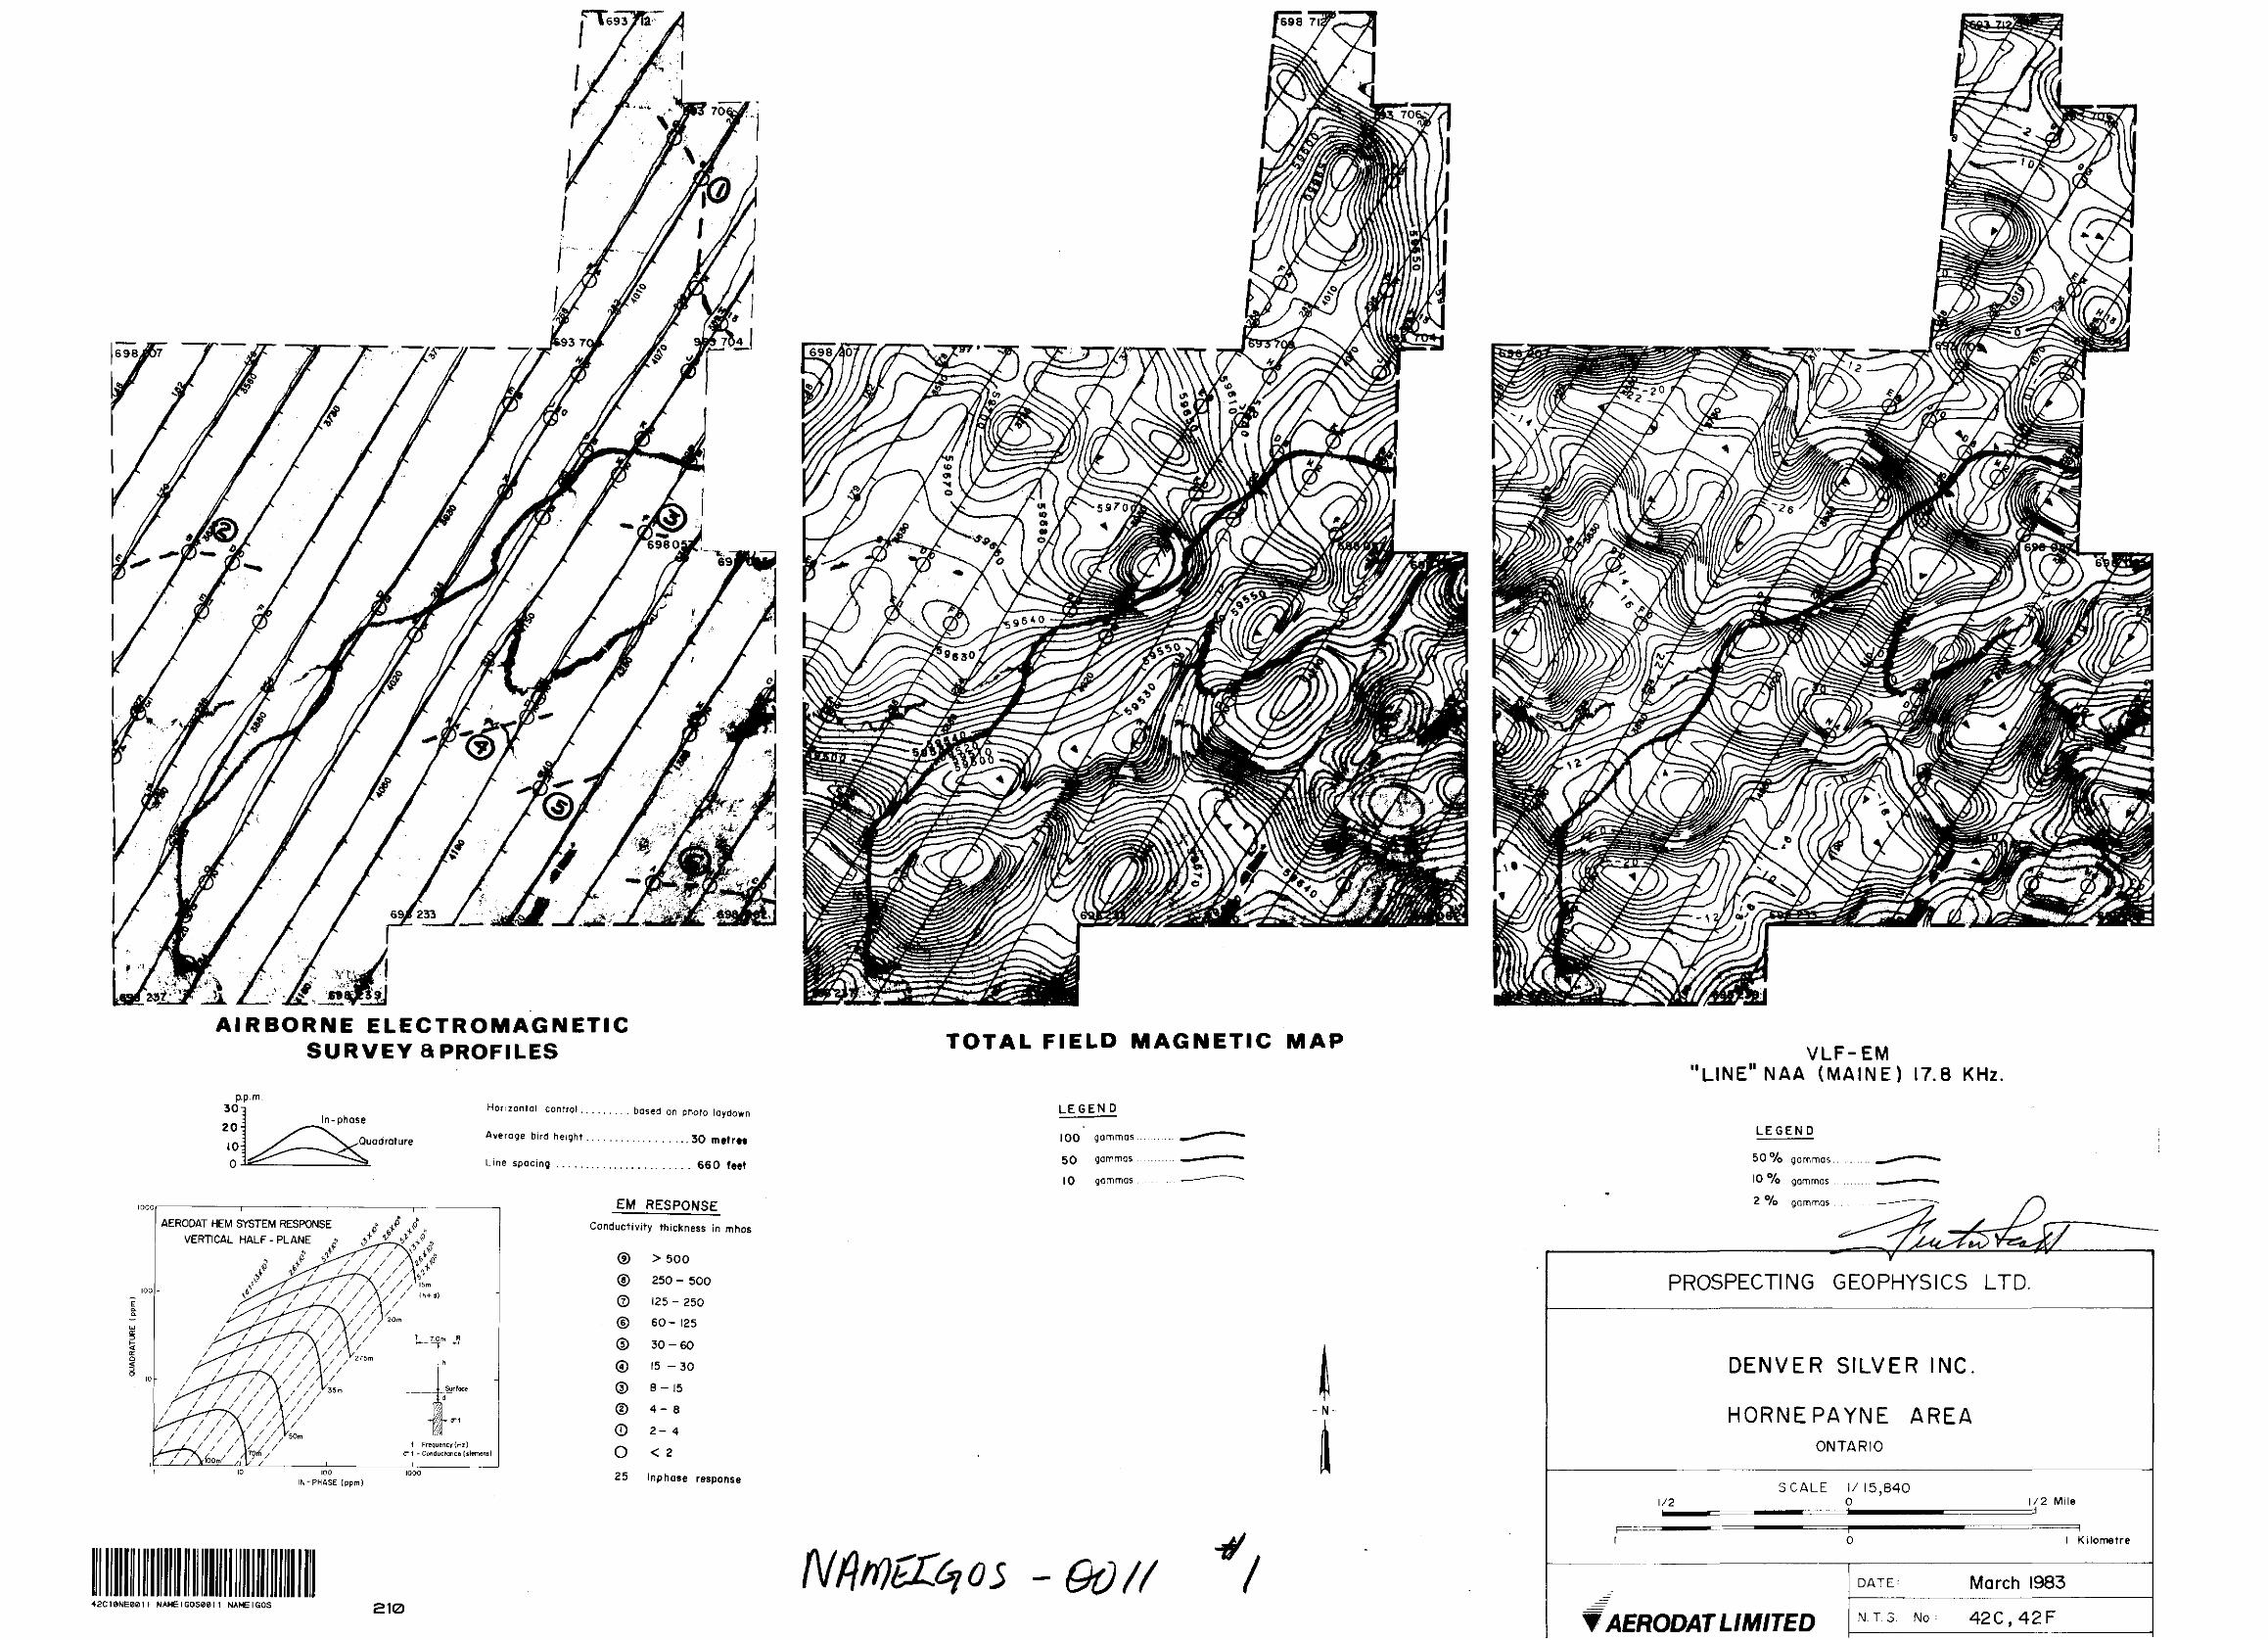
4. DATA PRESENTATION
4.1 Base Map and Flight Path Recovery
4.2 Electromagnetic Profile Maps
4.3 Magnetic Contour Maps
4.4 VLF-EM Contour Maps
4.5 Electromagnetic Survey ConductorSymbol i zation
4.6 Interpretation Maps
APPENDIX I - General InterpretiveConsiderations
Page
1 -
2 -
3 -
3 -
3 -
3 -
3 -
3 -
3 -
3 -
3 -
3 -
3 -
4 -
4 -
4 -
4 -
4 -
4 -
4 -
NO.
1
1
1
1
1
1
1
2
2
2
3
3
4
1
1
2
4
5
6
8

LIST OF MAPS. .
(Scale: 1/15,840)
l
Map l Interpreted Conductive Units
Map 2 Airborne Electromagnetic Survey Profile Map (955 Hz. coaxial)
B Map 3 Total Field Magnetic Map
Map 4 VLF-EM Total Field Contours
l
lM Data provided but not included in report:
J l - master map (2 colour) of coaxial andcoplanar profiles with flight path
l 2 - anomaly list providing estimates of depth and conductivity thickness
1 3 - analogue records of data obtained in flight
l
l
l
l
l
l
l

,*p
1. INTRODUCTION
, This report describes an airborne geophysical survey
M carried out on behalf of Denver Silver Inc. by Aerodat
, - Limited. Equipment operated included a 3 frequency
J electromagnetic svetero, a VLP-EM system, and a
^ magnetometer.
The survey was flown on March 26 to March 28, 1983
l from an operations base at Wawa Ontario. A total of
m 328 line miles were flown, at a nominal line spacing
of 660 feet. Of the total flown, this report describes
l 25 line miles.
l
l
l
l
l
l
l
l
l

!;-!#:'.-'.- ' "- : 'i(i(*.'ti wl 2' SURVEY AREA/CLAIM NUMBERS AND LOCATIONS
l The mining claim numbers and locations covered by this
B survey are indicated on the map in the following pocket*
l
l
l
l
l
l
l
l
l
l
l
l
l
l

-~—-
J——
—j
u s i rvS .5
.S S
SS
iS
'2 •J
?.
—-i
a i^S
"via
; ~
s l t:
' S
Ml
M
' M
a -la
m .3
m
*" S i *t
S S
S
l l i2-l?.l lla
IS
o: i-i J,
l
*Z
'
r*

lII 3 " l
l 3' AIRCRAFT EQUIPMENT
3.1 Aircraft
l The helicopter used for the survey vas an Aerospatial
m Astar 350D owned and operated by North Star Helicopters.
Installation of the geophysical and ancillary equipment
l was carried out by Aerodat. The survey aircraft was
flown at a nominal altitude at 60 meters.
3.2 Equipment
3.2.1 Electromagnetic System
" The electromagnetic system was an Aerodat/
l Geonics 3 frequency system. Two vertical
coaxial coil pairs were operated at 955 and
P 4130 Hz and a horizontal coplanar coil pair
at 4500 Hz. The transmitter-receiver separa-
tion was 7 meters. In-phase and quadrature
l signals were measured simultaneously for the
3 frequencies with a time-constant of 0.1
g seconds. The electromagnetic bird was towed
30 meters below the helicopter.
3.2.2 VLF-EM System
The VLF-EM System was a Herz 2A. This instru-
p ment measures the total field and vertical
l

3-2
quadrature component of two selected frequencies.
The sensor was towed in a bird 15 meters below
the helicopter.
The sensor aligned with the flight direction
is designated as "LINE", and the sensor
perpendicular to the line direction as "ORTHO".
The "LINE" station used was NAA, Cutler Maine,
17.8 KHz or NLK, Jim Creek Washington, 24.8 KHz.
The "ORTHO" station was NSS, Annapolis Maryland,
21.4 KHz. The NSS transmitter was operating on
a very limited schedule and was not available
during a large part of the survey.
3.2.3 Magnetometer
The magnetometer was a Geometrics G-803 proton
precession type. The sensitivity of the
instrument was l gamma at a 1.0 second sample
rate, The sensor was towed in a bird 15 meters
below the helicopter.
3.2.4 Magnetic Base Station
An IFG proton precession type magnetometer was
operated at the base of operations to record
diurnal variations of the earths magnetic
field. The clock of the base station was
synchronized with that of the airborne system

l i i i i i i i i i i i i i i i i i i
3-3
to facilitate later correlation.
3 * 2 ' 5 Radar Altimeter
A Hoffman HRA-100 radar altimeter was used to
record terrain clearance. The output from the
instrument is a linear function of altitude
for maximum accuracy.
3.2.6 Tracking Camera
A Geocam tracking camera was used to record
flight path on 35 mm film. The camera was
operated in strip mode and the fiducial numbers
for cross reference to the analog and digital
data were imprinted on the margin of the film.
3.2.7 Analog Recorder
A RMS dot-matrix recorder wan used to display
the data during the survey. A sample record
with channel identification and scales is
presented on the following page.

ANALOG CHART
CAMERA(-.^ FIDUCIAL l j^* i . t t i
COPLANAR QUAD..
COPLANAR INrPHASE
COAXIAL gUAD j (HIGH FREQ.)
COAXIAL IN-PHASE(HIGH FREQ.)
(LOW FREQ.;
COAXIAL,, IN-PHASE(LOW FREQ.) 20 ppm.
n
^MANUAL FIDUCIAL

3-4
3.2.8 Digital Recorder
A Perle DAC/NAV data system recorded the survey
data on cassette magnetic tape. Information
recorded was as follows:
Equipment
EM
VLF-EM
magnetometer
altimeter
fiducial (time)
fiducial (manual)
Interval
0.1 second
0.5 second
0.5 second
1.0 second
l.O second
0.2 second

4-1
4. DATA PRESENTATION
4.1 Base Map and Flight Path Recovery
The base map photomosaic at a scale of 1/15,840 was
constructed from available aerial photography. The
flight path was plotted manually on this base and
digitized for use in the computer compilation of the
maps. The flight path is presented with fiducials
for cross reference to both the analog and digital
data.

4-2
4.2 Electromagnetic Profile Maps
The electromagnetic data was recorded digitally at
a high sample rate of 10/second with a small time
constant of 0,1 second. A two stage digital filtering
process was carried out to reject major sferic events,
and reduce system noise.
Local atmospheric activity can produce sharp, large
amplitude events that cannot be removed by conventional
filtering procedures. Smoothing or stacking will reduce
their amplitude but leave a broader residual response
that can be confused with a geological phenomenon. To
avoid this possibility, a computer algorithm searches
out and rejects the major "sferic" events.
The signal to noise was further enhanced by the
application of a low pass filter. The filter was
applied digitally. It has zero phase shift which
prevents any lag 01 peak displacement from occurring
and it suppresses only variation with a wavelength
less than about 0.2S seconds. This low effective time
constant permits maximum profile shape resolution.
Following the filtering processes, a base level
correction was made. T:.e correction applied is a linear
function of time that ensures that the corrected
amplitude of the various inphase and quadrature components

4-3
is zero when no conductive or permeable source is
present. This filtered and levelled data was then
presented in profile map form.
The in-phase and quadrature responses of the coaxial
955 Hz configuration are plotted with the flight
path and presented on the photomosaic base.
The in-phase and quadrature responses of the coaxial
4500 Hz and the coplanar 4130 Hz configuration are
plotted with flight path and are available as a two
colour overlay.

4-4
4.3 Magnetic Contour Maps
The aeromagnetic data was corrected for diurnal
variations by subtraction of the digitally recorded
base station magnetic profile. Mo correction for
regional variation is applied.
The corrected profile data was interpolated onto a
regular grid at a 2.5 mm interval using a cubic
spline technique. The grid provided the basis for
threading the presented contours at a 10 gamma
interval.
ff.'- 4-5
f
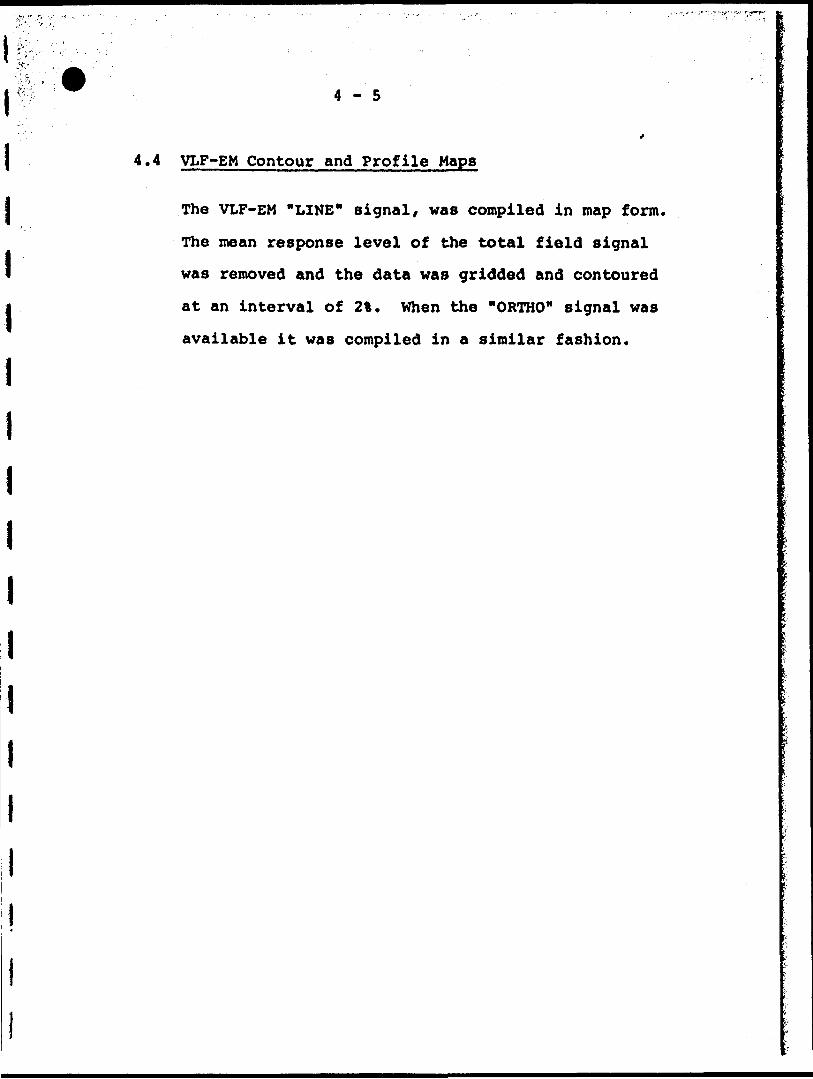
4.4 VLF-EM Contour and Profile Maps
The VLF-EM "LINE" signal/ was compiled in map form.
The mean response level of the total field signal
was removed and the data was gridded and contoured
at an interval of 2%. When the "ORTHO" signal was
available it was compiled in a similar fashion.

4-6
4.5 Electromagnetic Conductor Symbolization
The electromagnetic profile maps were used to
identify those anomalies with characteristics
typical of bedrock conductors. The in-phase
and quadrature response amplitudes at 4130 Hz
were digitally applied to a phasor diagram for
the vertical half-plane model and estimates of
conductance (conductivity thickness) were made.
The conductance levels were divided into categories
as indicated in the map legend; the higher the number,
the higher the estimated conductivity thickness
product.
As discussed in Appendix I the conductance should be
used as a relative rather than absolute guide to
conductor quality. A conductance value of less than
2 mhos is typical for conductive overburden material
and electrolytic conductors in faults and shears.
Values greater than 4 mhos generally indicate some
electronic conduction by certain metallic sulphides
and/or graphite. Gold, although highly conductive,
is not expected to occur in sufficient concentration
to directly produce an electromagnetic anomaly;
however, accessory mineralization such as pyrite or

4-7
graphite can produce a meajfurable response*
With the aid of the profile maps, responses of similar
characteristics may be followed from line to line and
conductor axes identified.
The distinction between conductive bedrock and over
burden anomalies is not always clear and some of
the symbolized anomalies may not be of bedrock origin.
It is also possible that a response may have been
mistakenly attributed to overburden and therefore not
included in the symbolization process. For this reason,
as geological ar.d other geophysical information becomes
available/ reassessment of the significance of the
various conductors is recommended.

4-8
4.6 INTERPRETATION MAPS
The conductive trends are shown and discriminated
for descriptive purposes.
These conductor* are described below.
1 Possible bedrock conductor in area of
conductive overburden on northeast flank
of magnetic high.
2 Weak conductor, possibly overburden,
mapped as granodiorite.
3 Short conductor
4 Projected possible conductor on north
flank of magnetic high.
5 Questionable poor conductor
6 Linear weak conductor trend, probably
bedrock.
Respectfully submitted,
August 5, 1983. Fenton Scott, P.Eng

APPENDIX I
GENERAL INTERPRETIVE CONSIDERATIONS
Electromagnetic
The Aerodat 3 frequency system utilizes 2 different
transmitter-receiver coil geometries. The traditional
coaxial coil configuration is operated at 2 widely
separated frequencies and the horizontal coplanar coil
pair is operated at a frequency approximately aligned
with one of the coaxial frequencies.
The electromagnetic response measured by the helicopter
system is a function of the "electrical" and "geometrical"
properties of the conductor. The "electrical" property
of a conductor is determined largely by its conductivity
and its size and shape; the "geometrical" property of the
response is largely a function of the conductors shape and
orientation with respect to the measuring transmitter and
receiver.
Electrical Considerations
For a given conductive body the measure of its conductivity
or conductance is closely related to the measured phase
shift between the received and transmitted electromagnetic
field. A small phase shift indicates a relatively high
conductance, a large phase shift lower conductance. A
small phase shift results in a large in-phase to quadrature

- 2 - APPENDIX I
ratio and a large phase shift a low ratio. This relation
ship is shown quantitatively for a vertical half-plane
model on the accompanying phasor diagram. Other physical
models will show the same trend but different quantitative
relationships.
The phasor diagiam for the vertical half-plane model, as
presented, is for the coaxial coil configuration with the
amplitudes in ppm as measured at the response peak over
the conductor. To assist the interpretation of the survey
results the computer is used to identify the apparent
conductance and depth at selected anomalies. The results
of this calculation are presented in table form in Appendix I
and the conductance and in-phase amplitude are presented
in symbolized form on the map presentation.
The conductance and depth values as presented are correct
only as far as the model approximates the real geological
situation. The actual geological source may be of limited
length, have significant dip, its conductivity and thickness
may vary with depth and/or strike and adjacent bodies and
overburden may have modified the response. In general the
conductance estimate is less affected by these limitations
than the depth estimate but both should be considered a
relative rather than absolute guide to the anomalies
properties.

- 3 - APPENDIX I
Conductance in mhos is the reciprocal of resistance in
ohms and in the case of narrow slab like bodies is the
product of electrical conductivity and thickness.
Most overburden will have an indicated conductance of less
than 2 mhos; however, more conductive clays may have an
apparent conductance of say 2 to 4 mhos. Also in the low
conductance range will be electrolytic conductors in faults
and shears.
The higher ranges of conductance, greater than 4 mhos,
indicate that a significant fraction of the electrical
conduction is electronic rather than electrolytic in nature.
Materials that conduct electronically are limited to certain
metallic sulphides and to graphite. High conductance
anomalies, roughly 10 mhos or greater are generally limited
to sulphide or graphite bearing rocks.
Sulphide minerals with the exception of sphalerite, cinnabar
and stibnite are good conductors; however, they may occur
in a disseminated manner that inhibits electrical conduction
through '.he rock mass. In this case the apparent conductance
can seriously under rate the quality of the conductor in
geological terms. In a similar sense the relatively non-
conducting sulphide minerals noted above may be present in
significant concentration in association with minor conductive

- 4 - APPENDIX I
sulphides, and the electromagnetic response only relate
to the minor associate mineralization. Indicated conductance
is also of little direct significance for the identification
of gold mineralization. Although gold is highly conductive
it would not be expected to exist in sufficient quantity
to create a recognizable anomaly but minor accessory sulphide
mineralization could provide a useful indirect indication.
In summary the estimated conductance of a conductor can
provide a relatively positive identification of significant
sulphide or graphite mineralization; however, a moderate
to low conductance value does not rule out the possibility
of significant economic mineralization.
Geometrical Considerations
Geometrical information about the geologic conductor can
often be interpreted from the profile shape of the anomaly.
The change in shape is primarily related to the change in
inductive coupling among the transmitter, the target, and
the receiver.
In the case of a thin, steeply dipping, sheet-like conductor,
the coaxial coil pair will yield a near symmetric peak over
the conductor. On the other hand the coplanar coil pair will
pass through a null couple relationship and yield a minimum
over the conductor, flanked by positive side lobes. As the
dip of the conductor decreases from vertical, the coaxial

- 5 - APPENDIX l
anomaly shape changes only slightly, but in the case of
the coplanar coil pair the side lobe on the down dip side
strengthens relative to that on the up dip side.
As the thickness of the conductor increases, induced
current flow across the thickness of the conductor becomes
relatively significant and complete null coupling with the
coplanar coils is no longer possible. As a result, the
apparent minimum of the coplanar response over the conductor
diminishes with increasing thickness, and in the limiting
case of a fully 3 dimensional body or a horizontal layer
or half-space, the minimum disappears completely.
A horizontal conducting layer such as overburden will produce
a response in the coaxial and coplanar coils that is a
function of altitude (and conductivity if not uniform). The
profile shape will be similar in both coil configurations
with an amplitude ratio (coplanar/coaxial) of about 4/1.
In the case of a spherical conductor, the induced currents
are confined to the volume of the sphere, but not relatively ji
restricted to any arbitrary plane as in the case of a sheet- is
like form. The response of the coplanar coil pair directly j* i
over the sphere may be up to 8 times greater than that of
the coaxial coil pair.

- 6 - APPENDIX I
In summary a steeply dipping, sheet-like conductor will
display a decrease in the coplanar response coincident
with the peak of the coaxial response. The relative
strength of this coplanar null is related inversely to
the thickness of the conductor; a pronounced null indicates
a relatively thin conductor. The dip of such a conductor
can be infered from the relative amplitudes of the side-lobes.
Massive conductors that could be approximated by a conducting
sphere will display a simple single peak profile form on both
coaxial and coplanar coils, with a ratio between the coplanar
to coaxial response amplitudes as high as 8.*
Overburden anomalies often produce broad poorly defined
anomaly profiles. In most cases the response of the coplanar
coils closely follow that of the coaxial coils with a
relative amplitude ratio of 4.*
Occasionally if the edge of an overburden zone is sharply
defined with some significant depth extent, an edge e ffect
will occur in the coaxial coils. In the case of a horizontal
conductive ring or ribbon, the coaxial response will consist
of two peaks, one over each edge; whereas the coplanar coil
will yield a single peak.

- 7 - APPENDIX I
* It should be noted at this point that Aerodat's definition
of the measured ppm unit is related to the primary field
sensed in the receiving coil without normalization to the
maximum coupled (coaxial configuration). If such normal
ization were applied to the Aerodat units, the amplitude
of the coplanar coil pair would be halved.

- B - APPENDIX I
Magnetics
The Total Field Magnetic Map shows contours of the
total magnetic field, uncorrected for regional varia
tion. Whether an EM anomaly with a magnetic correla
tion is more likely to be caused by a sulphide deposit
than one without depends on the type of mineralization.
An apparent coincidence between an EM and a magnetic
anomaly may be caused by a conductor which is also
magnetic, or by a conductor which lies in close proximity
to a magnetic body. The majority of conductors which are
also magnetic are sulphides containing pyrrhotite and/or
magnetite. Conductive and magnetic bodies in close
association can be, and often are, graphite and magnetite.
It is often very difficult to distinguish between these
cases. If the conductor is also magnetic, it will usually
produce an EM anomaly whose ger.eral pattern resembles
that of the magnetics. Depending on the magnetic perme
ability of the conducting body, the amplitude of the
inphase EM anomaly will be weakened, and if the conduc
tivity is also weah, the inphase EM anomaly may even be
reversed in sign.

- 9 - APPENDIX I
VLF Electromagnetics
The VLF-EM method employs the radiation from powerful
military radio transmitters as the primary signals.
The magnetic field associated with the primary field
is elliptically polarized in the vicinity of electrical
conductors. The Herz Totem uses three coils in the X.
Y. Z. configuration to measure the total field and
vertical quadrature component of the polarization
ellipse.
The relatively high frequency of VLF 15-25 KHz provides
high response factors for bodies of low conductance.
Relatively "disconnected" sulphide ores have been found
to produce measurable VLF signals. For the same reason,
poor conductors such as sheared contacts/ breccia zones,
narrow faults, alteration zones and porous flow tops normally
produce VLF anomalies. The method can therefore be used
effectively for geological mapping. The only relative dis-
advantage of the method lies in its sensitivity to conductive
overburden. In conductive ground the depth of exploration
is severely limited.
The effect of strike direction is important in the sense
of the relation of the conductor axis relative to the
energizing electromagnetic field. A conductor aligned
along a radius drawn from a transmitting station will be

- 10 - APPENDIX I
in a maximum coupled orientation and thereby produce a
stronger response than a similar conductor at a different
strike angle. Theoretically it would be possible for a
conductor, oriented tangentially to the transmitter to
produce no signal. The most obvious effect of the strike
angle consideration is that conductors favourably oriented
with respect to the transmitter location and also near
perpendicular to the flight direction are most clearly
rendered and usually dominate the map presentation.
The total field response is an indicator of the existence
and position of a conductivity anomaly. The response will
be a maximum over the conductor, without any special filtering,
and strongly favour the upper edge of the conductor even in
the case of a relatively shallow dip.
The vertical quadrature component over steeply dipping sheet
like conductor will be a cross-over type response with the
cross-over closely associated with the upper edge of the
conductor.
The response is a cross-over type due to the fact that it
is the vertical rather than total field quadrature component
that is measured. The response shape is due largely to
geometrical rather than conductivity considerations and
the distance between the maximum and minimum on either side
of the croso-over is related to target depth. For a given
target geometry, the larger this distance the greater the

- 11 - APPENDIX I
depth.
The amplitude of the quadrature response, as opposed
to shape is function of target conductance and depth
as well as the conductivity of the overburden and host
rock. As the primary field travels down to the conductor
through conductive material it is both attenuated and
phase shifted in a negative sense. The secondary field
produced by this altered field at the target also has an
l associated phase shift. This phase shift is positive and
is larger for relatively poor conductors. This secondary
' field is attenuated and phase shifted in a negative sense
l during return travel to the surface. The net effect of
these 3 phase shifts determine the phase of the secondary
l field sensed at the receiver.
H A relatively poor conductor in resistive ground will yield
a a net positive phase shift. A relatively good conductor
in more conductive ground will yield a net negative phase
l shift. A combination is possible whereby the net phase
shift is zero and the response is purely in-phase with no
l quadrature component.
l A net positive phase shift combined with the geometrical
cross-over shape will lead to a positive quadrature response
on the side of approach and a negative on the side of
l departure. A net negative phase shift would produce the
reverse. A further sign reversal occurs with a 180 degree
l
-12.- APPENDIX I
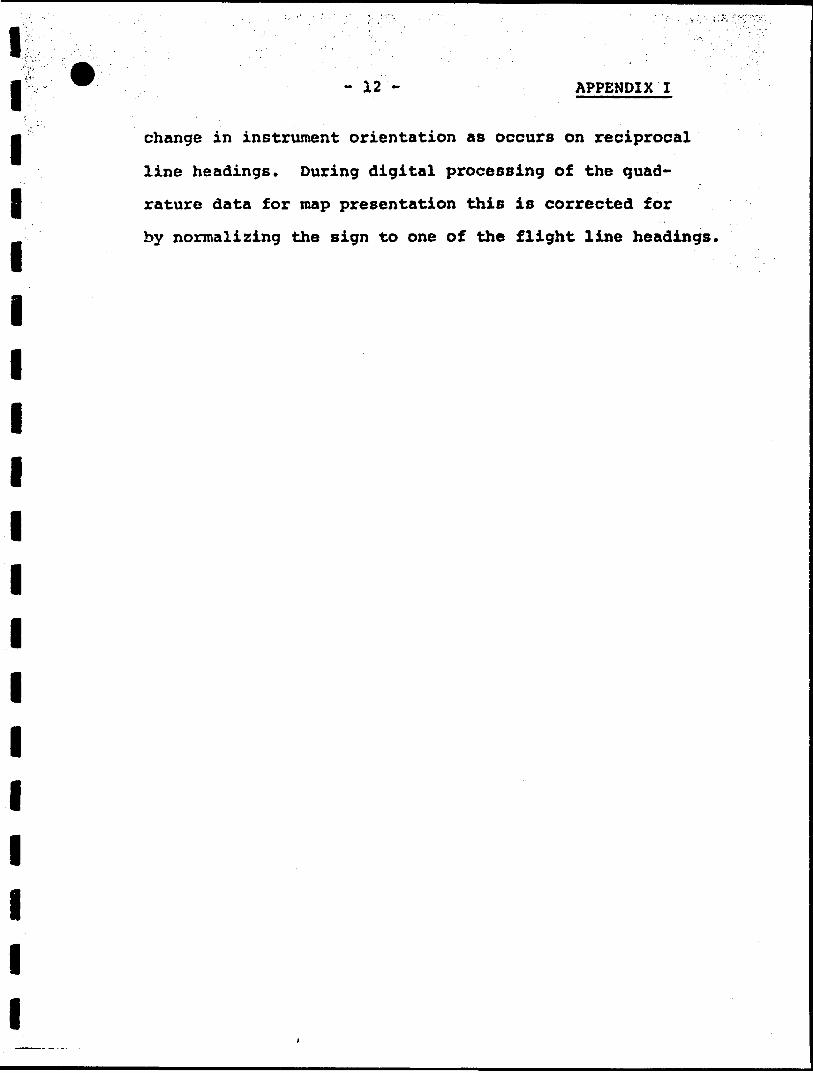
change in instrument orientation as occurs on reciprocal
line headings. During digital processing of the quad
rature data for map presentation this is corrected for
by normalizing the sign to one of the flight line headings,

42C10NE001I NAMEIGOS001I NAMEIGOS 900
Ministry ofNaturalResources
i Ontario
Report of Work(Geophysical, Geological, ' Geochemical and Expenditures)
The Mining Act
Imtructioni: Pleaie type or print.- H number of mining claims traversed
exceeds space on this form, attach a list.Note: - Only .days credits calculated In the
"Expenditure^" section may be enteredin the "Expend. Days Cr." columns.
- Do not use shaded areas below.Type of SurveyU)
Airborne Electromagnetic,Claim Holder d)
Denver Silver Inc 1 Barron
Magnetic, VLF-EM
Boucha rd
Townihip or AreaNameigos
Prospector'* Licence) No.
T.1429/M.21185Addraii
.1550 609 GrimvillA Sf,, Vane""*""- R-P--Survey Company
A&rodat LimitedNeme end Addrett pt Author (of Geo-Techr*ical report)
Fenton Scott, 1? Malabar
Dele of Surviiy (from S, to) Total Mile* Of Una Cut
Place, Don Mills, OntarioCredits Requested per Each Claim in Columns at rightSpecie! Provttior.t
For firn survey:
E m tr 40 di y'. (Trm include* line cutting)
For etch addition*! survey: uiing the same grid:
Enter 20 (toy* (for each)
M*n D* y t
Complete reverse tide tnd enter totil(t) here
Airborne C'ediu
Note: Special provisions credits do not apply to Airborne Survey*.
Geoprtyticel
- Flectfomjpnilic
- M*BnetOmeter
* Radiometric
- Other
Geoiooictl
Geochemlcel
Geoprtyticel
- Electromagnetic
. Megnetomete*
- Rediomeiric
- Other
Geological
Geochemical
Electromaenetic
Meffnetometer
RediometrkyLp
Oayt per Oelm
Oeyt per Claim
. —————
Oeyt pv CUim
2020
20Expenditures (excludes power stripping)Type o* Wore, Performed
Performed on CUim(t)
Calculation of Expenditu'e Deyt C'editi
Totel iKpvnditu'M D*yt
S 4- |l5| - |
out C'editt
Z)Initiuction*
Toul O*yt Crediu mtv b* •ppomoned *i the eUlm hoiox'i cr\olo*. Enter numtxc o* deyt credit* pw cleim (elected In coKtmm ei rl^ht.
Oete
Oct.Recorded Holder or Ajent (Signature)
Certification Verifying Reoort of Work
Mining Claims Traversed (List in numerical sequence)Mining Claim
Prefix
SSmNumber
693704 eList att
Expend. Dayi O.
al:hed
in
Mining Pel mPrefix Number
Expend Day* O.
Total numbeif ol mining ctaimt coveted by thu repO't Of work. 50
l hereby certify that l haw t persona! and intimate knowledge ol the lactt Ml forth m the Report ol Work annex or wit netted tem* during and/or alter itt completion and the annexed 11 port it Hue.
to. raving per formed the work
Name and PotUl Addrett Ol Perion Certifying
Fenton Scott, l? Malabar P^ace, Don Hills, OntarioDate Cextilt*d
Oct 26/83

DENVER SILVER INCORPORATED
LIST OF MINING CLAIMS
SSM 69370W 05^06-y
693709
1112
698056-57585960
8698207
080910
SSM 698212 13
x 16/^7/18/
202122s2272829303132
S373839
Total 50 claims
R ^— ^*nm\f M T,
E C E l V E r
A.M.NOV 7B83

1983 11 07 2.5967
Mrs. H.V. St. JulesMining RecorderMinistry of Natural Resources875 Queen Street EastP.O. Box 669Sault Ste. Marie, OntarioP6A 5N2
Dear Madam:
We have received reports and maps for an Airborne Geophysical (Electromagnetic and Magnetometer) and VLF) survey submitted on mining claims SSM 693704 et al 1n the Township of Nameigos.
This material will be examined and assessed and a statement of assessment work credit* will be Issued.
Ue do not have a copy of the report of work which 1s normally filed with you prior to the submission of this technical data. Please forward a copy as soon as possible.
Yours very truly,
E.F. AndersonDirectorLand Management Branch
Whitney Block, Room 6643 Queen's Park Toronto, Ontario H7A 1W3 Phone:(416)965-1380
A. Barr:we
cc: Denver Silver Inc 11030609 Granvllle Street Vancouver, B.C. V7Y 1C6
cc: Fenton Scott 17 Malabar Place Don Hills, Ontario M3B 1A4

Natural GeotechnicalVVy Resources RePort omario A Approval
FII*
Mining Lands Comments
r* o***.Commtnu
Q With to M* *eain with co"*ciiont
j To: Geology - Expenditures
Commtntl
Q With to t** *0*m with C(wi*cl.oo*
l To: GeochamistryComm*nti
l
S*\s^2jcl. J
[~1 With to M* *Q*ir. with coff*CttontD* t*
j ]TO: Mining Lands Section. Room 6462. Whitney Block. (Tel: 5-1380)
1693 (8 vi 0)

Ontario
Ministry of Natural Resources
GEOPHYSICAL - GEOLOGICAL - GEOCHEMICAL TECHNICAL DATA STATEMENT
File.
TO BE ATTACHED AS AN APPENDIX TO TECHNICAL REPORTFACTS SHOWN HERE NEED NOT BE REPEATED IN REPORT
TECHNICAL REPORT MUST CONTAIN INTERPRETATION. CONCLUSIONS ETC.
J S.O jjnj
Type of Survcy(f) Township or Area
Airborne ?:lectroraagnetio f Magnc tie, VLF-EH
flmoi M,N1NG Denver Silver Tnc LUt numerically
Survey rnmpany Aemdafc T.iml SSM 693701* o t al
Author of Report Fenton Scott
Addreii of Author l? Kalabar Place?. Don Kills.
Covering Dates of Survey.
Total Miles of Line Cut
Fabch 26 -28. 1985
SPECIAL PROVISIONS CRKDITS RKQUKSTE1)
ENTER 40 days (includes line cutting) for first survey.
ENTER 20 days for each additional survey using same grid.
Geophysical
-Electromagnetic
-Magnetometer
-Radiometric
-Other ^^
Geological.
Geochemical.
AIRBORNE CREDITS (Speci*) pr ovuion credit* do not •pply to *irbof ne rarvcyi)
Magnetometer Ei. Electromagnetic.(enter d*yi per du m)
D ATE JAuthor o f Report or Afeni
Res. Geol. . .^^....
Previous Surveys File No. Type
.Qualifications.
Date Claim Holder
TOTAL CLAIMS.
37 (ft/791
SELF POTENTIALInstrument______________________-—--.—----^_______. Range. Survey Method——————————————————————————————————,
Corrections made.
RADIOMETRIC Instrument.———Values measured
Energy windows (levels) ———-—————-——.——..—,-...—.^--.-.——.——^.—.-.— Height of instrument —————————————————— . ___ . ____ .Backgroi id Count , Size of detector —-—-—--—-—-—-—--—-———-....—.....-.——.—.™—.——.————^
Overburden __________________________________________ . --—..-.(type, depth - Include outcrop map)
OJJH.KS ISK.1SM1C, DRIl.i. WK1.L UH.dINC; KJC.)
Type of survey———————————————————————
Instrument __________ ———————————— ——,—
Parameters measured.
Additional information (for understanding results).
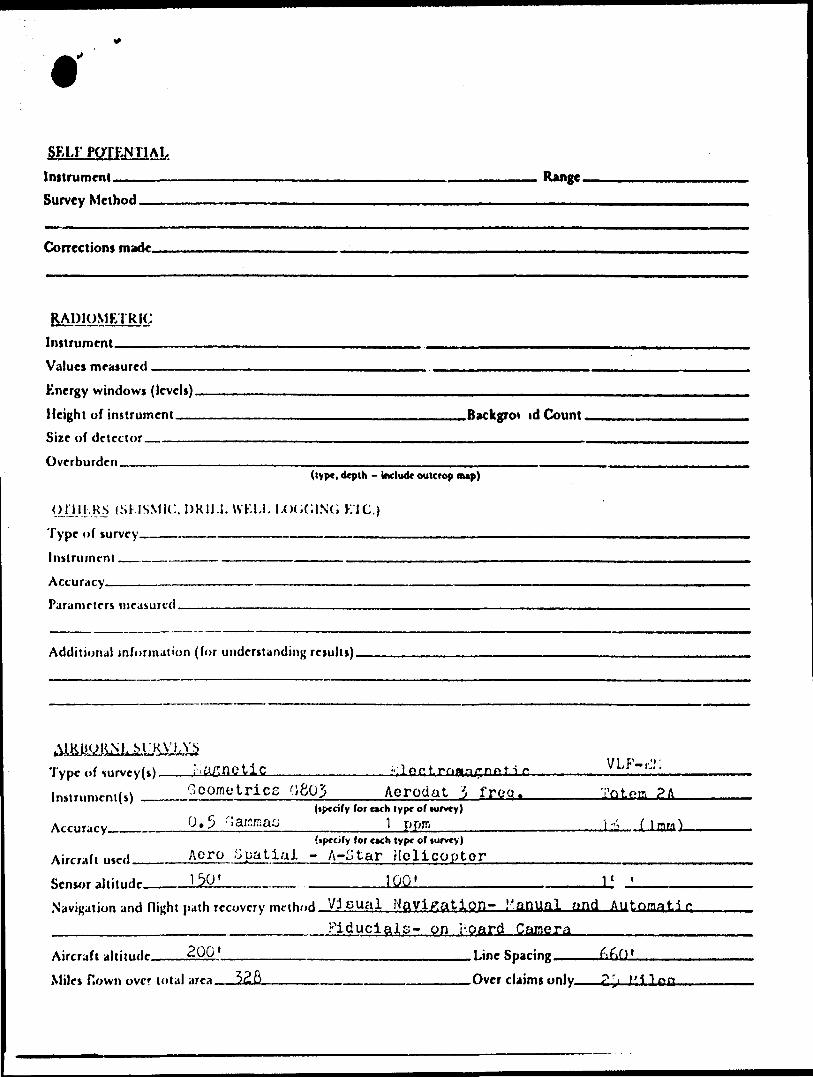
Type of survcy(s)___lnstrumcnt( s ) ___Geometrics 'rtQl____Aerodat 'lj frog.______Tot^r. ?A
(tpccify for och type of lurvey)Accuracy______0.3 ".arfjaas_________l ppm______________Li—LLciittL
(iprcify for och type of lurvty)Aircraft used ____Aero Spatial - A-Star Holicoptor------.-,-—--1.^..,.-—1—^.Sensor altitude.. . ^0*_______ _______mCJ____________—————U J————Navigation and night path recovery m f-ihnri VJ sual Navigation- I'anual and Automatic __________n.——._______Fiducials- on I'oard Cai^eya---—.—^..-—-—--—Aircraft aMitu^*1 — 200'————————_______________Ljnc Spacing———— Miles f.own over total arra 526___________________Over claims only g^. f'j
m x
(T1
o r
m
O s m

H)
Q
0
o re R •e w
I *
* x
**
c
p
?
^
W
y.
^~
^
X
^
2
2
^ |
c 0
o
S
S
m
x
s S
1 f
; d
x H
-n
H
t/l
-n
W
0
D
D
"Z.
r-
M m
r-
^
is ~-r
O ID
w -—
t 1 en
Tl
^^^M
^H
^M
J^ X m w 5 H T O "Z.
-n 33 O D en •o
O C/) -l O
••^V
^M
.-D m ~n
m rn z
o
m CO
STR
ICK
LAN
D
TWP.
C
-Z285
--t—
-Is
|i
2 s]
S
Si
g S
1 ,-
5 g!
S
ii
s 2
S -
Z S
zf
- 3
ci
w
t 1*
' *
'5
i '
*
1 S
i-—
J-"
-;|
--".
T —
— s
---
1,5
12
^1
*5
M ,
S t"
i 2
IS .
S w
. o
™
I
Z !
4
S'
"
a-!
S
a
Irt
| *
(-
|o~
)^|S
j~l
S| 1
S[ ;
s!
s
ii !
f ijs
1 1
do
w
n
i CM
i
^r.
i d
-,.--
K--H
--
' -
. ~
'
S S
Si
2 St
S
St
* ~
^~
I~-
r-4
"*
S|T
2
?
.'l*
(A
*
(nlO
l W
lO)
S '
S 1
S i
* *i
2
z,
* z'
2
S 'm
~
S l
o1 5
'5-
- 4.
.. L
.. - - -
i -"
- i
-*.
'S
M
i g
r O
) U
T j
ifi
Ufl
1 n
U
t 1
fi
'"l
4*k
V
J
••U
)l
''S1
* H
A
Ci
*
S.
m
wi
*"
' w
iy*i
^
i w
' w
*'
A z
1 T
. s
rt i
a 's
15 ii
i5
' ,
- ̂
- -
-fli-
^ v
,.
[. , ̂
u , .
i *
ig
i
1 ^
rttfl'xU
^^j'
J W
^
I
^
I
'S
^L
^'^
lA-lX
-"..^
.-'!'-
.^.!.
® j
s ( ^
| i
io
2 s!
a Is
*'
r. S
!^
!sS|
L
L
J
1 *
t
' S
|3
'
'01
^
m
w'e
n
w|0
) 2
f*~
^4
"^~
""tl~
~
— ^
t s
S ?
Si 2
Sg
" S
2 .
S S
.^ -
i,1
5 S
1i*
A
Ziit
z'a
*
- Z
1*
w'
00
S'
'W
N
lro
(N
'
' '3
I'M
*i*
Si
,O
*O
l
1"
ID
i *
*B
'~
j^o
j.
w ^ "
^^
^o,
, g
. , j
iis
^!
s Sl
* "'S
Si
s "~
sl~* ~
gt~~
~ J
i * a
i^ i *
i^. *
i 1 1
r s
s"! g
sis
si
s s!
* ~~
sT^r~
c-"i
i *
|S
iK
1 5
's
i**C
Z|
0
.(0
'O
* rt
|
N
'o
\
L '
1
' A
. '
ii
! i
s |
sif
i] l
i|:
~~#lri
i S
g , u
' s
iz
[ f
T""
| H
- - -
-i---
- -t-
----
-J-
- - -
J- --
^4i
ft
"A
en
"'i
en
S'
m
*5 '
2
-^ ..
, —
tA
co
w
m
""
'w
12
,™
^i*-^
1^
ui1
if
z
t
*|*
El
*
K,*
e
l*.
Z)
'S
a i
2 |
q "5
ig
,
1 ^
K
a
^'
m
W,
oi
w'*
~
~w
1""
,.,~
~~
wl
CD
w j
os
f
\tx
i
' eo
**
l OB
vi
' i
wi
1 ."L
u
i 1
N
—5
—
1
'S
N
W
1 *
1 S
'
0
l1
' '
4
l t
*
'Irt
1 3
S
[o
w,
en
J"
ftS
("S
i01
W
T iR
"~
"uiT
~ifl~
"^,
Zi*
3
1*
Zl
co
^
*
z
l eo
S
1 m
S
' ?
S
i 2
w
lis
'B
i
* "t
*
*. ^
* *i
*
B.
* S
, S
z,iw
1
* l"
1^
^IM
|
W
lg
5
,,
. . -L
-.-i-.
J m
,
v*L
N j.
i*
s -.
w
i -4
w ,
-j
tor -----r --
-n^-t
"--—
- -
7 -—
- -
,- —
-—
i
w,
o
(A. O
-f
l'oi
*A'
f,
ffi
S'*
1 W
*
or i
*- ^
|
S'*
. ~
, fr
S
i CD
ui|\''O
iw
i Q)
w
(o
m
l a
i*
ien
^^,^
•a 'Is
'
- E'
?Zl
* !
S *'
s B!
2 s|o
JN
l
lw
1 2
' ~
|
0
l"*
' S
'
S '
'^
168433
6 l*"**'
- - - -!SSM
SSM
1
, 1
w"
w
lSi
S
Sl
S l0 S'
El 1 J
J
wl
• y
l '
OD
^1 rn C") T̂T]
O
CD m H
^ ra ro
ro
01
MO
SA
MB
IK
TWP.
M
-I3I
9
en
n
m OD
o o
o l ro
oo OJ
i???
i/"
7*
z-C
±,
u
- a^
^
a c
as g
*-"*
ai *
5
3?
5 D-
T
W 3 n
v JC
r. r
CO > C r*
H O)
H m
e/- c~ ZE m
z t/)
n
E C
~* z
z
x
-~
; .jo
""
x
X
* -
j r
- P
?*
Tj
' '
— *
i ~
-
' T
~ -.
" .
—
z ^
~
5
^
^"^
T*l
*"
^
"
7 i J
S f
^~
-
E*
L—
—
"—
-- ^.
TO
n;
H "C rn
t *
* l
- '
-' r
: .'-
oi
^
* 5
r :-
, '-
. :-
. "
* 7 -
S -
- - 5
r o
co
- -r
T ''-
^ -
,: ^
-- i.
- T-
-- i
:*- T
sc
"n
^ .-
'. i-
- --
,- :
.' -
T, s
-T?
**
*-
- -
r^^"^
' '
c r;
i
^ -:
.- :
: "
:. -.
- s
>c
' S2
: "
' '"
- -
l '"
' "
": ;;
-i .'
^^
^ .
- -
. -"
^^^
i
' ~
. ~ L
c?
^*v
; -'
^
-1
e?f
ms
z,o
tcC
'c.
: .
O
3D
O
E J
.M C
I*
CO <
S
x Oo C
O
i'. i i
m Z
O
Z) m
m
m 33 m 2
O
m
co
AIRBORNE ELECTROMAGNETIC SURVEY a PROFILES
p.p.m. 301
20; 10-
0-
In-phose
Quadrature
AERODAT HEM SYSTEM RESPONSE VERTICAL HALF-PLANE
Horizontal control.. . .. . .. . based on photo laydown
Average bird height .. . . .... .., . . . . ... 30 met r*.
Line spacing ... ..... .,.... . ... ... . . 660 fee*
EM RESPONSEfuctiv
©®©©©©®©©O
•ity thickness in
> 500
250 - 500
125 - 250
60- 125
30-60
15 -30
6-15
4- 8
2- 4
< 2
100IN-PHASE (ppm) 25 Inphase response
TOTAL FIELD MAGNETIC MAPVLF-EM
n LINE"NAA (MAINE) 17.8 KHz
LEGEND
100 gammas
50 gammas
10 gammas
LEGEND
50 /o g ammas
10 /o gammas
2 /o gammas
-90/i l42C10NE001I NAMEIGOS00I1 NAMEIGOS
PROSPECTING GEOPHYSICS LTD.
DENVER SILVER INC.
HORNEPAYNE AREAONTARIO
1/2SCALE 1 /15,840
O 1/2 Mile
l Kilometre
W AERODAT LIMITED
DATE: March 1983
N.T.3. NO: 420,42F