l m - ncert.nic.inncert.nic.in/ncerts/l/kelm103.pdf · 61 unit name experiment once again. the...
TRANSCRIPT

60
LABORATORY MANUALLABORATORY MANUAL
Using a Simple Pendulum plot L – T and L – T2 graphs, hence find theeffective length of second's pendulum using appropriate graph.
Clamp stand; a split cork; a heavy metallic (brass/iron) spherical bobwith a hook; a long, fine, strong cotton thread/string (about 2.0 m);stop-watch; metre scale, graph paper, pencil, eraser.
The most common device used for measuring time in a schoollaboratory is a stop-watch or a stop-clock (analog). As the namessuggest, these have the provision to start or stop their working asdesired by the experimenter.
(a) Stop-Watch
Analog
A stop-watch is a special kind of watch. It has a multipurpose knobor button (B) for start/stop/back to zero position [Fig. E 6.1(b)]. It has
two circular dials, the bigger one for a longer second’s handand the other smaller one for a shorter minute’s hand. Thesecond’s dial has 30 equal divisions, each division repre-senting 0.1 second. Before using a stop-watch you shouldfind its least count. In one rotation, the seconds hand covers30 seconds (marked by black colour) then in the secondrotation another 30 seconds are covered (marked by redcolour), therefore, the least count is 0.1 second.
(b) Stop-Clock
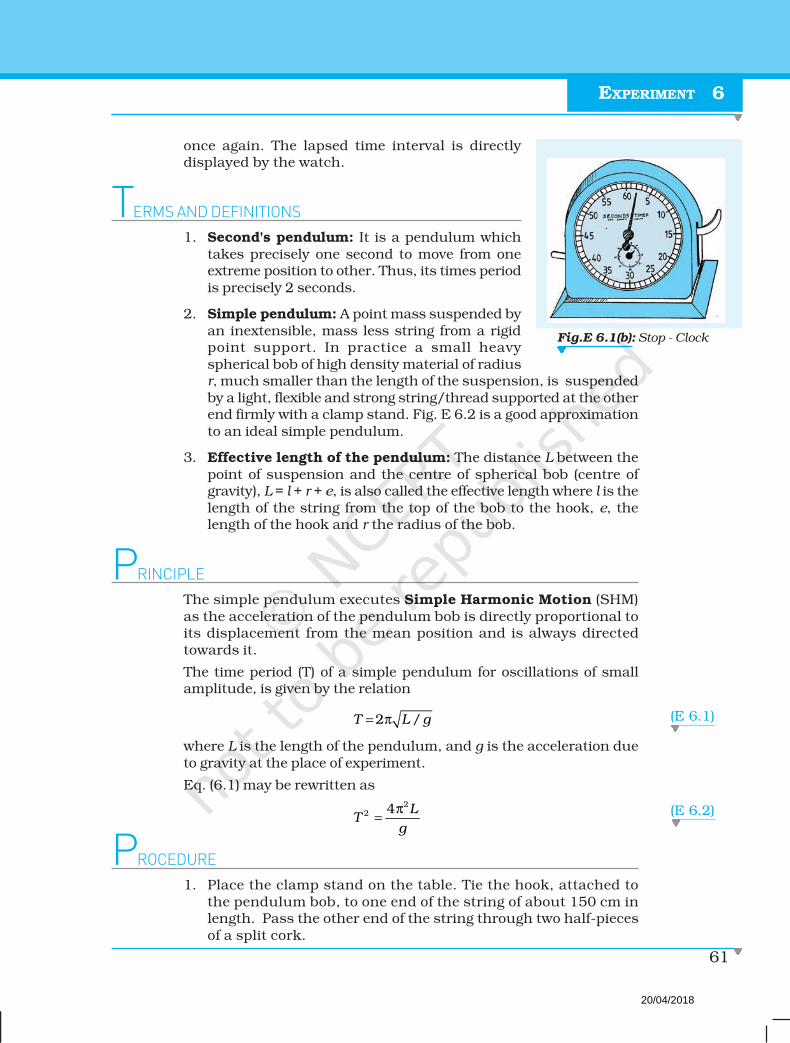
The least count of a stop-watch is generally about 0.1s [Fig.E 6.1(b)] while that of a stop-clock is 1s, so for more accuratemeasurement of time intervals in a school laboratory, astop-watch is preferred. Digital stop-watches are alsoavailable now. These watches may be started by pressingthe button and can be stopped by pressing the same button
Fig.E 6.1(a): Stop - Watch
20/04/2018
61
UNIT NAME
EXPERIMENT
once again. The lapsed time interval is directlydisplayed by the watch.
1. Second's pendulum: It is a pendulum whichtakes precisely one second to move from oneextreme position to other. Thus, its times periodis precisely 2 seconds.
2. Simple pendulum: A point mass suspended byan inextensible, mass less string from a rigidpoint support. In practice a small heavyspherical bob of high density material of radiusr, much smaller than the length of the suspension, is suspendedby a light, flexible and strong string/thread supported at the otherend firmly with a clamp stand. Fig. E 6.2 is a good approximationto an ideal simple pendulum.
3. Effective length of the pendulum: The distance L between thepoint of suspension and the centre of spherical bob (centre ofgravity), L = l + r + e, is also called the effective length where l is thelength of the string from the top of the bob to the hook, e, thelength of the hook and r the radius of the bob.
The simple pendulum executes Simple Harmonic Motion (SHM)as the acceleration of the pendulum bob is directly proportional toits displacement from the mean position and is always directedtowards it.
The time period (T) of a simple pendulum for oscillations of smallamplitude, is given by the relation
T L / g= π2
where L is the length of the pendulum, and g is the acceleration dueto gravity at the place of experiment.
Eq. (6.1) may be rewritten as
LT
g
π=
22 4
1. Place the clamp stand on the table. Tie the hook, attached tothe pendulum bob, to one end of the string of about 150 cm inlength. Pass the other end of the string through two half-piecesof a split cork.
Fig.E 6.1(b): Stop - Clock
(E 6.1)
(E 6.2)
6
20/04/2018

62
LABORATORY MANUALLABORATORY MANUAL
2. Clamp the split cork firmly in the clamp stand such that the line ofseparation of the two pieces of the split cork is at right angles tothe line OA along which the pendulum oscillates [Fig. E 6.2(a)].Mark, with a piece of chalk or ink, on the edge of the table a verticalline parallel to and just behind the vertical thread OA, the positionof the bob at rest. Take care that the bob hangs vertically (about2 cm above the floor) beyond the edge of the table so that it is freeto oscillate.
3. Measure the effective length of simple pendulum as shownin Fig. E 6.2(b).
Fig.E 6.2 (a): A simple pendulum; B and C show
the extreme positions
4. Displace the bob to one side, not more than 15 degrees angulardisplacement, from the vertical position OA and then release it gently.In case you find that the stand is shaky, put some heavy object onits base. Make sure that the bob starts oscillating in a vertical planeabout its rest (or mean) position OA and does not (i) spin about itsown axis, or (ii) move up and down while oscillating, or (iii) revolvein an elliptic path around its mean position.
5. Keep the pendulum oscillating for some time. After completion ofa few oscillations, start the stop-watch/clock as the thread attachedto the pendulum bob just crosses its mean position (say, from leftto right). Count it as zero oscillation.
6. Keep on counting oscillations 1,2,3,…, n, everytime the bob crossesthe mean position OA in the same direction (from left to right).
Fig.E 6.2 (b): Effective length of a
simple pendulum
20/04/2018

63
UNIT NAME
EXPERIMENT
Stop the stop-watch/clock, at the count n (say, 20 or 25) ofoscillations, i.e., just when n oscillations are complete. For betterresults, n should be chosen such that the time taken for n
oscillations is 50 s or more. Read, the total time (t) taken by thebob for n oscillations. Repeat this observation a few times by notingthe time for same number (n) of oscillations. Take the mean ofthese readings. Compute the time for one oscillation, i.e., the timeperiod T ( = t/n) of the pendulum.
7. Change the length of the pendulum, by about 10 cm. Repeat thestep 6 again for finding the time (t) for about 20 oscillations ormore for the new length and find the mean time period. Take 5 or6 more observations for different lengths of penduLum and findmean time period in each case.
8. Record observations in the tabular form with proper units andsignificant figures.
9. Take effective length L along x-axis and T 2 (or T) along y-axis,using the observed values from Table E 6.1. Choose suitable scaleson these axes to represent L and T 2 (or T ). Plot a graph betweenL and T 2 (as shown in Fig. E 6.4) and also between L and T (asshown in Fig. E 6.3). What are the shapes of L –T 2 graph and L –T
graph? Identify these shapes.
(i) Radius (r) of the pendulum bob (given) = ... cm
Length of the hook (given) (e) = ... cm
Least count of the metre scale = ... mm = ... cm
Least count of the stop-watch/clock = ... s
Table E 6.1: Measuring the time period T and effective lengthL of the simple pendulum
S.No.
Length of thestring from the
top of the bob tothe point ofsuspension l
Effectivelength, L =
(l+r+e)
Number ofoscillationscounted, n
Time for n oscillationst (s)
Timeperiod T(= t/n)
(cm) m (i)... (ii) (iii) Meant (s)
s
6
20/04/2018

64
LABORATORY MANUALLABORATORY MANUAL
(i) L vs T graphs
Plot a graph between L versus T from observations recorded inTable E 6.1, taking L along x-axis and T along y-axis. You willfind that this graph is a curve, which is part of a parabola asshown in Fig. E 6.3.
(ii) L vs T 2 graph
Plot a graph between L versus T 2 from observations recorded inTable E 6.1, taking L along x-axis and T 2 along y-axis. You willfind that the graph is a straight line passing through origin as shownin Fig. E. 6.4.
(iii) From the T 2 versus L graph locate the effective length of second'spendulum for T 2 = 4s2.
Fig. E 6.3: Graph of L vs T Fig. E 6.4: Graph L vs T 2
1. The graph L versus T is curved, convex upwards.
2. The graph L versus T 2 is a straight line.
3. The effective length of second's pendulum from L versus T 2 graphis ... cm.
Note : The radius of bob may be found from its measureddiameter with the help of callipers by placing the pendulum bobbetween the two jaws of (a) ordinary callipers, or (b) VernierCallipers, as described in Experiment E 1.1 (a). It can also befound by placing the spherical bob between two parallel cardboards and measuring the spacing (diameter) or distance betweenthem with a metre scale.
20/04/2018

65
UNIT NAME
EXPERIMENT
1. The accuracy of the result for the length of second's pendulumdepends mainly on the accuracy in measurement of effective length(using metre scale) and the time period T of the pendulum (usingstop-watch). As the time period appears as T 2 in Eq. E 6.2, a smalluncertainty in the measurement of T would result in appreciableerror in T 2, thereby significantly affecting the result. A stop-watchwith accuracy of 0.1s may be preferred over a less accuratestop-watch/clock.
2. Some personal error is always likely to be involved due to stop-watchnot being started or stopped exactly at the instant the bob crossesthe mean position. Take special care that you start and stop thestop-watch at the instant when pendulum bob just crosses themean position in the same direction.
3. Sometimes air currents may not be completely eliminated. Thismay result in conical motion of the bob, instead of its motion invertical plane. The spin or conical motion of the bob may cause atwist in the thread, thereby affecting the time period. Take specialcare that the bob, when it is taken to one side of the rest position,is released very gently.
4. To suspend the bob from the rigid support, use a thin, light, strong,unspun cotton thread instead of nylon string. Elasticity of thestring is likely to cause some error in the effective length of thependulum.
5. The simple pendulum swings to and fro in SHM about the mean,equilibrium position. Eq. (E 6.1) that expresses the relation
between T and L as T = L gπ2 / , holds strictly true for small
amplitude or swing θ of the pendulum.
Remember that this relation is based on the assumption that sinθ ≈ θ, (expressed in radian) holds only for small angulardisplacement θ.
6. Buoyancy of air and viscous drag due to air slightly increase thetime period of the pendulum. The effect can be greatly reduced toa large extent by taking a small, heavy bob of high density material(such as iron/ steel/brass).
1. Interpret the graphs between L and T 2, and also between L and Tthat you have drawn for a simple pendulum.
2. Examine, using Table E 6.1, how the time period T changes as the
6
20/04/2018

66
LABORATORY MANUALLABORATORY MANUAL
SUGGESTED ADDITIONAL EXPERIMENTS/ACTIVITIES
1. To determine 'g', the acceleration due to gravity, at a given place,from the L – T 2 graph, for a simple pendulum.
2. Studying the effect of size of the bob on the time period of thesimple pendulum.
[Hint: With the same experimental set-up, take a few sphericalbobs of same material (density) but of different sizes (diameters).Keep the length of the pendulum the same for each case. Clampthe bobs one by one, and starting from a small angular displacementof about 10o, each time measure the time for 50 oscillations. Findout the time period of the pendulum using bobs of different sizes.Compensate for difference in diameter of the bob by adjusting thelength of the thread.
Does the time period depend on the size of the pendulum bob? Ifyes, see the order in which the change occurs.]
3. Studying the effect of material (density) of the bob on the timeperiod of the simple pendulum.
[Hint: With the same experimental set-up, take a few sphericalbobs (balls) of different materials, but of same size. Keep thelength of the pendulum the same for each case. Find out, in eachcase starting from a small angular displacement of about 10°, thetime period of the pendulum using bobs of different materials,
Does the time period depend on the material (density) of thependulum bob? If yes, see the order in which the change occurs.If not, then do you see an additional reason to use the pendulumfor time measurement.]
4. Studying the effect of mass of the bob on the time period of thesimple pendulum.
[Hint: With the same experimental set-up, take a few bobs ofdifferent materials (different masses) but of same size. Keep thelength of the pendulum same for each case. Starting from a smallangular displacement of about 10° find out, in each case, the timeperiod of the pendulum, using bobs of different masses.
Does the time period depend on the mass of the pendulum bob? Ifyes, then see the order in which the change occurs. If not, thendo you see an additional reason to use the pendulum as a timemeasuring device.]
5. Studying the effect of amplitude of oscillation on the time period ofthe simple pendulum.
[Hint: With the same experimental set-up, keep the mass of thebob and length of the pendulum fixed. For measuring the angularamplitude, make a large protractor on the cardboard and have ascale marked on an arc from 0° to 90° in units of 5°. Fix it on theedge of a table by two drawing pins such that its 0°- line coincides
effective length L of a simple pendulum; becomes 2-fold, 4-fold,and so on.
3. How can you determine the value of 'g', acceleration due to gravity,from the T 2 vs L graph?
20/04/2018

67
UNIT NAME
EXPERIMENT
with the suspension thread of the pendulum at rest. Start thependulum oscillating with a very large angular amplitude (say 70°)and find the time period T of the pendulum. Change the amplitudeof oscillation of the bob in small steps of 5° or 10° and determinethe time period in each case till the amplitude becomes small (say5°). Draw a graph between angular amplitude and T. How doesthe time period of the pendulum change with the amplitude ofoscillation?
How much does the value of T for A = 10° differ from that for A=50° from the graph you have drawn?
Find at what amplitude of oscillation , the time period begins to vary?
Determine the limit for the pendulum when it ceases to be a simplependulum.]
6. Studying the effect on time period of a pendulum having a bob ofvarying mass (e.g. by filling the hollow bob with sand, sand beingdrained out in steps)
[Hint: The change in T, if any, in this experiment will be so smallthat it will not be possible to measure it due to the following reasons:
The centre of gravity (CG) of a hollow sphere is at the centre of thesphere. The length of this simple pendulum will be same as that ofa solid sphere (same size) or that of the hollow sphere filledcompletely with sand (solid sphere).
Drain out some sand from the sphere. The situation is as shown inFig. E. 6.5. The CG of bob now goes down to point say A. Theeffective length of the pendulum increases and therefore the T
A
increases (TA > T
O), some more sand is drained out, the CG goes
down further to a point B. The effective length further increases,increasing T.
The process continues and L and T change in the same direction(increasing), until finally the entire sand is drained out. The bob isnow a hollow sphere with CG shifting back to centre C. The timeperiod will now become T
0 again.]
Fig. E 6.5: Variation of centre of gravity of sand filled
hollow bob on time period of the pendulum;
sand being drained out of the bob in steps.
SandA
B
C
6
20/04/2018

68
LABORATORY MANUALLABORATORY MANUAL
To study the relation between force of limiting friction and normalreaction and to find the coefficient of friction between surface of amoving block and that of a horizontal surface.
A wooden block with a hook, a horizontal plane with a glass orlaminated table top (the table top itself may be used as a horizontalplane), a frictionless pulley which can be fixed at the edge of thehorizontal table/plane, spirit level, a scale, pan, thread or string, springbalance, weight box and five masses of 100 g each.
Friction: The tendency to oppose the relative motion between twosurfaces in contact is called friction.
Static Friction: It is the frictional force acting between two solidsurfaces in contact at rest but having a tendency to move (slide) withrespect to each other.
Limiting Friction: It is the maximum value of force of static frictionwhen one body is at the verge of sliding with respect to the other bodyin contact.
Kinetic (or Dynamic) Friction: It is the frictional force acting betweentwo solid surfaces in contact when they are in relative motion.
The maximum force ofstatic friction, i.e., limitingfriction, F
L, between two
dry, clean and unlubricatedsolid surfaces is found toobey the following empiricallaws:
(i) The limiting friction is
Fig. E 7.1: The body is at rest due to
static friction
20/04/2018

69
UNIT NAME
EXPERIMENT
directly proportional to the normal reaction, R, which is given bythe total weight W of the body (Fig. E 7.1). The line of action issame for both W and R for horizontal surface,
FL ∝ R ⇒ F
L = µ
LR
i.e. µL =
LF
R
Thus, the ratio of the magnitude of the limiting friction, FL, to the
magnitude of the normal force, R, is a constant known as thecoefficient of limiting friction (µ
L) for the given pair of surfaces in
contact.
(ii) The limiting friction depends upon the nature of surfaces in contactand is nearly independent of the surface area of contact over widelimits so long as normal reaction remains constant.
Note that FL= µ
LR is
an equation of astraight line passingthrough the origin.Thus, the slope of thestraight-line graphbetween F
l (along Y-
axis) and R (along X-axis) will give thevalue of coefficient oflimiting friction µ
L.
In this experiment,the relationshipbetween the limitingfriction and normalreaction is studied for a wooden block. The wooden block is madeto slide over a horizontal surface (say glass or a laminated surface)(Fig. E 7.2).
1. Find the range and least count of the spring balance.
2. Measure the mass (M) of the given wooden block with hooks on itssides and the scale pan (m) with the help of the spring balance.
3. Place the glass (or a laminated sheet) on a table and make ithorizontal, if required, by inserting a few sheets of paper orcardboard below it. To ensure that the table-top surface ishorizontal use a spirit level. Take care that the top surface mustbe clean and dry.
Fig. E 7.2: Experimental set up to study limiting friction
( )m+q g
q
Pulley
Clear glass (orwood mica) top
Pan
R M p g= ( + )
F
( )M+p g
7
20/04/2018

70
LABORATORY MANUALLABORATORY MANUAL
4. Fix a frictionless pulley on one edge of table-top as shown in Fig.E 7.2. Lubricate the pulley if need be.
5. Tie one end of a string of suitable length (in accordance with thesize and the height of the table) to a scale pan and tie its other endto the hook of the wooden block.
6. Place the wooden block on the horizontal plane and pass the stringover the pulley (Fig. E7.2). Ensure that the portion of the stringbetween pulley and the wooden block is horizontal. This can bedone by adjusting the height of the pulley to the level of hook ofblock.
7. Put some mass (q) on the scale pan. Tap the table-top gently withyour finger. Check whether the wooden block starts moving.
8. Keep on increasing the mass (q) on the scale pan till the woodenblock just starts moving on gently tapping the glass top. Recordthe total mass kept on the scale pan in Table E 7.1.
9. Place some known mass (say p ) on the top of wooden block andadjust the mass (q′) on the scale pan so that the wooden blockalongwith mass p just begins to slide on gently tapping the tabletop. Record the values of p′ and q′ in Table E 7.1.
10.Repeat step 9 for three or four more values of p and record thecorresponding values of q in Table E 7.1. A minimum of fiveobservations may be required for plotting a graph between F
L and
R.
1. Range of spring balance = ... to ... g
2. Least count of spring balance = ... g
3. Mass of the scale pan, (m) = ... g
4. Mass of the wooden block (M) = ... g
5. Acceleration due to gravity (g) at the place of experiment= ... m/s2
Table E 7.1: Variation of Limiting Friction with NormalS.No.
Mass on thewooden block
(p) (g)
Normalforce R due
to mass(M+p)
Mass onthe pan
(q) g
Force oflimitingfriction F
L
Coefficientof friction
LL
F
Rµ =
(g) (kg)
Mean L
N (g) (kg) (N)
12345
20/04/2018

71
UNIT NAME
EXPERIMENT
Reaction
Plot a graph between the limiting friction (FL) and
normal force (R) between the wooden block and thehorizontal surface, taking the limiting friction F
L
along the y-axis and normal force R along the x-axis. Draw a line to join all the points marked on it(Fig. E 7.3). Some points may not lie on the straight-line graph and may be on either side of it. Extendthe straight line backwards to check whether thegraph passes through the origin. The slope of thisstraight-line graph gives the coefficient of limitingfriction (µ
L) between the wooden block and the
horizontal surface. To find the slope of straight line,choose two points A and B that are far apart fromeach other on the straight line as shown in Fig. E7.3. Draw a line parallel to x-axis through point Aand another line parallel to y-axis through point B.Let point Z be the point of intersection of these two lines. Then, theslope µ
L of straight line graph AB would be
LL
F BZ= =
R AZµ
The value of coefficient of limiting friction µL between surface of wooden
block and the table-top (laminated sheet/glass) is:
(i) From calculation (Table E 7.1) = ...
(ii) From graph = ...
1. Surface of the table should be horizontal and dust free.
2. Thread connecting wooden block and pulley should be horizontal.
3. Friction of the pulley should be reduced by proper oiling.
4. Table top should always be tapped gently.
1. Always put the mass at the centre of wooden block.
Fig. E 7.3: Graph between force of
limiting friction FL and
normal reaction, R
7
20/04/2018

72
LABORATORY MANUALLABORATORY MANUAL
2. Surface must be dust free and dry.
3. The thread must be unstretchable and unspun.
1. The friction depends on the roughness of the surfaces in contact.
If the surfaces in contact are ideally (perfactly) smooth, there
would be no friction between the two surfaces. However, there
cannot be an ideally smooth surface as the distribution of atoms
or molecules on solid surface results in an inherent roughness.
2. In this experimental set up and calculations, friction at the pulley
has been neglected, therefore, as far as possible, the pulley, should
have minimum friction as it cannot be frictionless.
3. The presence of dust particles between the wooden block and
horizontal plane surface may affect friction and therefore lead
to errors in observations. Therefore, the surface of the
horizontal plane and wooden block in contact must be clean
and dust free.
4. The presence of water or moisture between the wooden block
and the plane horizontal surface would change the nature of
the surface. Thus, while studying the friction between the surface
of the moving body and horizontal plane these must be kept
dry.
5. Elasticity of the string may cause some error in the observation.
Therefore, a thin, light, strong and unspun cotton thread must
be used as a string to join the scale pan and the moving block.
6. The portion of string between the pulley and wooden block must
be horizontal otherwise only a component of tension in the string
would act as the force to move the block.
7. It is important to make a judicious choice of the size of the block
and set of masses for this experiment. If the block is too light, its
force of limiting friction may be even less than the weight of empty
pan and in this situation, the observation cannot be taken with
the block alone. Similarly, the maximum mass on the block, which
can be obtained by putting separate masses on it, should not be
very large otherwise it would require a large force to make the
block move.
8. The additional mass, p, should always be put at the centre of
wooden block.
20/04/2018

73
UNIT NAME
EXPERIMENT
SUGGESTED ADDITIONAL EXPERIMENTS/ACTIVITIES
1. To study the effect of the nature of sliding surface. [Hint: Repeatthe same experiment for different types of surfaces say, plywood,carpet etc. Or repeat the experiment after putting oil or powder onthe surface.]
2. To study the effect of changing the area of the surfaces in contact.[Hint: Place the wooden block vertically and repeat the experiment.Discuss whether the readings and result of the experiment are same.]
3. To find the coefficient of limiting friction by sliding the block on aninclined plane.
9. The permissible error in measurements of coefficient of friction
= L
L
F R...
F R
∆ ∆+ =
1. On the basis of your observations, find the relation betweenlimiting friction and the mass of sliding body.
2. Why do we not choose a spherical body to study the limitingfriction between the two surfaces?
3. Why should the horizontal surfaces be clean and dry?
4. Why should the portion of thread between the moving body andpulley be horizontal?
5. Why is it essential in this experiment to ensure that the surfaceon which the block moves should be horizontal?
6. Comment on the statement: “The friction between two surfacescan never be zero”.
7. In this experiment, usually unpolished surfaces are preferred,why?
8. What do you understand by self-adjusting nature of force offriction?
9. In an experiment to study the relation between force of limitingfriction and normal reaction, a body just starts sliding on applyinga force of 3 N. What will be the magnitude of force of frictionacting on the body when the applied forces on it are 0.5 N, 1.0 N,2.5 N, 3.5 N, respectively.
7
20/04/2018