l report for # - nasa · alan stern \ southwest research institute j division 15 boulder extension...
TRANSCRIPT

NASA-CR-199728
SwRI Proposal No. 15-4971November 8,1995
l Report for #
STUDIES OF EXTRA-SOLAR OORT CLOUDS ANDTHE KUIPER DISK
NASA GRANT NO.: NAGW-3023r(NASA-CR-199728) STUDIES OF N96-14608EXTRA-SOLAR OORT CLOUDS AND THEKUIPER DISK Semiannual Report[(Southwest Research Inst.) 44 p Unclas
Submitted by: !1 G3/90 0077327
Alan Stern \Southwest Research Institute jDivision 15 Boulder Extension Office v - -Geophysical, Astrophysical, and Planetary Sciences Section1050 Walnut, Suite 429Boulder, Colorado 80302303/546-9670 FAX 303/546-9687
SOUTHWEST RESEARCH INSTITUTEInstrumentation and Space Research Division6220 Culebra Road, San Antonio, Texas 78238(210) 684-5111 • FAX (210)647-4325
https://ntrs.nasa.gov/search.jsp?R=19960007442 2018-08-28T08:04:30+00:00Z

INTRODUCTION
This is the September 1995 Semi-Annual reportStudies of Extra-Solar Oort Clouds and the Kuiper Disk, (S.A. Stern, PI).
We are conducting research designed to enhance our understanding of the evolution anddetectability of comet clouds and disks. This area holds promise for also improving our under-standing of outer solar system formation, the bombardment history of the planets, the transportof volatiles and organics from the outer solar system to the inner planets, and to the ultimate fateof comet clouds around the Sun and other stars. According to "standard" theory, both the KuiperDisk and the Oort Cloud are (at least in part) natural products of the planetary accumulation stageof solar system formation. One expects such assemblages to be a common attribute of other solarsystems. Therefore, searches for comet disks and clouds orbiting other stars offer a new methodfor inferring the presence of planetary systems.
This project consists of two major efforts: (1) observational work to predict and search forthe signatures of Oort Clouds and comet disks around other stars; and (2) modelling studies ofthe formation and evolution of the Kuiper Disk (KD) and similar assemblages that may residearound other stars, including (3 Pic. These efforts are referred to as Task 1 and 2. The maincollaborators with PI Stern in Task 1 are Cols Drs. David Weintraub (Vanderbilt U.) and MikeShull (U. Colorado). The main collaborator in Task 2 is Col Dr. Glen Stewart (U. Colorado).
RECENT PROGRESS
Task 1: Observational Studies of Comet Disks and Clouds
Last year we completed 2 new observing runs at the IRAM and SEST submm telescopes tostudy one of the best IRAS IR-excess comet cloud candidates, a PsA (Fomalhaut), T Ceti, ft Pic,and HD98800. Our HD98800 measurements were judged of immediate interest and published inan IAU Circular (IAUC 6003; June 1994).
Our observing work will continue in early 1996 with multi-channel bolometer observationsof IR excess stars at IRAM and (if approved) a CSO run to survey ~ 15 pulsars for evidence ofcold dust emission indicative of planetary formation.
In parallel with our observing program, two papers on theoretical subjects related to cometcloud and planetary detection have been completed, submitted, and published. In the first, PIStern developed a new method for directly detecting planets. This method is based on the factthat giant impacts, like the one forming the Earth-Moon system, cause the target planet to becomeIR-luminous for several hundred to several thousand years. The paper demonstrates (i) that suchevents will be detectable from the twin-Keck interferometer, and (ii) that in a young star clusterlike Orion, between one and a few such "hot planets" should be extant at any given time. In thesecond paper, PI Stern and collaborator Shull have shown that the lack of a galactic population ofGamma Ray Bursters (GRBs) constrains the fraction of stars in the galaxy that have Oort Clouds

to < 20%. These papers have now appeared in print.
Task 2: Collisional Modelling of the Kuiper Disk
We have now completed the first model of collision rates of the Kuiper Disk. With thismodel we explored the rate of collisions among bodies in the present-day Kuiper Disk as a function
of the total mass and population size structure of the Disk. We find that collisional evolution is animportant evolutionary process in the Disk as a whole, and indeed, that it is likely the dominant
evolutionary process beyond « 42 AU, where dynamical instability timescales exceed the age of
the solar system. Two key findings we report from this modelling work are: (i) That unless the
Disk's population structure is sharply truncated for radii smaller than ~l-2 km, collisions between
comets and smaller debris are occurring so frequently in the Disk, and with high enough velocities,
that the small body (i.e., km-class object) population in the disk has probably developed into a
collisional cascade, thereby implying that the Kuiper Disk comets may not all be primordial, and(ii) that the rate of collisions of smaller bodies with larger 100 < R < 400 km objects (like 1992QBi
and its cohorts) is so low that there appears to be a dilemma in explaining how QBiS could havegrown by binary accretion in the disk as we know it. Given these findings, it appears that eitherthe present-day paradigm for the formation of Kuiper Disk is failed in some fundamental respect,
or that the present-day disk is no longer representative of the ancient structure from which it
evolved. In particular, it appears that the 30-50 AU region of the Kuiper Disk has very likely
experienced a strong decrease in its surface mass density over time. This in turn suggests the
intriguing possibility that the present-day Kuiper Disk evolved through a more erosional stage
reminiscent of the disks around the A-stars /? Pictorus, a PsA, and a Lyr. These results were
published in The Astronomical Journal this year.We have also used this model and a second code to estimate the detectability of IR emission
from debris created by collisions. We found that eccentricities in the Kuiper Disk are high enoughto promote erosion on virtually all objects up to ~ 30 km, independent of their impact strength.
Larger objects, such as the 50-170 km radius "QBi" population, will suffer net erosion if theirorbital eccentricity is greater than « 0.05 (« 0.1) if they are structurally weak (strong). The
model predicts a net collisional erosion rate from all objects out to 50 AU ranging from 3 x 10¹⁶ to
1019 g yr,"1 depending on the mass, population structure, and mechanical properties of the objects
in the Disk. We find two kinds of collisional signatures that this debris should generate. First, there
should be a relatively smooth, quasi-steady-state, longitudinally isotropic, far IR (i.e, ~ 60 /im
peak) emission near the ecliptic in the solar system's invariable plane ecliptic, caused by debris
created by the ensemble of ancient collisions. The predicted optical depth of this emission could beas low as 7 X 10~8, but is most likely between 3 X 10~7 and 5 X 10~6. We find that this signaturewas most likely below IRAS detection limits, but that it should be detectable by both ISO and
SIRTF. Second, very recent impacts in the disk should produce short-lived, discrete clouds withsignificantly enhanced, localized IR emission signatures superimposed on the smooth, invariable
plane emission. These discrete clouds should have angular diameters up to 0.2 deg, and annual

parallaxes up to 2.6 deg. Indiv idua l expanding clouds (or trails) should show significant temporalevolution over timescales of a few years. As few as zero or as many as several 102 such cloudsmay be detectable in a complete ecliptic survey at ISO's sensitivity, depending on the population
structure of the Kuiper Disk. This work was recently accepted for publication in Astronomy &Astrophysics. This paper is attached in preprint form.
These two papers were also accompanied by an invited review, submitted to the Planetary
Ices book, summarizing the present state of knowledge about the Kuiper Disk and Pluto. Addi-tionally, PI Stern gave three invited talks summarizing the collisional modelling results obtainedunder the Origins program. A list of these invited talks is attached.
Finally, in July 1995, we organized and sponsored a 2-day workshop on collisions in the
Kuiper Disk. This workshop was attended by D. Davis (PSI), P. Farinella (Italy), R. Canup
(U. Colorado), M. Festou (France), J. Colwell (U. Colorado), H. Levison (SwRI), and PI Stern
(SwRI). The proceedings of this workshop were informally published and the distributed among
the participants. A copy was also sent to Origins program scientist Trish Rogers.

RELEVANT PUBLICATIONS
The Detectability of Extrasolar Terrestrial and Giant Planets During Their Luminous, Final Ac-cretion. S.A. Stern. The Astronomical Journal, 108, 2312, 1994.
Gamma Ray Bursts Constraints on the Galactic Frequency of Extra-Solar Oort Clouds. J.M. Shulland S.A. Stern. The Astronomical Journal, 109, 690, 1995.
Pluto and the Kuiper Disk. S.A. Stern. Submitted to "Ices in the Solar System." (C. DeBergh, B.Schmitt, M.C. Festou, eds.), 1995.
Collision Rates in the Kuiper Disk and Their Implications. S.A. Stern, The Astronomical Journal,
110, 856, 1995.
Signatures of Collisions in the Kuiper Disk. S.A. Stern. Astronomy & Astrophysics, in press, 1995.
RECENT SCIENTIFIC PRESENTATIONS & ABSTRACTS
Collisions in the Kuiper Disk. Astronomy Luncheon Seminar. Queen's University Department ofPhysics. Kingston, Ontario, 2 February 1995.
Pluto, Charon, and The Kuiper Disk. Ices in the Solar System Meeting. Toulouse, France, 25March 1995.
The Kuiper Disk: Evidence for Arrested Planetary Accretion? Laboratory for Atmospheric andSpace Physics Seminar, University of Colorado, Boulder, CO, 28 September 1995.

es of Collisions in ( .In- Kuiper Disk
S. Alan Stern
Geophysical, Astrophysical, and Planetary SciencesSpace Science Department
Southwest Research InstituteBoulder, CO 80302 USA
17 Manuscript Pages
02 Tables07 Figures
Submitted to Astronomy & Astrophysics: 25 April 1995
Revised: 29 August 1995

Running Title: Kuiper Disk Debris Signatures
S. Alan Stern
Space Science Department
Southwest Research Institute
1050 Walnut Street, Suite 429
Boulder, CO 80302
[303] 546-9670 (voice)
[303] 546-9687 (fax)

Abstract
We explore the rate of collisionally-producrd mass injection in the present-day Kuiper Diskas a function of the total mass and population size structure of the disk. Our objective is
to estimate the detectability of IR emission from debris created by collisions. We find that
eccentricities in the Kuiper Disk are high enough to promote erosion on virtually all objectsup to ~ 30 km, independent of their impact strength. Larger objects, such as the 50-170 km
radius "QBi" population, will suffer net erosion if their orbital eccentricity is greater than
ft 0.05 (« 0.1) if they are structurally weak (strong). Our model predicts a net collisional
erosion rate from all objects out to 50 AU ranging from 3 x 10¹⁶ to 1019 g yr"1, depending
on the mass, population structure, and mechanical properties of the objects in the Disk. We
find two kinds of collisional signatures that this debris should generate. First, there should
be a relatively smooth, quasi-steady-state, longitudinally isotropic, far IR (i.e, ~ 60/^mpeak) emission near the ecliptic in the solar system's invariable plane ecliptic, caused by
debris created by the ensemble of ancient collisions. The predicted optical depth of this
emission could be as low as 7 x 10~8, but is most likely between-3 x, 10~7 and 5 x 10~6. Wefind that this signature was most likely below IRAS detection limits, but that it should be
detectable by both ISO and SIRTF. Second, very recent impacts in the disk should produce
short-lived, discrete clouds with significantly enhanced, localized IR emission signatures
superimposed on the smooth, invariable plane emission. These discrete clouds should have
angular diameters up to 0.2 deg, and annual parallaxes up to 2.6 degrees. Individualexpanding clouds (or trails) should show significant temporal evolution over timescales of
a few years. As few as zero or as many as several 102 such clouds may be detectable in a
complete ecliptic survey at ISO's sensitivity, depending on the population structure of theKuiper Disk.

1. Introduction
Almost, a. half-century a.go, Edgeworth (1949) and Kniper (1951) made prescient pre-
dictions that the Sun should be surrounded by a. disk-like ensemble of comets and other
"debris" located beyond the orbit of Neptune. The case for such a primordial reservoir
was strengthened when it was later pointed out that such a disk could be an efficient
source region to populate the low-inclination, short-period comets (i.e., the Jupiter Family
Comets; Fernandez 1980). Convincing dynamical simulations supporting this link between
the Jupiter Family comets and the Kuiper Disk (KD) region arose when Duncan, Quinn,
& Tremaine (1988) and later Quinn et al. (1990) showed that a low-inclination source
region appears to be required for a low-inclination orbit distribution of the Jupiter Family
Comets. Figure 1 is a schematic diagram revealing the gross architecture of the this disk
in relationship to the orbits of the five known outer planets.
The computational capabilities available to Duncan and coworkers in the mid-1980s
required some important approximations be accepted (for reviews of this work, cf., Weiss-
man 1993, and Stern 1995a). Although these compromises were- criticized by Bailey &
Stagg (1990), Duncan et al.'s work generated interest in the Kuiper Disk by both mod-
ellers and observers. Of particular relevance here are the Holman & Wisdom (1993) and
Levison & Duncan (1993) studies of orbital evolution in the Disk. These workers found
a time-dependent dynamical erosion of the Disk population inside « 42 AU, caused by
nonlinear perturbations from the giant planets. The dynamical chaos resulting from these
perturbations is ultimately responsible for the transport of short-period comets from the
long-lived Kuiper Disk reservoir to planet-crossing orbits where they can be routinely
detected. Based on the bias-corrected population of Jupiter Family Comets and the dy-
namical transport efficiency of comets from the Kuiper Disk to the inner planets region,
Duncan, Levison, & Budd (1995) have since estimated that ~ 1010 comets orbit in the
Disk between 30 and 50 AU from the Sun.
Observational confirmation of the Kuiper Disk was first achieved with the discovery
of object 1992QBi by Jewitt & Luu (1993). As of late 1995, no fewer than 30 QBi-like,
trans-Neptunian objects have been discovered (Jewitt & Luu 1995; Stern 1995a). These icy
outer solar system bodies are expected to have dark surfaces consisting of an icy matrix
contaminated by silicates and organics. Assuming a typical (i.e., cometary) geometric
albedo of 4%, and the absence of coma, the distances and magnitudes of these objects
indicate they have radii between roughly 50 and 180 km. Based on the detection statistics

obtained to thate, one ran easily rsJ.ima.tc J.ha.1, a. complete ecliptic survey would reveal
~ 3.5 x lO'1 such bodies orbiting between ^30 and 50 AU. Simple power-law extensions
of this population predict a cometary population (which we define as bodies with radii
between 1 and 6 km) of ~ 1010, which is similar to the dynamical modelling estimates
obtained by Duncan et al. (1995) to satisfy the short-period comet flux. Very recently,
Cochran et al. (1995a.,b) have reported Hubble Space Telescope results giving the first
direct evidence for comets in the Kuiper Disk.
The objective of this paper is to examine whether there might be detectable signatures
of collisions in the Kuiper Disk. An extensive study of collision rate dependencies in
the Kuiper Disk has been published by this author (Stern 1995). We are aware of an
unpublished manuscript by Alcock £: Hut (1995) on the detectability of individual flashes
from comet-comet collisions in the Kuiper Disk, and an abstract by Dasgupta et al. (1994)
predicting the small grain population of the Kuiper Disk; the latter has recently been
expanded into a short paper by Backman et al. (1995). The study presented here is more
extensive than these previous works, and is aimed specifically at predicting signatures the
ISO and SIRTF spacecraft might detect.
This paper is organized as follows. In §2,1 summarize our previously-published model
for estimating the rate of collisions in the Kuiper Disk, on which many of the results
presented here are based. In §3, we evaluate whether collisions in the Disk are primarily
erosional or accretional, showing that present-day collisions are expected to be erosive,
thereby injecting debris into the Kuiper Disk. In §4, I summarize some key results derived
from that model. In §5, I estimate the quasi-steady-state debris mass, debris opacity, and
IR brightness expected from the disk. In §6, I discuss the characteristics and number of
discrete, expanding debris "clouds" produced by individual collisions during the past few
years. In both §5 and §6, comparisons to IRAS, ISO, and SIRTF detection capabilities
are made. To close, §7 summarizes the various results and describes how the Kuiper Disk
debris detection can make important contributions to our understanding of the mass, size
structure, and mean random eccentricity of objects in the Disk.
2. The Collision Rate Model
As described more fully in Stern (1995b; hereafter, Paper I), our model for estimating
collision rates,in the Kuiper Disk begins by defining the Disk in terms of a power law

exponent, o, on the si/e distribution of objects in the Disk. Defined in this way, the
number of objects dN(r) between radius r and r -f dr is given by
dN(r) = yV0rwrfr, (1)
where A'o is a normalization constant set by the estimated number of QBi objects. We
treat this size distribution as a monotonically decreasing series of radius bins. In what
follows, we choose bodies in each successive radius bin r to be a factor of 1.6 times larger
in size (and equivalently, 4 times higher in mass), ranging from r = 0.1 km to r = 162 km.
We also define a power law exponent (3 on the radial distribution of heliocentric surface
mass density £(/?) in the disk, so that
E(K) = E0/Z?, (2)
where So is the normalization constant. Because there is presently no information on
the way in which ensemble-averaged inclinations ((£)) and eccentricities ((e)) vary in the
Kuiper Disk, we adopt a disk-wide (i) and (e) for each run, and vary these quantities
from run to run as free parameters to explore how sensitive the model results are to these
variables.
Once the disk is defined as described above, we bin the disk into a series of concentric
tori (at successive semi-major axes a) that are 1 AU in width. For each size bin/heliocentric
bin pair, the model computes the collision rate that a target of given size experiences from
potential impactors in bins of equal or smaller size. This is of course a function of (ae),
since (e) controls both the internal velocity dispersion in the disk, and (ae) controls the
degree of heliocentric bin crossing.
To compute collision rates we adopt a particle in a box formalism. This approach
states that the instantaneous collision rate c of target bodies with semi-major axis a,
eccentricity e, and radius rx being struck by impactors of radius ry, is just
c(rx,ry,a,e) = n<rgv, (3)
where n is the local space density of impactor bodies, v is the local average crossing
velocity of the target body against the impactor population at distance R, and ag is
the gravitational-focusing corrected collision cross section of the impactor+target pair.

Gravitational focusing is an important correction for targets in (.he QB| size range and
larger, particularly in the ca.se of very low eccentricities (e.g., (e} < HP2) . The orbit-
a.vera.ged collision rate c(rx, ry, a ,e) can be written to show all its explicit dependencies in
the model as
f(a,(e) ,R) n(ry, R) vx y(a,(e),(i), R) ag(r t ,ry,v i y ,ve
R=a(l-(e))
(4)
where the term / represents the ratio of the time the target body in an orbit defined
by (a, (e),(z)) spends in each torus it crosses during its orbit (T(a, {e),/?)), to the targetbody's orbital period, \/GA/ •
To compute T(a, (e), R) we solve the central- field, Kepler time of flight equation explic-
itly for every (a, (e)) pair in the run's parameter space. The number density of impactorsn(ry,R) in the torus centered at distance R is computed from the mass of the Disk, the
Disk's wedge angle (i), its heliocentric surface density power- law, and the Disk's population
size structure power law. The collision timescale r(rr, ry, a, e) is just c~1(rr, ry, a, e).
The code which implements this model produces an array containing collision rates
c(rx,ry, a, e) throughout the specified disk, where the free parameters defining the disk are
the total number of QBi's, a, /?, and (e). We assume (i) = |{e).
3. Are Kuiper Disk Collisions Predominately Accretional or Erosional Today?
Before continuing, it is relevant to ask whether collisions in the Kuiper Disk are ener-
getic enough to primarily promote erosion, or alternatively, sufficiently gentle to promotegrowth.
Whether a collision between an impactor and a target results in growth orerpsion
depends primarily on the energy of the impact and the mass and strength of the target. In
the Kuiper Disk, the typical approach velocity of two objects at a distance large comparedto the Hill sphere of the target can be reasonably-well approximated by
, (5)
where VK is the local Keplerian velocity. For {:} = |{e) we have
(6)
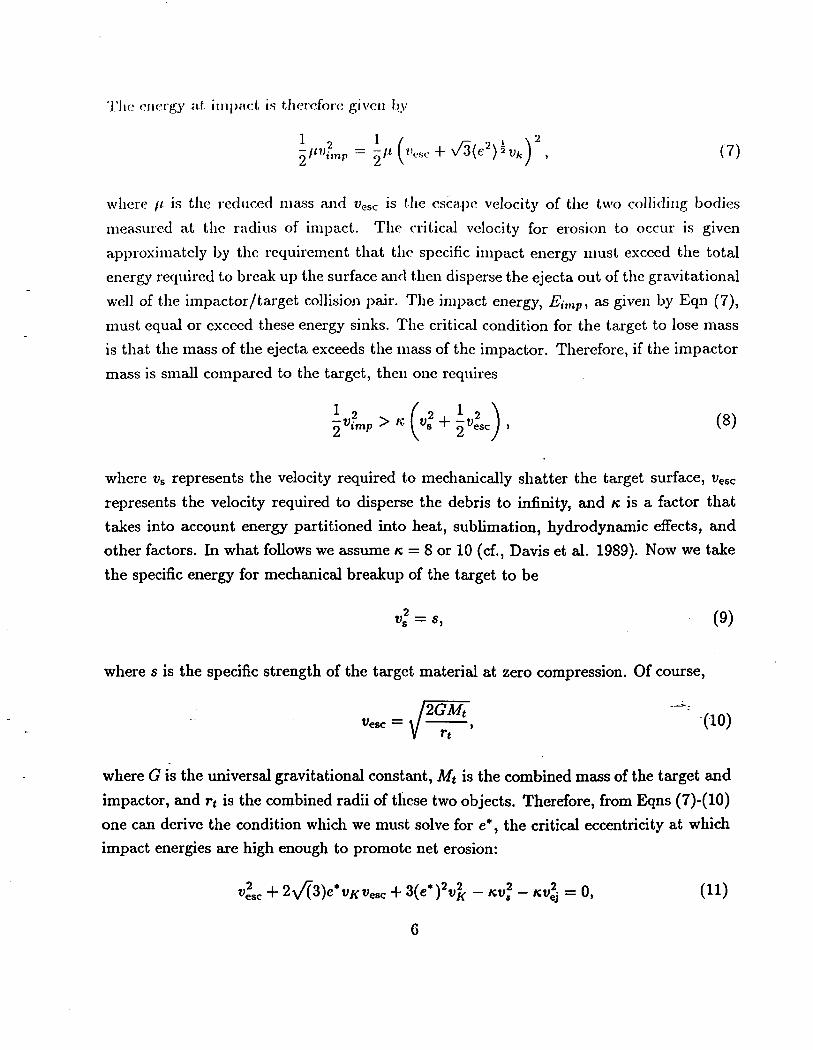
The energy at. impact is therefore given by
2 A'«,?mp = 2" ("«*••
where // is the reduced mass and uesc is the csca.pc velocity of the two colliding bodies
measured at the radius of impact. The critical velocity for erosion to occur is given
approximately by the requirement that the specific impact energy must exceed the total
energy required to break up the surface and then disperse the ejecta out of the gravitational
well of the impactor/target collision pair. The impact energy, Eimp, as given by Eqn (7),
must equal or exceed these energy sinks. The critical condition for the target to lose mass
is that the mass of the ejecta exceeds the mass of the impactor. Therefore, if the impactor
mass is small compared to the target, then one requires
2 > f
where vs represents the velocity required to mechanically shatter the target surface, vesc
represents the velocity required to disperse the debris to infinity, and K is a factor that
takes into account energy partitioned into heat, sublimation, hydrodynamic effects, and
other factors. In what follows we assume K = 8 or 10 (cf., Davis et al. 1989). Now we take
the specific energy for mechanical breakup of the target to be
*S2 = *, (9)
where s is the specific strength of the target material at zero compression. Of course,
": (io)
where G is the universal gravitational constant, Mt is the combined mass of the target and
impactor, and rj is the combined radii of these two objects. Therefore, from Eqns (7)-(10)
one can derive the condition which we must solve for e*, the critical eccentricity at which
impact energies are high enough to promote net erosion:
3(e*)24 - KV*f - KVl = 0, (11)
6

Notice e* is a. function of several target parameters, including the .strength, size, and mass.
Table 1 solves Equation (11) solutions for the cr i t ical erosion eccentricity e*, both for
impacts onto strong (e.g., rock/ice) targets (/; = 2 g cm~3 and s = 3 x 10G erg g -1)i a»d
relatively weak (e.g., snow-like) targets (p — 0.5 g cm~<J and s = 3 x lO'1 erg g"1; these may
be more applicable to comets in the Disk, cf., Asphaug & Benz 1994); results are shown
at heliocentric distances of 35 and 60 AU. Following the results discussed in Fujiwara et
al. (1989), we assume vej = 0.2v,-mp.
The results presented in Table 1 can be summarized as follows. For targets with radii
smaller than xi3Q km, e* < 0.01, independent of heliocentric distance and the strength of
the target surface (within our parameter space). For reference, at 40 AU an (e) = 0.01
corresponds to a typical encounter velocity at infinity of 82 m/s. Since all objects with
measured eccentricities in the Disk have eccentricities in excess of 0.01 (Jewitt &: Luu 1995;
H.F. Levison, pers. comm. 1995), we conclude that most objects of radius a few tens of
kilometers or less in the Disk are likely to be be eroded when they suffer a collision. These
results remain valid even if the characteristic ejecta velocity is as low as 5% of the impact
speeds instead of the 20% used in Table 1.
For QBi-sized targets with radii near 100 km, we find e* > 0.02 0.03 are required for
net erosion if they are weak, and e* > 0.05 0.06 is required if they are strong. Similarly,
for QBi-like objects with R=170 km, which is comparable to the largest-discovered objects
in the Disk to date, e* > 0.04 — 0.05 is required if the objects are weak and e* > 0.09 —
0.10 is required to result in net erosion if the objects are strong. Interestingly, it is also
worthwhile to note that if the characteristic ejecta velocity is as low as a few percent of
the impact speeds, then e* will rise dramatically and the QBi population will be in an
accretional regime, even for eccentricities as high as 0.2-0.5. We thus find that some QBj's
should be undergoing erosion, while others may be in an accretional regime, depending on
their eccentricity and strength. However, until much better eccentricity statistics become
available, it is not possible to determine if the QBi population as a whole is gaining or
losing mass. All we can say is that the range of detected eccentricities span the range of
e* 's, creating a complex situation.
In summary, small objects like comets are being eroded when collisions occur on them
in the Kuiper Disk, but whether larger objects like the QBi's suffer erosion or accretion
depends on their surface strength and the relative eccentricity of the impactor/target pair.
Regardless of the net fate of the QBi population, collisions inject collisional debris into

the present-clay Disk.
4. Collision Rates in the Present-Day Kuiper Disk
In Paper I, an extensive set of collision rate calculations were presented. Here, we
briefly summarize some results obtained from those calculations as a prelude to the calcu-
lation of observable parameters arising from those collisions.
In the work presented in Paper I and what follows below, it is assumed that the Kuiper
Disk has an inner radius of 35 AU and an outer radius of 70 AU. We let eccentricity rangeas a free parameter from 2 x 10~4 to 2 x 10"1, which extends over a range of eccentricities
considerably greater than actually seen in the Kuiper Disk objects detected to date. As
noted before, we assume (i) = |{e).
Four cases defining the heliocentric mass dependence and size distribution of objects
in the Disk will be presented here. These four cases represent the combinations of two sizedistributions of objects (cf., a in Eqn. 1) and two heliocentric mass distributions (cf., /? in
Eqn. 2).
Our favored size distribution, which we call the nominal (NOM) case, connects the
observationally-estimated ~ 3.5 x 10⁴ QBi-sized objects (Jewitt & Luu 1995) inside 50 AUwith the modelling-derived estimates of ~ 1010 comets (Duncan et al. 1995) in a single
power law with a = —11/3. Our second case assumes a = —4, which gives a ConstantMass (CM) in every logarithmic size bin. Relative to the NOM case which produces « 1010
for 35,000 QBi's (100 km in radius or larger), the CM case produces « 5 x 10¹⁰ comets.For the heliocentric distribution of mass in the Disk, the two cases we run are defined
as follows. One case assumes a Constant Mass per Heliocentric Bin (CMHB; ft = — 1),
which corresponds to a surface mass density that declines with heliocentric distance asR"1. The second, and more realistic case, assumes a Declining Mass per Heliocentric Bin
(DMHB; 0 = —2), corresponding to a surface mass density falling like .ft"2. These two
cases bracket a realistic range of parameter space (Lissauer 1987).
Table 2 summarizes these four run cases (and a fifth case we shall discuss later). We
now present some key results. Figure 2 depicts collision timescale results obtained at 40
and 60 AU for the NOM/DMHB case. The upper panels show the collision timescale for(e) w 10~2. The lower panels show the collision timescale for (e) « 10"1. These values
of (e) are representative of measured eccentricities in the Kuiper Disk (cf., Stern 1995a;
8

.IrwiU. & Liui 1995). Figure 3 depicts the sa.mc kind of data for the CM/DMHB ca.se. The
reader is referred to Paper I to see the collision calculations for the CMHB cases.
As discussed in detail in Paper I, the key results obtained from the collision model
are: (i) That unless the Disk's population structure is sharply truncated below ~1 km,
comet-comet collisions are occuring so frequently, and with high enough velocities, that the
primordial cometary population would be significantly depleted over the age of the solar
system, (ii) That the rate of collisions of smaller bodies with QBj-size (i.e., 100 < R < 600
km) objects is so low today that there appears to be a dilemma in explaining how QBj's
could have grown by binary accretion in the Disk as we know it. And (iii) that collisional
evolution is important not only at the inner edge of the Disk near 40 AU, but also much
farther out, at 60 AU, if the Disk extends that far. These findings suggest that collisional
evolution plays an important role throughout the Kuiper Disk, and that collisions play a
dominant role beginning near 42 AU, where dynamical timescales exceed the age of the
solar system. Because collisions in the Disk are modifying the size distribution, these
findings also argue that the population structure of the present-day Disk appears to be
in disequilibrium. We refer the reader to Paper I for a more complete discussion of these
aspects of collisional evolution in the Kuiper Disk, and now turn to the primary subject
of this report— the observable signatures created by collisions in the Disk.
5. The Smooth Ecliptic Signature
As described above, we have found that typical collisions taking place today among
small bodies in the Kuiper Disk are erosive. It is well known from studies of the asteroid
belt that such collisions produce a power-law distribution of debris ranging from a largest
fragment of radius scale a significant fraction of the target size, down to fine dust (e.g.,
Holesapple 1993). Our interest is in computing the optical depth and thermal emission
brightness of the debris. In what follows we study the collisionally-generated debris tail of
objects down to sizes as small as 3 //m.
We begin by first estimating the steady-state amount of debris in the Kuiper Disk,
which we compute according to
, (12)
where M is the time-averaged rate of debris production in the disk, and T(03S is the loss
9

time-scale for .such debris. The relevant loss processes are dynamical transport owing to
perturbations by the giant planets, dynamical loss to Poynting-Robcrson (P -R) drag, and
physical loss to collisions which destroy grains. Radiation pressure is not as effective as P-R
drag for particles several microns in size and larger (e.g., Burns et al. 1979), so we neglect
its effects in the scaling calculations that follow. We also neglect particle sublimation,
because H^O/silicate grains and larger particles in our size range beyond ~15 AU have
sublimation lifetimes longer than the age of the solar system.
In our model we take 7]",1, = T^n + T'.1 + rd~\ where Tdyn is the dynamical loss
time for objects suffering perturbations by the giant planets, Tpr is the Poynting-Roberson
timescale for dust a.nd small particles, and T<IC is the collisional fragmentation timescale
for self-collisions among debris and debris collisions with larger objects, where "debris"
particles are all objects smaller than 0.1 km, down to a 3 /xm lower size limit. The Tdyn
data were kindly supplied by H. Levison.
We compute M(o) by summing the ejected mass over all target-impactor collisions.
We determine the mass ejected by a given impactor striking a target at velocity Vimp by
balancing the energy budget of the impact against energy losses to mechanical shattering,
and escape from the collision-pair's potential well. We determine the excess velocity of
the escaping mass following previously published results (cf., Fujiwara et al. 1989); the
characteristic ejecta velocities we employ are in the range 0.05u,-mp to 0.20ufmp. We assume
that only 10% of the energy of the impact is partitioned into the kinetic energy of the debris.
This approach is similar to that described in Eqns (7)-(10), but instead of solving for e*,
we solve for the ejected mass mej- at a specified impact velocity defined by the assumed
eccentricity of the population and the mutual escape speed of the target+impactor pair.
The code caps the maximum ejected mass to be the combined mass of the impactor H-target
pair. The mass ejected in this way is assumed to follow a standard debris fragmentation
power law from a largest fragment down to fine dust a few microns in size (e.g., Holsapple
1993).
We compute the Poynting-Roberson (P-R) drag timescale for a dust particle according
to
Tpr = 7 x 10⁶rpPp(al - Ol)(l - e) years, (13)
(e.g., Gustafson 1994), where rp is the particle radius in cm, pp is the particle density in
g cm"3, ai is the particle's initial semi-major axis in AU, and 03 is the particle's final
10

radius in AU; in what, follows we Lake «2 = 30 AU, when.1 we assume Neptune's dyiuuuical
influence spatially truncates the Kuiper Disk debris distribution. Equation (13) implies
a. characteristic P-R loss tiniescalc of 5 x 1()G years for a 10-micron ice particle with unit
density at 40 AU; at GO AU the timescale for such a particle is near 2 x 10⁷ years.
Now consider the debris collision timescale, Tdc- This is the timescale for debris
particles to be lost to collisions with one another or by striking a large Kuiper Disk object.
We compute T</c using the same particle in a box formalism as described in §3, with the
number density of debris particles calculated from the M(a) and the assumption that the
population N(a) ~ a~3 5.
During the time interval between their creation and their loss, particles created by
collisions will experience azimuthal smoothing due to regression of their arguments of
perihelion, regression of their orbit nodes, as well as Keplerian shear resulting from post-
collision velocity dispersion, radiation pressure, and differential P-R drag. As it turns
out, the Kepler shear time for orbits 1 AU apart to separate by 180 deg is very short
(~ 104 years) compared to both the nodal regression timescales (each ~ 107 years) and
the PR drag timescale (~ 6 x 10⁵ years). As a result, we predict the development of a
longitudinally-smoothed, quasi-steady-state distribution of collisional debris to develop.
M calculations performed using the model run results shown in Figures 2 and 3 predict
time-averaged debris production rates in the range PS 3 x 10¹⁶ to 1019 g yr"1 in the Kuiper
Disk, depending on the characteristic ejecta speed relative to the impact velocity. Given
this rate of production and the TIOSS timescales discussed above, one sees that the Kuiper
Disk should contain many comet masses of fine debris at any time.
Once M (a) and T}<,,,(a) are calculated for a given run case as a function of debris size,
we can estimate the disk's quasi-steady state geometric radial optical depth at a specified
wavelength A in debris of radius rp at heliocentric distance a as
r(a, A , r p ) = ' » , (14)Atot(a.)
where A</ is the integrated area of all the collision products in the heliocentric bin at
distance a, and At(,t is the total projected area of the Kuiper Disk on the sky, which we
take as 4?ra2 sin ». A<j is computed according to
Ad(a,X,rp) = Nd(a,rp)Trr^(\,rp), (15)
11

where- N^(a, rp) is the number of debris p:\iticles of si/r rp at, distance a and i;(A, rp) is the
optical correction factor for particle cross srcl.ions vised when r,> < A. We adopt J / ( A ) = 1
unless 7-p < A, in which case we take
To obtain a total optical depth r(A), we numerically integrate r(a, A) over rp and a, with
•Wd(a, rp) provided from the model described here and in §2 and §3.
Figures 4o and 46 present optical depth estimates calculated in this way for the two
collision runs presented in Figures 2 and 3, with an assumed IR observation wavelength
of A = 60 //m. These optical depth estimates are presented as a function of (e), p, and
s. Panel 4c presents the same calculation for a Kuiper Disk population that is truncated
below radii of 1 km, as suggested in Paper I (the details of this population are given as the
final case described in Table 2). Because the population of colliding bodies is so sharply
reduced in the panel c case, panel c likely gives a lower limit to the 60 /*m optical depth
of the Kuiper Disk.
On examining the curves in Figure 4, one sees there are three regimes in each plot.
The first (i.e., leftmost) regime, which is described by the straight-line decrease in r(e) for
(e) < e*, is simply the optical depth of the macroscopic (i.e., 0.1-200 km radius) Kuiper
Disk population. The optical depth decreases with (e) in this regime, primarily because
(i) = |(e). As a result, the area of the disk on the sky increases, and the optical depth
is diluted. The second (i.e., middle) regime in Figure 4 begins when (e) = e*. Once this
condition obtains, r jumps up, since debris generation introduces a new source of optical
depth. Notice the location of this jump depends on the strength of the surface of the KD
objects. After the T jump near e*, a third regime obtains, where r again declines owing
to the dilution effect of increasing the disk eccentricity, as described above.
The main conclusion we draw from Figures 4a and 46 is that the expected IR optical
depth for a population with characteristic 0.01 < (e) < 0.1 will likely be in the range
3 x 10~7 to 10~5, but could be as low as 7 x 10~8. Although we will adopt the range
3 x 10~7 to 3 x 10~5 as a typical steady-state optical depth in the Kuiper Disk, it is worth
noting that catastrophic, erosive collisions on large QBi objects may occur every ~ 3 x 10
years (Stern 1995b). When such collisions occur, the debris mass and optical depth in the
Disk can further increase by a factor of 50 or more for a timescale comparable to 7}05,.
12

The predicted range of typical-state Kuipcr Disk <>|)ticaJ depths arc higher tlia.ii the
value of 10~ detected in the Solar System's most proniina.nt a.steroidal dust bands (Low
el, al. 19S4), but are 10-2000 times lower than the IR optical depths of the disk ensembles
around Vega and many other well-known IR.-excess A stars (Backnian & Paresce 1993).
Is this debris detectable? Figure 5 presents estimates of the debris brightness for three
temperatures that span the 40 to GO K temperatures expected of large grains in simple
radiative equilibrium at distances of 35 to GO AU from the Sun. (We note that small grains
can become hotter than 60 K if they are inside 40 AU, but their loss timescale to P-R drag
is so short that they do not contribute much optical depth, and therefore do not much
affect the assumption of a characteristic emission temperature between 40 and 60 K). Since
the actual distribution of temperatures depends on several unknowns, including the grain-
size histogram, grain emissivities and albedo, and the heliocentric distribution of grains,
we choose to present flux density curves for isothermal ensembles at 40 K, 50 K, and 60 K;
given the level of uncertainty in grain parameters at this time, we believe this is preferable
to integrating through some arbitrary heliocentric temperature profile. The calculations
presented in Figures 5a and 56 assume optical depths of r = 3 x 10~7 and T = 3 x 10~6,
respectively. Superimposed on the debris black-body curves are reference detection limits
expected obtainable with IRAS, ISO/ISOPHOT, and SIRTF (cf., Cruikshank et al. 1990;
Werner et al. 1991; Backman et al. 1995 have examined the detectability of Kuiper Disk
debris by COBE).
Figure 5 indicates that IRAS could have marginally detected the Kuiper Disk if the
debris is 50 K or warmer and exhibits T > 10~6 near 60 //m. Now notice in Figure 4 that
if (e) < 10~2, then optical depths as high as 10~5 could obtain. If this were the case, then
IRAS would have easily detected the Disk. Since no clear detection has been reported,
despite searches (cf., Backman & Paresce 1993), we conclude that IRAS providesjndirect
evidence that (e) > 10~2. Additionally, however, it is possible that IRAS could have made
a weak detection of the disk if (e) « 10~2. In this regard, the intriguing report of cool, ~ 50
K "zodiacal" dust bands detected in IRAS data (Rowan-Robinson et al. 1991) warrants
further analysis.
Concerning ISO and SIRFT, calculations, which are in agreement with those subse-
quently produced by Backman et al. (1995) indicate that both ISO and SIRTF should
be capable of detecting the Kuiper Disk debris background at any plausible temperature
(note: if higher temperatures than 60 K obtain for some fraction of the Kuiper Disk debris,
13

them the emission brightness will be higher, strengthening this conclusion). Kniper Disk
collisional debris should be concentrated in a b;uid perhaps 10-20 degrees in width, cen-
tered on the ecliptic (or more accurately, the invariable plane). This emission from smooth
Kuiper Disk debris should be distinguishable from /odiacal emission through its (i) nar-
rower latitudinal distribution on the ecliptic, and (i i) ~ 5 times cooler color temperature
of 40 to 60 K. If this emission signature is detected with ISO or SIRTF, it will provide a
powerful diagnostic for studies of collision rates, and by inference, both the heliocentric
mass and population size structure of the Disk.
6. Discrete Signatures from Recent Kuiper Disk Collisions
In addition to the smooth distribution of debris and IR emission resulting from col-
lisional debris in the Kuiper Disk, one also expects there may be small, discrete collision
"clouds" generated by recent impacts which have not yet faded into the debris background.
Given the low-inclination nature of most orbits in the Kuiper Disk, such clouds will most
likely appear as small expanding debris trails, with their major axis preferentially aligned
along the invariable plane.
We have constructed a first-order model to evaluate the number of collision clouds
that should be detectable. To be conservative, we have assumed that for a cloud to
be detectable, it must persist with an optical depth ten times that of the Kuiper Disk
background (cf., §5), and with a A = 60 //m size scale larger than an ISO/ISOPHOT
angular resolution element (0.8 arcmin) for at least 1 year.
When a given target body such as a comet loses mass in a collision, the debris created
by the impact will locally enhance the optical depth of the Kuiper Disk. The emission
flux from such an expanding cloud will peak when the cloud's optical depth, rcjjjreach.es
unity. The optical depth evolution of the debris cloud can be approximated, for heuristic
purposes, by assuming the cloud is spherically expanding. The time at which such a cloud
reaches any specified TC[ is given by
where Mci is the debris mass in the cloud, rp and pp are the characteristic debris particle
size and density, and vej is the characteristic expansion velocity of the cloud. As a relevant
14

example, the time ;>.(. which ;i. cloud of mass equal l.o a. 2.5 kin radius comet, reaches unit.
o])l.ica.l depth is
T ( T e t ) K & l ( Pd 3V' / 2( ^ r' /2( "-!> .V1 days. (18)
' \ l gcm- 3 / \ 10 microns/. \5 x 103 cm s"1 J
The radius of the expanding cloud at this time will be
-1/2-7 ~ in9 ( Pd \ ( rp X- 1 / 2
= 7 x 1 0 3 I ——i I cm,\1 g cm~J/ \10 microns/
(19)
which is about the radius of Jupiter. Such a cloud at a heliocentric distance of 45 AU will
have an apparent diameter of ~4 arcsec on the sky and will exhibit an annual parallax of
~ 2.6 degrees.
Of course, one need not detect Kuiper Disk collision clouds at TCI = 1. In principle, the
clouds can be detected against the smoothed Kuiper Disk signal whenever their contrast
relative to the background is sufficient. In what follows I assume a background optical
depth of 10~6 and a cloud:background contrast ratio of 10:1, so that we require TCI = 10~5.
This gives an expansion timescale of:
" , (20)lgcm-3 VlO microns
with a corresponding radius of
~ 1 / 2 1 / 2 c m , (21)VI gem-3/ MO
or 0.15 AU. At 45 AU, such a cloud would have an apparent diameter of «11 arcmin on
the sky.
To improve on these crude scaling calculations, a model has been constructed that
uses the collision rate estimates described in §4 as its input. For every collision, the model
calculates the amount of mass ejected, after accounting for energy losses to mechanical
shattering and escape from the gravity well (cf., Eqns (5)-(ll)). Using (i) the ejected
mass, (ii) a debris population ranging upward from 3 p.m in size to the largest fragments
predicted by each collision pair at the specified (e), and (iii) adopting a collision debris
15

power law like N<i ( r i< ) ~ rp
3'5 cu> (Davis et al. 1989), the model calculates the spreading
time to reach a critical rt.< = (,'r, where (," is the cloud:sky contrast factor and r is the
Kuiper Disk background optical depth computed for the same collision rate data. Given
the collision rate statistics and spreading times to reach rc/, the model then computes the
number of clouds expected on the sky. The free key parameters in this model are {e), wej-,
and the target's s and p. As before, in agreement with past energy partitioning results
in catastrophic collisions (e.g., Fujiwara et al. 1989), we vary vej between 5 x 10~2 and
2 x 10"1 of the impact speed. As usual, we calculate results for two kinds of target bodies—
strong (ice/rock) targets and weak (snow-like) targets.
Figure 6 shows the results of such a model calculation using the data in Figure 2 as
an input, and the assumptions of a A = 60//m background optical depth of r = 10~6.
Panel a shows the number of collision clouds expected from catastrophic collisions on all
comets between 1 and 6 km in radius assuming vej = 0.20v,-mp; panel 6 shows the same
for vej = 0.05t't-mp. Notice: owing to the fact that at lower ejecta velocities a given ejecta
energy creates more ejecta, the number of clouds increases as the ratio of vej to v,-mp
decreases. Notice also that the number of clouds falls with increasing (e), which is in part
due to the decreasing cloud lifetime with increasing u,-mp (and therefore increasing vej)-
Recall that all of the QBi's with known orbits have e > 10~2. For such a population
the data in Figure 6 predict that the Disk population structure which produces the colli-
sional timescales shown in Figure 2 should exhibit one or less clouds if the characteristic
vej ~ 0.2u,-mp. However if vej ~ 0.05, then this Disk population structure should produce
a few to perhaps 10 to 50 detectable clouds scattered around the ecliptic, depending on
the strength of the bodies suffering collisions.
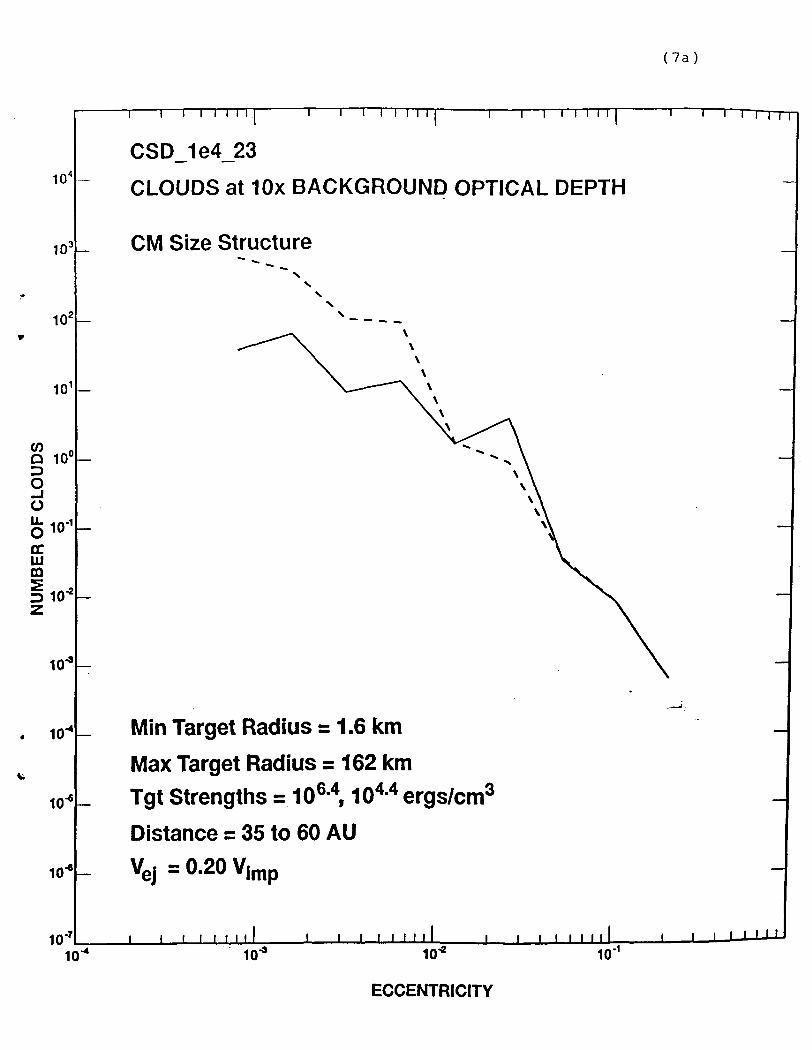
Figure 7 shows the results of the same model run, using the Disk population structure
used to produce the collision timescales shown in Figure 3 as an input. For this_case the
collision rates are higher, in turn producing an order of magnitude more discrete clouds
than in the corresponding case shown in Figure 6. As such, this simulation predicts that
perhaps as many as 5 recently-created, detectable collision clouds may be scattered around
the ecliptic if vej ~ 0.20vimp, and 30 to 300 clouds if vej ~ 0.05v,mp!
In closing it is worth noting that although the discrete cloud population model data
shown in Figures 6 and 7 assume £ = 10, it may be that clouds can be detected at much
lower contrasts, and then verified via their annual parallax. Setting the contrast criteria
to C — 2 and retaining the conservative assumption that the background optical depth is
16

r = 10 '', increases UK* rstiiuatr of detectable clouds by a. factor of just, over 2.
7. Summary
As described in Paper I, collisional evolution is an important process in the Kuiper
Disk. We have shown that the mean random velocities in the Disk today (as deduced from
orbital eccentricities of recently discovered QBi objects) strongly suggest that present-day
collisions in the Disk are erosive for virtually all objects with radii < 100 km, and for those
100-170 km QBi objects with eccentricities in excess of ~ 0.05 if they are weak or ~ 0.01
if they are strong. We predict a time-averaged rate of between 3 x 10¹⁶ and 1019 g yr"1
of collisional debris, ranging from multi-kilometer blocks to fine dust is being injected into
the Disk. Further, we have found that the grinding of objects in the Kuiper Disk produces
a population of small particles that dominates the optical depth and therefore the thermal
emission from the Kuiper Disk.
This paper has identified two types of detectable IR signatures resulting from KuiperDisk collisions. First, as described in §5, the Kuiper Disk should produce a longitudinally
smoothed, quasi-steady-state population of debris in the solar system's invariable plane.
We found that the non-detection of a strong signature of this kind by IRAS indicates that
the optical depth of this dust at 60 //m is probably < 3 x 10~6. This in turn implies a
collisional environment in which (e) > 0.01 inside at least ~ 50 AU. For the (e) range
of 0.01 to 0.10 indicated by existing orbit statistics, we redict that the Disk out 50 AUproduces a total optical depth of 3 x 10~' — 5 x 10~6 and an IR brightness of 0.2 to 5
MJy/sr at wavelengths between 50 and 100 //m. These results are in agreement with thefindings of less extensive model calculations described by Backman et al. (1995). TheKuiper Disk IR signal should be detectable by ISO. However, if the KD population isstrongly truncated below size scales of ~ 1 km, then collisions will be less frequent and
we expect optical depths as low as 7 x 10~8 may obtain; this value of r corresponds to an
IR brightness of 0.07 MJy/sr, which is close to, but still probably above ISO's detectionlimits. In either case the thermal emission from the Kuiper Disk will be dominated bycolor temperatures in the range 40 to 60 K.
In addition to the smoothed ecliptic signature, recent collisions which significantlyerode comets and larger bodies should superimpose local optical depth and therefore IR
brightness fluctuations on the smooth Kuiper Disk IR background described above. These
17

discrete clouds should have- brightness temperatures that are inuc.li colder than the /odiacal
dust, and like the KD ecliptic background. Such clouds should also appear as expanding
spherical clouds or elliptical trails with their major axis preferrentially oriented along the
invariable plane. Before they fade below a 10:1 cloucl:background contrast ratio, these
clouds should grow to angular scales of many arc minutes, and should display an annual
parallax of 1 to 2 degrees, depending upon their distance. The timescale for a given collision
cloud to expand and dilute its optical depth below a 10:1 contrast ratio is of order many
years, so a sample of many clouds would display a range of sizes and local brightnesses.
The number of such clouds depends strongly on the population of kilometer and sub-
kilometer sized objects, the mechanical strength of these bodies, and the mean random
eccentricity of this population. Our estimates of the population of such discrete clouds
with a brightness 10 times that of the smooth ecliptic signal range from < 1 up to > 102.
This range of uncertainty is in turn due to uncertainties in the population structure and
mechanical properties of the Kuiper Disk population. The clear implication of this result
is that the surface density of detected clouds on the sky can be used as a probe of these
otherwise difficult to ascertain properties of the Kuiper Disk population.
Acknowledgements
Colleagues Don Davis, Martin Duncan, Paolo Farinella, Hal Levison, and John Bally
provided useful insights on many occasions during this work. The research reported here
was supported by the NASA Origins of Solar Systems Program.
18

References
Alcock, C., and P. Hut, 1995. AJ, submitted.
Asphaiig, E., and W. Beiiz, 1994, Nature, 370, 120.
Backman, D.E., and Paresce, F., 1993. In Protestors and Planets III, (E.H. Levy &
J. Lunine eds.), Tucson: Univ. Ariz. Press, 1253.
Backman, D.E., A. Dasgupta, and R.E. Stencel, 1994. ApJ, in press.
Bailey, M.E., and C.R. Stagg, 1990. learns. 86, 2.
Burns, J.A., P.L. Lamy, S. Soter, 1979. Icarus, 40, 1.
Cochran, A.L., H.F. Levison, S.A. Stern, a.nd M.J. Duncan, 1995a. IAUC, 6163.
Cochran, A.L., H.F. Levison, S.A. Stern, and M.J. Duncan, 1995b. ApJ, in press.
Cruikshank, D.P., M.W. Werner, £ D.E. Backman, 1990. Adv. Space Res., XX.
Dasgupta, A., D.E. Backman, and R.E. Stencel, 1994. BAAS, 26, 1376.
Davis, D.R., et al. 1989. In Asteroids II (R.P. Binzel, T. Gehrels, and M.S. Matthews,
eds.). University of Arizona Press, Tucson, p805.
Duncan, M.J., T. Quinn, S. Tremaine, 1988. AJ, 94, L69.
Duncan, M.J., H.F. Levison, and S.M. Budd, 1995. AJ, in press.
Edgeworth, K.E., 1949. MNRAS, 109, 600.
Fernandez, J.A., 1980. MNRAS, 192, 481.
Fujiwara, A., et al., 1989. In Asteroids II (R.P. Binzel, T. Gehrels, and M.S. Matthews,
eds.). University of Arizona Press, Tucson, p240.
Gustafson, B.A.S., 1994. AREPS, 22, 553.
Holman, M.J., and J. Wisdom, 1993. AJ, 105, 1987.
Holesapple, K.A., 1993. AREPS, 21, 333.
Jackson, A.A., and R.M. Killen, 1992. Unpublished manuscript.
Jewitt, D., and J.X. Luu, 1993. Nature, 362, 730.
19

.lewitt, D., and J.X. Lun, 1995. A/, 109, 1807.
Kuiper, G.P., 1951. In Astrophysics: A Topical Symposium, ed. J.A. Hynek (New York:
Mc.Graw Hill), pp357-424.
Lcvison, H.F., and M.J. Duncan, 1993. A.J, 100, 1669.
Lissaur, J., 1987. Icarus, 69, 249.
Low, F.J., et al., 1984. ApJ. Lett., 278, L19.
Quinn, T.R., Tremaine, S., Duncan, M.J. 1990, ApJ, 355, 667.
Rowan-Robinson, M., et al., 1991. MNRAS, 249, 729.
Stern, S.A., 1995a. In The Inventory of the Solar System, ASP Conference Series (E. Bow-
ell, ed.), in press.
Stern, S.A., 1995b. AJ, 110, 856.
Tremaine, S. 1990. In Baryonic Dark Matter, (D. Lynden-Bell & G. Gilmore, eds.), Kluwer,
pp37-65.
Weissman, P.R., 1993. EOS, 74, 262.
Werner, M., et al., 1991. SIRTF Science Working Group Report. NASA, Washington,
D.C.: NASA.
20

Table 1: Critical Eccentricities (e*) for Erosion
Target Radius 35 A U(Strong)
001
010
100
170
km
km
km
km
7
6
5
9
x 10
x 10
x 10
x 10
—~ o
o
-2
-2
60 AU
(Strong)
9 x
7 x
6 x
1 x
10~3
10~3
io-2
10-1
35 AU
(Weak)
1 x
2 x
2 x
4 x
10
10
10
10
-3
-3
-2
-2
60 AU
(Weak)
1 x
3 x
3 x
5 x
io-3
io-3
io-2
io-2
Notes: Strong target implies p = 2 g cm 3 and s = 3 x IO6 erg g"1; weak target implies
p = 0.5 g cm"3 and s = 3 x IO4 erg g"1. In both cases we take K = 8 and uej = 0.20vesc;see §3 for additional details.
21

Table 2: Collision Run Cases
Model
CSD
CSD
CSD
CSDCSD
Ie4
Ie4
Ie4
Ie4
3e4
25
23
13
15
15
30 AU
0
0
0
0
0
< R <50 AU
.12
.32
.42
.16
.07
MeMeMelvl_/i\\J7
Me
Population
Type
NOM
CM
CM
NOM
NOM
Disk
Type
DMHB
DMHB
CMHB
CMHB
CMHB
Nt
30 AU <
27
31
41
R <50 AU
,740
,316
,162
36,461
17,950
N' 'comets
30 AU < R <50 /
7 x3x
5 x
9 x4 x
109
1010
1010
109
109
Notes: M<fj«fc is the integral mass over all size bins. CMHB=Constant Mass per Heliocentric
Bin (/? = -1); DMHB=Constant Mass per Heliocentric Bin (ft = -2). NOM=Nominal
mass dependence per size bin (a = —11/3); CM=Constant Mass per size bin (a = —4).
22

Figure Captions
Figure 1: Schematic depiction of the Kuiper Disk and the orbits of the outer planets,including Pluto. The clearing between the orbit of Neptune and the inner edge of the
present-day disk is created by the dynamical perturbations of the giant planets. Thelocation of the outer boundary of the Kuiper Disk is not well constrained, and may wellextend much farther than shown.
Figure 2: Contours of Kuiper Disk collision timescales (in years) as a function of target
and impactor size for the model run with a mass per heliocentric bin that declines like
R"1, and a "Nominal" population size structure (cf., Table 2). Notice, for example, thatlarge objects are rarely struck by impactors greater than a few kilometers in radius.
Figure 3: Contours of Kuiper Disk collision timescales (in years) as a function of target
and impactor size for the model run with a mass per heliocentric bin that declines like R~ l,
and constant mass (CM) per bin population size structure (cf., Table 2). Again notice that
large objects are rarely struck by impactors greater than a few kilometers in radius.
Figure 4'- Estimated quasi-steady-state radial optical depths of debris in the Kuiper Disk,
as a function of (e). Panel a corresponds to the collision rate computation shown in Figure2; recall that the population size structure used in this case extended down to objectswith radii of 0.1 km. Panel b corresponds to the similar collision rate case that generated
Figure 3. In each panel, the bold line corresponds to debris production from strong (i.e.,
ice/rock) targets; the dashed line corresponds to debris production assuming the targets
are mechanically weak (i.e., snow-like). Panel c shows a similar calculation, based on
the final run case described in Table 2, which has the population size structure sharply
truncated for sizes below 1 km. The calculations in all panels assume vej = 0.20fl,-mp.
Figure 5: Estimated thermal emission brightness for a quasi-steady-state debris optical
depths of T- = 3 x 10~6 (panel a) and r = 3 x 10~7 (panel 6), assuming lrfe&ri,=40 K,
50 K, and 60 K. Superimposed are the IRAS, ISO/ISOPHOT, and SIRTF sky brightnesssensitivity limits.
Figure 6: The estimated number of detectable collision clouds for the collision rate data
presented in Figure 2, assuming a background optical depth of r=10~6, and a cloud:skycontrast ratio of £ =10:1. The results in panel a assume vej = 0.20u,-mp; the results inpanel 6 assume vej = 0.05u,-mp.
23

c 7: The estimated number of detectable collision clouds for the collision rate data
presented in Figure 3, assuming a. background optical depth of r=10~G , and a. cloucLsky
contrast ratio of (," =10:1. In panel a \ve assume vcj = 0.20v,-m/,; in panel b we assume
vcj = 0.05ulm;(.
24

( 1 )
• v.'!.
-100AU -50 AU 50 AU 100AU

( 2 )
162CSD_1e4_25MOM Size Structure
CSD_1e4_25MOM Size Structure
. a=40AU_ <e>=0.0128. <i>=0.36deg
a=60 AU<e>=0.0128<i>=0.36 deg
0.100.10 0.25 0.63 1.5 4.0 10 25 64 162
TARGET BIN RADIUS (km)
0.10 0.25 0.63 1.5 4.0 10 25 64 162
TARGET BIN RADIUS (km)
CSD_1e4__25- MOM Size Structure
. a=40AU
. <e>=0.1024
. <i>=2.93deg
I- CSD_1e4_25NOM Size Structure
. a=60AU
. <e>=0.1024
. <i>=2.93deg
0.100.10 0.25 0.63 1.5 4.0 10 25 64
TARGET BIN RADIUS (km)
0.10 0.25 0.63 1.5 4.0 10 25 64 162
TARGET BIN RADIUS (km)

( 3 )
CSD_1e4_23CM Size Structure
CSD_1e4_23CM Size Structure
. a=40AU
. <e>=0.0128<i>=0.36 deg
. a=60AU
. <e>=0.0128
. <i>=0.36deg
0.100.10 0.25 0.63 1.5 4.0 10 25 64
TARGET BIN RADIUS (km)0.10 0.25 0.63 1.5 4.0 10 25 64
TARGET BIN RADIUS (km)162
CSD_1e4_23CM Size Structure
- CSD 1e4 23~ CM Size Structure
. a=40AU . a=60AU
. <e>=0.1024
. <i>=2.93deg. <e>=0.1024. <i>=2.93deg
0.100,10 0.25 0.63 1.5 4.0 10 25 64
TARGET BIN RADIUS (km)
0.10 0.25 0.63 1.5 4.0 10 25 64
TARGET BIN RADIUS (km)

1 \ 1—I I I I 1 I 1 1—I—I I I I lI i
OPTICAL DEPTH
CSD_1e4_25
MOM Size Structure
Strength= 106-4,104-4ergs/gm
( 4a )
10
10"
10"
110-Q.UJQ-I
010"6
0.o
10'
10,-7
10'
- Vej/Vesc=0.20
10.-10 .....
-i
..... MI _ i t i ' ' ' ' '10"
ECCENTRICITY

Mb)
~i - 1 — I — I I i I i | - 1 - 1 — I — i i i I i i
OPTICAL DEPTH
CSD_1e4_23
CM Size Structure
Strengths 106'4, 104-4ergs/gm
10'
10"
10'
UlQ
10'
10-
1 - 1 — i
I- Vej/Vesc=0.20
-
J 1—' i i i i i I j 1—i i i i M I I I I—I I I M I .
10 10-
ECCENTRICITY

He)
10"
10"'
OPTICAL DEPTH
CSD_4e3_15
NOM Size Structure
Strengths 106'4,104<4ergs/gm
10"
0-UJQ
0.o
10"
io"
10"
10"
=0.20
i i i i 1 1 1 1 i i i i i 1 1 1 1 i i i i i 1 1 1 110- 10,-1
ECCENTRICITY

( 5 a )
Blackbody Curve for Background Optical Depth = 3.0 x 10,-6
10"
10
106
10
CO
10
101
10' 1 1 1 I I I101 10'
Wavelength (microns)

( 5 b )
Blackbody Curve for Background Optical Depth = 3.0 x 10⁻⁷
10"
107
10"
(0
(0UJ*•*(0
o>oX3
103
ion
101
10° j i i i i i i i J 1 1 ' t i i i I I ( L I I I I I-
10' 10*
Wavelength (microns)

( 6 a )
10
10
102
10
„Q 10°
O
o610"ccLUmmo*z
10'
10'
10 -7
CSD_1e4_25
CLOUDS at 10x BACKGROUND OPTICAL DEPTH
MOM Size Structure
Min Target Radius = 1.6 km
Max Target Radius = 162 km
Tgt Strengths = 106'4,104<4ergs/cm3
Distance = 35 to 60 AUVej = 0-20 V|mp
10' 10-ECCENTRICITY

( 6 b )
10
103
10
10
(0 0Q 10°IDoo
ocUJCO
10'
10'
10-
10-
10'7
1 I I I I I I 11 I I I I I I I I j I 1—I—I I I I 11
CSD_4e3_15
CLOUDS at 10x BACKGROUND OPTICAL DEPTH
NOM Size Structure
•
Min Target Radius = 1.0 km
Max Target Radius = 162 km
Tgt Strengths = 106'4,104-4 ergs/cm3
Distance = 35 to 60 AU
' I I I I I I I J ' I I I I I I ' ' I I I I I I10' 10' 10*
ECCENTRICITY
10'
( 7 a )
1 - T
103
10'
(0 .D 10'
§O
oQCUJffi
10'1
10'
10'
10*
T - 1 - 1 I I I I I.I - 1 - 1 - II I I I I I - 1 - 1 - 1 — I I I I I |
CSD_1e4_23
CLOUDS at 10x BACKGROUND OPTICAL DEPTH
CM Size Structure
Min Target Radius = 1.6 km
Max Target Radius = 162 km
Tgt Strengths = 106-4,104-4 ergs/cm3
Distance = 35 to 60 AU
Vej=0.20Vimp
l i i i i i i i i i i i i I i \ I ' ' '
10" 10"
ECCENTRICITY

( 7 b )
1 T 1 I I I I I | 1 1 1 I I I I 1 | 1 1 1 I I I I I | T
CSD_1e4_23
CLOUDS at 10x BACKGROUND OPTICAL DEPTH>» v %CM Size Structure
"I I IT
104
103
10Z
101
nQ 10°3O
ofe 10"DCHICO
I 10-
10-
10
10"
10'
Min Target Radius = 1.6 km
Max Target Radius = 162 km
Tgt Strengths = 106-4 104-4 ergs/cm3
Distance = 35 to 60 AU
= 0.05Vfmp
10-7 I i I10" 10*
ECCENTRICITY
-i
I I
10'1