l -scale me r d ion oof melting rate of w s feeds · dwpf defense waste processing facility em u.s....
TRANSCRIPT

Pun
LDW DMWJ J
repared for the nder Contract D
LaborDetermWaste
D Kim MJ SchweigWC Buchmi
Matyas
anuary 201
U.S. DepartmenDE-AC05-76RL0
ratoryminate Glas
ger ller
12
nt of Energy 01830
y-Scaltion oss Fe
le Meof Meleds
elter folting R
EM
or Rate o
PNNL-2100SP-RPT-01
of
05 12

DISCLAIMER This report was prepared as an account of work sponsored by an agency of the United States Government. Neither the United States Government nor any agency thereof, nor Battelle Memorial Institute, nor any of their employees, makes any warranty, express or implied, or assumes any legal liability or responsibility for the accuracy, completeness, or usefulness of any information, apparatus, product, or process disclosed, or represents that its use would not infringe privately owned rights. Reference herein to any specific commercial product, process, or service by trade name, trademark, manufacturer, or otherwise does not necessarily constitute or imply its endorsement, recommendation, or favoring by the United States Government or any agency thereof, or Battelle Memorial Institute. The views and opinions of authors expressed herein do not necessarily state or reflect those of the United States Government or any agency thereof.
PACIFIC NORTHWEST NATIONAL LABORATORY operated by BATTELLE
for the UNITED STATES DEPARTMENT OF ENERGY
under Contract DE-AC05-76RL01830
Printed in the United States of America
Available to DOE and DOE contractors from the Office of Scientific and Technical Information,
P.O. Box 62, Oak Ridge, TN 37831-0062; ph: (865) 576-8401 fax: (865) 576 5728
email: [email protected]
Available to the public from the National Technical Information Service, U.S. Department of Commerce, 5285 Port Royal Rd., Springfield, VA 22161
ph: (800) 553-6847 fax: (703) 605-6900
email: [email protected] online ordering: http://www.ntis.gov/ordering.htm

PNNL-21005 EMSP-RPT-012
Laboratory-Scale Melter for Determination of Melting Rate of Waste Glass Feeds D Kim MJ Schweiger WC Buchmiller J Matyas January 2012 Prepared for the U.S. Department of Energy under Contract DE-AC05-76RL01830 Pacific Northwest National Laboratory Richland, Washington 99352


iii
Summary
The purpose of this study was to develop the laboratory-scale melter (LSM) as a quick and inexpensive method to determine the processing rate of various waste glass slurry feeds. The LSM uses a 3 or 4 in. diameter-fused quartz crucible with feed and off-gas ports on top. This LSM setup allows cold-cap formation above the molten glass to be directly monitored to obtain a steady-state melting rate of the waste glass feeds. Major modifications to the previous LSM setup were implemented in the present study primarily to improve the view of the cold-cap melting progress.
The melting rate data from extensive scaled-melter tests with Hanford Site high-level wastes performed for the Hanford Tank Waste Treatment and Immobilization Plant have been compiled. Preliminary empirical model that expresses the melting rate as a function of bubbling rate and glass yield was developed from the compiled database. The two waste glass feeds with most melter run data—for AZ-101 and C-106/AY-102 wastes—were selected for detailed evaluation and model development and for the LSM tests so the melting rates obtained from LSM tests can be compared with those from scaled-melter tests.
The present LSM results suggest the LSM setup can be used to estimate the appropriate trends in glass production rates for the development of new glass compositions or feed makeups that are designed to increase the processing rate of the slurry feeds, although it will not give a quantitative data of large-scale tests. The improvements applied to the present LSM setup will also be valuable for investigating the formation of separated salt phase during cold-cap melting, which is required to develop glass formulations for the waste types of which loading is limited by separated salt formation.


v
Acknowledgments
The authors are grateful to the U.S. Department of Energy’s Environmental Management, Office of Waste Processing (EM-31), for initial funding of the project and for the Office of River Protection and Washington River Protection Solutions for their continued support. Programmatic directions by Steve Schneider and Gary Smith at EM-31 and technical support by Albert Kruger at the U.S. Department of Energy’s Office of River Protection are greatly appreciated.


vii
Acronyms and Abbreviations
DOE U.S. Department of Energy
DWPF Defense Waste Processing Facility
EM U.S. Department of Energy, Office of Environmental Management
EM-31 U.S. Department of Energy, Office of Waste Processing
GC-MS gas chromatography-mass spectrometry
HLW high-level waste
LSM laboratory-scale melter
OD outer diameter
PNNL Pacific Northwest National Laboratory
SEM scanning electron microscope
VSL Vitreous State Laboratory at the Catholic University of America
WP waste processing
WTP Hanford Tank Waste Treatment and Immobilization Plant


ix
Contents
1.0 Introduction ...................................................................................................................................... 1.1
1.1 Background ............................................................................................................................... 1.1
1.2 Objective ................................................................................................................................... 1.2
1.3 Quality Assurance ..................................................................................................................... 1.2
2.0 Melting Rate Data from Melter Tests .............................................................................................. 2.1
3.0 Laboratory-Scale Melter Setup ........................................................................................................ 3.1
4.0 Glass and Feed Compositions .......................................................................................................... 4.1
5.0 Laboratory-Scale Melter Tests ......................................................................................................... 5.1
5.1 Test Procedure ........................................................................................................................... 5.1
5.2 Test Results with Initial Setup .................................................................................................. 5.1
5.3 Test Results with Improved Setup ............................................................................................ 5.3
6.0 Conclusions ...................................................................................................................................... 6.1
7.0 References ........................................................................................................................................ 7.1

x
Figures
1.1. Schematic of Cold-Cap Melting in Joule Heated Melter ................................................................. 1.1
2.1. Predicted Versus Measured Glass Production Rate from DM1000/1200 Tests ............................... 2.3
2.2. Predicted Glass Production Rate as a Function of Glass Yield (upper plot) and Normalized Bubbling Rate (lower plot) ............................................................................................................... 2.4
2.3. Predicted Versus Measured Glass Production Rate from DM1000/1200 and DM100 Tests .......... 2.5
3.1. Schematic of LSM Used by Riley et al. (2009) ............................................................................... 3.1
3.2. Schematic of Modified LSM Used in This Study ............................................................................ 3.3
3.3. Comparison of Fused Quartz Crucibles ........................................................................................... 3.3
5.1. Cold-Cap Sample Taken from LSM Test with AZ-101 feed at 300 g/L .......................................... 5.2
5.2. Example of Cold-Cap Sample Analyses: (a) picture of glass-cold cap sample from LSM test with AZ-101 feed at 300 g/L; (b) and (c) SEM micrographs of the areas indicated in (a); (d) high magnification SEM micrograph of area indicated in (b) with phases identified ......... 5.3
5.3. Pictures Showing the Sequence of Melting the AZ-101 Glass Cullet during Ramp Heating Before Adding the Slurry Feed ........................................................................................................ 5.4
5.4. Picture Showing the Initial Stage of Cold-Cap Formation After Adding the Slurry Feed ............... 5.4
5.5. Pictures Showing the Steady State Cold-Cap with Large Bubbles Bursting Through Glass Melt Around the Cold Cap ............................................................................................................... 5.5
5.6. Pictures of Glass Samples with Quenched Cold-Caps on Top After LSM Tests ............................ 5.6
5.7. Melting Rates Measured from LSM Tests Compared with Predicted Melting Rates for DM1200 and DM100 Calculated by Equations (1) and (2) ............................................................. 5.7
5.8. Predicted Versus Measured Glass Production Rate for Simulated AZ-101 Melter Feeds ............... 5.9
5.9. Predicted Effect of Melter Surface Area on Glass Production Rate ................................................ 5.9
5.10. Glass Temperature versus Time after the Start of Feeding ............................................................ 5.10
5.11. Plenum Temperature Versus Time After the Start of Feeding ....................................................... 5.10
5.12. Glass and Plenum Temperatures Versus Glass Production Rate ................................................... 5.11
xi
Tables
2.1. Glass Production Rate for Melter Feeds with Simulated AZ-101 and C-106/AY-102 Wastes from DM1000 and DM1200 Tests ................................................................................................... 2.1
2.2. Glass Production Rate for Melter Feeds with Simulated AZ-101 and C-106/AY-102 Wastes from DM100 Tests ........................................................................................................................... 2.2
2.3. Model Coefficients for Glass Production Rate in DM1200 Tests with Two Hanford HLW Feeds ................................................................................................................................................ 2.3
4.1. Composition of Glasses Formulated for Simulated AZ-101 and C-106/AY-102 Wastes Selected for LSM Tests .................................................................................................................... 4.1
4.2. Composition of AZ-101 Waste Glass Feeds Selected for LSM Tests ............................................. 4.2
4.3. Composition of C-106/AY-102 Waste Glass Feeds Selected for LSM Tests .................................. 4.3
5.1. Measured Density of LSM Feeds ..................................................................................................... 5.1
5.2. Calibrated Feeding Rates for LSM Feeds ........................................................................................ 5.1
5.3. Steady-State Feed Rate and Melting Rate from LSM Tests ............................................................ 5.7
5.4. Model Coefficients for Glass Production Rate from DM1000/DM1200, DM100, and LSM Tests with AZ-101 Feeds ................................................................................................................. 5.8

1.1
1.0 Introduction
1.1 Background
The cost and schedule of high-level waste (HLW) treatment is highly dependent on the loading of HLW in glass and on the rate of HLW glass production. Increasing the rate of glass processing in the Hanford Tank Waste Treatment and Immobilization Plant (WTP) at the Hanford Site and in the Defense Waste Processing Facility (DWPF) at the Savannah River Site will allow shortening the life cycle of waste cleanup at each site.
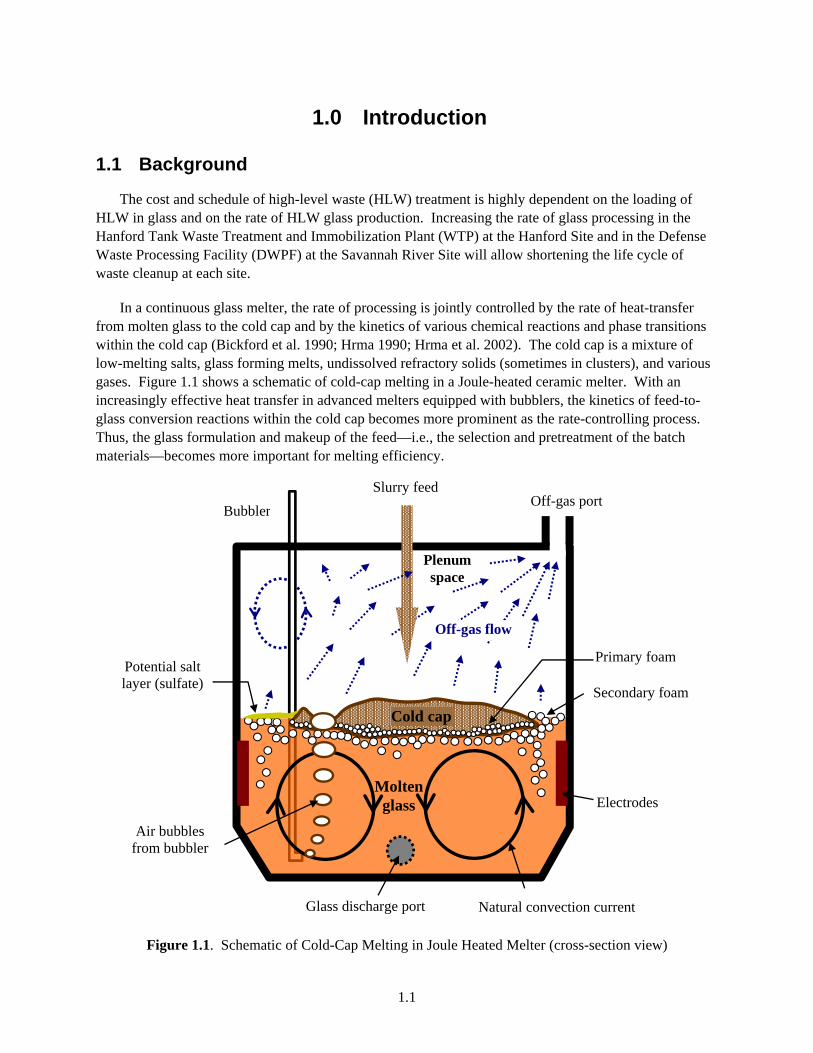
In a continuous glass melter, the rate of processing is jointly controlled by the rate of heat-transfer from molten glass to the cold cap and by the kinetics of various chemical reactions and phase transitions within the cold cap (Bickford et al. 1990; Hrma 1990; Hrma et al. 2002). The cold cap is a mixture of low-melting salts, glass forming melts, undissolved refractory solids (sometimes in clusters), and various gases. Figure 1.1 shows a schematic of cold-cap melting in a Joule-heated ceramic melter. With an increasingly effective heat transfer in advanced melters equipped with bubblers, the kinetics of feed-to-glass conversion reactions within the cold cap becomes more prominent as the rate-controlling process. Thus, the glass formulation and makeup of the feed—i.e., the selection and pretreatment of the batch materials—becomes more important for melting efficiency.
Figure 1.1. Schematic of Cold-Cap Melting in Joule Heated Melter (cross-section view)
Potential salt layer (sulfate)
Primary foam
Cold cap
Electrodes
Slurry feed
Glass discharge port
Secondary foam
Natural convection current
Moltenglass
Bubbler
Air bubbles from bubbler
Off-gas flow
Off-gas port
Plenum space

1.2
Model-based glass formulation tools have been developed so that each melter feed batch is formulated to satisfy all glass quality and basic processing requirements with appropriate confidence. However, there is currently no tool that can adequately predict the feed melting behavior including the rate of melting as a function of melter feed composition. Therefore, before defining the glass-forming chemicals or frit for a specific batch, the melting rate is assessed through experimental studies, which can be time consuming and costly. Having models to predict the melting behavior of the feed would have a significant impact on glass formulation developed with respect to not only cost but also schedule.
Melting rate studies are being performed at Pacific Northwest National Laboratory (PNNL) to develop a fundamental understanding of glass conversion reactions—in particular those that strongly influence the rate of melting, and tools to predict the impacts of composition and other key parameters on the melting rate, which will be used to identify the methods and strategy to increase the throughput of HLW feeds. The initial results of the crucible scale tests of cold-cap processes to express the key cold-cap parameters that are important to cold-cap behavior as a function of glass feed composition and selected physical properties have been published (Hrma et al. 2009, 2010, 2011a, 2011b; Schweiger et al. 2009; Henager et al. 2011). The results of crucible scale tests are being used as model inputs for the mathematical cold-cap model. The model report published by Pokorny and Hrma (2010) summarized the recent progress in the development of mathematical model that can, once fully developed, predict melting rates based on feed composition and various processing conditions.
This report describes the development of a laboratory-scale melter (LSM) that can be used to determine the rate of melting for various slurry feeds for the vitrification of HLW. The LSM uses a 3 or 4 in. diameter-fused quartz crucible with feed and off-gas ports on top. This LSM setup allows cold-cap formation above the molten glass to be directly monitored to obtain a steady-state melting rate of the waste glass feeds. The LSM can also be used as a quick and inexpensive method to evaluate the cold-cap melting behavior of a range of newly formulated feeds for various purposes, such as formation of salt phase on molten glass surfaces.
1.2 Objective
The objective of this study is to establish LSM as a tool to determine the processing rate of waste glass feeds that qualitatively mimic those from large-scale melter tests. LSM tests were performed using Hanford Site HLW glass feeds with existing processing rate data from scaled-melter tests so that the melting rate determined from the LSM test could be compared with that obtained from scaled-melter tests.
1.3 Quality Assurance
A graded quality assurance approach was used for the Waste Processing No.4 (WP-4) tasks performed under the U.S. Department of Energy EM-31 Technology Development and Deployment program. The work activities performed in the WP-4.2.2 subtask were performed in accordance with the quality assurance plan for the EM-31 Support Project (EM-31SP-PQAP) under Quality Level 3. This work was conducted in accordance with best laboratory practices (NQA-1-2000-based) as implemented through PNNL’s standards-based management system (How-Do-I [HDI]) work flows and subject areas.

2.1
2.0 Melting Rate Data from Melter Tests
The results of extensive scaled-melter tests with Hanford Site HLWs performed at Vitreous State Laboratory (VSL) of the Catholic University of America for the WTP project (Matlack et al. 2000, 2001, 2003a, 2003b, 2003c, 2004a, 2004b, 2004c, 2005a, 2005b, 2005c, 2006, and 2007) have been compiled. This database was used to select simulated HLW glass and feed compositions for the LSM tests. Chapman (2004) and Perez et al. (2005) used the similar set of data to develop a mechanistic model that expressed the melting rate as a function of various parameters related to bubbling without considering the effect of feed variations. The present evaluation focused on a preliminary empirical model for melting rate as a function of bubbling rate and glass yield for different feed compositions. Table 2.1 and Table 2.2 summarize the melting rate data for given normalized bubbling rate and glass yield from DM1000/1200 (Table 2.1) and DM100 (Table 2.2) tests.
Table 2.1. Glass Production Rate for Melter Feeds with Simulated AZ-101 and C-106/AY-102 Wastes from DM1000 and DM1200 Tests
Target Waste Glass ID Reference
Bubbling Rate(a),
L/(m2min)
Target Glass Yield,
g/L
Melting Rate(b),
kg/(m2d)
AZ-101
HLW98-31
Matlack et al. 2000 0 300 180 0 570 260
Matlack et al. 2001 47.2 350 705 3.1 570 265
47.2 570 759 Matlack et al. 2003a 3.3 570 272
HLW98-77 Matlack et al. 2004a
57.5 300 477 6.7 300 235
33.3 300 471 54.2 300 672 0.8 400 177 6.7 400 271
33.3 400 481 54.2 400 709 6.3 530 406
21.7 530 627 35.8 530 797 54.2 530 986 60.8 530 941 6.7 530 412
33.3 530 648 54.2 530 875
Matlack et al. 2004c 54.2 530 1038
C-106/ AY-102
HLW98-34 Matlack et al. 2000 0 510 160
79.2 510 810
HLW98-86 Matlack et al. 2003b
6.7 518 329 33.3 518 484 54.2 518 894
Matlack et al. 2004b 54.2 550 926 54.2 550 777
(a)Normalized to melter surface area. For tests given with bubbling range, the middle value was used. (b)Calculated based on average feed rate.

2.2
Table 2.2. Glass Production Rate for Melter Feeds with Simulated AZ-101 and C-106/AY-102 Wastes from DM100 Tests
Target Waste Glass ID Reference
Bubbling Rate(a),
L/(m2min)
Target Glass Yield,
g/L
Melting Rate(b),
kg/(m2d)
AZ-101 HLW98-31 Matlack et al. 2003c
52.4 350 873 0.9 410 349 0.9 514 398 0.9 555 414 8.7 555 643
21.8 555 811 52.4 555 1233
C-106/ AY-102
HLW98-86 Matlack et al. 2007 83.3 534 827 83.3 533 882
HLW04-09 Matlack et al. 2005c
82.4 423 1117 84.3 500 1183
Matlack et al. 2005a 104.6 420 1356 (a)Normalized to melter surface area. For tests given with bubbling range, the middle value was used. (b)Calculated based on average feed rate.
Only the tests with simulated AZ-101 and C-106/AY1-02 had sufficient number of data for evaluation of the effect of feed composition. Table 2.1 and Table 2.2 include only the tests that have all other test variables constant, except the bubbling rate and glass yield; i.e., the data from following tests were excluded:
tests with modified operation conditions, e.g., modified bubbler configuration, nominal processing temperature other than 1150°C, and use of plenum heating
tests with modified feeds, e.g., addition of sucrose, use of glass frit, and adjusted feed rheology
tests that resulted in abnormal conditions, e.g., vigorous foaming and steady state not obtained
tests with outlying operation conditions, e.g., extremely high bubbling rate compared to the rest of the tests
tests that used bubbling but did not report the bubbling rate.
Initially, the modeling effort in this study was performed on data from DM1000/1200 tests only. It was found that the glass production rate fits well to the function shown in Equation (1):
, (1 )m nG DM1200 B B G Gr c r c y (1)
where rG,DM1200 = glass production rate [kg/(m2d)] from DM1000/1200 tests rB = bubbling rate per unit melter surface area [L/(m2min)] yG = glass yield per unit volume of slurry feed (g(glass)/L(feed)) cB and cG = coefficients dependent on melter feed m and n = coefficients independent of melter feed
Table 2.3 shows the model coefficients calculated for the melter feeds for the simulated AZ-101 wastes (Matlack et al. 2000, 2001, 2003a, 2004a, 2004c) and for the simulated C-106/AY-102 wastes (Matlack et al. 2000, 2003b, 2004b). All six coefficients were obtained from a least-square regression for

all 30 datameasured normalize
F
a points in Taproduction ra
ed bubbling ra
Table 2
Figure 2.1. Pr
able 2.1. The ate is in Figurate on the calc
2.3. Model C
Coeff
m
n
c
c
redicted Vers
R2 value for re 2.1. Figureculated glass
Coefficients fowith T
ficient
m
n
Bc
Gc
us Measured
2.3
the model wae 2.2 shows thproduction ra
or Glass ProduTwo Hanford
AZ-101
0.7
0.7
0.21
1.54
Glass Produc
as 0.923. Thehe predicted eate.
uction Rate ind HLW Feeds
C-106/AY-10
70
78
0.20
1.34
ction Rate fro
e plot of predieffects of gla
n DM1200 Tes
02
om DM1000/
icted versus ss yield and
ests
1200 Tests
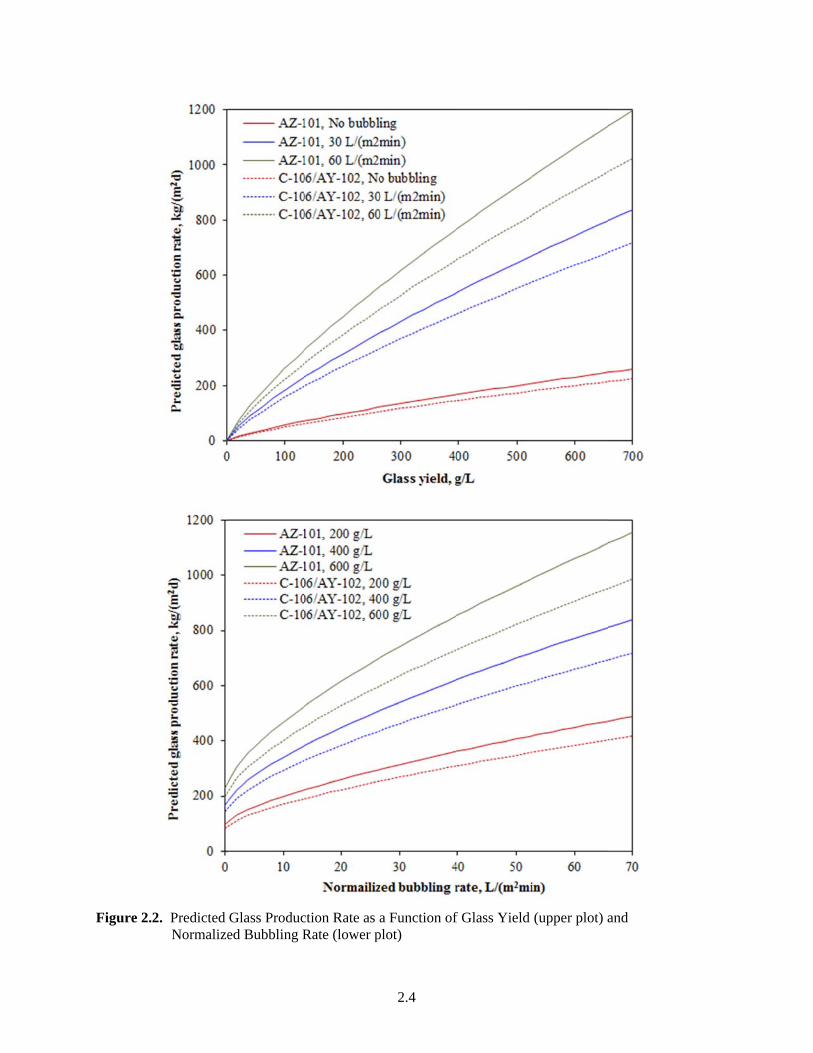
Figure 2.2. Predicted Normalize
Glass Produced Bubbling R
ction Rate as aRate (lower p
2.4
a Function ofplot)
f Glass Yield (upper plot) a
and

Tableand cG areeffect of gglasses) obubbling rvariables glass yieldpredicted
Initialspecific psufficient shown in
where rG,D
given in TThe plot o2.3.
Figure
e 2.3 and Figue larger) than glass composior the differenrate, m and n,at low bubblid, the typical glass product
l comparison roduction ratedata for a sepEquation (2)
DM100 is the glTable 2.2 resuof predicted v
2.3. Predicte
ure 2.2 show tthe C-106/AYition for the s
nce was neglig, are smaller ting rate and gexperimentaltion rate and
of data from e was faster fparate model fits the data w
ass productioulted in the f10
versus measur
ed Versus Me
that the proceY-102 meltersame waste (egible. The exthan 1, and th
glass yield thal range is fromglass yield is
DM100 withfrom DM100with DM100well:
, 00G DM1r
on rate from D
00 values of 1.red production
asured Glass
2.5
essing rate is hr feeds. Theree.g., between Hxponents fromherefore the mat diminishes m 300 to 600 close to linea
h those from Dtests under si data. It was
,100 G DM1200f r
DM100 tests. .38 for AZ-10n rate from D
Production R
higher for thee were not enHLW98-31 a
m the model fomodel predicts
as they increag/L for which
ar.
DM1200 testsimilar conditifound that th
The fit of Eq01 feeds and 1
DM1000/1200
Rate from DM
e AZ-101 melnough data to and HLW98-7or glass yields stronger effease as shown h the relation
s showed the mions. Howevehe following s
quation (2) to1.13 for C-100 and DM100
M1000/1200 a
lter feeds (botdifferentiate
77 for AZ-10d and normalizfects of these
in Figure 2.2nship between
melt surface aer, there weresimple relatio
the DM100 d06/AY-102 fe tests is in Fig
and DM100 T
th cB the 1 zed
2. For n the
area e not n as
(2)
data eds. gure
Tests

2.6
Figure 2.3 shows that the DM100 results with AZ-101 feed fit Equation (2) exceptionally well but those with C-106/AY-102 feeds showed large scatter. For the C-106/AY-102 feeds, there was a clear difference in production rate between two glass compositions (HLW04-09 glass melted significantly faster than HLW98-86 under similar bubbling rate and glass yield). In addition, the variations for bubbling rate and glass yield for C-106/AY-102 feeds were very narrow, i.e., these variations are not good data sets for the model and therefore the resulting coefficient (f100 = 1.38) is not adequate for comparison with test data.

The Lmethod albeen primVienna etRiley et a
The Lfused quaThe verticthe cold-clayer heigchemical gas analys
3
LSM setup thallows cold-cap
marily used to t al. 2002; Kiml. (2009).
LSM assemblyartz crucible mcal tube is usecap region in tght is increaseanalyses or cses.
3.0 Lab
at was develop formation aevaluate the
m et al. 2003)
y used in Rilemelter bodies ed as the feedthe melter con
ed from feed pan be connect
Figure 3.1.
boratory
oped at PNNLand evolutionformation of ). This metho
ey et al. (2009have 3 in. OD
d inlet and thenstant, the hoprocessing. Tted to gas chr
Schematic of
3.1
y-Scale M
L uses a fused to be directlya salt layer fr
od has improv
9) is shown scD and are 10 i slanted tube
ot zone of the This assemblyromatography
f LSM Used b
Melter S
d quartz cruciby observed durom various mved and evolv
chematically in. tall with twfor off-gas. Tcrucible is co
y is capable oy-mass spectr
by Riley et al
Setup
ble as a smalluring slurry femelter feeds (ved into the se
in Figure 3.1wo smaller poTo maintain tontinuously ra
of collecting orometry (GC-M
l. (2009)
l melter. Thiseeding and haDarab et al. 2etup used by
. The single-orts (0.75 in.the temperatuaised as the m
off-gas sampleMS) for evolv
s as 2001;
-use OD).
ure of melt es for ved

3.2
The initial LSM tests in this study were performed after applying following modifications (shown in Figure 3.2):
The off-gas system used to collect off-gas samples was removed and replaced by a simple vent system that sends the off gas to the hood and is designed to prevent the condensed water from flowing back into the crucible.
The crucible position relative to the furnace was raised so that the melt is primarily heated from the bottom of the crucible (see Figure 3.2).
The preliminary LSM results provided information on the structure (morphology) of cold cap valuable to the development of the mathematical cold-cap model (Pokorny and Hrma 2010). However, the LSM setup was not sensitive enough for quantitative determination of melting rate for this study. The preliminary LSM tests identified several issues that made it difficult to obtain the steady state melting rate. Based on these initial experiences, the following improvements were implemented:
Increased diameter of quartz crucible to allow more room for a cold cap to grow before it touches the crucible wall to avoid “bridging” of the cold cap, which, once formed, is very difficult to recover back to normal operation (see Figure 3.3).
New lift apparatus to allow fine control and precise monitoring of crucible height so that the temperature at the interface between cold cap and molten glass can be kept reasonably constant during tests.
Redesign of slurry feeding system to use water-cooled line outside the feeding tube so the feed nozzle can be brought closer to the cold cap without clogging the feed line caused by dried feed. The reason to bring the feed nozzle closer to the cold cap is to avoid splashing the slurry feed material to the top of the crucible that causes severe interference of view.
Placement of thermocouple bundle for measurement of temperatures of the molten glass and plenum space (using the additional port added to new fused quartz crucible; see Figure 3.3). This port can also be used to insert the bubbler.
One of the key factors for successful operation was to keep the cold-cap coverage relatively low at about 40% so the steady state cold-cap coverage can be maintained without causing bridging.

F
F
igure 3.3. Co
Figure 3.2. S
omparison of
Schematic of
f Fused Quart
3.3
Modified LS
z Crucibles (l
SM Used in Th
left image is o
his Study
old; right ima
age is new)


4.1
4.0 Glass and Feed Compositions
Based on existing melting rate data from scaled-melter tests discussed in Section 2.0, the two glasses were selected for the LSM tests— HLW98-77 for AZ-101 and HLW98-86 for C-106/AY-102. The compositions of these two glasses are provided in Table 4.1. The two glasses had in general similar compositions except for two components that had the most noticeable difference: ZrO2 was higher in HLW98-77 for AZ-101 (3.8 wt% compared to 0.26 wt%) but MnO was higher in HLW98-86 glass for C-106/AY-102 (4 wt% compared to 0.17 wt%). These two glasses had similar viscosity at 1150C, 5.2 Pa·s for HLW98-77 and 4.4 Pa∙s for HLW98-86.
Table 4.1. Composition of Glasses Formulated for Simulated AZ-101 and C-106/AY-102 Wastes Selected for LSM Tests (in mass fraction, from Matlack et al. 2004a and 2003b)
Waste AZ-101 C-106/AY-102 Glass ID HLW98-77 HLW98-86
Al2O3 0.0519 0.0529 As2O5 - 0.0022 B2O3 0.1190 0.0939 BaO 0.0002 - CaO 0.0028 0.0030 CdO 0.0006 - Cl - 0.0011
Cr2O3 - 0.0008 Cs2O <0.0001 0.0005 CuO 0.0003 0.0004
F 0.0004 - Fe2O3 0.1221 0.1258
I 0.0010 0.0010 K2O 0.0003 -
La2O3 0.0041 0.0024 Li2O 0.0352 0.0301 MgO 0.0011 0.0117 MnO 0.0017 0.0400 Na2O 0.1165 0.1183 Nd2O3 0.0031 0.0015 NiO 0.0061 0.0017 P2O5 - 0.0009 PbO 0.0003 0.0014 SO3 0.0007 -
Sb2O3 - 0.0025 SeO2 - 0.0037 SiO2 0.4740 0.4704 SrO 0.0003 0.0092 TiO2 - 0.0014 ZnO 0.0201 0.0207 ZrO2 0.0380 0.0026

4.2
The composition of HLW98-77 glass feed with AZ-101 is provided in Table 4.2 and that of HLW98-86 glass feed for C-106/AY-102 is in Table 4.3. These data were obtained by modifying the recipes given in Matlack et al. (2004a, 2003b) based on specific materials available at PNNL. These recipes are for the feeds with a glass yield of 500 g/L.
Table 4.2. Composition of AZ-101 Waste Glass Feeds Selected for LSM Tests (in g per kg glass, at 500 g/L for HLW98-77 glass [modified(a) from Matlack et al. 2004a])
Materials (for Simulated Waste) Target, g Materials (for additives) Target, g
Al(OH)3 79.75
H3BO3 2.61 Na2B4O7·10H2O 321.89
Ba(OH)2·8H2O 0.371
Ca(OH)2 3.75
CdO 0.638
CsOH·H2O (90%) 0.033
CuO 0.304
NaF 0.846
Fe(OH)3 (13% slurry) 1257.45
NaI 1.19
KNO3 0.710
La(OH)3 4.74
Li2CO3 0.505 Li2CO3 87.42
Mg(OH)2 1.550
MnO2 2.08
NaOH 8.92 Na2CO3 91.03
Nd2O3 3.08
Ni(OH)2 (62.2% Ni) 7.75
PbO 0.329
SiO2 () 4.05 SiO2 470.94
Na2SO4 1.35
Sr(OH)2·8H2O 0.886
ZnO 0.152 ZnO 20.00
Zr(OH)4·xH2O (~38% Zr) 73.51
NaNO2 1.60
NaNO3 7.19
H2C2O4·2H2O 1.23
Subtotal (no water) 1466.58
Water (estimated)(b) 286.50 Subtotal 991.29 (a)La(OH)3 is used instead of La(OH)3·3H2O. (b)Water is estimated and for information only. Shaded empty cells represent no data.
Total (no water) 2457.87
Total (estimated with water) 2744.37
Target Volume of Slurry Feed, mL 2000

4.3
Table 4.3. Composition of C-106/AY-102 Waste Glass Feeds Selected for LSM Tests (in g per kg glass, at 500 g/L, for HLW98-86 glass, modified(a) from Matlack et al. 2003b)
Materials (for simulated waste) Target, g Materials (for additives) Target, g
Al(OH)3 54.43 Al2O3 17.51
As2O3 1.92
H3BO3 2.42 Na2B4O7·10H2O 253.40
CaCO3 5.43
NaCl 1.78
Cr2O3 0.781
CsOH·H2O (90%) 0.661
CuO 0.445
Fe(OH)3 (~13% slurry) 1284.61
NaI 1.18
La(OH)3 2.82
Li2CO3 0.139 Li2CO3 74.93
Mg(OH)2 17.07
MnO2 49.15
Na2CO3 6.14 Na2CO3 123.21
Nd2O3 1.50
Ni(OH)2 (62.2% Ni) 2.17
FePO4·xH2O (80%) 2.52
PbO 1.44
Sb2O3 2.56
SeO2 3.74
SiO2 20.44 SiO2 450.90
SrCO3 13.22
TiO2 1.42
ZnO 0.694 ZnO 20.00
Zr(OH)4·xH2O (~38% Zr) 4.99
NaNO2 0.051
NaNO3 3.00
H2C2O4·2H2O 0.379
Subtotal (no water) 1487.10
Water (estimated)(b) 233.500 Subtotal 939.96 (a)La(OH)3 is used instead of La(OH)3·3H2O. (b)Water is estimated and for information only. Shaded empty cells represent no data.
Total (no water) 2427.05
Total (estimated with water) 2660.55
Target Volume of Slurry Feed, mL 2000


5.1
5.0 Laboratory-Scale Melter Tests
5.1 Test Procedure
The 500 g/L feed was prepared by mixing all ingredients given in Table 4.2 or Table 4.3 in a stainless-steel container with a stainless-steel bar for 1 h. The feeds with 300 or 400 g/L were prepared by adding an appropriate amount of water to the 500 g/L feed. For the preparation of AZ-101 feed, too much water was added accidently and resulted in 479 g/L feed instead of the targeted 500 g/L. Three LSM tests were performed with AZ-101 feeds at 300, 400, and 479 g/L and one test was performed with C-106/AY-102 feed at 400 g/L. Density of the feed for each LSM test was measured using a graduated cylinder and summarized in Table 5.1.
Table 5.1. Measured Density of LSM Feeds
Feed Density, g/cm3
AZ-101, 300 g/L 1.178
AZ-101, 400 g/L 1.274
AZ-101, 479 g/L 1.396
C-106/AY-102, 400 g/L 1.281
For each test, the glass cullet of the same glass composition as the test melter feed was loaded into the quart crucible for the amount to fill the crucible roughly 2 cm height when melted at ~1150C and heated to a predetermined temperature. Feed was introduced into the crucible via a peristaltic pump that was calibrated for the feeding rate before each test from a beaker of the slurry mixture that was stirred on a stir plate throughout the test period. Table 5.2 summarizes the calibrated feeding rates for the slurry feeds used in this study.
Table 5.2. Calibrated Feeding Rates for LSM Feeds
Flow Meter Reading
AZ-101 300 g/L
AZ-101 400 g/L
AZ-101 479 g/L
C-106/AY-102 400 g/L
Feeding Rate, mL/min 3 3.4 3.2 3.4 3.4 3.5 NM NM 3.7 NM 4 4.5 4.3 4.2 4.1 5 5.4 5.2 NM 5.3
NM: Not measured.
5.2 Test Results with Initial Setup
As mentioned in Section 3.0, the preliminary tests were not successful to obtain the steady state melting rate that can be used to compare with the melting rate data from scaled-melter tests. Figure 5.1 shows a cold-cap sample taken from the test with AZ-101 feed with 300 g/L glass yield displaying an

extreme eBecause ocoverage,cold-cap w
Figurwhich waphoto in Fwere takepores and“Partially It was foufeed, foamcold cap. to build threport (Po
example of theof the blocked which resultwith large cav
Figure 5.1
e 5.2 shows aas used to examFigure 5.2(a) n. Figure 5.2
d of foam layereacted feed”
und from evalm, and glass a Further studihe cold-cap mokorny and Hr
e cold cap wid view discused in feeding vities illustrat
. Cold-Cap S
a cold sample mine the coldshows the are
2(b) and Figurer with closed” in Figure 5.luation of thisare not presenies are needed
model structurrma 2010).
Unre
th large cavitsed earlier, it too fast for s
ted in Figure 5
Sample Taken
taken from ad-cap structureas that SEM re 5.2(c) show
d gas bubbles.2(b) contain v
s sample and ont in distinct lad to better unre more realis
eacted feed
Partiaand la
5.2
ties formed bewas difficult
some tests wit5.1.
n from LSM T
another test wre by scanningmicrographs
w distinct feat The areas Fvarious unreaother similar ayers, which derstand the ptically than th
ally reacted arge cavities
G
etween the unt to make a gothout noticing
Test with AZ-
with AZ-101 feg electron micgiven in Figu
tures of partiaFigure 5.2(d) cacted feed macold-cap samsuggests theyproposed coldhat discussed
feed s
Glass
nreacted feed ood estimatiog the formatio
-101 feed at 3
feed with 300 croscopy (SEure 5.2(b) andally reacted feconfirms the materials, includmples that the y become inted-cap behavioin the meltin
and glass. n of the cold-on of thick
300 g/L
g/L glass yieEM). The coldd Figure 5.2(c
feed with openmaterial markding quartz (Spartially reac
ermixed withior, which will
ng rate model
-cap
eld, d-cap c) n ked as SiO2). cted in the l help

Figure 5.
5.3 Te
Figurduring furinitial stagthermocou
Figurglass feedwall werethe colderdistance nrise to thecold-cap gsmaller co
(c)
(a)
2. Example owith AZ-1high magn
est Resul
e 5.3 show a rnace ramp hege of the colduple are also
e 5.5 shows thds. The relative seen (see brir surface). It needs to be me melt surfaceglass samplesompared to th
of Cold-Cap S101 feed at 30nification SEM
lts with Im
sequence of teating to a pred-cap formatioshown in this
he example pvely large bubighter circles was found thaaintained betw
e and burst fres after the LSMhose from the
Sample Analy00 g/L; (b) anM micrograph
mproved
top-view imageset temperaton for tests ws picture.
pictures of stebbles burstingaround the coat to achieve ween the coldeely without cM tests. As einitial tests d
5.3
yses: (a) pictund (c) SEM mh of area indi
Setup
ges that illusture before ad
with 300 g/L A
ady-state coldg at the melt sold cap formea steady-state
d-cap boundacausing bridgiexpected, the discussed in S
(b)
(d)
ure of glass-comicrographs oficated in (b) w
trate the convdding the slurrAZ-101 glass
d cap formed surface betweed by hotter ge cold cap me
ary and crucibing. Figure 5cold-cap thic
Section 5.2.
old cap sampf the areas indwith phases id
version of the ry feed. Figufeed. The fee
d in three testseen the cold cglass that are belting a certaible wall so tha5.6 shows the ckness after co
ple from LSMdicated in (a)dentified
AZ-101 glassure 5.4 shows ed nozzle and
s with AZ-101cap and crucibbeing pushed n minimum at the bubblespictures of
ooling was m
M test ; (d)
s the
d
1 ble to
s can
much

Figure 5.
Figure 5.
3. Pictures SBefore Ad
4. Picture Sh(300 g/L A
Feed
howing the Sdding the Slur
howing the InAZ-101 glass
d nozzle
Sequence of Mrry Feed
nitial Stage of s feed)
5.4
Melting the AZ
f Cold-Cap Fo
Z-101 Glass C
ormation Afte
T
Cullet during
er Adding the
Thermocouple
g Ramp Heatin
Slurry Feed
e
ng

Figure 5.5. Pictures SMelt Arou
howing the Sund the Cold
300
400
479
Steady State CCap
5.5
g/L AZ-101
g/L AZ-101
g/L AZ-101
Cold-Cap withh Large Bubb
bles Bursting Through Glass

Figuree 5.6. Pictures of Glass Samima
mples with Qages are top-v
5.6
300 g/L
400 g/L
479 g/L
400 g/L
Quenched Colview, right sid
L AZ-101
L AZ-101
L AZ-101
L C-106/AY-
ld-Caps on Tode-images are
-102
op After LSMe side-view)
M Tests (left s
ide

The mslurry feekg/(m2d) iand then dsummariz
FigurC-106/AYDM1200
Figure 5.
melting rate, gd rate used wis obtained bydivided by thezes the steady
Tabl
C-1
e 5.7 shows thY-102 glass feand DM100 c
7. Melting RDM1200
given as glasswhen the stead
y multiplyinge inner cross -state feed rat
le 5.3. Steady
Melter Fee
AZ-101 300 gAZ-101 400 gAZ-101 479 g06/AY-102 4
he measured eed tested by calculated usi
Rates Measureand DM100 C
production rdy-state cold cg the steady-stsection area otes and result
y-State Feed R
ed S
g/L g/L g/L
400 g/L
melting ratesLSM in this s
ing Equations
ed from LSM Calculated by
5.7
rate per unit mcap melting wtate feed rate of the quartz cting melting r
Rate and Mel
Steady-State Rate, L/mi
4.43 4.23 4.17 3.32
from LSM testudy compars (1) and (2) i
Tests Compay Equations (1
melt surface arwas achieved.
(L/d) by the gcrucible (0.00rates.
lting Rate fro
Feed in
M
ests with threred with the pin Section 2.0
ared with Pre1) and (2)
area, was calcu The glass pr
glass yield (k0732 m2). Ta
om LSM Tests
Melting Rate, kg/(m2d)
262 333 393 261
ee AZ-101 glapredicted melt0.
dicted Meltin
ulated from throduction ratekg glass/L feeable 5.3
s
ass feeds and ting rates for
ng Rates for
he e in d)
one

5.8
Figure 5.7 shows that the melting rates of AZ-101 feeds increase with increasing glass yield as expected and as predicted from the scaled-melter test data. Figure 5.7 also shows the AZ-101 feeds process faster than the C-106/AY-102 feeds, which corresponds with the scaled-melter test data.
Comparison between the results from the LSM and scaled-melter tests is limited to relative evaluation only because of major differences in their construction and operation conditions. However, to obtain a rough estimate on the possible effect of melter surface area on the melting rate, the melting rate data from DM1200 (Table 2.1), DM100 (Table 2.2), and LSM (Table 5.3) tests with AZ-101 feeds were fitted to Equation (3):
(1 )m n pG B B G G Sr c r c y A (3)
where rG = glass production rate per unit melter surface area [kg/(m2d)] rB = bubbling rate per unit melter surface area [L/(m2min)] yG = glass yield per unit volume of slurry feed (g(glass)/L(feed)) AS = melter surface area (m2) cB and cG = coefficients dependent on melter feed m, n and p = coefficients independent of melter feed
Table 5.4 summarizes the results of two regression options. The Option 1 used the m, n, cB and cG values given in Table 2.3 and obtained the p value from least-square regression while the Option 2 calculated all five coefficients from regression. Table 5.4 shows that the two regression options make little difference in the model coefficients, especially for m, n, and p, and R2 values. Figure 5.9 is a plot of predicted versus measured production rate and Figure 5.10 shows predicted effects of melter surface area on the calculated glass production rate, based on the Option 1 regression. As mentioned earlier, Figure 5.10 illustrates a potential trend but is not for quantitative evaluation because of major differences in melter construction and operation conditions between the LSM and scaled melters.
Table 5.4. Model Coefficients for Glass Production Rate from DM1000/DM1200, DM100, and LSM Tests with AZ-101 Feeds
Coefficient Option 1(1) Option 2(2)
m 0.70 0.70
n 0.78 0.78
p 0.14 0.13
Bc 0.21 0.18
Gc 1.54 1.83
R2 0.947 0.952 (1)Same m, n, cB and cG values as in Table 2.3 were used and only p was obtained from regression (2)All five coefficients were obtained from regression

Figuree 5.8. Predict
Figure 5
ted Versus M
5.9. Predicted
Measured Glas
d Effect of Me
5.9
s Production
elter Surface A
Rate for Sim
Area on Glas
mulated AZ-10
ss Production
01 Melter Fee
Rate
eds

FigurLSM testsinitially anfor C-106glass feedshow any
e 5.10 and Fis performed innd then becam
6/AY-102 glasd is not known
correlation w
Figur
Figure
gure 5.11 dispn this study. me relatively ss feed. The rn. The glass a
with observed
re 5.10. Glas
e 5.11. Plenum
play the glassBoth the glasconstant in lareason for errand plenum te
d glass produc
ss Temperatur
m Temperatu
5.10
s and plenum ss and plenumater parts of thratic change oemperatures o
ction rate as sh
re versus Tim
ure Versus Tim
temperature m temperaturehe tests excepof plenum temobserved withhown in Figu
me after the St
me After the
as a function es in general spt for the plenmperature for hin the presen
ure 5.12.
tart of Feedin
Start of Feedi
of time for foslightly increanum temperatC-106/AY-1
nt tests did no
ng
ing
four ased ture 02
ot

Figure 55.12. Glass aand Plenum T
5.11
Temperatures Versus Glasss Production R
Rate


6.1
6.0 Conclusions
The melting rate data from extensive scaled-melter tests using simulated Hanford Site HLW performed for the WTP project have been compiled. Preliminary empirical model that expresses the melting rate as a function of bubbling rate and glass yield was developed from the compiled database for two waste glass feeds with most melter run data—AZ-101 and C-106/AY-102 simulated wastes. These two simulated waste melter feeds were also used for the LSM tests in this study so the melting rates determined from LSM test can be compared with those from scaled-melter tests.
The laboratory-scale melter that uses 3 or 4 in. diameter-fused quartz crucible was developed as a quick and inexpensive method to determine the processing rate of various waste glass slurry feeds. Tests with the initial setup were not successful to obtain the steady-state melting rate, although the preliminary test results provided information on the structure (morphology) of cold cap important for development of the mathematical cold-cap model. Based on these initial experiences, the following improvements were implemented:
Increased diameter of quartz crucible
New lift apparatus to allow fine control and precise monitoring of crucible height relative to the furnace
Redesign of slurry feeding system to use water-cooled line outside the feeding tube
Placement of thermocouple bundle for measurement of temperatures of the molten glass and plenum space.
The results of LSM runs with AZ-101 and C-106/AY-102 simulated HLW melter feeds performed after implementing the above improvements corresponded well with the production rates obtained from the scaled-melter tests. The present results suggest the LSM setup can be used to predict the appropriate trends in glass production rates for the development of new glass compositions or feed makeups that can increase the processing rate of the slurry feeds, although it will not give a quantitative data of large-scale tests. The improvements applied to the present setup will also make it much easier to investigate the formation of separated salt phase during cold-cap melting, which is valuable in developing glass formulations for the waste types of which loading is limited by separated salt formation.


7.1
7.0 References
Bickford DF, P Hrma, and BW Bowen, II. 1990. “Control of Radioactive Waste Glass Melters: II, Residence Time and Melt Rate Limitations.” J. Amer. Ceram. Soc. 73:2903.
Chapman C. 2004. Investigation of Glass Bubbling and Increased Production Rate. REP-RPP-069, Rev. 0, Duratek, Richland, Washington.
Darab JG, DD Graham, BD MacIsaac, RL Russell, DK Peeler, HD Smith, and JD Vienna. 2001. Sulfur Partitioning During Vitrification of INEEL Sodium Bearing Waste: Status Report. PNNL-13588, Pacific Northwest National Laboratory, Richland, Washington.
Henager SH, P Hrma, KJ Swearingen, MJ Schweiger, J Marcial, and NE TeGrotenhuis. 2011. “Conversion of Batch to Molten Glass, I: Volume Expansion,” Journal of Non-crystalline Solids, 357(3): 829-835.
Hrma P. 1990. “Melting of Foaming Batches: Nuclear Waste Glass.” Glastech. Ber. 63K:360.
Hrma P, J Matyáš, and D-S Kim. 2002. “The Chemistry and Physics of Melter Cold Cap.” In: 9th Biennial Int. Conf. on Nucl. and Hazardous Waste Management, Spectrum '02, American Nuclear Society, CD-ROM.
Hrma PR, CJ Humrickhouse, JA Moody, RM Tate, MJ Schweiger, VV Mantay, TT Rainsdon, NE TeGrotenhuis, BM Arrigoni, J Marcial, CP Rodriguez, BH Tincher. 2009. Effect of Melter-Feed-Makeup on Vitrification Process. PNNL-18374, Pacific Northwest National Laboratory, Richland, Washington.
Hrma PR, MJ Schweiger, CJ Humrickhouse, JA Moody, RM Tate, TT Rainsdon, NE TeGrotenhuis, BM Arrigoni, J Marcial, CP Rodriguez, and BH Tincher. 2010. “Effect of glass-batch makeup on the melting process.” Ceramics-Silikaty, 54(3):193-211.
Hrma P, J Marcial, KJ Swearingen, SH Henager, MJ Schweiger, and NE TeGrotenhuis. 2011a. “Conversion of Batch to Molten Glass, II: Dissolution of Quartz Particles.” Journal of Non-crystalline Solids 357(3):820-828.
Hrma P and J Marcial. 2011b. “Dissolution Retardation of Solid Silica During Glass-Batch Melting.” Journal of Non-crystalline Solids, 357(15):2954-2959.
Kim D, WC Buchmiller, MJ Schweiger, JD Vienna, DE Day, CW Kim, D Zhu, TE Day, T Neidt, DK Peeler, TB Edwards, IA Reamer, and RJ Workman. 2003. Iron Phosphate Glass as an Alternative Waste-Form for Hanford LAW. PNNL-14251, Pacific Northwest National Laboratory, Richland, Washington.
Matlack KS, WK Kot, F Perez-Cardenas, and IL Pegg. 2000. Determination of Processing Rate of RPP-WTP HLW Simulants using a DuraMelter™ 1000 Vitrification System. VSL-00R2590-2, Rev. 0, Vitreous State Laboratory, The Catholic University of America, Washington, D.C.
Matlack KS, M Brandys, and IL Pegg. 2001. Start-Up and Commissioning Tests on the DM1200 HLW Pilot Melter System Using AZ-101 Waste Simulants. VSL-01R0100-2, Rev. 0, Vitreous State Laboratory, The Catholic University of America, Washington, D.C.

7.2
Matlack KS, WK Kot, T Bardakci, W Gong, N D’Angelo, TR Schatz, and IL Pegg. 2003a. Tests on the DuraMelter 1200 HLW Pilot Melter System Using AZ-101 Waste Simulants. VSL-02R0100-2, Rev. 1, Vitreous State Laboratory, The Catholic University of America, Washington, D.C.
Matlack KS, W Gong, T Bardakci, N D’Angelo, W Kot and IL Pegg. 2003b. Integrated DM1200 Melter Testing of HLW C-106/AY-102 Composition Using Bubblers.” VSL-03R3800-1, Rev. 0, Vitreous State Laboratory, The Catholic University of America, Washington, D.C.
Matlack KS, WK Kot, and IL Pegg. 2003c. Melter Tests with AZ-101 HLW Simulant Using a DuraMelter 100 Vitrification System. VSL-01R10N0-1, Rev. 1, Vitreous State Laboratory, The Catholic University of America, Washington, D.C.
Matlack KS, W Gong, T Bardakci, N D’Angelo, WK Kot, and IL Pegg. 2004a. DM1200 Tests with AZ-101 HLW Simulants. VSL-03R3800-4, Rev. 0, Vitreous State Laboratory, The Catholic University of America, Washington, D.C.
Matlack KS, W Gong, T Bardakci, N D’Angelo, W Lutze, PM Bizot, RA Callow, M Brandys, WK Kot, and IL Pegg. 2004b. Integrated DM1200 Melter Testing of Redox Effects Using HLW AZ-101 and C-106/AY-102 Simulants. VSL-04R4800-1, Rev. 0, Vitreous State Laboratory, The Catholic University of America, Washington, D.C.
Matlack KS, W Gong, T Bardakci, N D’Angelo, W Lutze, RA Callow, M Brandys, WK Kot, and IL Pegg. 2004c. Integrated DM1200 Melter Testing of Bubbler Configurations Using HLW AZ-101 Simulants. VSL-04R4800-4, Rev. 0, Vitreous State Laboratory, The Catholic University of America, Washington, D.C.
Matlack KS, W Gong, T Bardakci, N D’Angelo, M Brandys, WK Kot, and IL Pegg. 2005a. Integrated DM1200 Melter Testing Using AZ-102 and C-106/AY-102 HLW Simulants: HLW Simulant Verification. VSL-05R5800-1, Rev. 0, Vitreous State Laboratory, The Catholic University of America, Washington, D.C.
Matlack KS, W Gong, T Bardakci, N D’Angelo, M Brandys, WK Kot, and IL Pegg. 2005b. Regulatory Off-Gas Emissions Testing on the DM1200 Melter System Using HLW and LAW Simulants. VSL-05R5830-1, Rev. 0, Vitreous State Laboratory, The Catholic University of America, Washington, D.C.
Matlack KS, W Gong, and IL Pegg. 2005c. DuraMelter 100 HLW Simulant Validation Tests with C-106/AY-102 Feeds. VSL-05R5710-1, Vitreous State Laboratory, The Catholic University of America, Washington, D.C.
Matlack KS, G Diener, T Bardakci, and IL Pegg. 2006. Summary of DM1200 Operation at VSL. VSL-06R6710-2, Rev. 0, Vitreous State Laboratory, The Catholic University of America, Washington, D.C.
Matlack KS, WK Kot, W Gong, and IL Pegg. 2007. Small Scale Melter Testing of HLW Algorithm Glasses: Matrix 1 Tests. VSL-07R1220-1, Vitreous State Laboratory, The Catholic University of America, Washington, D.C.
Perez JM, CC Chapman, RK Mohr, KS Matlack, and IL Pegg. 2005. “Development and Demonstration of an Air Bubbler Design to Meet High-Level Waste Melter Production rate Requirements of the Hanford Waste Treatment and Immobilization Plant.” In: Proceedings for ICEM’05: The 10th International

7.3
Conference on Environmental Remediation and Radioactive Waste Management, September 4–8, 2005, Glasgow, Scotland.
Pokorny R and PR Hrma. 2010. Mathematical Model of Cold Cap-Preliminary One-Dimensional Model Development. PNNL-20278 (EMSP-RPT-007), Pacific Northwest National Laboratory, Richland, Washington.
Riley BJ, JV Crum, WC Buchmiller, BT Rieck, MJ Schweiger, and JD Vienna. 2009. “Initial Laboratory-Scale Melter Test Results for Combined Fission Product Waste, Advanced Fuel Cycle Initiative.” AFCI-WAST-PMO-MI-DV-2009-000184, Pacific Northwest National Laboratory, Richland, Washington.
Schweiger MJ, PR Hrma, CJ Humrickhouse, J Marcial, BJ Riley, and NE TeGrotenhuis. 2009. “Cluster Formation of Silica Particles in Glass Batches During Melting.” Journal of Non-crystalline Solids 356 (25-27):1359-1367.
Vienna JD, WC Buchmiller, JV Crum, DD Graham, D-S. Kim, BD MacIsaac, MJ Schweiger, DK Peeler, TB Edwards, IA Reamer, and RJ Workman. 2002. Glass Formulation Development for INEEL Sodium-Bearing Waste. PNNL-14050, Pacific Northwest National Laboratory, Richland, Washington.


PNNL-21005 EMSP-RPT-012
Distribution*
No. of No. of Copies Copies
Distr.1
2 U.S. Department of Energy Office of Environmental Management SP Schneider GL Smith 5 U.S. Department of Energy Office of River Protection TW Fletcher RA Gilbert AA Kruger BM Mauss SH Pfaff 3 Savannah River National Laboratory F Johnson J Marra DK Peeler 3 Vitreous State Laboratory WK Kot KS Matlack IL Pegg 2 Washington River Protection Solutions WG Ramsey LE Thompson 4 Waste Treatment and Immobilization Plant SM Barnes CC Chapman JL Nelson LL Petkus *All distribution will be made electronically.
23 Local Distribution Pacific Northwest National Laboratory PR Bredt WC Buchmiller J Chun JV Crum PR Hrma A Goel BR Johnson GB Josephson JB Lang W Lepry DS Kim J Matyas JS McCloy RA Peterson LM Peurrung BJ Riley CP Rodriguez JV Ryan MJ Schweiger GJ Sevigny D Skorski JD Vienna JH Westsik, Jr.
