l105/205 – phonetics handout 2 scarborough sept. … 2... · fourier synthesis: sine waves can be...
TRANSCRIPT

L105/205 – Phonetics Scarborough
Handout 2Sept. 29, 2005
reading: Johnson Ch.1 (today), Ch.2.1-2.2 (Tues); optional: Ladefoged Ch. 9: 136-148 (Tues)
Introduction to Acoustics
1. Sound – Fluctuations in pressure in a medium (generally air) which impinge on the eardrum to produce the sensation of sound.
2. Propagation of sound
- soundwave: traveling pressure fluctuation - movement at the sound source produces pressure fluctuations that move through
space as a wave
(from Ladefoged, 1996)
- The medium through which the wave travels may experience some local oscillations as the wave passes, but the particles in the medium do not travel with the wave.
o picture “the wave” at a stadium

compression
rarefaction
(from Fucci & Lass, 1999) 3. Representing soundwaves
- Pressure fluctuations at a given location can be represented as a plot of pressure against time.
o e.g., at the eardrum or at a microphone
time
air
pres
sure
- In speech, air in the vocal tract is set in vibration by the action of the vocal folds. As
the vocal folds open and close, pulses of air from the lungs act like sharp taps on air molecules in the vocal tract.
4. Periodic sounds
- have a pattern that repeats at regular intervals→ cycles 5. Simple periodic waves = sine waves
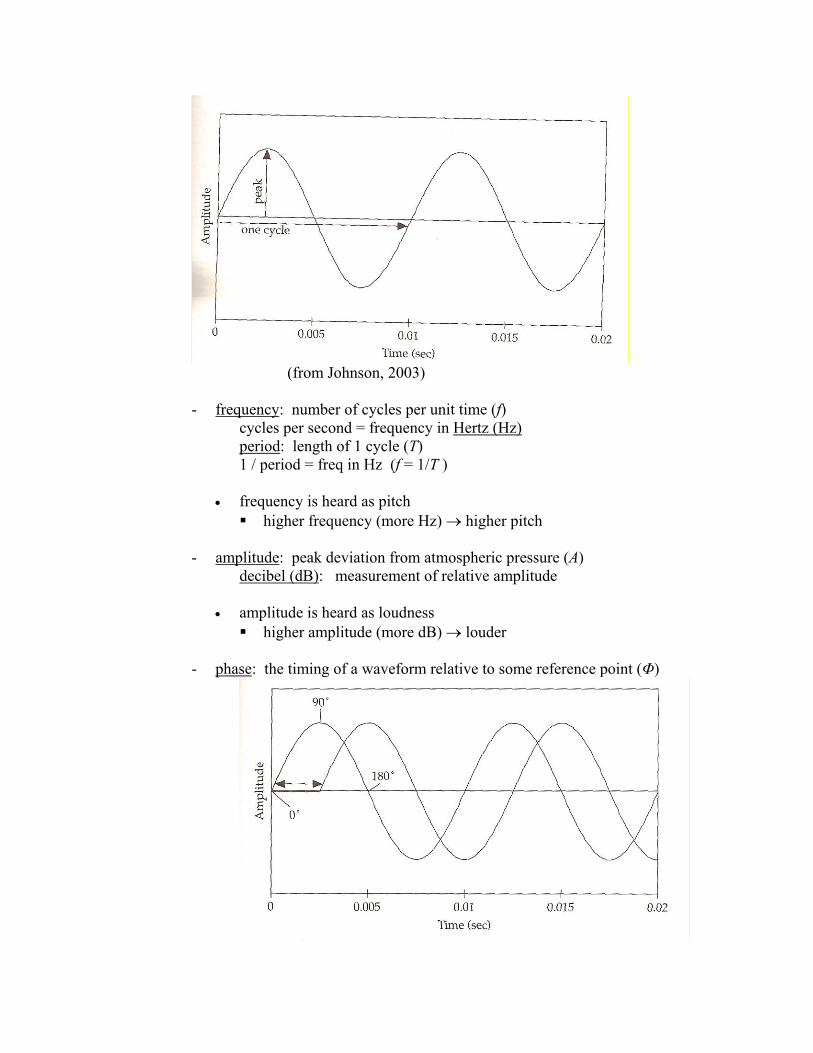
(from Johnson, 2003) - frequency: number of cycles per unit time (f)
cycles per second = frequency in Hertz (Hz) period: length of 1 cycle (T) 1 / period = freq in Hz (f = 1/T )
• frequency is heard as pitch higher frequency (more Hz) → higher pitch
- amplitude: peak deviation from atmospheric pressure (A)
decibel (dB): measurement of relative amplitude
• amplitude is heard as loudness higher amplitude (more dB) → louder
- phase: the timing of a waveform relative to some reference point (Φ)

(from Johnson, 2003)
6. Complex periodic waves are composed of multiple sine waves Fourier’s Theorem: complex periodic waves (like speech) are composed of the sum of sine waves of varying frequencies, amplitudes, and phases
Fourier synthesis: sine waves can be added to generate a complex wave Fourier analysis: a complex wave can be decomposed into its component sine waves
=
(from Ladefoged, 1996)
- Fundamental frequency (F0): frequency of the largest pattern in a complex wave
= greatest common denominator of frequencies of component waves = 100 Hz for the above example
(from Ladefoged, 1996)
- both of these waves are composed of the following sine waves: Frequency Amplitude 100 Hz 200 Hz 300 Hz
3 1 2
- This information can be represented graphically in a power spectrum (an
amplitude by frequency plot of the sinusoidal wave components of a complex wave):
(from Ladefoged, 1996)
- Note that the power spectrum is the same for the left and right complex waves above (i.e., the phase difference between them is not represented). It turns out that phase differences are relatively unimportant in speech perception, so the most linguistically important aspects of the complex waves can still be specified this way (i.e., with just frequency and amplitude).
o You can experiment with sine wave addition on the web:
http://www.udel.edu/idsardi/sinewave/sinewave.html
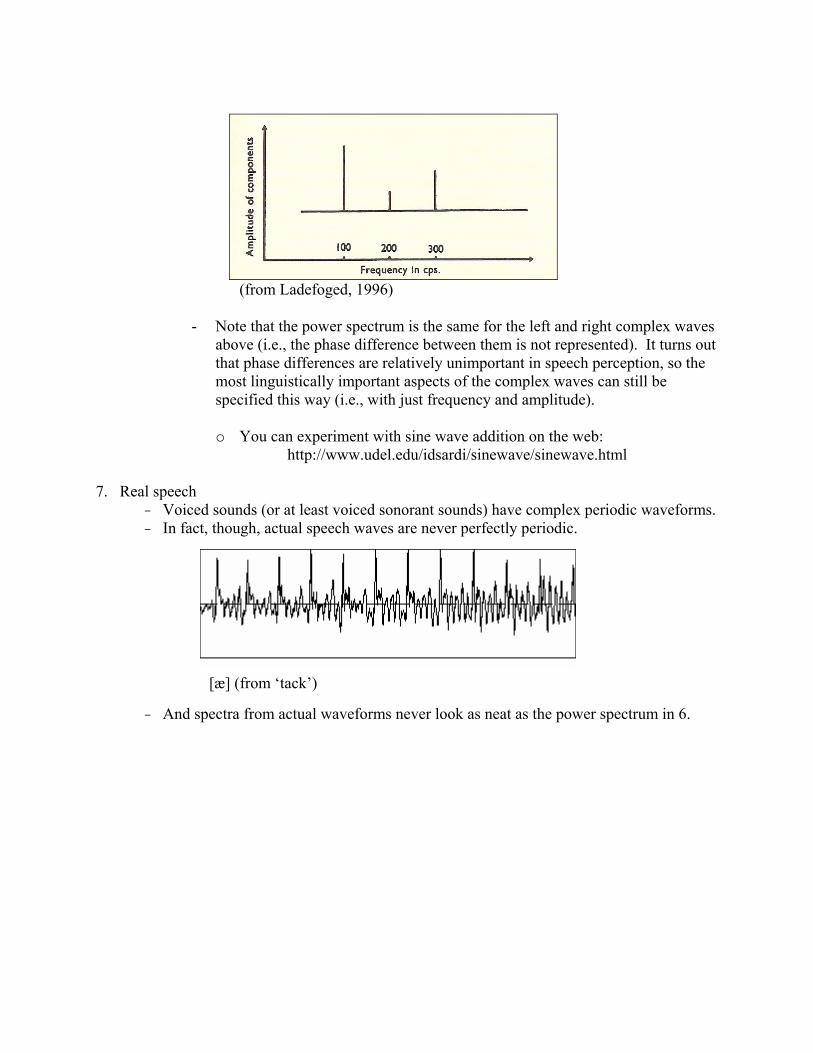
7. Real speech - Voiced sounds (or at least voiced sonorant sounds) have complex periodic waveforms. - In fact, though, actual speech waves are never perfectly periodic.
- And spectra from actual waveforms never look as neat as the power spectrum in 6.
[æ] (from ‘tack’)

8. Aperiodic sounds – noise - have a pattern that does not repeat
• white noise – random variation of frequency and amplitude - very similar to fricatives and stop bursts
(from Johnson, 2003) • transient – sudden, single pressure fluctuation (spike)
- e.g., pulse like a knock

(from Johnson, 2003) 9. What can be seen in a waveform?
pat pad bad spat
10. What can be seen in a spectrum?
- A spectrum represents important properties of a segment during a very short interval of time, but we are often interested in seeing how the spectrum of a sound changes over time.

(from Pickett, 1999)
11. Spectrograms
(from Pickett, 1999)
- A spectrogram represents spectral properties over time. o frequency is on the y-axis o time is on the x-axis o intensity is represented by darkness

Figure 8.16 Wide-band (upper part of the figure) and narrow-band (lower part) spectrogram of the question Is Pat sad, or mad? The 5th, 10th and 15th harmonics have been marked by white squares in two of the vowels. (from Ladefoged, 2001)
- wide-band spectrogram
o analyses over short time windows → good time resolution, smearing in frequency
o vertical lines represent vibrations of the vocal folds; closeness of lines indicates pitch
- narrow-band spectrogram o analyses over long time windows → bad time resolution, good frequency
resolution o horizontal lines are individual harmonics; they sort of track pitch
12. Spectrogram reading: English vowels
- vowels have quite a bit of energy concentrated in formants - first two formants (F1 & F2) are mostly sufficient to distinguish vowel quality

Figure 8.17 A spectrogram of the words heed, hid, head, had, hod, hawed, hood, who’d as spoken by a female speaker of American English. The locations of the first three formants are shown be arrows. (from Ladefoged, 2001) 13. Review of types of displays: • waveform • spectrum • spectrogram
(freq. is implicit in period) (time is not shown—snapshot) (ampl. shown by darkness)
time.
freq.
freq.
ampl.
time
ampl.