la training lab workbook pt1-2019apr15
TRANSCRIPT

LiveAction Training Lab Workbook Pt. 1

2 © Copyright 2019, LiveAction, Inc.
© Copyright 2019, LiveAction, Inc. All rights reserved. This product and related documentation are protected by copyright and distribution under licensing restricting their use, copy and distribution. No part of this document may be used or reproduced in any form or by any means, or stored in a database or retrieval system, without prior written permission of the publisher except in the case of brief quotations embodied in critical articles and reviews. Making copies of any part of this Training Material for any other purpose is in violation of United States copyright laws. While every precaution has been taken in the preparation of this document, LiveAction assumes no responsibility for errors or omissions. This document and features described herein are subject to change without notice. This LiveAction Training Material may not be sold by any company other than LiveAction without prior written permission. Neither LiveAction nor any authorized distributor or reseller shall be liable to the purchaser or any other person or entity with respect to any liability, loss, or damage caused or alleged to have been caused directly or indirectly by this material. Trademarks: LiveAction, its marks and logos, are registered trademarks of LiveAction, Inc. Other product and company names mentioned herein may be trademarks and/or registered trademarks of their respective companies. Specifications and descriptions subject to change without notice. All other products or services mentioned herein are trademarks or registered trademarks of their respective owners. Use of a term in this book should not be regarded as affecting the validity of any trademark or service mark. 2019Apr15

Table of Contents Lab 0: Setup and Get Connected .......................................................................................... 5 Lab 0.7: Connect to the Lab Network ....................................................................................... 6 Lab 0.8: Connecting to YOUR Training Pod ............................................................................ 8 Lab 0.9: Install the LiveNX Client ............................................................................................. 9 Lab 1: The LiveNX Web UI ................................................................................................... 10 Lab 1.1: Explore the Web UI .................................................................................................. 11 Lab 1.2: Create a Custom Dashboard .................................................................................... 15 Lab 1.3: Pre-Configured Stories ............................................................................................. 17 Lab 1.4: WebUI Reports ......................................................................................................... 18 Lab 1.5: Enable / Customize Alerts ........................................................................................ 20 Lab 1.6: Add a User Account ................................................................................................. 22 Lab 2: The LiveNX Client ..................................................................................................... 23 Lab 2.1: Launch the LiveNX Client ......................................................................................... 24 Lab 2.2: Explore the LiveNX Client ........................................................................................ 27 Lab 3: Traffic Flows .............................................................................................................. 29 Lab 3.1: Discover Flows ......................................................................................................... 30 Lab 3.2: Discover Specific Flows ........................................................................................... 32 Lab 3.3: Examine Specific Traffic ........................................................................................... 33 Lab 3.4: Troubleshoot Issues ................................................................................................. 34 Lab 4: Filtering, Identifying, Marking .................................................................................. 35 Lab 4.1: Creating Custom Filters ............................................................................................ 36 Lab 4.2: ACL Creation ............................................................................................................ 40 Lab 5: Configuring Devices ................................................................................................. 47 Lab 5.1: Add Device ............................................................................................................... 48 Lab 5.2: Manage & Configure Devices ................................................................................... 51 Lab 5.3: Configure Flow on Devices ...................................................................................... 55 Lab 5.4: Delete Unused Interfaces ......................................................................................... 58 Lab 5.5: Merge Clouds in Topology ....................................................................................... 60 Lab 6: Making the Topology Work ...................................................................................... 63 Lab 6.1: Setting Device Semantics ........................................................................................ 64 Lab 6.2: Adding Devices to Groups ........................................................................................ 68 Lab 6.3: Creating Network Objects ........................................................................................ 71 Lab 7: Console Dashboard & Reports ................................................................................ 75 Lab 7.1: The Client Dashboard .............................................................................................. 76 Lab 7.2: Viewing Console Reports ......................................................................................... 79 Lab 7.3: Create a Custom Report .......................................................................................... 82 Lab 8: QoS ............................................................................................................................ 83 Lab 8.1: QoS Marking Policy .................................................................................................. 84 Lab 8.2: QoS Queueing Policy ............................................................................................... 93 Lab 8.3: QoS Verification ..................................................................................................... 103 Lab A: Appendix ................................................................................................................. 109 Lab A.1: Add Device ............................................................................................................. 110 Lab A.2: Client Device Discovery ......................................................................................... 116 Lab A.3: Export/Import Device Configuration ....................................................................... 124 Lab A.4: Saving Server Configurations ................................................................................ 127 Lab A.5: Connect via Remote Desktop Connection ............................................................. 129

4 © Copyright 2019, LiveAction, Inc.
IMPORTANT INFORMATION – Please Read! The step-by-step Labs in this Workbook have been written specifically for the LiveAction Training Student Pod, documented herein. All “Pods” have been pre-configured with the appropriate software and generated traffic to successfully perform these labs. Pay attention to any Notes presented as:
Note: This is a note example which gives additional information to the specific context.
The Diagrams, or screen shots, throughout this Workbook are examples for demonstration purposes and may not reflect the appropriate parameters for the classroom and/or your specific subnet. Unless specifically directed to do so, do not attempt to match the settings displayed in the screen shots to your configuration. Traffic collected by your assigned Pod may not be synchronized with other Student Pods, and in some cases… due to specific application traffic timing, may not display the exact result specified in the Labs. The main intent is to know HOW to access the information… not to attain specific lab results. Throughout this document italics, bold fonts, and words in CAPS, are used to place emphasis on specific procedures or results.

LiveAction Lab Workbook Pt. 1
5
Lab 0: Setup and Get Connected

6 © Copyright 2019, LiveAction, Inc.
Lab 0.7: Connect to the Lab Network For this class, each attendee or Student will connect to and manage their own LiveNX installation. In this lab you will connect to the classroom lab environment. In some locations you may first be asked to connect your laptop to the Internet. Your instructor will assign a dedicated environment or “Pod” to each Student, and may provide you with a handout containing connectivity information specific to your Pod. Each Pod has the LiveNX Server and Client pre-installed, with some initial configuration already performed. Each Student will manage: Local: 1 x PC Workstation to be used as a Management PC (YOUR Laptop) 1 x Installed LiveNX Client 1 x Browser Remote Student Pod 1 x Windows Workstation accessed via RDC (optional) with an installed LiveNX Client and Browser 1 x LiveNX OVA Linux install
1 LiveNX Server 1 LiveNX Node (installed on LiveNX Server)
DIAGRAM
In the diagram above your workstation is connected over the LAN or WAN to YOUR assigned Training Pod resources.
Note: Make sure to consult the Infrastructure Diagram, as well as specific classroom instructions for names, IP addresses, and other parameters. The screen shots in this Lab Workbook are examples which may NOT reflect the appropriate parameters for the classroom and/or your specific subnet.

LiveAction Lab Workbook Pt. 1
7
Each student is provided with login credentials to our Training Lab Website, which includes connection information as illustrated below. Your Instructor may provide additional class-specific addressing and credentials. You may wish to Bookmark this Web Page, or Make a written note of this information for later reference. DIAGRAM
Lab Steps:
1. Connect your workstation to the Management Network with an Ethernet cable (or, if available, connect to the Wireless network per the instructions provided by your instructor).
2. Verify connectivity to the Internet by opening a browser to www.liveaction.com.
Note: Make sure to consult the Infrastructure Diagram and worksheets, as well as specific classroom instructions for names, IP addresses, and other parameters. The screen shots in this Lab Workbook are examples which may not reflect the appropriate parameters for the classroom and/or your specific subnet.
8 © Copyright 2019, LiveAction, Inc.
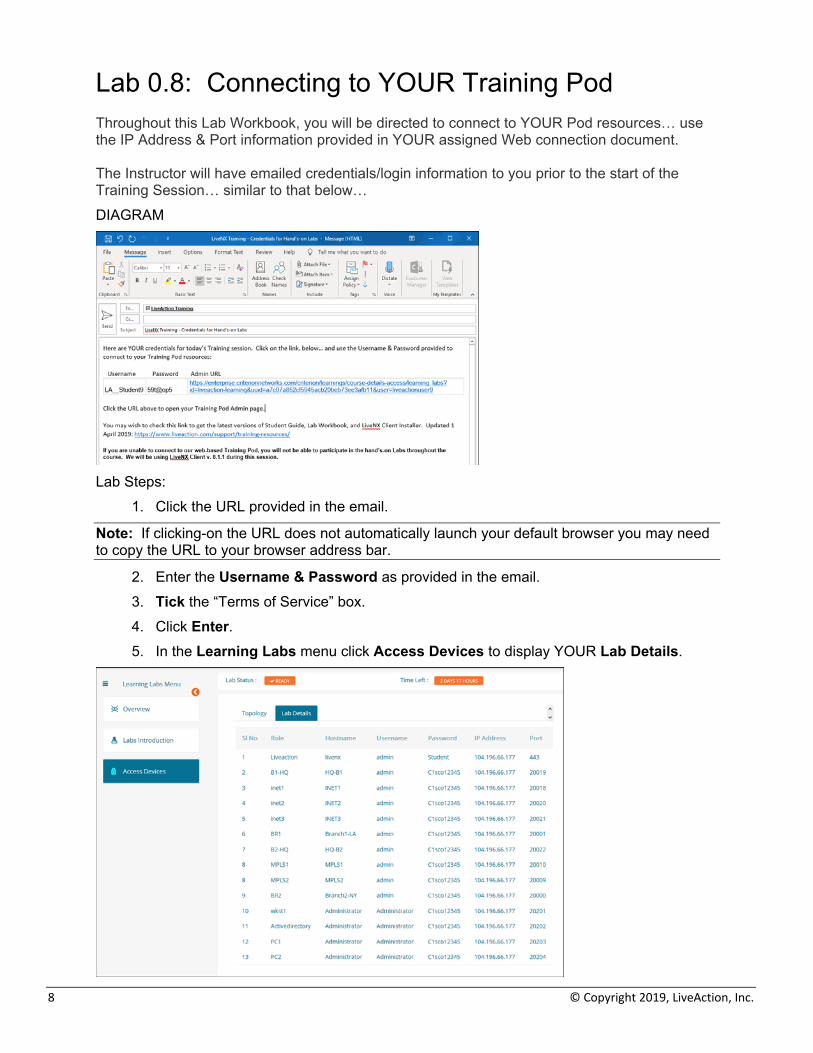
Lab 0.8: Connecting to YOUR Training Pod Throughout this Lab Workbook, you will be directed to connect to YOUR Pod resources… use the IP Address & Port information provided in YOUR assigned Web connection document. The Instructor will have emailed credentials/login information to you prior to the start of the Training Session… similar to that below… DIAGRAM
Lab Steps:
1. Click the URL provided in the email.
Note: If clicking-on the URL does not automatically launch your default browser you may need to copy the URL to your browser address bar.
2. Enter the Username & Password as provided in the email. 3. Tick the “Terms of Service” box. 4. Click Enter. 5. In the Learning Labs menu click Access Devices to display YOUR Lab Details.

LiveAction Lab Workbook Pt. 1
9
Lab 0.9: Install the LiveNX Client A direct connection from the LiveNX Client installed on your workstation is the most efficient method to connect with the Engineering Console. You’ll install the LiveNX Client now so it is ready for use in future labs.
Note: The Instructor will provide version information prior to the training session (via facilitation email). Make sure to download & install the appropriate version of the LiveNX Client as directed.
To install the LiveNX Client:
1. Download the appropriate Client version from the LiveAction Web Pages, or from the Training Resources page.
a. http://www.liveaction.com/download/links/ b. http://www.liveaction.com/support/training-resources/
2. Launch the installer. 3. Accept all the defaults, as appropriate.
Note: At this point we will NOT login to the LiveNX Server… instructions for connecting & login are provided in a subsequent Lab.
If you DO decide to launch the Client now… you may be presented with a dialog to enter the LiveNX Server IP Address, Use the addressing from your Lab Details web page. DIAGRAM

10 © Copyright 2019, LiveAction, Inc.
Lab 1: The LiveNX Web UI
LiveAction Lab Workbook Pt. 1
11
Lab 1.1: Explore the Web UI The LiveNX WebUi provides an easy, convenient way to view the data collected by liveNX. You may create custom Dashboards to give visibility across your entire Enterprise, perform LiveNX configuration, view & troubleshoot topology & devices, as well as view/run/schedule reports. Dashboard settings are saved per-user login, but may be initially based-upon the admin users’ setup.
Note: The displays in these UI labs will vary, depending upon how long your Pod has been running, as well as the variety of traffic. These labs are meant to illustrate how to get at the information… results are not important. Diagrams are for illustration purposes and may not reflect the data you may view on your Training Pod.
In this, and all subsequent Labs, utilize the addressing <ipaddress> and TCP ports <port> provided on the Access Devices web page. In this Lab you will view the different features of the LiveNX WebUI. Lab Steps:
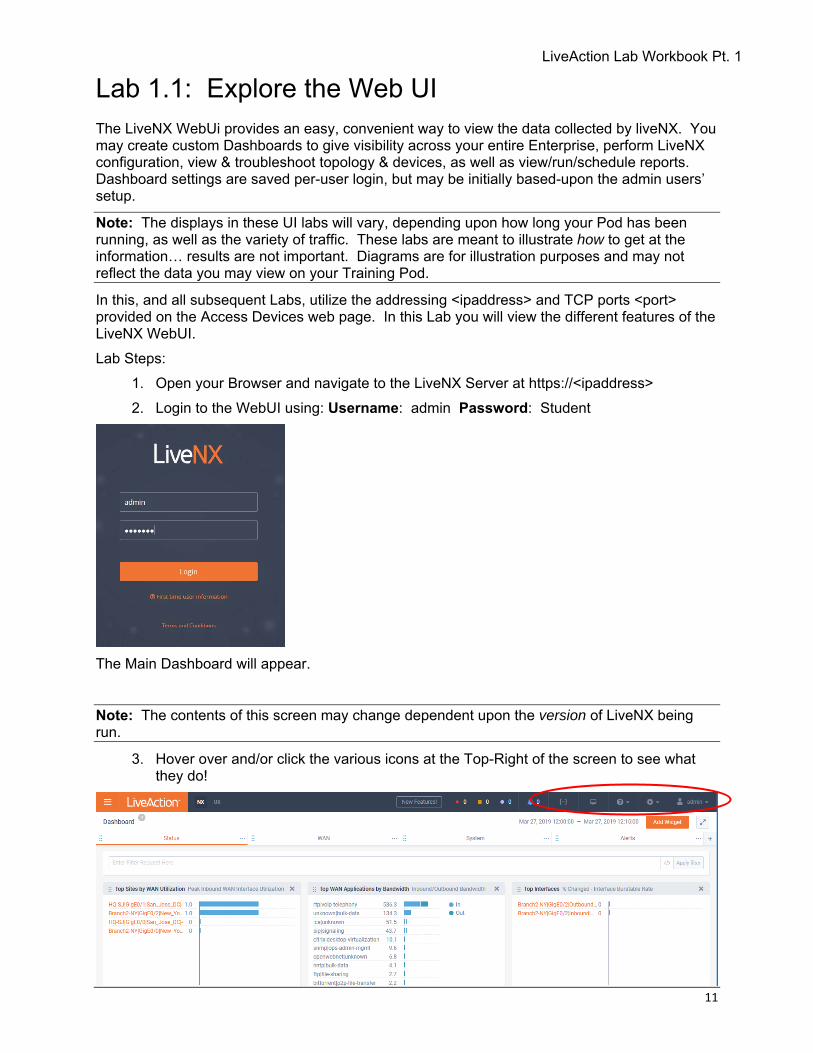
1. Open your Browser and navigate to the LiveNX Server at https://<ipaddress> 2. Login to the WebUI using: Username: admin Password: Student
The Main Dashboard will appear.
Note: The contents of this screen may change dependent upon the version of LiveNX being run.
3. Hover over and/or click the various icons at the Top-Right of the screen to see what they do!

12 © Copyright 2019, LiveAction, Inc.
4. Click the Menu icon at the Top-Left and explore the menus.
5. Select Sites.
Note that the sites, and their associated statistics, are listed in columnar format.
Note: Detailed site information is specified in the Device Semantics Lab.
6. Note; Status, Utilization, Drops, Errors, etc… 7. Toggle the Auto Update to ON. 8. Change the display to Hour. 9. Click on the link to New_York to see additional device info.
Anytime you wish to return to a prior level, or the WebUI home, you can click the Menu icon. 10. Select Topology > Geo Topology

LiveAction Lab Workbook Pt. 1
13
Note: Anytime the Geo Topology is launched it defaults to filter for Status: Critical Alerts.
11. Delete Critical alerts by hovering over Critical button & click the “x”, then click Apply
12. Click on a Site to see additional information & links.

14 © Copyright 2019, LiveAction, Inc.
13. Click on the Menu button in the upper left, then select Configure at the bottom. 14. Select Device Management.
See that you can add devices, and run Device Discovery, from the WebUI. We’ll run Discover Devices in a subsequent Lab.

LiveAction Lab Workbook Pt. 1
15
Lab 1.2: Create a Custom Dashboard
Note: The displays in these UI labs will vary, depending upon how long your Pod has been running, as well as the variety of traffic. These labs are meant to illustrate how to get at the information… results are not important. Diagrams are for illustration purposes and may not reflect the data you may view on the Training Pod.
In this Lab you will Create and Modify your own Custom Dashboard.. Lab Steps:
1. From the Main>Dashboard click on the + icon to create a new Dashboard.
2. Click Custom Dashboard.
Note: The contents of this screen may change dependent upon the version of LiveNX being run.
16 © Copyright 2019, LiveAction, Inc.
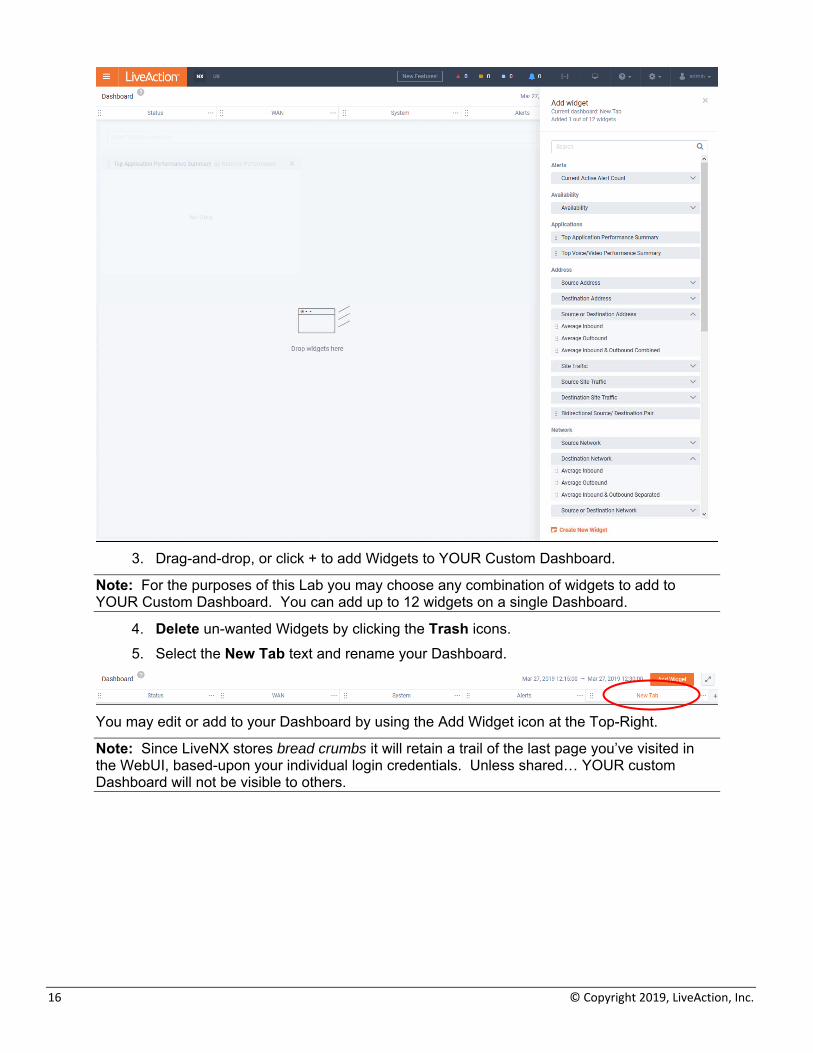
3. Drag-and-drop, or click + to add Widgets to YOUR Custom Dashboard.
Note: For the purposes of this Lab you may choose any combination of widgets to add to YOUR Custom Dashboard. You can add up to 12 widgets on a single Dashboard.
4. Delete un-wanted Widgets by clicking the Trash icons. 5. Select the New Tab text and rename your Dashboard.
You may edit or add to your Dashboard by using the Add Widget icon at the Top-Right.
Note: Since LiveNX stores bread crumbs it will retain a trail of the last page you’ve visited in the WebUI, based-upon your individual login credentials. Unless shared… YOUR custom Dashboard will not be visible to others.

LiveAction Lab Workbook Pt. 1
17
Lab 1.3: Pre-Configured Stories The LiveNX WebUI has a number of pre-configured walk-thrus, or Stories, built-in. These Stories may help you easily find specific workflows and statistical information regarding your monitored devices. Lab Steps:
1. Click the Menu icon. 2. Select Stories, and Site-to-Site Analysis.
Note: The displays in these UI labs will vary, depending upon how long your Pod has been running, as well as the variety of traffic. These labs are meant to illustrate how to get at the information… results are not important. Diagrams are for illustration purposes and may not reflect the data you may view on the Training Pod.
3. Select Inbound. DIAGRAM
4. Hover-over for Utilization info, or Select an area of the chart to display a Sankey
Flow Diagram.
View the other pre-configured Stories to discover how they may help you with Capacity Planning, Inventory, and Network Management.

18 © Copyright 2019, LiveAction, Inc.
Lab 1.4: WebUI Reports You may access any of the default reports in the WebUI, as well as utilize as a template any Custom Reports created in the LiveNX Client. Lab Steps:
1. Click the Menu icon. 2. Select Reports, and View Reports.
3. From the Top Reports lower section, select Application
4. Select Options;
a. Name: My Application Report b. Time Range: Last Hour c. Direction: Inbound and Outbound Combined d. Bin Duration: 1 Minute
5. Click Execute.
LiveAction Lab Workbook Pt. 1
19
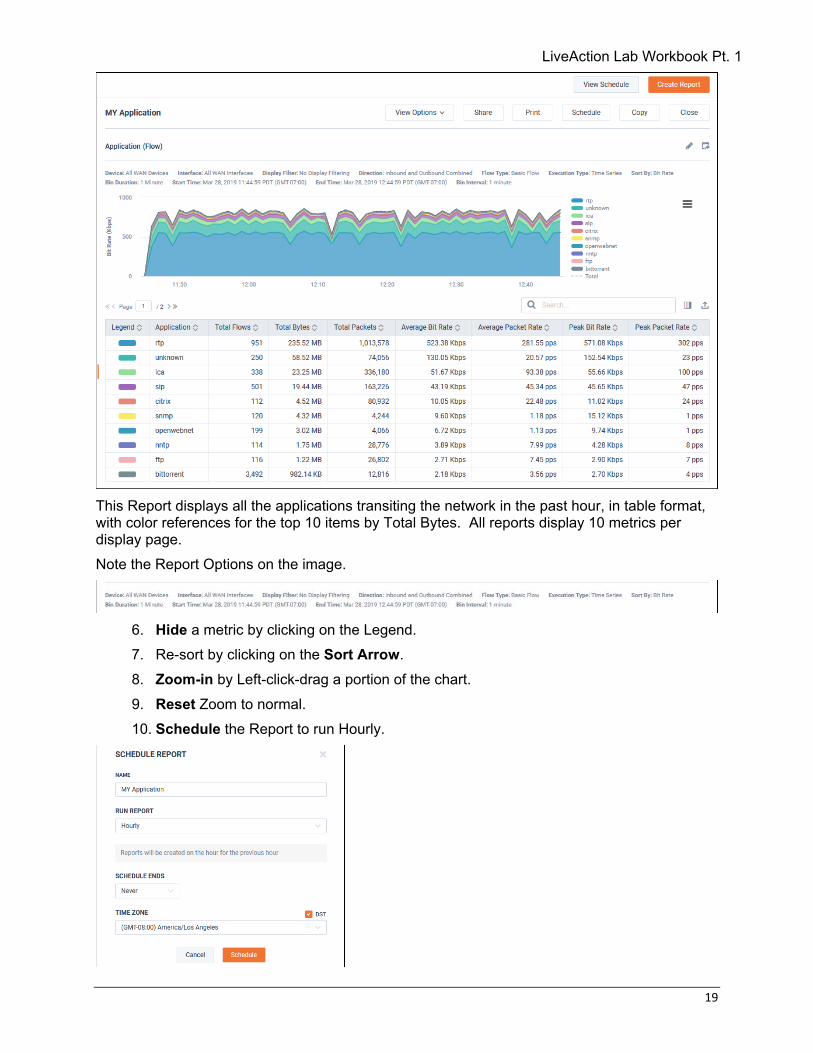
This Report displays all the applications transiting the network in the past hour, in table format, with color references for the top 10 items by Total Bytes. All reports display 10 metrics per display page. Note the Report Options on the image.
6. Hide a metric by clicking on the Legend. 7. Re-sort by clicking on the Sort Arrow. 8. Zoom-in by Left-click-drag a portion of the chart. 9. Reset Zoom to normal. 10. Schedule the Report to run Hourly.
20 © Copyright 2019, LiveAction, Inc.
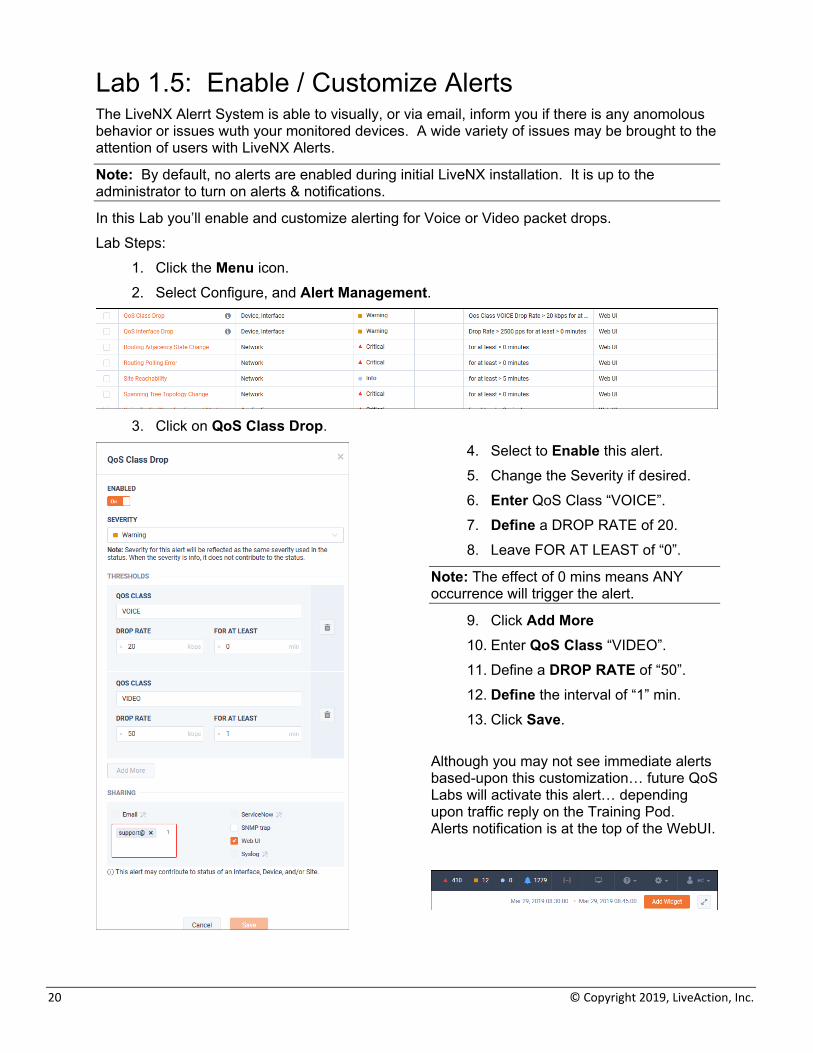
Lab 1.5: Enable / Customize Alerts The LiveNX Alerrt System is able to visually, or via email, inform you if there is any anomolous behavior or issues wuth your monitored devices. A wide variety of issues may be brought to the attention of users with LiveNX Alerts.
Note: By default, no alerts are enabled during initial LiveNX installation. It is up to the administrator to turn on alerts & notifications.
In this Lab you’ll enable and customize alerting for Voice or Video packet drops. Lab Steps:
1. Click the Menu icon. 2. Select Configure, and Alert Management.
3. Click on QoS Class Drop.
4. Select to Enable this alert. 5. Change the Severity if desired. 6. Enter QoS Class “VOICE”. 7. Define a DROP RATE of 20. 8. Leave FOR AT LEAST of “0”.
Note: The effect of 0 mins means ANY occurrence will trigger the alert.
9. Click Add More 10. Enter QoS Class “VIDEO”. 11. Define a DROP RATE of “50”. 12. Define the interval of “1” min. 13. Click Save.
Although you may not see immediate alerts based-upon this customization… future QoS Labs will activate this alert… depending upon traffic reply on the Training Pod. Alerts notification is at the top of the WebUI.

LiveAction Lab Workbook Pt. 1
21
14. Enable ALL alerts (This is for use in a later Lab).

22 © Copyright 2019, LiveAction, Inc.
Lab 1.6: Add a User Account One of the first things to do after installing LiveNX is to grant additional user access, as well as to ensure that if you lose the credentials for the initial admin account, you will be able to login with appropriate privileges with a backup account. Lab Steps:
1. In the Browser interface, click on the gear icon to configure, select Users Management
2. Click Add User
3. Enter a username (something you’ll remember). 4. Select the Admin role from the drop-down. 5. Enter a password (again, something you’ll remember or write down). Re-enter the
password for confirmation.
Note: On first login the user will be prompted to change the initial password.
6. Click Add User.
Note: You now have a backup login in case you forget the administrator credentials. Throughout the remainder of this class, we will use the credentials associated with the admin login.

LiveAction Lab Workbook Pt. 1
23
Lab 2: The LiveNX Client

24 © Copyright 2019, LiveAction, Inc.
Lab 2.1: Launch the LiveNX Client The LiveNX Client is a Java application which may be loaded and launched on your local workstation. In this class you may alternatively run the Client on the virtual workstation connected via Remote Desktop Connection. The Client may be downloaded at LiveAction.com, and installation is fairly straight-forward. The Client requires Java JRE 1.8. If you don’t have the appropriate Java version installed… get it at: http://www.oracle.com/technetwork/java/javase/downloads/jre8-downloads-2133155.html. Additionally, although there is a Mac client available, the functionality is not 100% through it, as there are some sub-menus that fail to render and no selection can be made. Lab Steps:
1. Launch the LiveNX Client. Java Web Start will begin to download and may take several minutes depending on your connection speed. You may be prompted with download warnings, or various save options, depending on your OS and security configuration. DIAGRAM
2. Click Configure to verify server settings.
Note: A single client installation may connect to multiple LiveNX Servers simply by modifying the Server IP and Port. In this class we will always connect to the LiveNX Server in our Training Pod. Use the <ipaddress> from YOUR Lab Access Worksheet. The “For first time use” instructions only apply to an un-configured Server.
Client on YOUR Workstation

LiveAction Lab Workbook Pt. 1
25
3. Click Save 4. Enter the Username & Password.
Username: admin Password: Student (note the capital S)
5. Click OK
The Client will launch…
… and eventually display the Client window showing the current configured Topology.

26 © Copyright 2019, LiveAction, Inc.
Note: YOUR topology may be different from the screenshot above. Some of the items may be stacked directly on top of each other, requiring you to click and drag to make them more visible

LiveAction Lab Workbook Pt. 1
27
Lab 2.2: Explore the LiveNX Client Although we’ve already pre-configured one or more devices… LiveNX may not be collecting any flow data. In a subsequent Lab we will verify & complete the configuration of our class network by adding more devices and enabling flow collection, as needed. For now, let’s take a look at some of the menus and feature availability of the LiveNX Client. Lab Steps:
1. Right-click anywhere in the white area of the Topology Pane, and select View > Fit To View to zoom into the HQ-SJ Device, and center it on the screen.
DIAGRAM
Note: YOUR topology may be different from the screenshot above.
2. Left-click anywhere in the white area and move the mouse to re-position the device(s) in the window.
3. Use the mouse scroll-wheel to zoom in & out.

28 © Copyright 2019, LiveAction, Inc.
4. Note the 5 Module Tabs to the top-left of the Topology Pane. DIAGRAM
Note: Once we confirm the collection Flow and SNMP data these tabs will be a lot more useful!
5. Click on Flow tab, and on the Home icon in the tree-view pane to the left of the screen.
6. Expand the HQ SJ device in the Home Tree View, 7. Click on one of the interfaces… note how the information displayed in the Topology
Pane changes.
Note: You are welcome to poke around the LiveNX Client… don’t worry, you won’t break anything… but we will get some real usage, and see real data, in the coming labs!

LiveAction Lab Workbook Pt. 1
29
Lab 3: Traffic Flows

30 © Copyright 2019, LiveAction, Inc.
Lab 3.1: Discover Flows One of the strongest features of LiveNX is its ability to differentiate traffic flows by collecting NetFlow & SNMP from devices and mapping the flows visually in the LiveNX Client Topology Pane. In this Lab we need to find the address pair which has been generating so much FTP traffic over the past few hours. We can make it really easy to find with the application of just a few Filter Bar selections! Lap Steps:
1. Select the Flow Tab. 2. Refresh the Topology Pane.
You’ll note some traffic, but even refereeing to the legend at the bottom-left corner may not help identify the specific flows!
3. Set the filters to match:
Note: Make sure to specify Voice for Display Filtering, and DSCP for color marking.
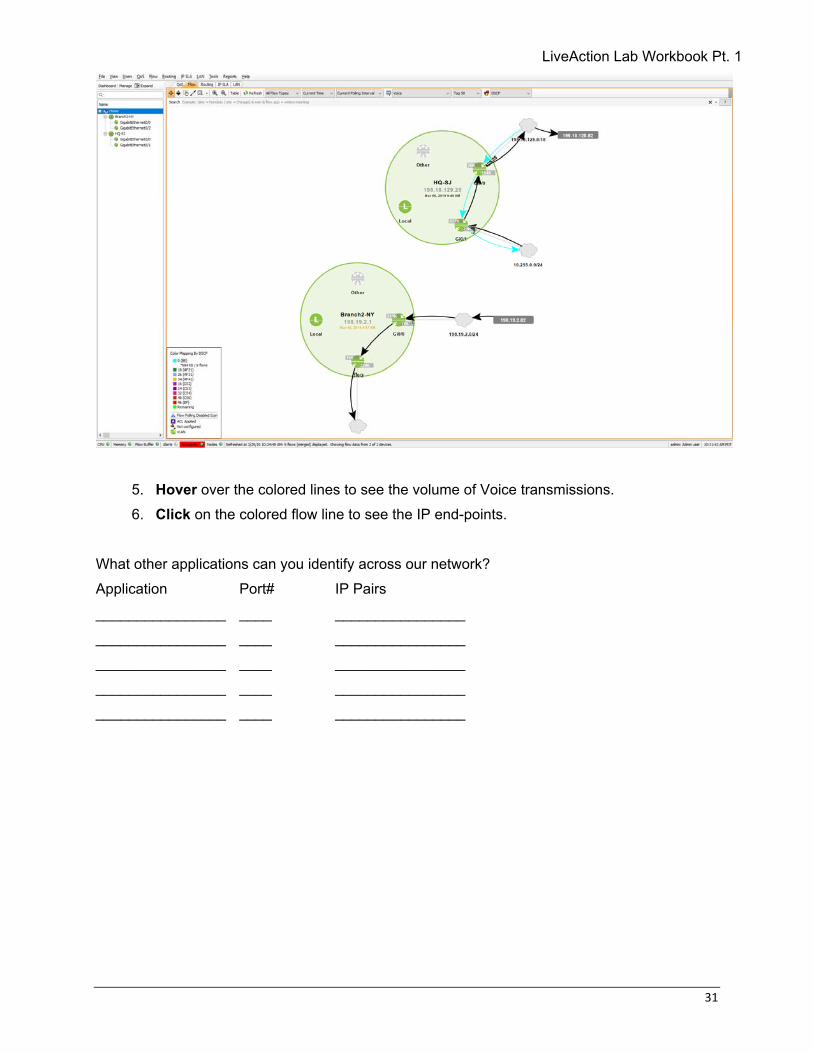
4. Refresh the Topology Pane, if needed. See how easy that was? The following screen shot clearly shows the Voice traffic.
LiveAction Lab Workbook Pt. 1
31
5. Hover over the colored lines to see the volume of Voice transmissions. 6. Click on the colored flow line to see the IP end-points.
What other applications can you identify across our network? Application Port# IP Pairs ________________ ____ ________________ ________________ ____ ________________ ________________ ____ ________________ ________________ ____ ________________ ________________ ____ ________________

32 © Copyright 2019, LiveAction, Inc.
Lab 3.2: Discover Specific Flows Note: You must be in the Topology Pane to perform these steps. Click Home to ensure.
1. Enter a search string of “flow.srcip=198.19.1.101”. 2. Select No Display Filtering. 3. Click Refresh 4. Click on the displayed flow indicator.
Notice that LiveNX has identified one or more end-to-end flows across the network.

LiveAction Lab Workbook Pt. 1
33
Lab 3.3: Examine Specific Traffic Another way to quickly discover flows among IP Addresses is to use the Device View * Table. Let’s discover where most of our BitTorrent traffic is sourced in our NY Branch.
1. Double-click on the Branch2-NY Device, or select it on the Home Tree.
Almost too easy, wasn’t it? What are the IP end-points of all that BitTorrent traffic? _______________ to/from ______________
2. Click on one of the end-points.
There is some other traffic, such as rtp, sip, and Citrix… but these 2 IPs are mostly generating BitTorrent. Make sure there isn’t a ghost server in your network serving movies and such!

34 © Copyright 2019, LiveAction, Inc.
Lab 3.4: Troubleshoot Issues
Note: Your Instructor may direct you to skip this Lab, and will instead demonstrate these steps for the class.
Users in the Marketing Department at our San Jose Headquarters have been complaining that their workstations seem to be “slowing down” numerous times a day. A pattern is developing that this happens about 4x per hour! It looks as though we may have an infected PC on the HQ sub-net… we need to identify the source PC by IP Address so that we can re-load anti-virus software on the identified user’s workstation. Lab Steps:
1. Open the SJ HQ device. a. Double-click on it OR select from the Home Tree view.
2. Click the Playback button in the Filter Bar. 3. Scroll through the time display until you discover anomalous behavior.
Note: The traffic we are looking for happens every 15 minutes (approx.). It helps if you have the Flow Filter set to All Flow Type, and No Display Filtering.
The Instructor will review this Lab so everyone will see the results!

LiveAction Lab Workbook Pt. 1
35
Lab 4: Filtering, Identifying, Marking

36 © Copyright 2019, LiveAction, Inc.
Lab 4.1: Creating Custom Filters Creating and using Custom filters will help you in your day to day use of LiveNX. It is recommended that you create custom filters for common traffic types that you are interested in viewing regularly.
• In this lab you’ll create a custom filter based-upon given ports to identify SIP and RTP traffic, and verify what their markings are. Ports being used for the filters in this lab are:
• SIP Ports: 5060 5061 5062 • RTP Ports: 16384 – 32767
Lab Steps: 1. Click the Filter ICON (looks like a funnel) to Open the Flow Display Filters Set-Up.
2. Click Create Filter on the top right of the Flow Display Filters Set-Up.
3. Enter a Name label:
4. On the Basic Tab, check Match Protocol/Ports and select the SIP Protocol. 5. Click Edit.

LiveAction Lab Workbook Pt. 1
37
6. Edit both entries, for TCP and UDP, to match the ports provided. 7. Select to “Match Ports Regardless of Source and Destination” for both TCP and UDP.
8. Click OK 9. Click Add Entry.
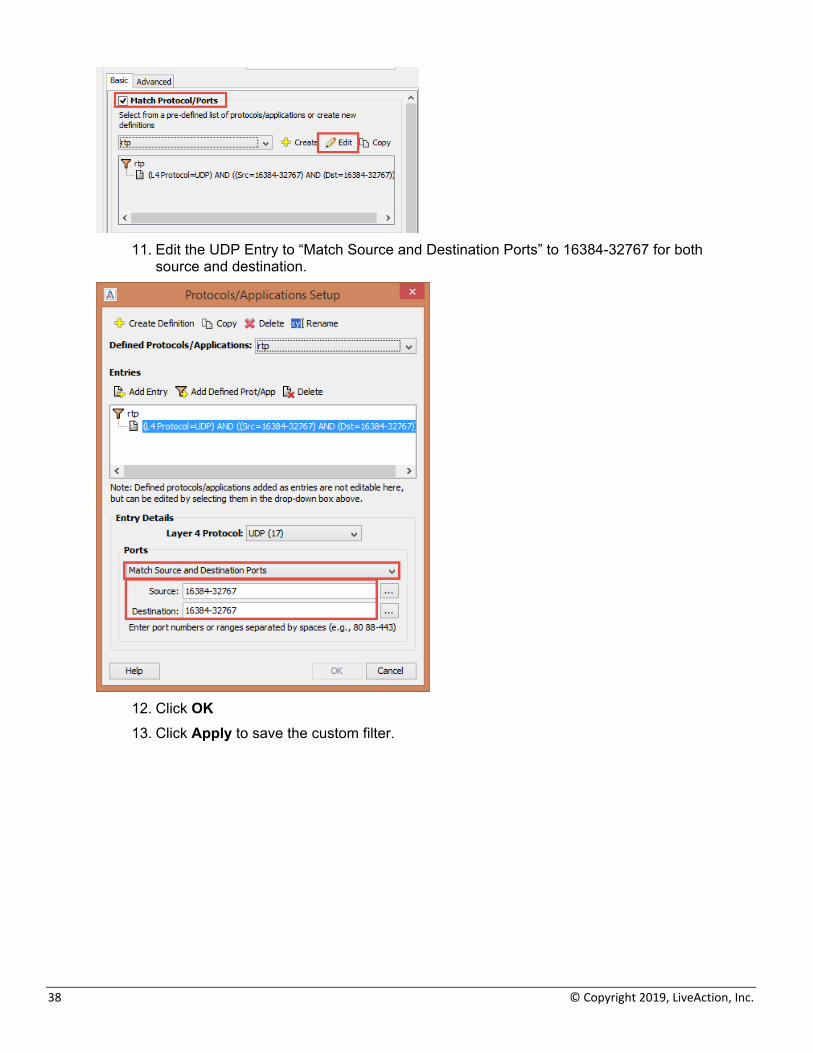
10. Select the “rtp” Protocol and Edit the ports.
38 © Copyright 2019, LiveAction, Inc.
11. Edit the UDP Entry to “Match Source and Destination Ports” to 16384-32767 for both
source and destination.
12. Click OK 13. Click Apply to save the custom filter.

LiveAction Lab Workbook Pt. 1
39
14. Select your new filter, select “DSCP” and select “Refresh” to verify the DSCP markings
for your SIP and RTP traffic.
Do you see any BE or Best Effort Marked Traffic in your Lab? Best Effort is the default traffic type for any un-marked flows.

40 © Copyright 2019, LiveAction, Inc.
Lab 4.2: ACL Creation LiveNX gives you the ability to easily create and monitor ACL’s with its intuitive User Interface. You can manually create ACL’s, or you can create them based upon flow information with only a few clicks. You can also monitor the statistics of how an ACL is performing without having to access the router/switch CLI. In this lab you’ll create an ACL to identify the SIP and RTP traffic to be used in a QoS Marking Policy. Lab Steps:
1. Right-click on the Branch2-NY device (you may also right-click on the device in the Topology Pane) and Manage ACLs.
2. Select “Create ACL”
LiveAction Lab Workbook Pt. 1
41
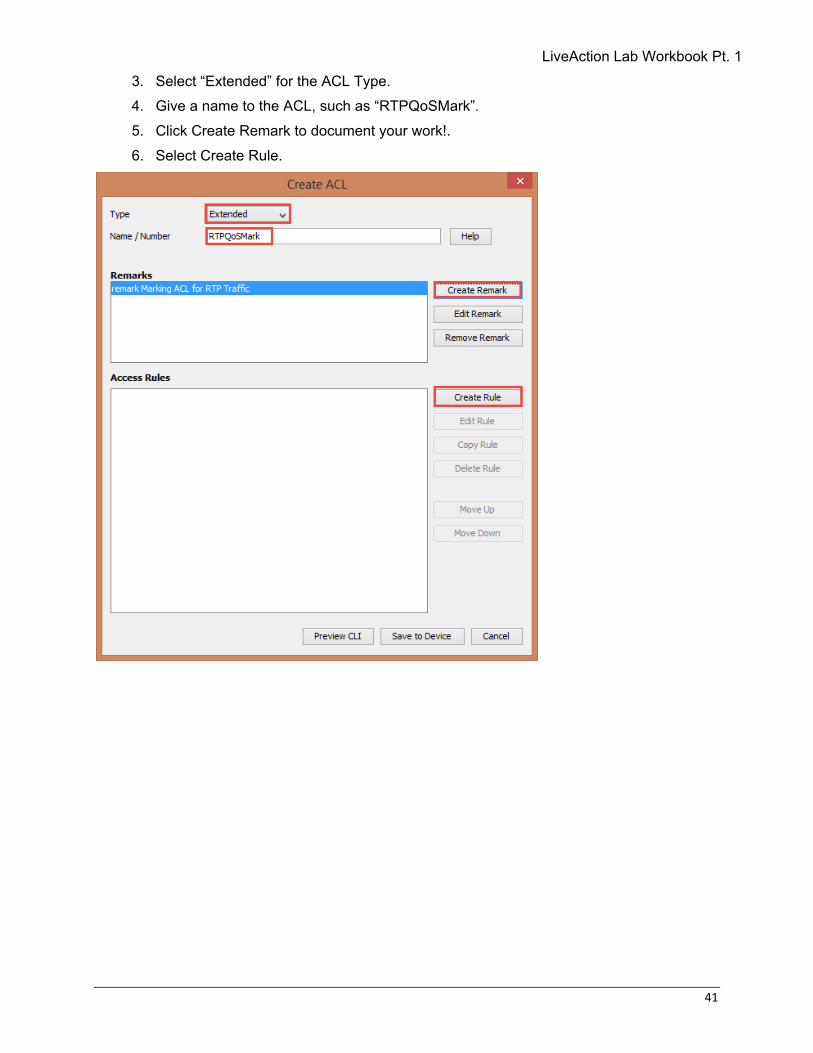
3. Select “Extended” for the ACL Type. 4. Give a name to the ACL, such as “RTPQoSMark”. 5. Click Create Remark to document your work!. 6. Select Create Rule.

42 © Copyright 2019, LiveAction, Inc.
ACL Rule Editor 7. Select “UDP” as the protocol type. 8. For Source and Destination check the “by Port” box. 9. Select “Between” as the operator value. 10. In the entry box use “16384 32767” as the field entry. 11. Click OK when your fields match the diagram below.
Once completed you can use “Preview CLI” to see the configuration that will be pushed to the device.
12. Click Save to Device.

LiveAction Lab Workbook Pt. 1
43
Create ACLs for the SIP ports.
13. Select “Extended” for the ACL Type. 14. Give a name to the ACL, such as “SIPQoSMark”. 15. Click Create Remark to document your work!. 16. Select Create Rule.

44 © Copyright 2019, LiveAction, Inc.
17. Select “TCP” as the protocol type. 18. For Source check the “by Port” box. 19. Select “Between” as the operator value. 20. In the entry box use “5060 5062” as the field entry. 21. Click OK when your fields match the diagram below.
Next create another rule for destination SIP Ports.

LiveAction Lab Workbook Pt. 1
45
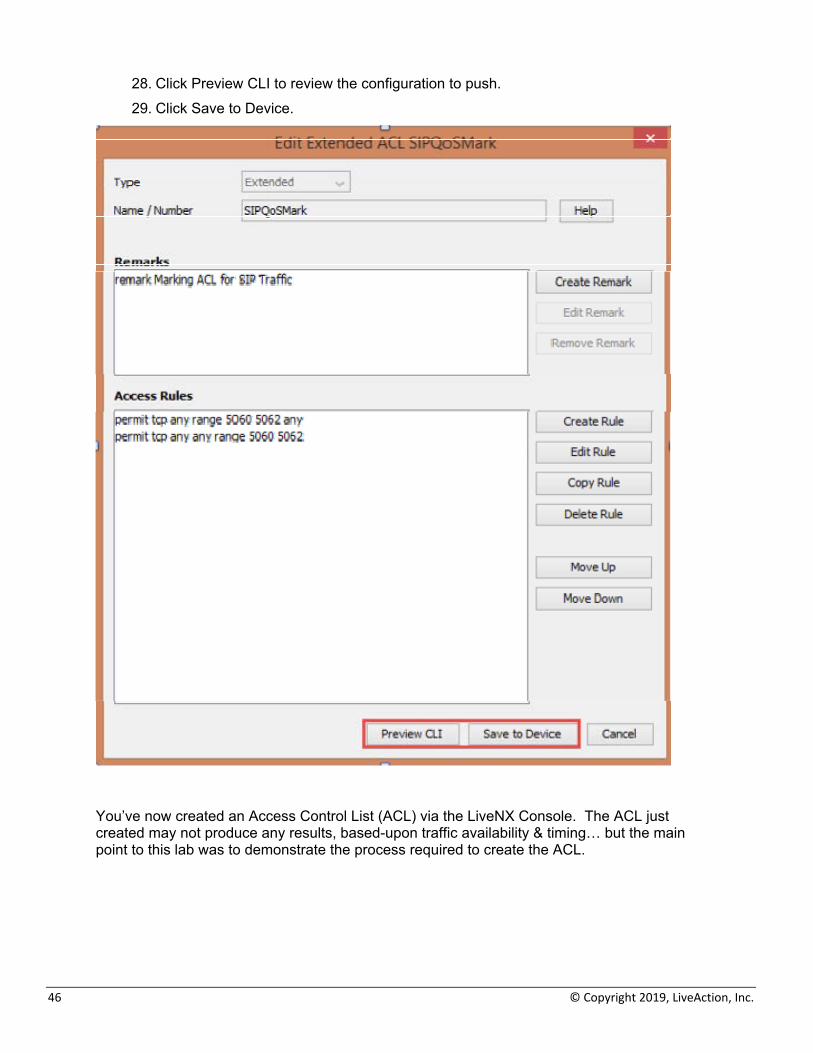
22. Select “TCP” as the protocol type. 23. For Source check Any. 24. In Destination select by Port. 25. Select “Between” as the operator value. 26. In the entry box use “5060 5062” as the field entry. 27. Click OK when your fields match the diagram below
46 © Copyright 2019, LiveAction, Inc.
28. Click Preview CLI to review the configuration to push. 29. Click Save to Device.
You’ve now created an Access Control List (ACL) via the LiveNX Console. The ACL just created may not produce any results, based-upon traffic availability & timing… but the main point to this lab was to demonstrate the process required to create the ACL.

LiveAction Lab Workbook Pt. 1
47
Lab 5: Configuring Devices

48 © Copyright 2019, LiveAction, Inc.
Lab 5.1: Add Device Adding devices into LiveAction and managing them properly is very important to the overall usability of LiveAction itself. In this Lab we’ll go to the WebUI to Discover & Add a device to our LiveNX Server. Lab Steps:
1. Login to the LiveNX WebUI 2. Select Configure > Device Management
3. Click Discover Devices.
4. Enter 198.19.1.1, 198.19.2.1, and 198.18.129.23-25 in the IP Address field. 5. Select the SNMP Settings tab.

LiveAction Lab Workbook Pt. 1
49
6. Click “Default SNMP connection settings”. 7. Select the Node tab. 8. Select Local/Server. 9. Click Discover.
Note: Discovery may take a minute or two. If you’ve specified a large subnet to scan, and Discovery seems to take too long… click Stop.
10. Tick the box next to Branch1-LA. 11. Click Select Interfaces.
LiveNX displays the available configured interface on the device(s) that were discovered. Notice that LiveNX also discovers additional device semantic information such as; Line Rate, Capacities, Labels, etc…
Note: LiveNX’s Rapid Device Discovery feature will automatically select the Top 4 interfaces based-upon interface utilization. It is incumbent upon YOU to confirm, or select, the interfaces you wish to monitor. LiveNX may monitor up to 1000 interfaces on a single device.

50 © Copyright 2019, LiveAction, Inc.
12. Select ONLY GigabitEthernet1 & GigabitEthernet3. 13. Click Add Selected.
You now see we’ve added Branch1-LA for monitoring by LiveNX. Notice that there is a “not-configured” symbol next to the link. This means we still have some configuration to complete.
Note: Since the creation of this lab guide, Cisco has changed the labeling on the interfaces. Some of the screenshots may still reflect the older naming convention, i.e. Ethernet 0/0, Ethernet 0/2, while what is shown on your screen may be different – GigabitEthernet1, GigabitEthernet3. Please adjust accordingly and note that items may not appear exactly as they do in the screenshots
LiveAction Lab Workbook Pt. 1
51
Lab 5.2: Manage & Configure Devices You may perform many management tasks via the WebUI… but since we’ll need to go to the LiveNX Client to configure Flow Collection in the next lab… let’s complete our Device Configuration in the Console.
Note: You can find instructions for Adding Devices via the Client in the Appendix of this Lab Workbook.
Lab Steps:
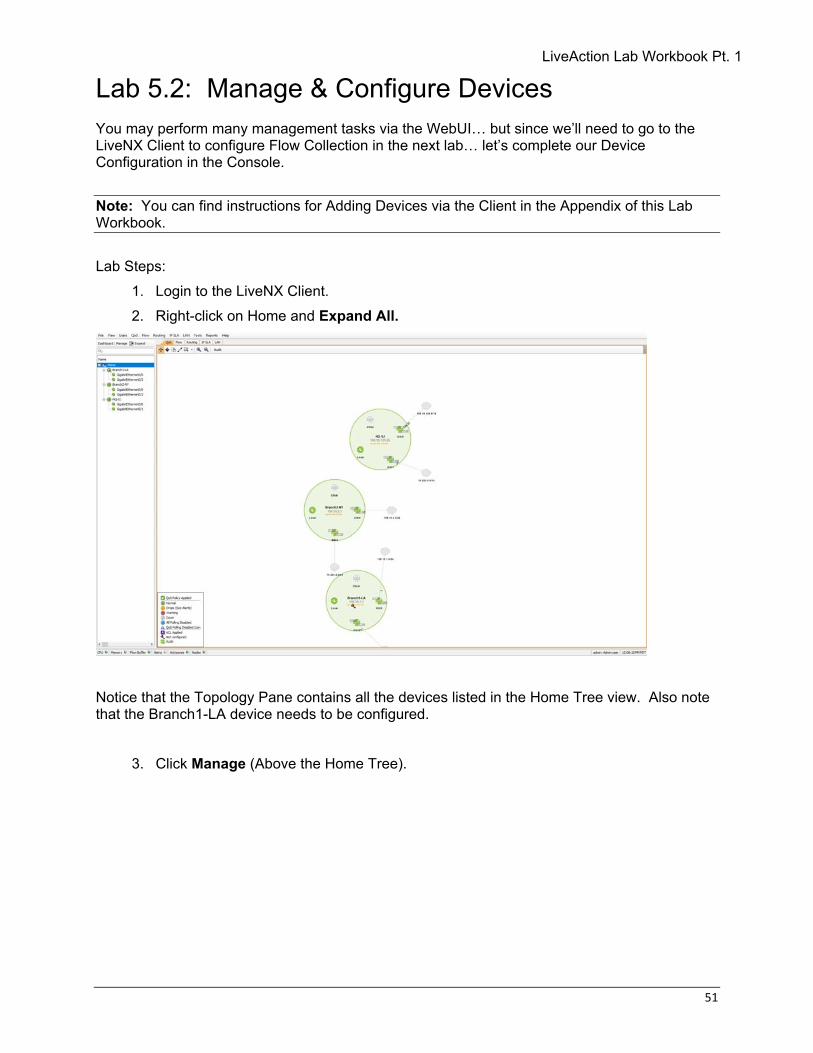
1. Login to the LiveNX Client. 2. Right-click on Home and Expand All.
Notice that the Topology Pane contains all the devices listed in the Home Tree view. Also note that the Branch1-LA device needs to be configured.
3. Click Manage (Above the Home Tree).

52 © Copyright 2019, LiveAction, Inc.
4. Un-tick all but the Poll, QoS, and Flow features. 5. Change the Interval on all devices to 10 seconds. 6. Click Apply. 7. Tick the box next to Branch1-LA device. 8. Click Configure.
LiveNX starts the Add Device wizard… we will basically select to use whatever defaults are already configured…
9. Use the Default SNMP… Click Next 10. Use my default Configuration CLI… Click Next

LiveAction Lab Workbook Pt. 1
53
11. Check Use the previous page connection settings… Click Next. Ensure Interfaces
GigabitEthernet1 & Gigabit Ethernet3… Click Next
12. Note: Since there are no VLANs configured on this device, none will be displayed.
You may monitor up to 25 configured VLANs on each device. 13. The Select Features dialog allows you to turn-on specific Cisco technologies using
the templates included in LiveNX. This dialog displays the current IOS configuration of the device you are currently viewing. Match the settings for GigabitEthernet3. Click Next.
Note: Any changes to the Select Features dialog will generate a CLI push to update the current configuration. Before sending a new configuration to the device, you can verify the configurations that LiveAction created.

54 © Copyright 2019, LiveAction, Inc.
14. Enable Polling. Next. Click Continue
15. Select “I will manually configure…” radio button, if available. 16. Click Next. 17. Click Finish.
The device will be added to the Topology Pane in LiveNX.
Note LiveNX will not automatically position a new device with reference to any existing devices… you may need to scroll-about in the Topology Pane to locate your new device(s).

LiveAction Lab Workbook Pt. 1
55
Lab 5.3: Configure Flow on Devices Before removing unwanted interfaces you should remove any existing flow configurations those interfaces have been configured with… this will avoid any issues when writing new configuration data to the device. Lab Steps:
1. Select Flow from the Menu Bar, choose Configure Flow.
2. Select all three devices, click Configure Selected.
Note: If the device is grayed-out you must return to the Home tree, right-click on the appropriate device, and select Refresh, before continuing.
Note: YOUR settings may be different from the screenshot above. Diagrams are for illustration purposes and may not reflect the data you may view on your Training Pod.

56 © Copyright 2019, LiveAction, Inc.
3. Select Traffic Statistics (FNF), Application Performance (AVC), and Voice/Video (Medianet) on:
a. GigabitEthernet3 on both Branch1-LA and Branch-NY b. GigablitEthernet1 and GigabitEthernet2 on HQ-SJ.
Note: Your screen should look similar to that below before moving forward.
4. Click Preview CLI.
5. Click Close. 6. Click Save to Devices. 7. Click Close.
Note: If you get an error while saving to devices… simply click-thru. This is expected on certain versions of LiveNX Client.
Select device to view individual CLI file.

LiveAction Lab Workbook Pt. 1
57
Note: Now that we’ve configured Flow Collection on our devices… we’ll be able to view flows in the Topology Pane!
8. Click Refresh in the Filter Bar.
58 © Copyright 2019, LiveAction, Inc.
Lab 5.4: Delete Unused Interfaces Remove any interfaces we don’t need to collect data from.
Note: Your Instructor may have already performed this process when they configured your Training Pod.
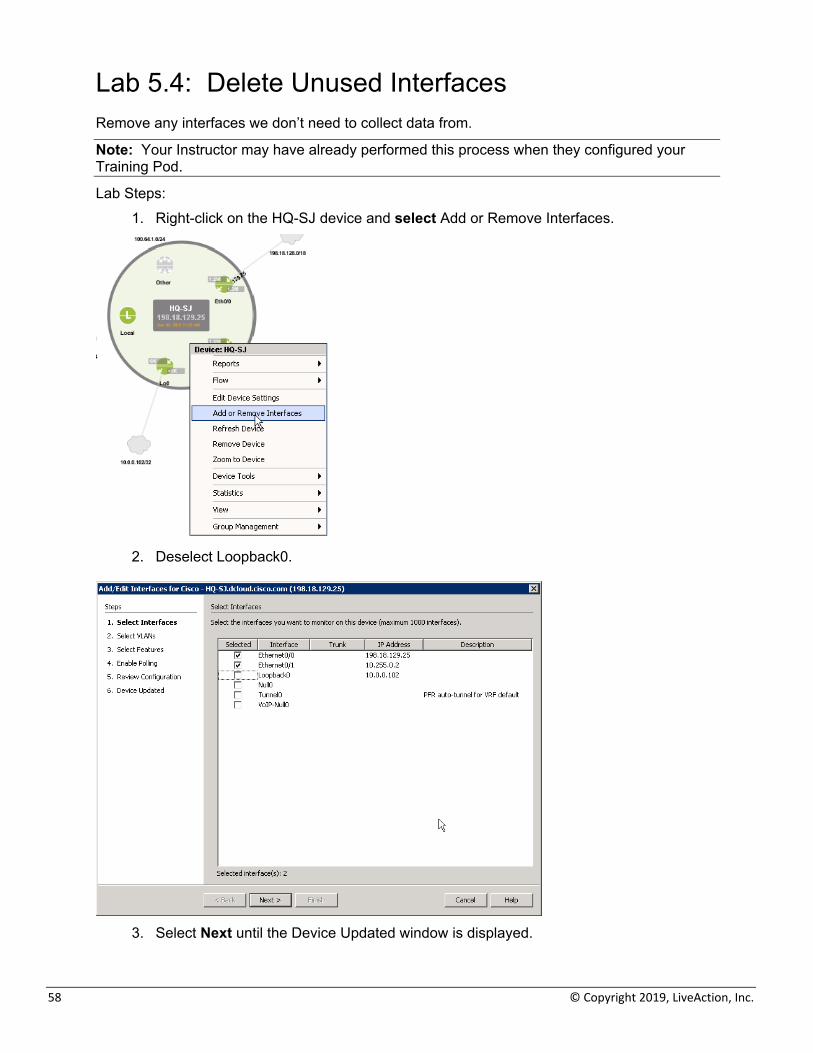
Lab Steps: 1. Right-click on the HQ-SJ device and select Add or Remove Interfaces.
2. Deselect Loopback0.
3. Select Next until the Device Updated window is displayed.

LiveAction Lab Workbook Pt. 1
59
4. Select Finish to update the device. Notice that the device now has 2 active interfaces, represented by Gi1 and Gi2
5. Repeat from Lab Step 1 above to perform the same interface removal on Branch1-LA and Branch2-NY (as needed).
Note: You may also remove multiple interfaces at a time from multiple devices. See the Appendix for instructions to Export/Import Devices.

60 © Copyright 2019, LiveAction, Inc.
Lab 5.5: Merge Clouds in Topology Now that the LiveNX topology has discovered devices, and you’ve defined the correct interfaces and NetFlow configurations, you may Refresh your Flow Tab to view any network flows collected in the Current Polling Interval.
Notice on your topology that the network clouds are not connecting between devices. Since these clouds are across a service provider it is necessary to merge the clouds so that NetFlow can be properly visualized across the topology.
Note: You must be in the Topology Pane to perform these steps. Click Home to ensure.
Lab Steps: 1. Right-click on the HQ-SJ Device’s Gi2 10.255.0.0/24 network cloud, and select Merge
Clouds.
2. On the Create Network Object dialog enter a Name of WAN.
Note: You may also give the tooltip a name of WAN Cloud.

LiveAction Lab Workbook Pt. 1
61
3. Select “Find” to add more networks.
4. Select the following networks and then select ok:
10.255.0.0/24 10.255.1.0/24 10.255.2.0/24
5. Click OK. 6. Enter a Name of WAN.

62 © Copyright 2019, LiveAction, Inc.
7. Click OK to finish.
Now all three devices should have a link to the WAN Merged cloud. Try moving the devices around to create a topology view which makes sense for you.
8. Click the Refresh button in the Flow tab to query flows from the devices and draw them on the topology.

LiveAction Lab Workbook Pt. 1
63
Lab 6: Making the Topology Work

64 © Copyright 2019, LiveAction, Inc.
Lab 6.1: Setting Device Semantics Note: Semantics may have already been configured on most of the devices in this Lab. You need to ensure that all the devices have their semantics entered.
Device semantics are very useful for getting the most out of your LiveNX deployment. Whether it’s grouping devices according to region, or identifying high priority links, setting semantics will help you in your day-to-day operations. Your task in this Lab will be to identify WAN links and tag them to populate dashboard data, set bandwidth rates for these links, group devices, and merge clouds. Lab Steps:
1. Select Expand to set semantics for devices.
Expanding the window Home Pane shows an overview of configured device options… as well as a Detail view of a selected device containing; CPU and memory utilization, Serial Number, Device Name, Mode, etc.

LiveAction Lab Workbook Pt. 1
65
Note: LiveAction recommends tagging your WAN interfaces so that the corresponding NetFlow data goes to the Dashboard to give you high-level information about data crossing through those interfaces. Besides setting the WAN tags, you can set other information such as a Label, Capacity and Site to give you usage rates for the tagged interface.
To tag an interface
• Branch1-LA Interface GigabitEthernet3 Label Interface as LA, give Capacity of 1500 Kbps and select WAN
• Branch2-NY Interface GigabitEthernet3 Label Interface as NY, give Capacity of 1500 Kbps and select WAN
• HQ-SJ Interface GigabitEthernet1 Label Interface as SJ, give Capacity of 1500 Kbps and select WAN
Note: Tags such as WAN and Labels can be used in conjunction with the search string for the topology and in reports.
You can also tag individual or multiple devices that may belong to a site. This information can be used with the Dashboard, topology search, and reports.
2. Select the device and then on the bottom right portion you will see a Site field.
3. Configure each device to a site as shown below: a. Branch1-LA Device as Los Angeles b. Branch2-NY Device as New York c. HQ-SJ Device as San Jose

66 © Copyright 2019, LiveAction, Inc.
4. Open the dashboard to ensure that data is populating correctly.
Note: It may take up to 15 minutes for the Dashboard to populate with data.
On the System Dashboard, if you scroll all the way to the bottom on the window you should see data populating the Site WAN Interface Utilization if you configured the semantics correctly.
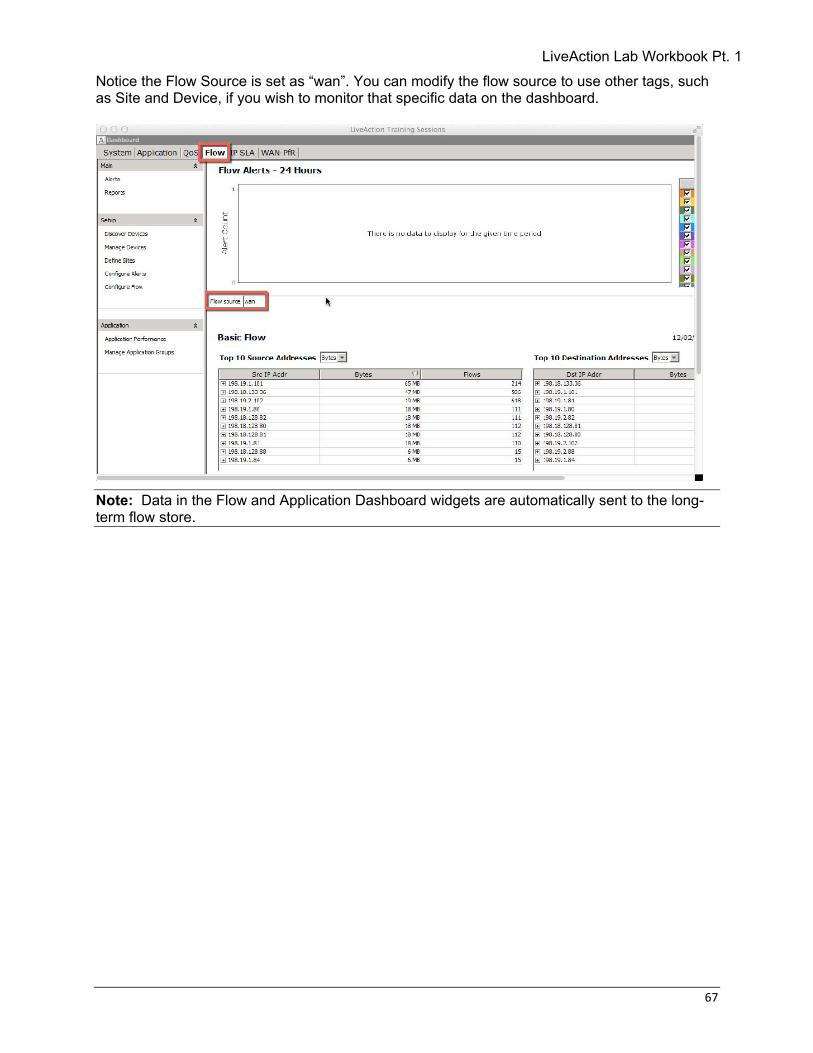
5. Scroll back up on the Dashboard window and select the Flow tab.
LiveAction Lab Workbook Pt. 1
67
Notice the Flow Source is set as “wan”. You can modify the flow source to use other tags, such as Site and Device, if you wish to monitor that specific data on the dashboard.
Note: Data in the Flow and Application Dashboard widgets are automatically sent to the long-term flow store.

68 © Copyright 2019, LiveAction, Inc.
Lab 6.2: Adding Devices to Groups Having devices in groups makes it easier to manage the topology. You can also use group tags in reports and topology searches. In this Lab you will create three groups, one called LA, one called NY, one called SJ. Lab Steps:
1. Open the Device Management window by selecting Manage.
On the Device management window note that you can modify many settings for the device, such as; polling technologies, polling intervals, manage CLI configuration settings, etc.
2. Select “Edit Groups”

LiveAction Lab Workbook Pt. 1
69
3. Click Add
4. Enter SJ in the Name field. 5. Select HQ-SJ from the All Other Devices list and click the right arrow. 6. Click Add, repeat the steps above to create Groups for LA and NY.
7. Once all three groups have been created and devices correctly added, select Done.

70 © Copyright 2019, LiveAction, Inc.
Once completed your groups should look like the one below.
8. Click OK and return to the topology pane to see the changes.
9. Double-click on the group to expand.

LiveAction Lab Workbook Pt. 1
71
Lab 6.3: Creating Network Objects Network objects can be used to better visualize and understand how traffic traverses the topology. LiveNX allows you to assign various icons to flow end-points, such as laptop or server icons for those host-types, as well as phone set or camera icons, to denote appropriate infrastructure. In this Lab we’ll identify a number of specific flows and assign appropriate end-point objects. Lab Steps:
1. Make sure that there is no filter being applied (No Display Filtering) 2. In the Flow tab, Enter the search string: flow.srcip=198.19.1.101 3. Click on the Flow line to select it…. And note the IP end-points. 4. Right click on the IP Address endpoint. 5. Select Create Network Object
6. Select an Object/Shape as either“PC” or “Laptop”. 7. Click OK.

72 © Copyright 2019, LiveAction, Inc.
8. Click Refresh.
You will now see the flows to your new network object.
Note: Assigning representative icons to the flow end-points makes it easier to locate potential trouble spots!
9. Enter the search string: flow.srcip=198.19.2.102 10. Select the flow (it will be near the NY device), right click on the IP Address endpoint. 11. Select Create Network Object 12. Select an Object/Shape as “File Server”. 13. Click OK.

LiveAction Lab Workbook Pt. 1
73
14. Enter the search string: flow.srcip=198.18.133.36 15. Select the flow (it will be near the SJ HQ device), right click on the IP Address
endpoint. 16. Select Create Network Object. 17. Select an Object/Shape as “Laptop”. 18. Click OK. 19. Click Refresh.
You will now see the flows to your new network objects.
74 © Copyright 2019, LiveAction, Inc.
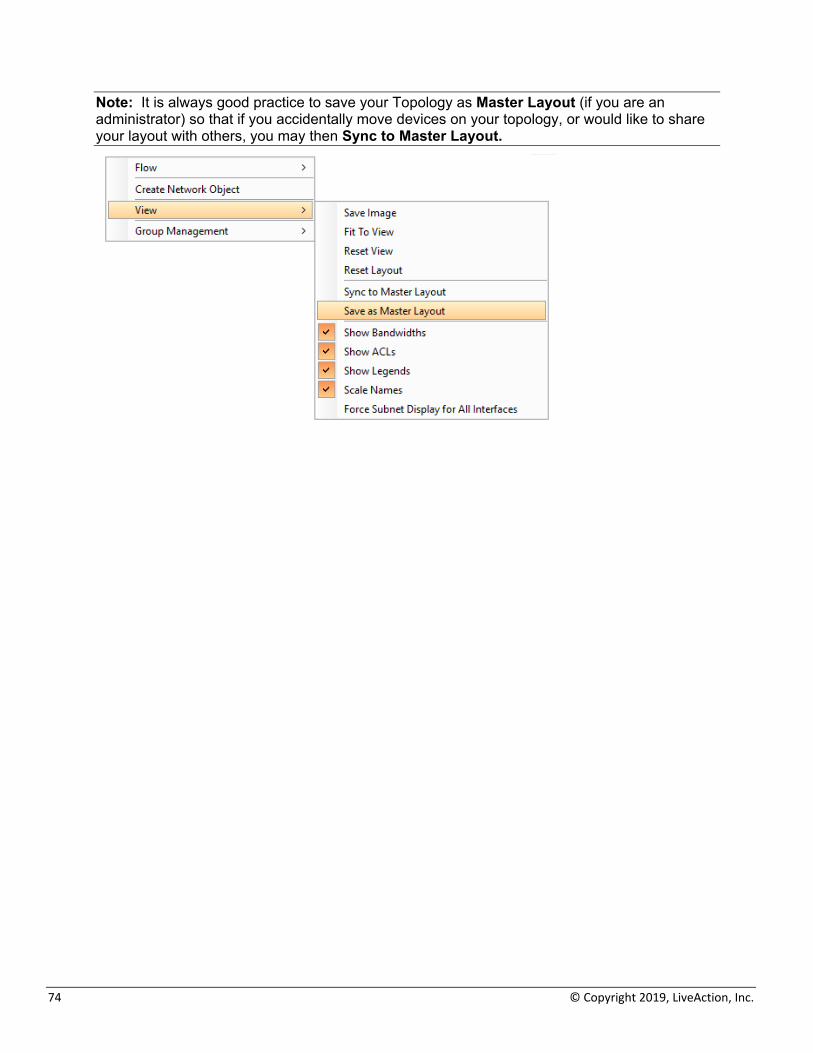
Note: It is always good practice to save your Topology as Master Layout (if you are an administrator) so that if you accidentally move devices on your topology, or would like to share your layout with others, you may then Sync to Master Layout.

LiveAction Lab Workbook Pt. 1
75
Lab 7: Console Dashboard & Reports

76 © Copyright 2019, LiveAction, Inc.
Lab 7.1: The Client Dashboard The LiveNX Dashboard is your first stop to view overall network health. Alerts, Top CPU & Memory Usage, Bandwidth, Packet Drops, and more, are displayed in a System view. You may also view information, statistics, and alerts from Application, Flow, QoS, IP SLA, and WAN PfR, provided in separate tabs. In this Lab you’ll examine the data provided within the Dashboard views, and later use this as a launching-point to configure Alerts based-upon Dashboard results.
Note: Since the System Dashboard’s default time interval is 24 hours, you may not see a lot of detail. Zoom-in to see more granular data.
Lab Steps: 1. Click the Dashboard tab (above the Home Tree-view).
The Dashboard displays, showing a time-series of Alert Counts for the past 24-hours. To the right of the time-series note the Alert Type and Count.
2. Un-check Interface Up/Down. 3. Left-click-Drag to Zoom into a flow of interest.
Note: Your results may not look the same as the images in this Lab. These images are for example purposes only.
LiveAction Lab Workbook Pt. 1
77
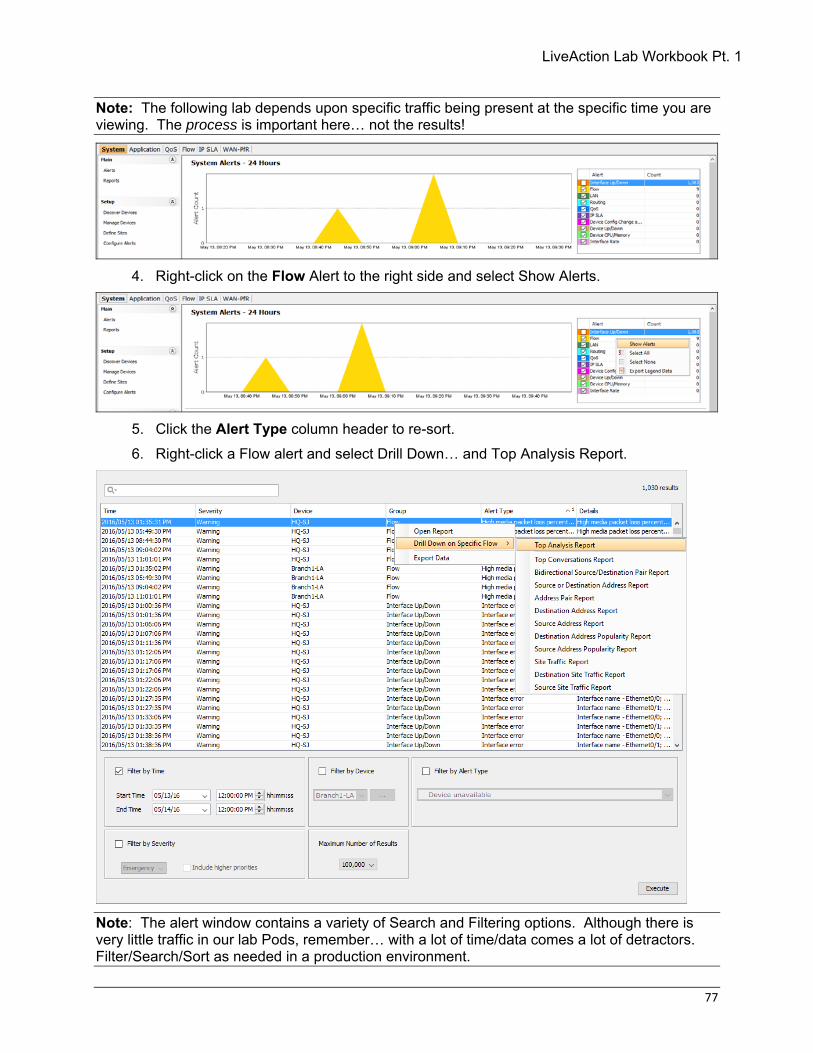
Note: The following lab depends upon specific traffic being present at the specific time you are viewing. The process is important here… not the results!
4. Right-click on the Flow Alert to the right side and select Show Alerts.
5. Click the Alert Type column header to re-sort. 6. Right-click a Flow alert and select Drill Down… and Top Analysis Report.
Note: The alert window contains a variety of Search and Filtering options. Although there is very little traffic in our lab Pods, remember… with a lot of time/data comes a lot of detractors. Filter/Search/Sort as needed in a production environment.

78 © Copyright 2019, LiveAction, Inc.
7. Review the Top Analysis Report.
With about 5 clicks we’ve discovered WHICH flow was having troubles, what the problem may be, and the device, address pair, protocol, ports, etc. This Report may be printed/saved for documentation purposes. Take some time to review the information in the other Dashboards; Application, Qos, etc…, to familiarize yourself with the available statistics displayed.

LiveAction Lab Workbook Pt. 1
79
Lab 7.2: Viewing Console Reports We’ll run 3 of the most commonly used reports, based-upon available data in our Training Pods. Reports work the same with any installation… only the data is changed (… to protect the innocent? ;-). Lab Steps: Run an Applications Report
1. Select Reports > Flow from the top Menu Bar. 2. Select the Inbound and Outbound Combined filter. 3. Click Execute Report.
Note: Your results may not look the same as the images in this Lab. These images are for example purposes only.
The default Application Report is displayed when you select Reports, and after you clicked Execute Report the system filled-in the report template with current 15-minute data. Notice the time span of the report, the number of flows, or discrete data points, the report displays, and the time-series chart above the Classes Table.
4. Click the 6h time setting at the top-right. (we do this in the lab to get more flows) 5. Click Execute Report.
Did you notice the report took longer to run this time? Depending on the amount of flows across YOUR production network… report execution will get longer in direct proportion to the time setting. In some cases it may take up to 10 minutes to run the report! When you run a report… try to do filtering and searching so the system only needs to pull appropriate data to answer your question. LEAVE THE REPORT OPEN!

80 © Copyright 2019, LiveAction, Inc.
Run a Top Talkers Report 1. On the report menu, open the Address category and right-click Top Conversations,
and click New Report. 2. Click the 6h time setting at the top-right. 3. Click Execute Report.
Note: Your results may not look the same as the images in this Lab. These images are for example purposes only.
This report shows the top conversations in the selected time period including; Source address, Destination address, total flows, etc… a good way to see who is using the bandwidth, and what for… All that Bittorrent may not be good for business! Right-clicking to open a New Report leaves the prior reports open, in a tabbed manner, for comparison purposes. Flow Identification
1. On the report menu, open the QoS category, right-click DSCP, and click New Report. 2. Click the 6h time setting at the top-right. 3. Click Execute Report.

LiveAction Lab Workbook Pt. 1
81
See that the majority of the discovered traffic is marked as 0 (BE). This means that this traffic has not been recognized as a certain type by the router and it will use its BEST EFFORT to rout it. This may be a candidate for marking so that QoS may use priority routing. Bandwidth by Flow Type
1. On the report menu, open the Network category, click Interface Bandwidth Summary.
2. Enter a Search String: wan & flow.dscp=EF (note upper-case). 3. Click the 6h time setting at the top-right. 4. Select SJ HQ device. 5. Click Execute Report.
This report compares the INGRESS & EGRESS flows for the selected interface, for all marked EF traffic flows. This is a Quick way to see how much traffic “stays inside” and how much transits the device.
Note: Your results may not look the same as the images in this Lab. These images are for example purposes only.

82 © Copyright 2019, LiveAction, Inc.
Lab 7.3: Create a Custom Report In this Lab you’ll create a Custom Report to display the last of the most popular reports. Although the IPs & Ports is now an included report, due to its popularity, we’ll create a similar Custom report to visualize the process. Lab Steps:
1. On the report menu, in the bottom-left Report Actions pane, click Create. 2. Enter a Report Name. 3. Select the Fields as indicated in the diagram, below.
4. Click Create. 5. Select SJ HQ device. 6. Click the 6h time setting at the top-right. 7. Click Execute Report.
You now have a report which, at-a-glance, shows all the flows that are using Best Effort. Now you go mark these flow for priority processing as part of your production QoS Policy!

LiveAction Lab Workbook Pt. 1
83
Lab 8: QoS
84 © Copyright 2019, LiveAction, Inc.
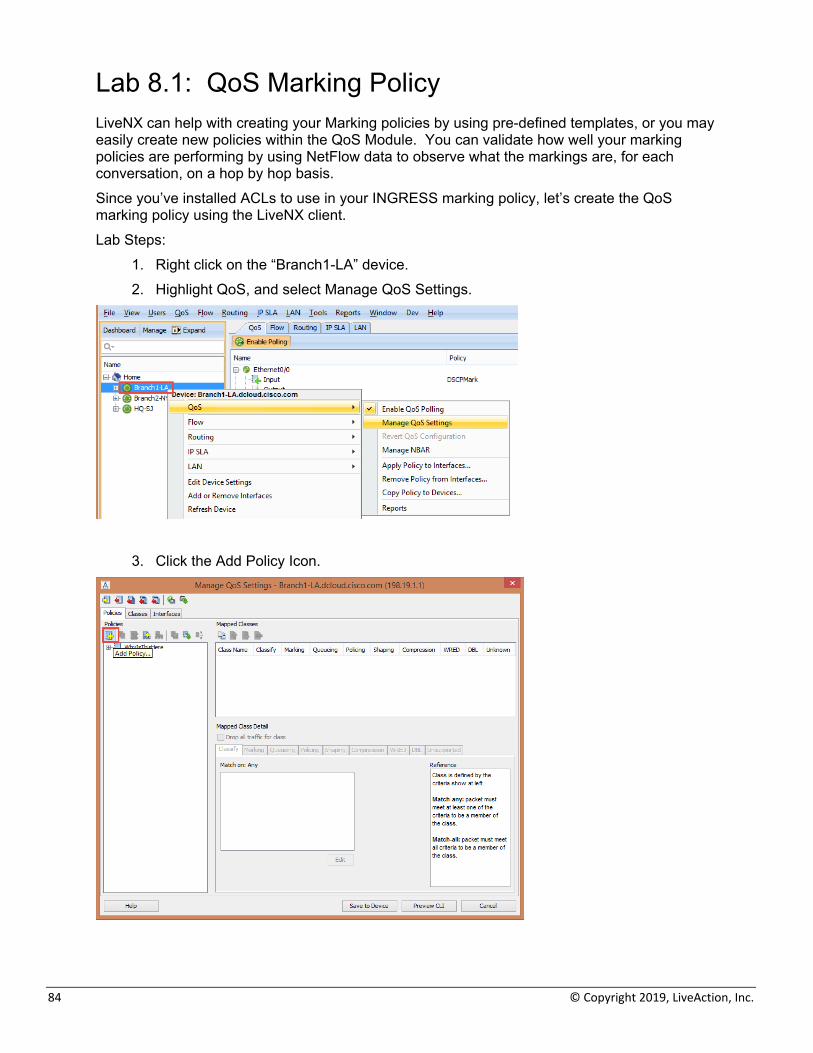
Lab 8.1: QoS Marking Policy LiveNX can help with creating your Marking policies by using pre-defined templates, or you may easily create new policies within the QoS Module. You can validate how well your marking policies are performing by using NetFlow data to observe what the markings are, for each conversation, on a hop by hop basis. Since you’ve installed ACLs to use in your INGRESS marking policy, let’s create the QoS marking policy using the LiveNX client. Lab Steps:
1. Right click on the “Branch1-LA” device. 2. Highlight QoS, and select Manage QoS Settings.
3. Click the Add Policy Icon.

LiveAction Lab Workbook Pt. 1
85
4. Give the new Policy a name, such as “DSCPMARK”
5. Right Click on your new “DSCPMARK” policy and select “Add Class to Policy”
6. Select “Create a new class” and give the class a name RTP. 7. Click OK
8. Select “Add Class to Policy”
86 © Copyright 2019, LiveAction, Inc.
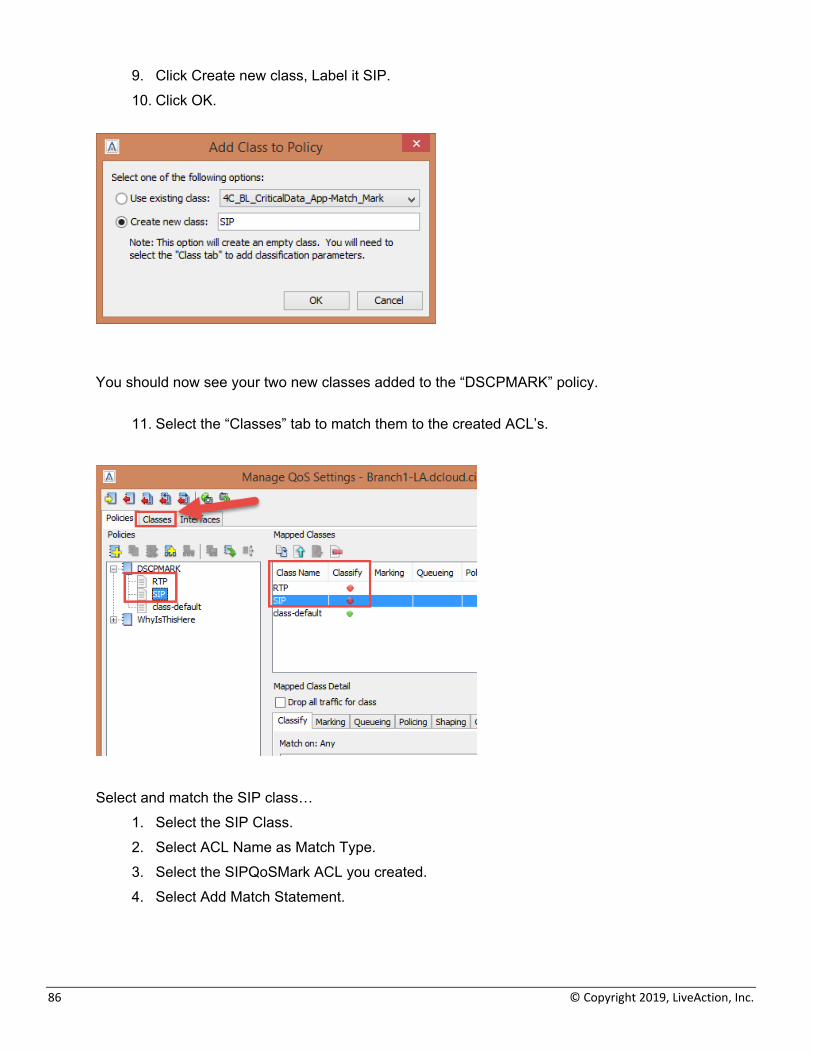
9. Click Create new class, Label it SIP. 10. Click OK.
You should now see your two new classes added to the “DSCPMARK” policy.
11. Select the “Classes” tab to match them to the created ACL’s.
Select and match the SIP class…
1. Select the SIP Class. 2. Select ACL Name as Match Type. 3. Select the SIPQoSMark ACL you created. 4. Select Add Match Statement.

LiveAction Lab Workbook Pt. 1
87
Next select the RTP Class and do the same…
1. Select the RTP Class. 2. Select ACL Name as Match Type. 3. Select the RTPQoSMark ACL you created. 4. Select Add Match Statement.

88 © Copyright 2019, LiveAction, Inc.
1. Select the Policies Tab. 2. Select the RTP Class. 3. Select the Marking Tab 4. Choose to mark the RTP Traffic with DSCP 46 (EF).

LiveAction Lab Workbook Pt. 1
89
Next it is necessary to set the DSCP Markings for the SIP Class. 1. Select SIP 2. Select the Marking tab. 3. Mark with DSCP as below.
4. Click Preview CLI to see the policy you have created. 5. Click Save to Device if satisfied.

90 © Copyright 2019, LiveAction, Inc.
We can now push our newly created polies to multiple devices.
1. Select the “DSCPMARK” policy. 2. Click the “three arrow” icon to copy policy to devices. 3. Select the DSCPMARK Policy. 4. Select the other two devices in the topology. 5. Click OK
You should see that both policies copied to the device successfully.
6. Close the Copy Policy window, and the Manage QoS Window to return to the Topology pane.
Note: You want to apply marking policies as close as possible to where traffic enters the network.

LiveAction Lab Workbook Pt. 1
91
In this scenario we will be applying the marking policies on the ingress of the LAN interfaces for each device. Perform the following steps on EACH DEVICE.
1. Right-Click on the appropriate device. 2. Select QoS, Apply Policy to Interface.
3. Select the “DSCPMARK” policy. 4. Click the Input of the LAN Interface
Do this for each device! (loop to #1 above for each device)

92 © Copyright 2019, LiveAction, Inc.
Using your Voice Filter, and then refreshing the Topology, you should no longer see any BE Traffic – Remember, it may take a bit of time for Netflow to catch up.

LiveAction Lab Workbook Pt. 1
93
Lab 8.2: QoS Queueing Policy As in the prior Lab, LiveNX also makes it easy to manage your Queueing policies by either using our pre-defined templates, or create them in the LiveNX interface. You can validate how your queueing policies are performing by utilizing our QoS Tab and the CBQoS MIB. Now that you’ve verified your traffic is marked correctly through the network, using Netflow, you can create a queuing policy to protect the critical traffic. Lab Steps:
1. Right-click on the Branch1-LA Device, select QoS, and Manage QoS Settings.
2. Select the Policies Tab. 3. Click Add Policy to create a queuing policy.
94 © Copyright 2019, LiveAction, Inc.
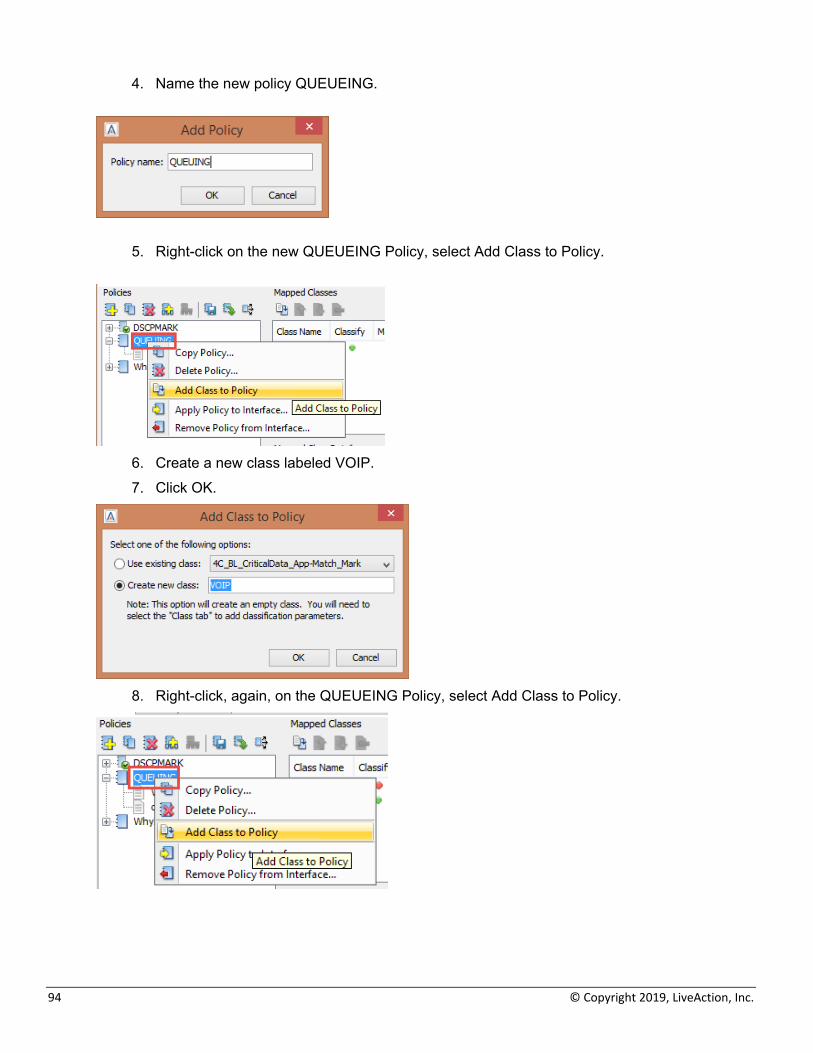
4. Name the new policy QUEUEING.
5. Right-click on the new QUEUEING Policy, select Add Class to Policy.
6. Create a new class labeled VOIP. 7. Click OK.
8. Right-click, again, on the QUEUEING Policy, select Add Class to Policy.

LiveAction Lab Workbook Pt. 1
95
9. Create a new class and label it SIGNALING. 10. Click OK
Configure VOIP Class: 1. Click the Classes Tab. 2. Select the VOIP Class. 3. Select the Match Type as DSCP. 4. Select 46 (EF). 5. Click Add Match Statement
96 © Copyright 2019, LiveAction, Inc.
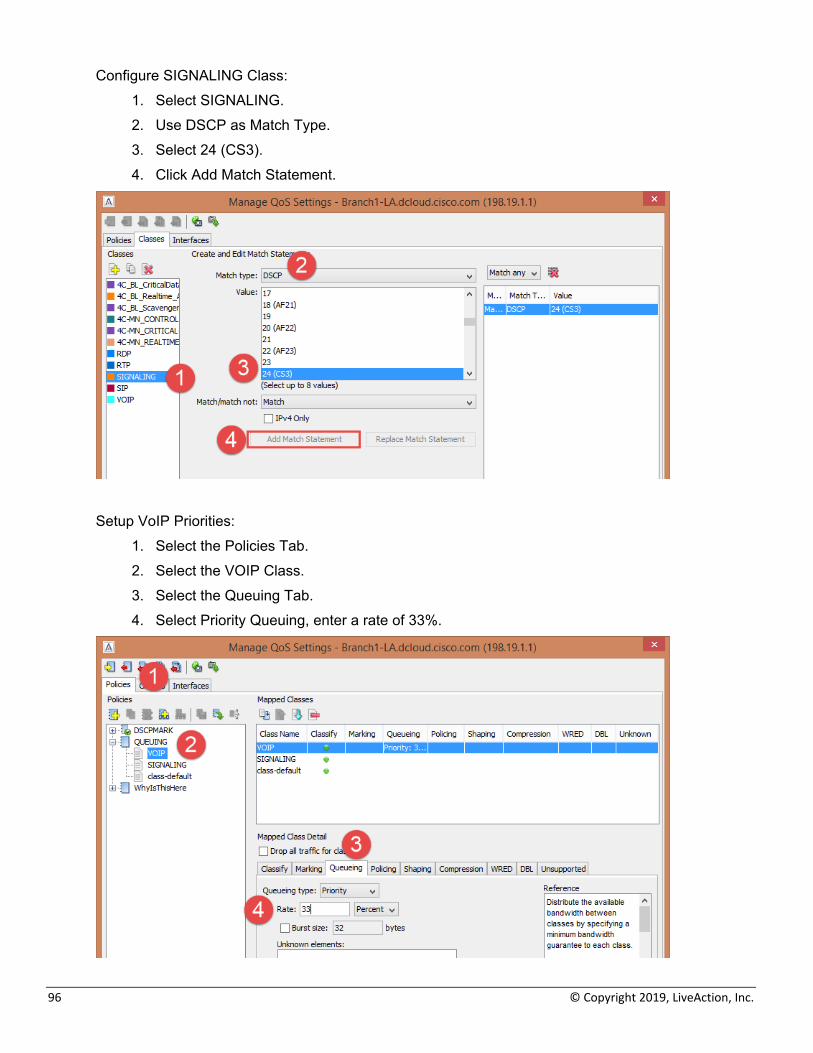
Configure SIGNALING Class: 1. Select SIGNALING. 2. Use DSCP as Match Type. 3. Select 24 (CS3). 4. Click Add Match Statement.
Setup VoIP Priorities:
1. Select the Policies Tab. 2. Select the VOIP Class. 3. Select the Queuing Tab. 4. Select Priority Queuing, enter a rate of 33%.
LiveAction Lab Workbook Pt. 1
97
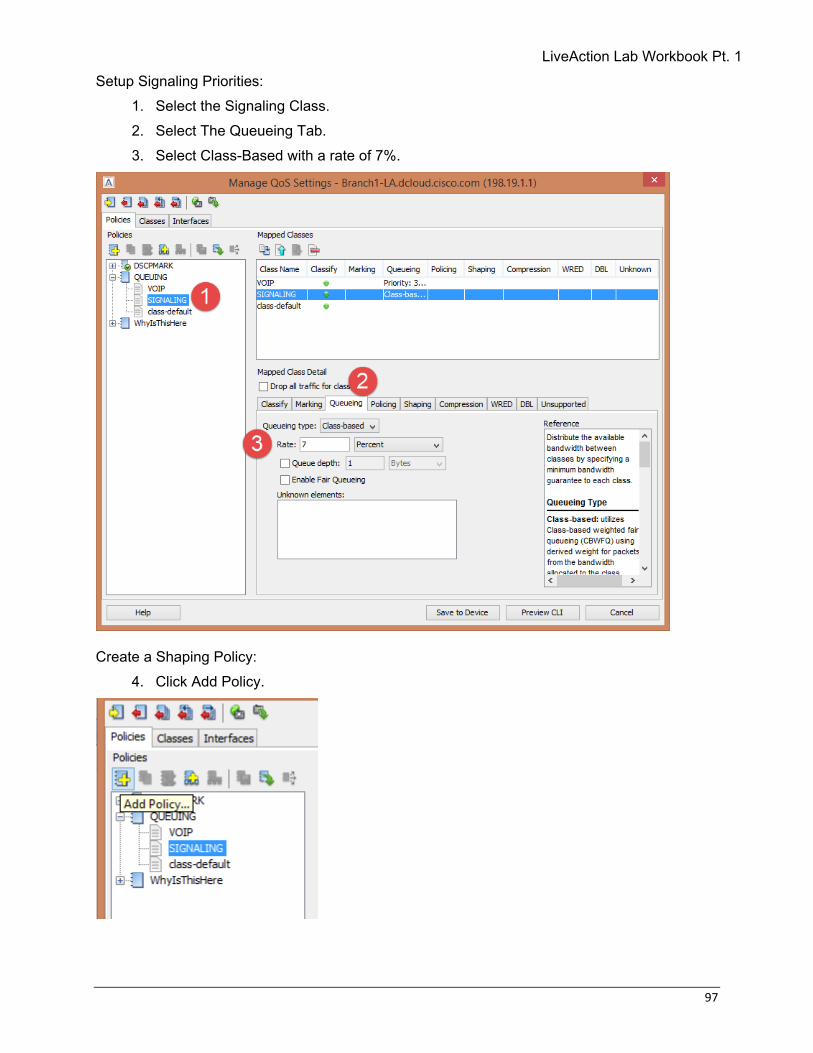
Setup Signaling Priorities: 1. Select the Signaling Class. 2. Select The Queueing Tab. 3. Select Class-Based with a rate of 7%.
Create a Shaping Policy:
4. Click Add Policy.

98 © Copyright 2019, LiveAction, Inc.
5. Give the Policy a name of Shaper.
1. Select the class-default class under Shaper. 2. Select the Shaping tab. 3. Select Average, enter 1500 Kbps.

LiveAction Lab Workbook Pt. 1
99
4. Click and Drag the QUEUEING Policy on top of class-default class for the Shaper.
Now you should see the QUEUEING Policy as part of the shaper. This allows you to reserve the percentage of BW in the shaping policy!

100 © Copyright 2019, LiveAction, Inc.
Copy the shaping policy to the other devices: 1. Select the Shaper Policy. 2. Click the three arrow icon to copy the policy. 3. Ensure the Shaper Policy is selected. 4. Select the other two devices. 5. Click OK to push the policy.
6. Click Close. 7. Click OK.

LiveAction Lab Workbook Pt. 1
101
We still need to apply the policy to the WAN interfaces. Do the following steps on EACH of the 3 devices.
8. Right-click on the WAN interface, and select QoS and Apply Policy to Interface.
9. Select the Shaper Policy and the Output for the WAN interface.
10. Click OK.
102 © Copyright 2019, LiveAction, Inc.
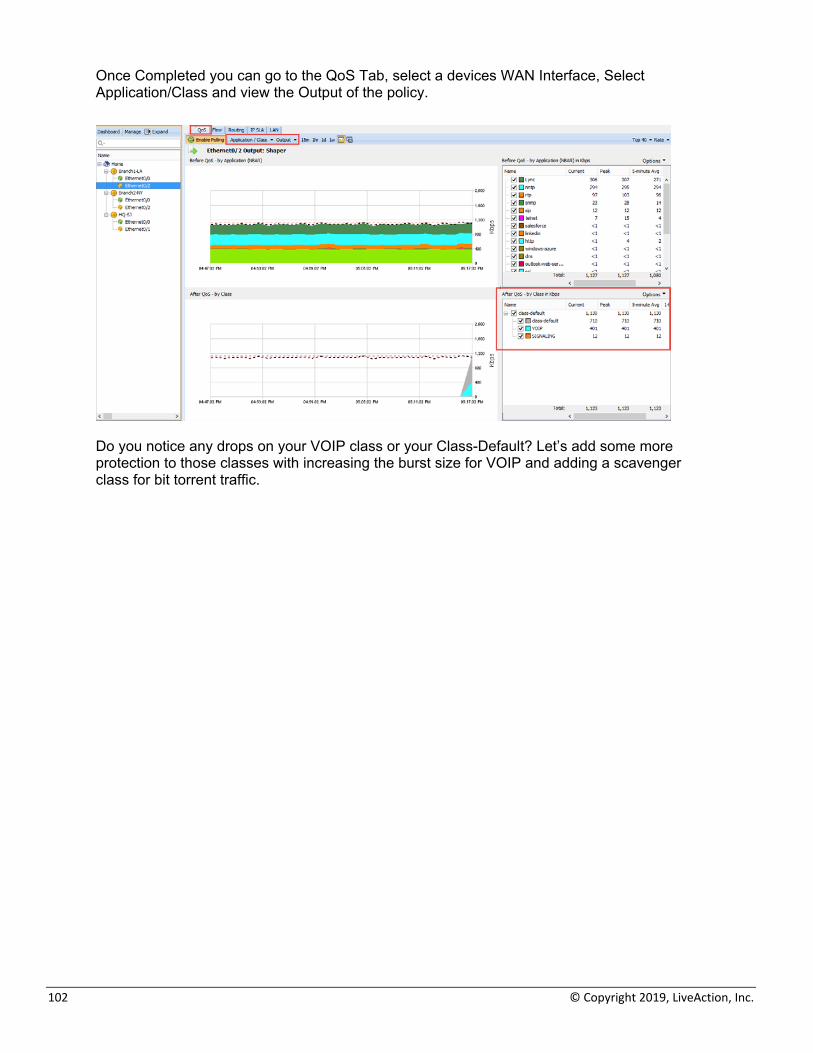
Once Completed you can go to the QoS Tab, select a devices WAN Interface, Select Application/Class and view the Output of the policy.
Do you notice any drops on your VOIP class or your Class-Default? Let’s add some more protection to those classes with increasing the burst size for VOIP and adding a scavenger class for bit torrent traffic.

LiveAction Lab Workbook Pt. 1
103
Lab 8.3: QoS Verification Managing QoS is an ongoing process where you may need to adjust your policies according to your network needs. You can use LiveAction elements such as NetFlow analysis or CBQoS Statistics to determine if policy changes are necessary. Since there seem to be drops on our device, let’s investigate the drops and add a more granular QoS configuration. Lab Steps: Select a device and select QoS and Manage QoS Settings.
1. Select the VOIP Class. 2. Click the Queueing Tab. 3. Select Burst Size of 128000.

104 © Copyright 2019, LiveAction, Inc.
Note: Configuring a burst rate is something that is not always common and should be fully understood before looking to implement in your own network.
Read more about configuring a burst rate here: http://www.cisco.com/c/en/us/td/docs/ios/12_2/qos/configuration/guide/fqos_c/qcfpolsh.html An excerpt about the math behind deciding the burst rate would be: Cisco recommends the following values for the normal and extended burst parameters: normal burst = configured rate * (1 byte)/(8 bits) * 1.5 seconds extended burst = 2 * normal burst
4. Right-click on the QUEUEING Policy. 5. Select Add Class to Policy.
6. Give the new class a label of SCAVENGER.

LiveAction Lab Workbook Pt. 1
105
1. Select the Classes Tab. 2. Select the Scavenger Class. 3. For Match Type select Protocol – Using NBAR. 4. Select both “bittorrent” and “bittorrent-networking”. 5. Click Add Match Statement for both Applications.
1. Now let’s go back to the Policies Tab 2. Select the Scavenger Class 3. Then select the Queueing Tab 4. Next select Class-based and give the class a rate of 1 percent 5. Finally select Save to Device

106 © Copyright 2019, LiveAction, Inc.
When making changes to the QUEUEING Policy it will also affect the Shaping Policy.
Copy the updated policy to other devices in the topology.
6. Select the Shaper Policy 7. Copy the Policy to Devices.
LiveAction Lab Workbook Pt. 1
107
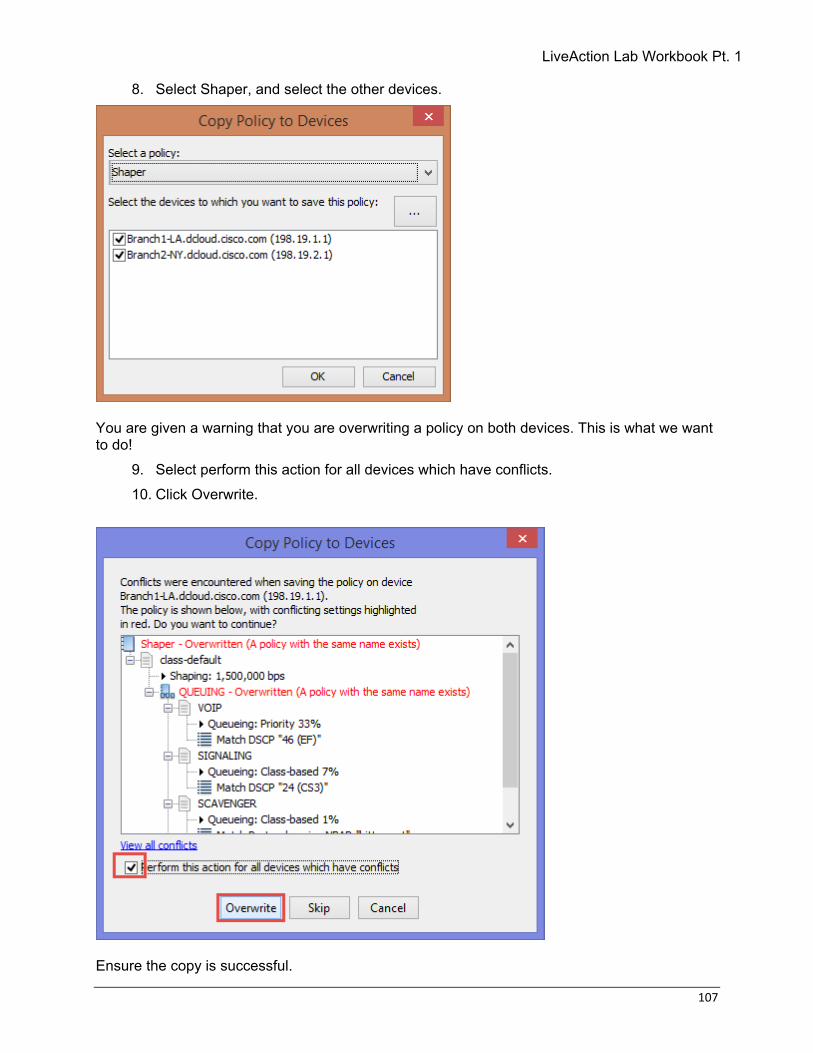
8. Select Shaper, and select the other devices.
You are given a warning that you are overwriting a policy on both devices. This is what we want to do!
9. Select perform this action for all devices which have conflicts. 10. Click Overwrite.
Ensure the copy is successful.

108 © Copyright 2019, LiveAction, Inc.
11. Click Close.
When completed you should no longer see VOIP Class drops and you should see traffic in the scavenger class in the QoS Interface View.
Good job! You have successfully created Marking and Queueing policies for your network devices! There still may be drops in the class-default, but that is the purpose of this Lab… to help you identify, and eliminate issues… so that you may discover MORE issues.

LiveAction Lab Workbook Pt. 1
109
Lab A: Appendix

110 © Copyright 2019, LiveAction, Inc.
Lab A.1: Add Device Adding devices into LiveAction and managing them properly is very important to the overall usability of LiveAction itself. Lab Steps:
12. Select File, Add Device
13. Enter 198.19.1.1 in the IP Address field. 14. Select “Use the Default SNMP connection settings”.
15. Click Next.

LiveAction Lab Workbook Pt. 1
111
16. Select “Use my default Configuration CLI connection settings”.
17. Click Next.
18. Select “Use the previous page connection settings”. 19. Click Next.
112 © Copyright 2019, LiveAction, Inc.
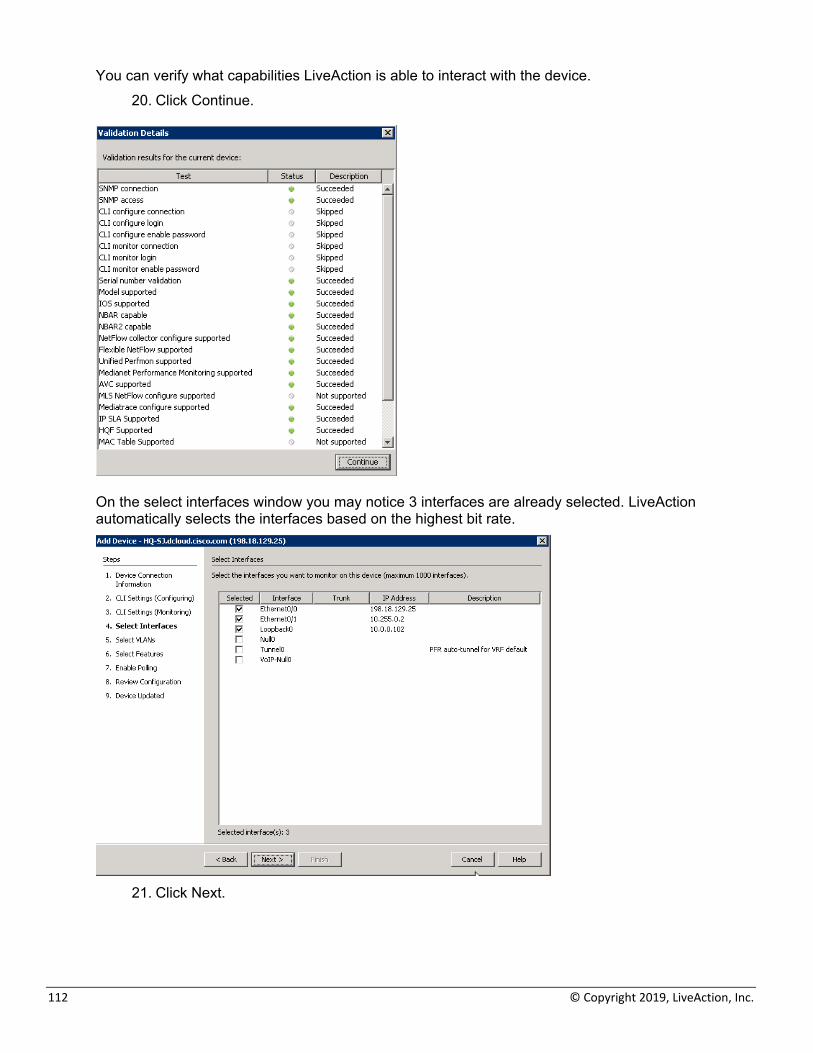
You can verify what capabilities LiveAction is able to interact with the device. 20. Click Continue.
On the select interfaces window you may notice 3 interfaces are already selected. LiveAction automatically selects the interfaces based on the highest bit rate.
21. Click Next.

LiveAction Lab Workbook Pt. 1
113
Note: Since there are no VLANs configured on this device, none will be displayed. You may monitor up to 25 configured VLANs on each device.
22. Click Next.
The Select Features dialog allows you to turn-on specific Cisco technologies using the templates included in LiveNX. This dialog displays the current IOS configuration of the device you are currently viewing. Leave this screen AS-IS.
23. Click Next.

114 © Copyright 2019, LiveAction, Inc.
24. Change the polling rate to 30 seconds. 25. Verify that ONLY the Flow & QoS boxes remain checked.
Note: Any changes to the Select Features dialog will generate a CLI push to update the current configuration. Before sending the NetFlow configurations to the device, you can verify the configurations that LiveAction created.
26. Select “Send the configuration…” radio button, if available. 27. Click Next.
LiveAction Lab Workbook Pt. 1
115
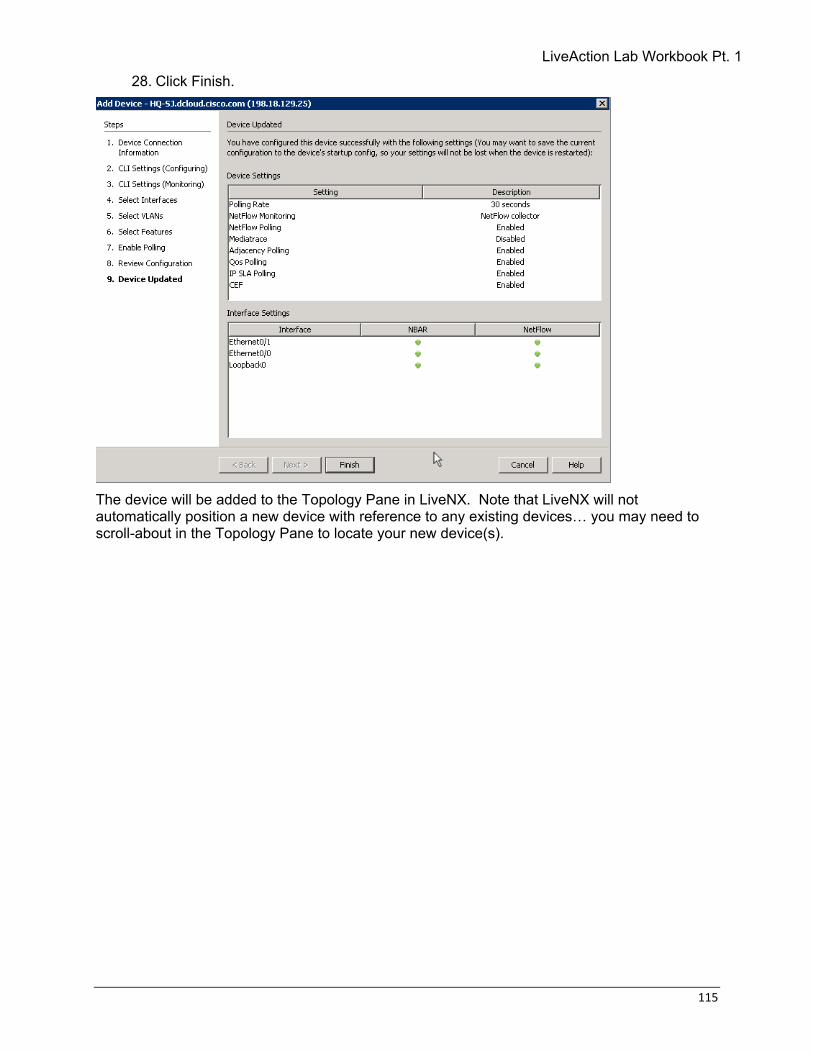
28. Click Finish.
The device will be added to the Topology Pane in LiveNX. Note that LiveNX will not automatically position a new device with reference to any existing devices… you may need to scroll-about in the Topology Pane to locate your new device(s).
116 © Copyright 2019, LiveAction, Inc.
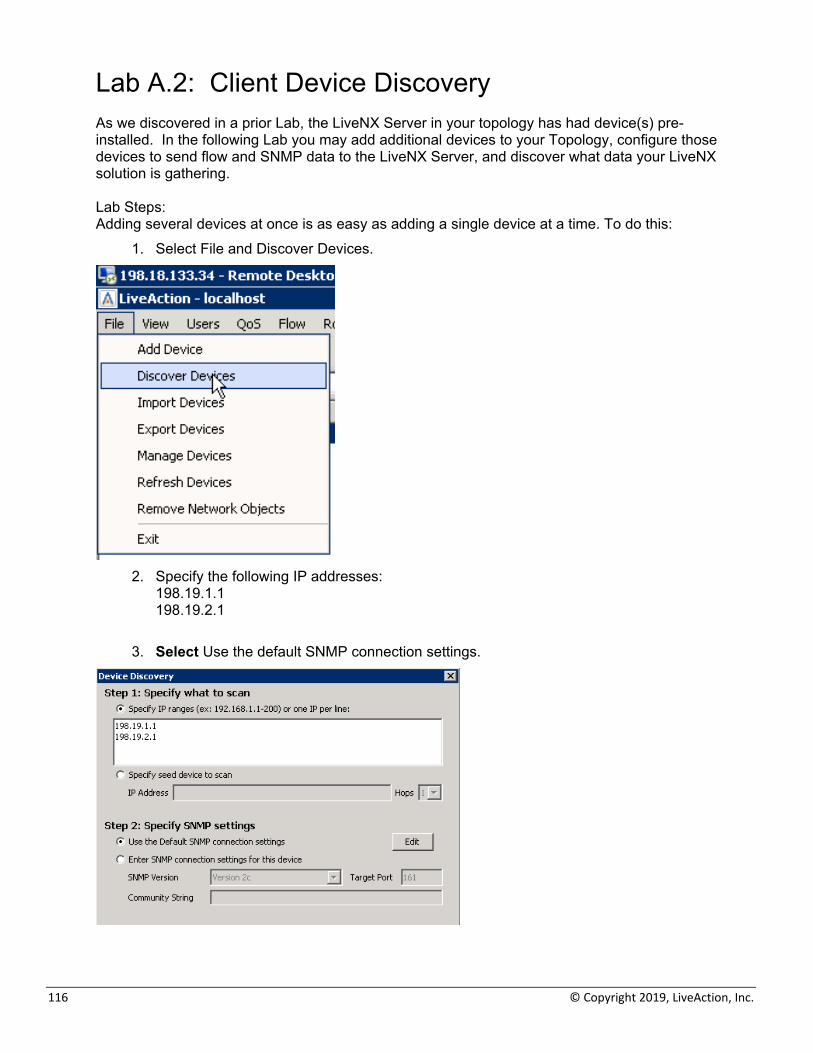
Lab A.2: Client Device Discovery As we discovered in a prior Lab, the LiveNX Server in your topology has had device(s) pre-installed. In the following Lab you may add additional devices to your Topology, configure those devices to send flow and SNMP data to the LiveNX Server, and discover what data your LiveNX solution is gathering. Lab Steps: Adding several devices at once is as easy as adding a single device at a time. To do this:
1. Select File and Discover Devices.
2. Specify the following IP addresses:
198.19.1.1 198.19.2.1
3. Select Use the default SNMP connection settings.

LiveAction Lab Workbook Pt. 1
117
Note: In the Lab infrastructure we are utilizing the Local LiveNX Node included with the Server installation. If you required access to a Remote Node in order to access the subnets or addressing in “Step 1: Specify what to scan” you would use the Specify node drop-down at the bottom of this dialog box.
4. Click OK. 5. Verify that both devices were found, and then select Add Devices.
Note: LiveNX may only discover a single router in the above steps. Your Student Pod may already be pre-configured with multiple devise. Your Instructor may direct you to add one or more devices in this lab.

118 © Copyright 2019, LiveAction, Inc.
6. Select Yes on the configure devices dialog.

LiveAction Lab Workbook Pt. 1
119
7. Use the default SNMP connection settings and then select Next
Note: You must be logged-in as the original admin user so that the LiveNX Wizard will inherit the appropriate credentials. Ask your Instructor for clarification on this, if desired.
8. Select Use my default Configuration CLI connection settings. 9. Click next.

120 © Copyright 2019, LiveAction, Inc.
10. Select Use the previous page connection settings.
11. Click Next 12. After verifying that the device validation is successful, Click Next.

LiveAction Lab Workbook Pt. 1
121
13. Select NBAR and NetFlow for both devices, Click Next.
14. Select all technologies excepting LAN. 15. Set the interval to 30 seconds for each device, Click Next.
Note: For our class Labs we are gathering data every 30 seconds in order to reduce wait time when we make changes. In a production environment this may generate more network traffic than desired.

122 © Copyright 2019, LiveAction, Inc.
16. Select Send Updates to Devices and click Send.
17. Once the updates are pushed successfully, click next.

LiveAction Lab Workbook Pt. 1
123
18. Click finish to add the devices into the topology.
Now that you have added three devices to the topology, they should look familiar to the image below. What is important to remember is that you should only bring in interfaces that will have interesting traffic, to you, traversing them. We will not need all of the interfaces that have been included, so in one of the next Labs we’ll remove the unneeded interfaces.

124 © Copyright 2019, LiveAction, Inc.
Lab A.3: Export/Import Device Configuration Lab Steps:
1. From the File Menu select Export Devices.
2. Deselect Ethernet0/1 and Loopback0 from the 198.19.1.1 and 198.19.2.1 devices.
3. Select Export to csv.

LiveAction Lab Workbook Pt. 1
125
4. On the Export window give the file a name. 5. Export the csv to the desktop, or appropriate directory.
6. Close the export devices window. 7. Select File and Import Devices.
8. Select the file you previously exported.
126 © Copyright 2019, LiveAction, Inc.
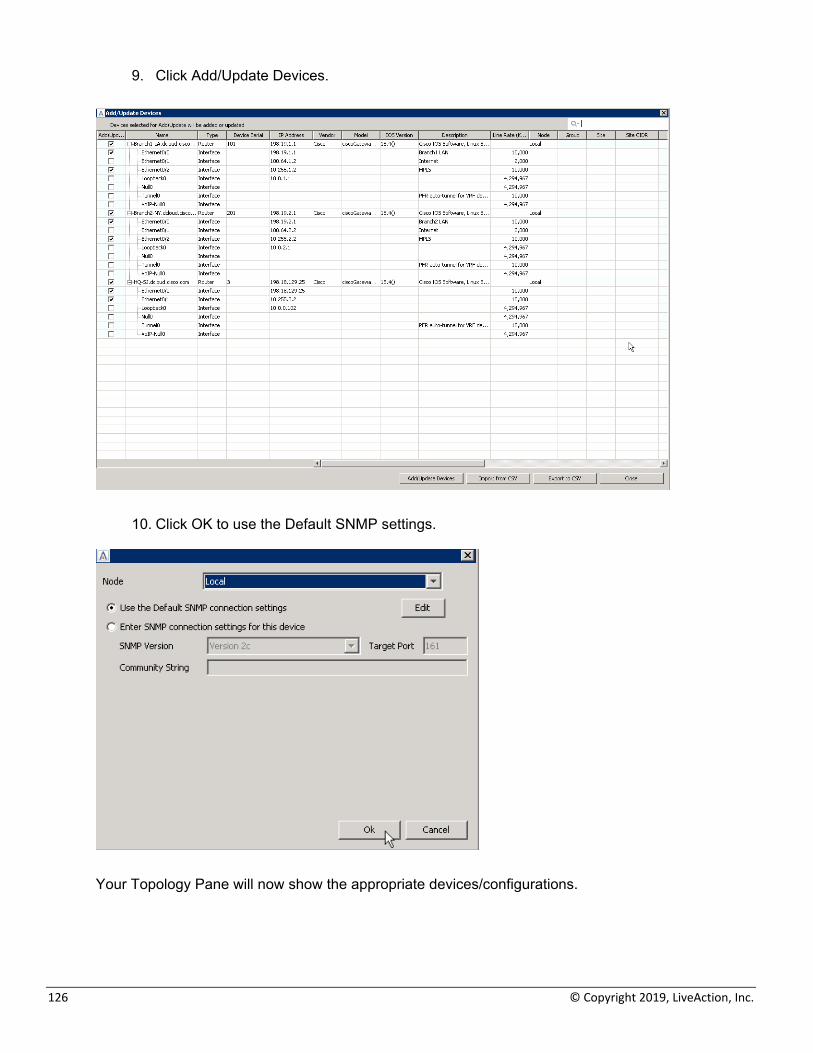
9. Click Add/Update Devices.
10. Click OK to use the Default SNMP settings.
Your Topology Pane will now show the appropriate devices/configurations.
LiveAction Lab Workbook Pt. 1
127
Lab A.4: Saving Server Configurations Prior to upgrading the LiveAction Software, or to retain existing Server configuration for use in the case of a hardware failure or misconfiguration, the current configuration file may be Exported to a local or network drive. Lab Steps:
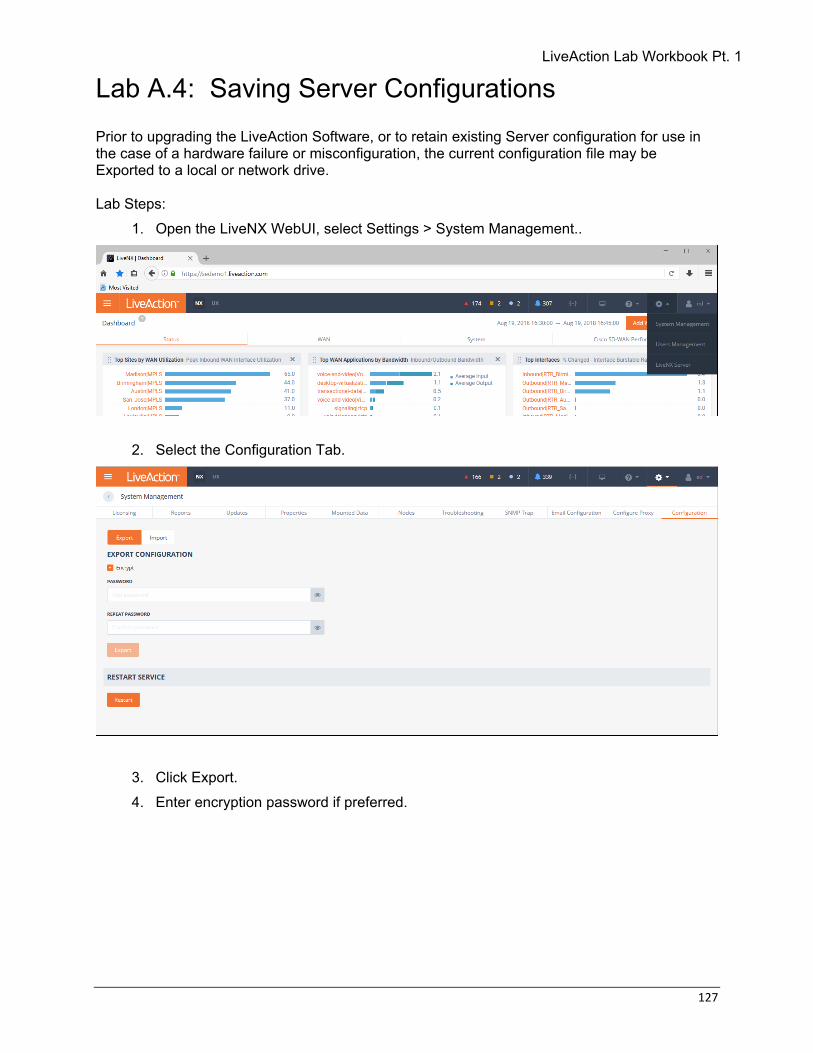
1. Open the LiveNX WebUI, select Settings > System Management..
2. Select the Configuration Tab.
3. Click Export. 4. Enter encryption password if preferred.

128 © Copyright 2019, LiveAction, Inc.
5. Select an appropriate place to save the file, give the file a name, then click Save.

LiveAction Lab Workbook Pt. 1
129
Lab A.5: Connect via Remote Desktop Connection A direct connection from the LiveNX Client installed on your workstation is the most efficient method to connect, But you may use RDC as an alternate way to connect to your Student Pod. SKIP this Lab if directly connecting with the LiveNX Client on your local workstation. To connect useing Microsoft Remote Desktop on Windows, or a compatible Remote Desktop client on Linux and Macintosh, follow the steps below. On Windows you can typically find Remote Desktop in START > ALL PROGRAMS > ACCESSORIES.
Note: The instructor may provide you with a Username and Password to connect via RDC. Please make sure you write these on YOUR Class Worksheet. Use information from the Class Worksheet to connect to your assigned Pod.
Lab Steps: Connect to the virtual Windows 7 Workstation using the IP Address, username, and password pre-printed on the Class Worksheet, unless otherwise instructed.
1. Launch a Remote Desktop Connection. 2. BEFORE selecting Connect, click the General tab. (On Macintosh this will be the
Preferences menu and Login tab.) DIAGRAM
a. Enter the following fields:
•Computer: <ipaddress> :20201 (From your Lab Access worksheet) •User name: administrator (or otherwise defined by instructor)
Note: Since you are connected to your Student Pod via a VPN, you may need to CHANGE the domain in the RDC User name field to LOCAL.

130 © Copyright 2019, LiveAction, Inc.
3. Set the RDC session properties on the Display tab so that your video is a minimum of 1200x800 resolution… this may NOT be changed once the connection is active. See next page for example.
DIAGRAM
4. Select Connect. 5. Enter the workstation password: C1sco12345 (or otherwise defined by instructor).
DIAGRAM
6. Click OK.
Once successfully connected to your Pod you will see the Windows7 Desktop, and be able to access the LiveNX Server, Client, and other pod resources.
Note: Occasionally Remote Desktop may freeze its connection to the Pod workstation. If this happens, close the Remote Desktop window and start again at Step 1 above. This will continue your lab session and will generally not lose any work.