lab 14 - dna restriction analysis - goldie's room biology/ap labs pdf/v2013/ap lab 14 -...
TRANSCRIPT
Name: ______________________________ AP Biology – Lab 14
LAB 14 – DNA Restriction Analysis
Introduction: DNA restriction analysis is at the heart of recombinant DNA technology and of the laboratories in this course. The ability to cut DNA predictably and precisely enables DNA molecules to be manipulated and recombined at will. The fact that discrete ends of like-sized DNA fragments are seen in one lane of an agarose gel shows that each of the more than 1 billion DNA molecules present in each restriction reaction was cut in precisely the same place.
This protocol introduces the analysis of DNA using restriction enzymes. Three samples of purified DNA from bacteriophage (48,502 bp in length) are incubated at 37°C, each with one of three restriction
endonucleases: EcoRI, BamHI, and HinddIII. Each enzyme has five or more restriction sites in DNA
and therefore produces six or more restriction fragments of varying lengths. A fourth sample of DNA, the negative control, is incubated without an endonuclease and remains intact.
Restriction endonucleases, or restriction enzymes, are essential tools in recombinant DNA methodology. Several hundred have been isolated from a variety of prokaryotic organisms. Restriction endonucleases are named according to a specific system of nomenclature. The letters refer to the organism from which the enzyme was isolated. The first letter of the name stands for the genus name of the organism. The next two letters represents the second word, or species name. The fourth letter (if there is one) represents the strain of the organism. Roman numerals indicate whether the particular enzyme was the first isolated, the second, or so on.
Examples:
EcoRI – Escherichia coli strain RY13 first endonuclease isolated
HaeIII – Haemophilus aegyptus second endonuclease isolated
BamI – Bacillus amyloli first endonuclease isolated
HindIII – Haemophilus influenzae third endonuclease isolated
PstI – Providencia stuartii first endonuclease isolated
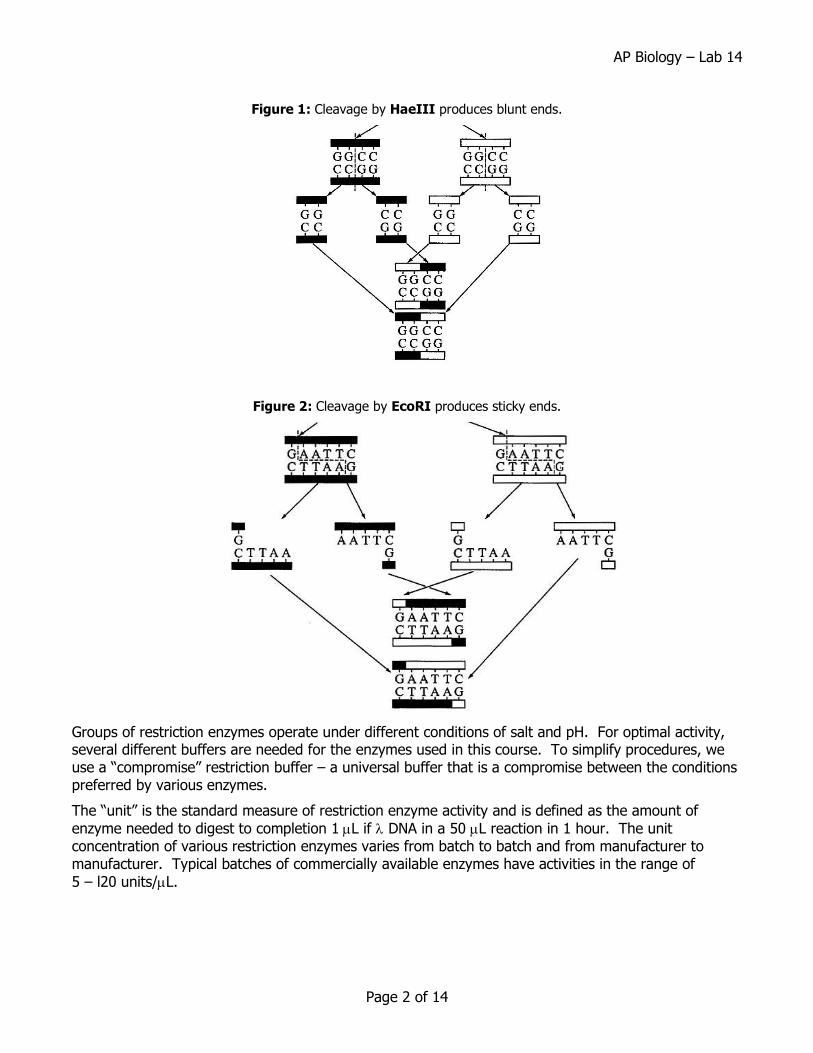
Restriction endonucleases recognize specific DNA sequences in double-stranded DNA (usually a four to six base pair sequence of nucleotides) and digest the DNA at these sites. The result is the production of fragments of DNA of various lengths. Some restriction enzymes cut cleanly through the DNA helix at the same position on both strands to produce fragments with blunt ends (Figure 1). Other endonucleases cleave each strand off-center at specific nucleotides to produce fragments with “overhangs”, or sticky ends (Figure 2). By using the same restriction enzyme to “cut” DNA from two different organisms, complementary sticky ends will be produced and can allow the DNA from two sources to be “recombined”.
AP Biology – Lab 14
Page 2 of 14
Figure 1: Cleavage by HaeIII produces blunt ends.
Figure 2: Cleavage by EcoRI produces sticky ends.
Groups of restriction enzymes operate under different conditions of salt and pH. For optimal activity, several different buffers are needed for the enzymes used in this course. To simplify procedures, we use a “compromise” restriction buffer – a universal buffer that is a compromise between the conditions preferred by various enzymes.
The “unit” is the standard measure of restriction enzyme activity and is defined as the amount of
enzyme needed to digest to completion 1L if DNA in a 50 L reaction in 1 hour. The unit concentration of various restriction enzymes varies from batch to batch and from manufacturer to manufacturer. Typical batches of commercially available enzymes have activities in the range of
5 – l20 units/L.
AP Biology – Lab 14
Page 3 of 14
Gel Electrophoresis When any molecule enters an electrical field, the mobility or speed at which it will move is influenced by the charge of the molecule, the strength of the electrical field, the size and shape of the molecule, and the density of the medium (in this case, agarose gel) through which it is migrating. When all molecules are positioned at a uniform starting site on a gel and the gel is placed in a chamber containing a buffer solution and electricity is applied, the molecules will migrate and appear as bands when stained. Nucleic acids, like DNA and RNA, move because of the charged phosphate groups in the backbone of the DNA molecule. Because the phosphates are negatively charged at neutral pH, the DNA will migrate through the gel towards the positive electrode. In this exercise, we will use an agarose gel. In agarose, the migration rate of linear fragments of DNA is inversely proportional to their size; the smaller the DNA molecule, the faster it migrates through the gel.
Making DNA Visible DNA is colorless, so DNA fragments in the gel cannot be seen during electrophoresis. A loading dye containing two blue dyes is added to the DNA solution. The loading dye does not stain the DNA itself, but makes it easier to load the gels and monitor the progress of the DNA electrophoresis. The dye fronts migrate toward the positive end of the gel, just like the DNA fragments. The “faster” dye about equals DNA fragments of approximately 500 bp, while the “slower” dye replicates the migration of DNA fragments about 5 kb in size.
In this lab, we will use the Fast Blast DNA stain to attach to the DNA trapped in the agarose gel when we are finished applying the current. When the bands are visible, we should be able to compare the DNA restriction fragments of each sample and also to estimate their size compared to bands in which the sizes are known.
Reliability of DNA Evidence
Two major factors affecting the reliability of DNA fingerprinting technology in forensics are population genetics and genetic statistics. In humans, there are thousands of RFLP loci or DNA segments that can be selected and used from fingerprinting analysis. Depending on demographic factors such as ethnicity or geographic isolation, some segments will show more variation than others.
Some populations show much less variation in particular DNA segments than others. The degree of variation will affect the statistical odds of more than one individual having the same sequence. If 90% of a given population has the same frequency in its DNA fingerprinting pattern for a certain DNA segment, then very little information will be attained. But if the frequency of a DNA pattern turning up in a population for a particular segment is extremely low, then this segment can serve as a powerful tool to discriminate between individuals in that population. Different populations show different patterns in their genotypes due to the contributions made to their individual gene pools over time.
Therefore, in analyzing how incriminating the DNA evidence is, one needs to ask the question: “Statistically, how many people in a population may have the same pattern as that taken from a crime scene: 1 in 1,000,000? 1 in 10,000? Or, 1 in 10?”
DNA Used in this Simulation Because it is inexpensive and readily available, purified DNA from bacteriophage is most suitable for
demonstrating the concept of DNA restriction. Most commercially available is derived from a temperature-sensitive lysogen of E. coli called cI857 and is 48,502 base pairs in length. Restriction of chromosomal DNA, even from a simple organism such as E. coli, will generate thousands of DNA fragments that appear as a smear in an agarose gel.
AP Biology – Lab 14
Page 4 of 14
Procedure: PRELAB PREPARATION 1. Prepare 1X Tris/Borate/EDTA (TBE) buffer, 0.8% agarose, 2X restriction buffer, and 20L of
0.1g/L DNA.
SET UP RESTRICTION DIGEST 2. Use a permanent marker to label four 1.5 mL tubes, in which restriction reactions will be
performed:
B = BamHI E = EcoRI H = HindIII – = no enzyme
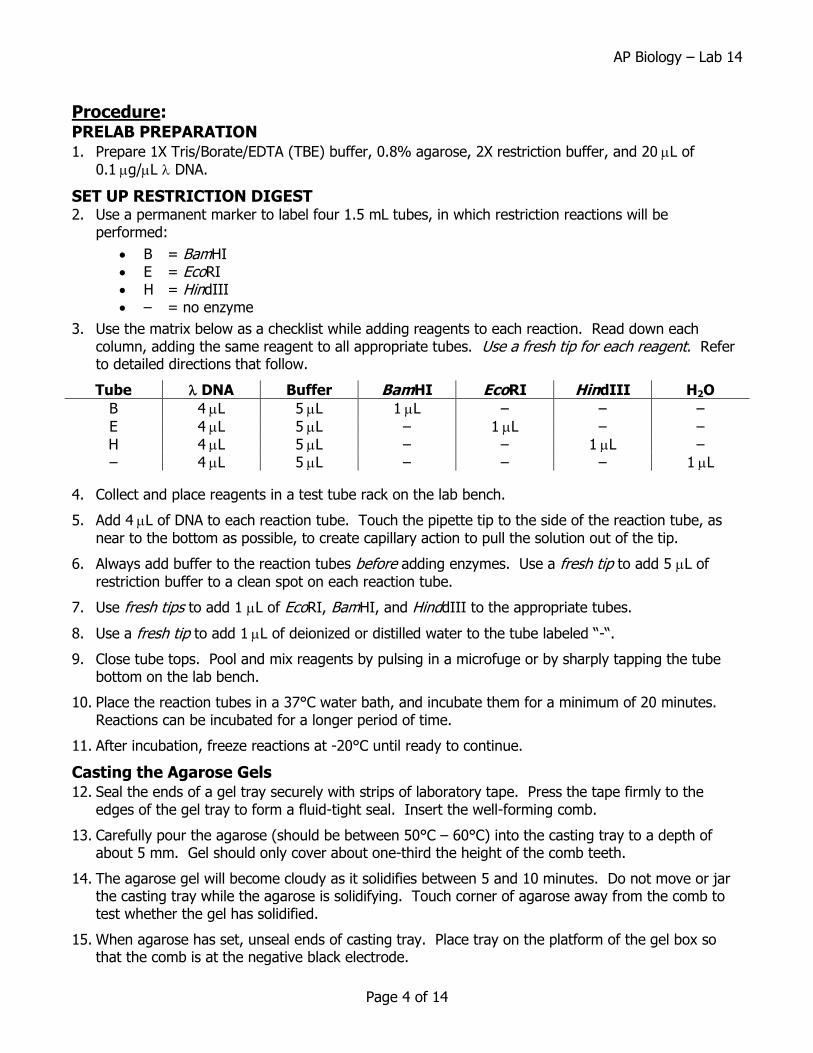
3. Use the matrix below as a checklist while adding reagents to each reaction. Read down each column, adding the same reagent to all appropriate tubes. Use a fresh tip for each reagent. Refer to detailed directions that follow.
Tube DNA Buffer BamHI EcoRI HindIII H2O
B 4L 5L 1L – – –
E 4L 5L – 1L – –
H 4L 5L – – 1L –
– 4L 5L – – – 1L
4. Collect and place reagents in a test tube rack on the lab bench.
5. Add 4L of DNA to each reaction tube. Touch the pipette tip to the side of the reaction tube, as
near to the bottom as possible, to create capillary action to pull the solution out of the tip.
6. Always add buffer to the reaction tubes before adding enzymes. Use a fresh tip to add 5 L of
restriction buffer to a clean spot on each reaction tube.
7. Use fresh tips to add 1 L of EcoRI, BamHI, and HinddIII to the appropriate tubes.
8. Use a fresh tip to add 1L of deionized or distilled water to the tube labeled “-“.
9. Close tube tops. Pool and mix reagents by pulsing in a microfuge or by sharply tapping the tube bottom on the lab bench.
10. Place the reaction tubes in a 37°C water bath, and incubate them for a minimum of 20 minutes. Reactions can be incubated for a longer period of time.
11. After incubation, freeze reactions at -20°C until ready to continue.
Casting the Agarose Gels 12. Seal the ends of a gel tray securely with strips of laboratory tape. Press the tape firmly to the
edges of the gel tray to form a fluid-tight seal. Insert the well-forming comb.
13. Carefully pour the agarose (should be between 50°C – 60°C) into the casting tray to a depth of about 5 mm. Gel should only cover about one-third the height of the comb teeth.
14. The agarose gel will become cloudy as it solidifies between 5 and 10 minutes. Do not move or jar the casting tray while the agarose is solidifying. Touch corner of agarose away from the comb to test whether the gel has solidified.
15. When agarose has set, unseal ends of casting tray. Place tray on the platform of the gel box so that the comb is at the negative black electrode.
AP Biology – Lab 14
Page 5 of 14
16. Fill box with 1X TBE buffer, to a level that just covers the entire surface of the gel. Too much buffer will channel current over top of the gel rather than through it, increasing the time required to separate DNA.
17. Gently remove comb, taking care not to rip the wells. This is sometimes done before adding buffer, but buffer solution helps to lubricate the comb. This generally avoids tearing the gel.
18. Make sure that the sample wells left by the comb are completely submerged. If “dimples” appear around the wells, slowly add buffer until they disappear.
19. If there is not enough time to continue, cover the electrophoresis tank and save gel until ready to continue. Gel will remain in good condition for at least several days if it is completely submerged in buffer.
Loading the Agarose Gels and Electrophoresis of Samples 20. Add 1 L of loading dye into each reaction tube. Once completed, pulse the tubes in a balanced
configuration in the microcentrifuge to make sure the samples are transferred to the bottom of the tubes.
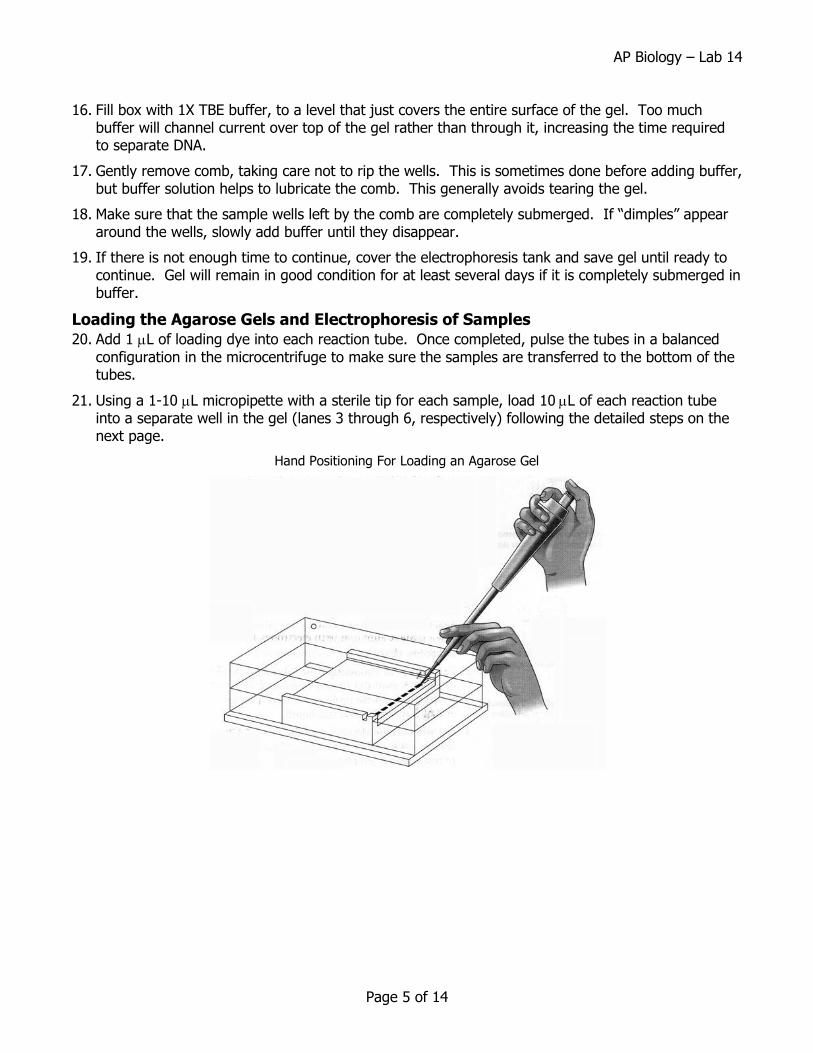
21. Using a 1-10 L micropipette with a sterile tip for each sample, load 10L of each reaction tube into a separate well in the gel (lanes 3 through 6, respectively) following the detailed steps on the next page.
Hand Positioning For Loading an Agarose Gel
AP Biology – Lab 14
Page 6 of 14
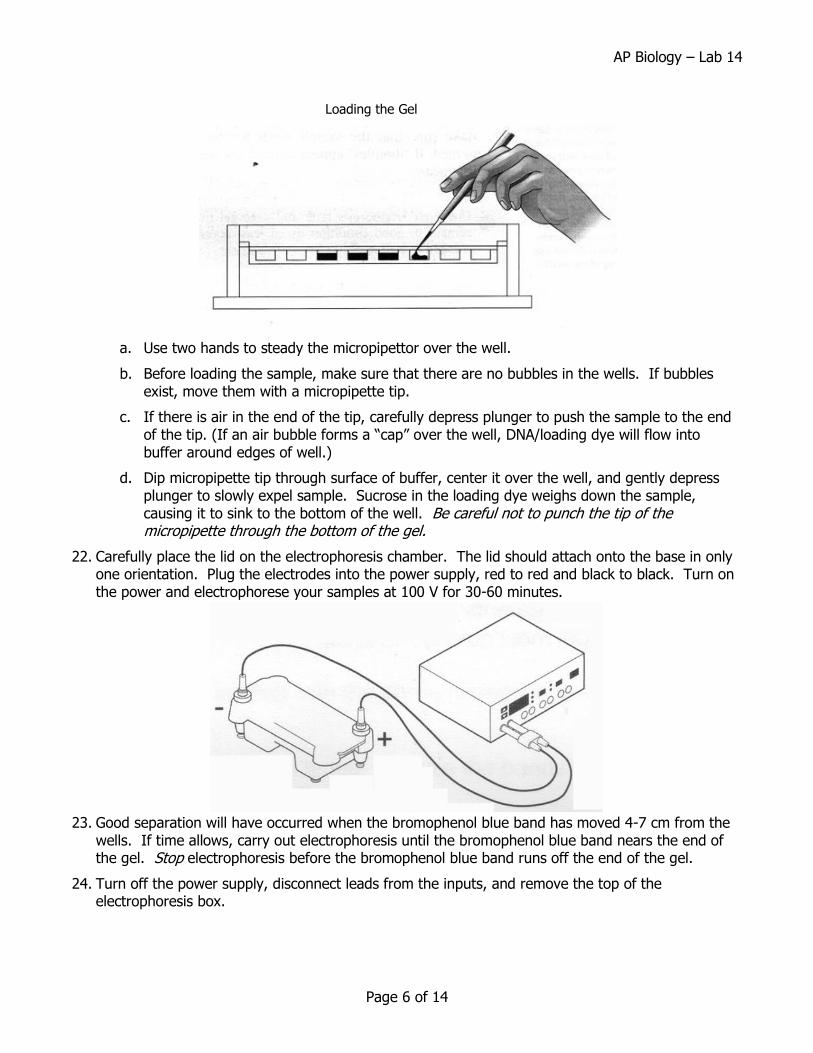
Loading the Gel
a. Use two hands to steady the micropipettor over the well.
b. Before loading the sample, make sure that there are no bubbles in the wells. If bubbles exist, move them with a micropipette tip.
c. If there is air in the end of the tip, carefully depress plunger to push the sample to the end of the tip. (If an air bubble forms a “cap” over the well, DNA/loading dye will flow into buffer around edges of well.)
d. Dip micropipette tip through surface of buffer, center it over the well, and gently depress plunger to slowly expel sample. Sucrose in the loading dye weighs down the sample, causing it to sink to the bottom of the well. Be careful not to punch the tip of the micropipette through the bottom of the gel.
22. Carefully place the lid on the electrophoresis chamber. The lid should attach onto the base in only one orientation. Plug the electrodes into the power supply, red to red and black to black. Turn on the power and electrophorese your samples at 100 V for 30-60 minutes.
23. Good separation will have occurred when the bromophenol blue band has moved 4-7 cm from the wells. If time allows, carry out electrophoresis until the bromophenol blue band nears the end of the gel. Stop electrophoresis before the bromophenol blue band runs off the end of the gel.
24. Turn off the power supply, disconnect leads from the inputs, and remove the top of the electrophoresis box.
AP Biology – Lab 14
Page 7 of 14
Visualization of DNA Fragments 25. Carefully remove the gel and tray from the gel box. DO NOT DROP YOUR GEL AS IT IS
SLIPPERLY! Slide the gel carefully (or use a spatula) to the staining tray. There are three options for staining. Check with the teacher before going on.
Quick Stain with Fast Blast
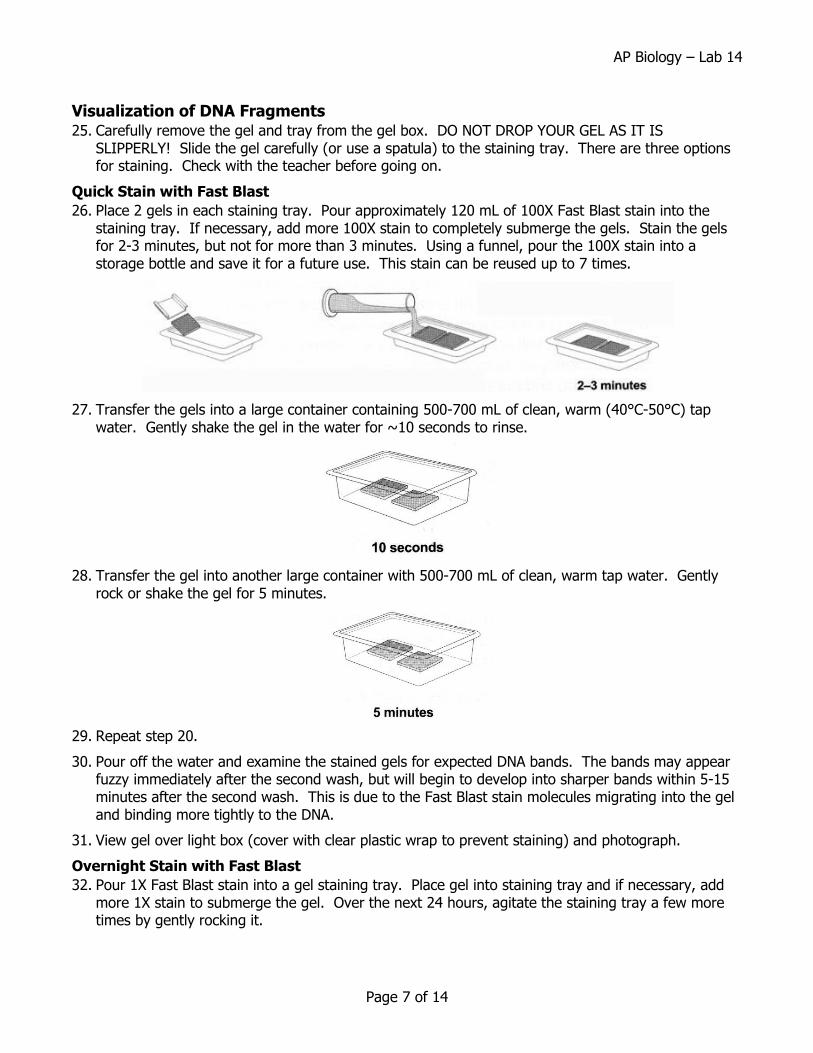
26. Place 2 gels in each staining tray. Pour approximately 120 mL of 100X Fast Blast stain into the staining tray. If necessary, add more 100X stain to completely submerge the gels. Stain the gels for 2-3 minutes, but not for more than 3 minutes. Using a funnel, pour the 100X stain into a storage bottle and save it for a future use. This stain can be reused up to 7 times.
27. Transfer the gels into a large container containing 500-700 mL of clean, warm (40°C-50°C) tap water. Gently shake the gel in the water for ~10 seconds to rinse.
28. Transfer the gel into another large container with 500-700 mL of clean, warm tap water. Gently rock or shake the gel for 5 minutes.
29. Repeat step 20.
30. Pour off the water and examine the stained gels for expected DNA bands. The bands may appear fuzzy immediately after the second wash, but will begin to develop into sharper bands within 5-15 minutes after the second wash. This is due to the Fast Blast stain molecules migrating into the gel and binding more tightly to the DNA.
31. View gel over light box (cover with clear plastic wrap to prevent staining) and photograph.
Overnight Stain with Fast Blast
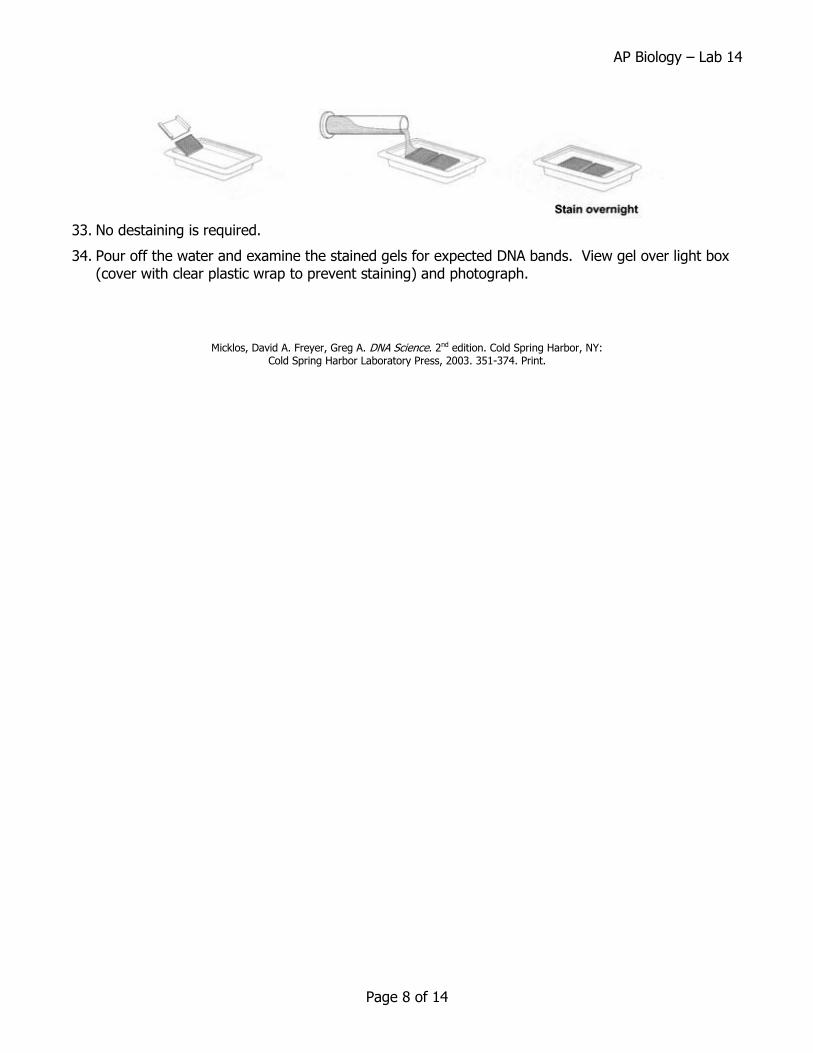
32. Pour 1X Fast Blast stain into a gel staining tray. Place gel into staining tray and if necessary, add more 1X stain to submerge the gel. Over the next 24 hours, agitate the staining tray a few more times by gently rocking it.
AP Biology – Lab 14
Page 8 of 14
33. No destaining is required.
34. Pour off the water and examine the stained gels for expected DNA bands. View gel over light box (cover with clear plastic wrap to prevent staining) and photograph.
Micklos, David A. Freyer, Greg A. DNA Science. 2nd edition. Cold Spring Harbor, NY: Cold Spring Harbor Laboratory Press, 2003. 351-374. Print.
AP Biology – Lab 14
Page 9 of 14
PRE-LAB QUESTIONS 1. The electrophoresis apparatus creates an electrical field with positive and negative poles at the
ends of the gel. DNA molecules are negatively charged. To which electrode pole of the electrophoresis field would you expect DNA to migrate?
________________________________________________________________________________
________________________________________________________________________________
________________________________________________________________________________
________________________________________________________________________________
2. What color of the electrophoresis apparatus represents the negative pole?
________________________________________________________________________________
________________________________________________________________________________
________________________________________________________________________________
________________________________________________________________________________
3. After DNA samples are loaded into the sample wells, they are “forced” to move through the gel matrix. What size fragments (large vs. small) would you expect to move toward the opposite end of the gel most quickly? Explain.
________________________________________________________________________________
________________________________________________________________________________
________________________________________________________________________________
________________________________________________________________________________
4. Which fragments (large vs. small) are expected to travel the shortest distance from the well? Explain.
________________________________________________________________________________
________________________________________________________________________________
________________________________________________________________________________
________________________________________________________________________________
5. How can a mutation that alters a recognition site be detected by gel electrophoresis?
________________________________________________________________________________
________________________________________________________________________________
________________________________________________________________________________
________________________________________________________________________________

AP Biology – Lab 14
Page 10 of 14
6. A certain restriction enzyme digest results in DNA fragments of the following sizes: 4000 bp, 2500 bp, 2000 bp, and 400 bp. In the space below, sketch the resulting separation by electrophoresis. Show wells, starting point, positive and negative electrodes, and the resulting bands (labeled with their respective sizes, of course).
AP Biology – Lab 14
Page 11 of 14
POST-LAB QUESTIONS 7. Why is water added to the tube labeled “–” when preparing the digest?
________________________________________________________________________________
________________________________________________________________________________
________________________________________________________________________________
________________________________________________________________________________
8. What is the function of the compromise restriction buffer?
________________________________________________________________________________
________________________________________________________________________________
________________________________________________________________________________
________________________________________________________________________________
9. What are two functions of the loading dye?
________________________________________________________________________________
________________________________________________________________________________
________________________________________________________________________________
________________________________________________________________________________
10. Troubleshooting electrophoresis. What would occur…
a. …if the gel box is filled with distilled water instead of TBE buffer?
_____________________________________________________________________________
_____________________________________________________________________________
_____________________________________________________________________________
_____________________________________________________________________________
b. …if the electrodes are reversed?
_____________________________________________________________________________
_____________________________________________________________________________
_____________________________________________________________________________
_____________________________________________________________________________
AP Biology – Lab 14
Page 12 of 14
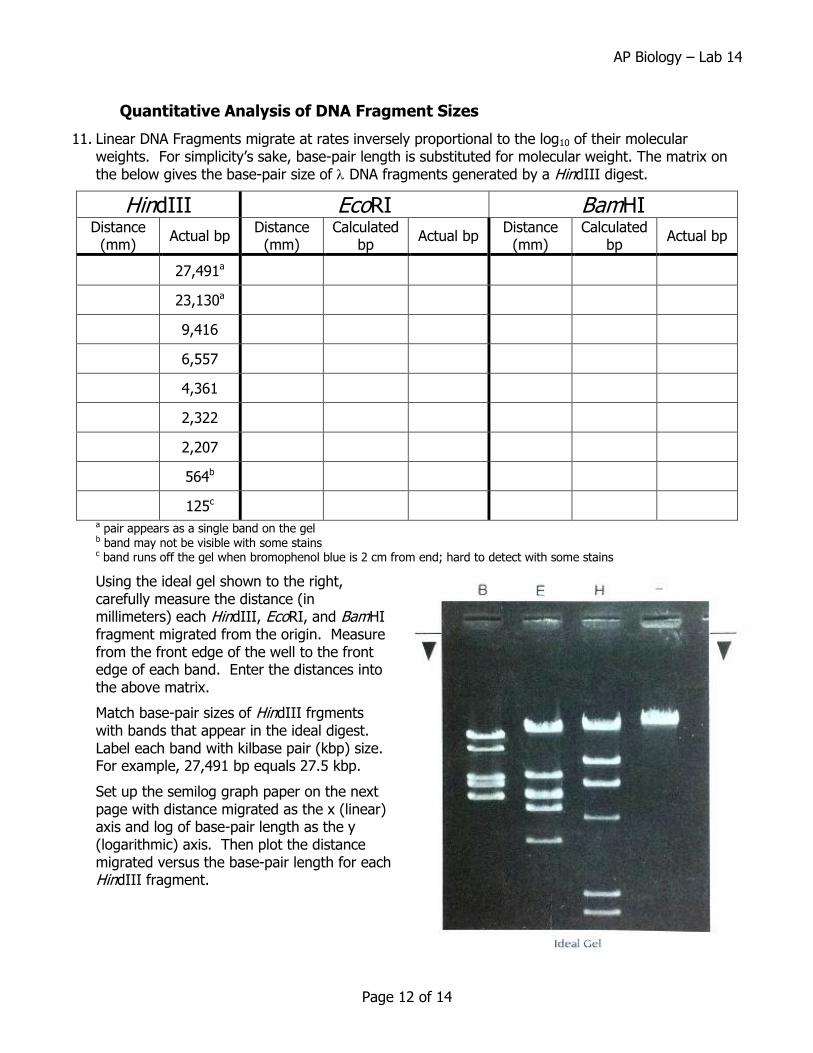
Quantitative Analysis of DNA Fragment Sizes
11. Linear DNA Fragments migrate at rates inversely proportional to the log10 of their molecular weights. For simplicity’s sake, base-pair length is substituted for molecular weight. The matrix on the below gives the base-pair size of DNA fragments generated by a HindIII digest.
HindIII EcoRI BamHI Distance
(mm) Actual bp
Distance (mm)
Calculated bp
Actual bp Distance
(mm) Calculated
bp Actual bp
27,491a
23,130a
9,416
6,557
4,361
2,322
2,207
564b
125c a pair appears as a single band on the gel b band may not be visible with some stains c band runs off the gel when bromophenol blue is 2 cm from end; hard to detect with some stains
Using the ideal gel shown to the right, carefully measure the distance (in millimeters) each HindIII, EcoRI, and BamHI fragment migrated from the origin. Measure from the front edge of the well to the front edge of each band. Enter the distances into the above matrix.
Match base-pair sizes of HindIII frgments with bands that appear in the ideal digest. Label each band with kilbase pair (kbp) size. For example, 27,491 bp equals 27.5 kbp.
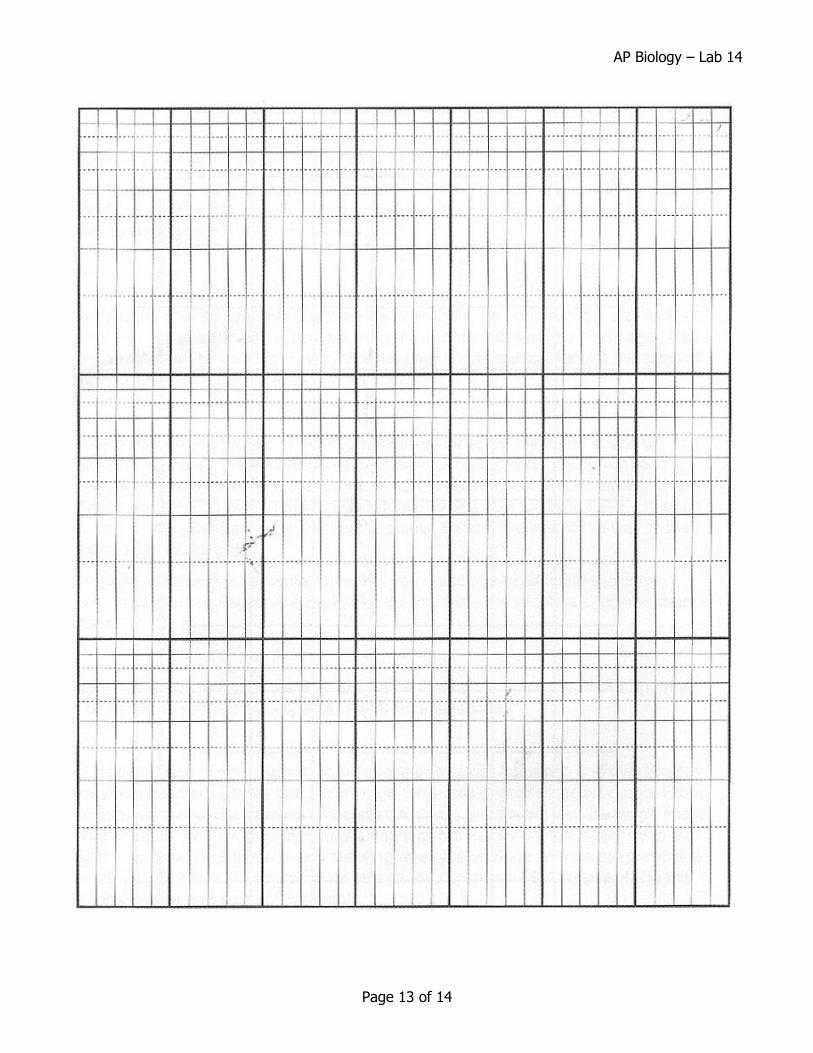
Set up the semilog graph paper on the next page with distance migrated as the x (linear) axis and log of base-pair length as the y (logarithmic) axis. Then plot the distance migrated versus the base-pair length for each HindIII fragment.
AP Biology – Lab 14
Page 13 of 14
AP Biology – Lab 14
Page 14 of 14
12. Now, locate on the x axis the distance migrated by the first EcoRI fragment. Use a ruler to draw a vertical line (lightly in pencil) from this point to its intersection with the best-fit data line. Extend a horizontal line (again, lightly in pencil) from this point on the best-fit line to the y axis. This gives the base-pair size of this EcoRI fragment.
Repeat the above steps for each remaining EcoRI and BamHI fragments on the ideal gel. Enter the results in the calculated base-pair columns for each digest.
Enter the actual base-pair size of EcoRI and BamHI fragments (as provided by your teacher) into the actual base-pair column.
For which fragment sizes was your graph most accurate? For which fragment sizes was it least accurate? What does this tell you about the resolving ability of agarose gel electrophoresis?
________________________________________________________________________________
________________________________________________________________________________
________________________________________________________________________________
________________________________________________________________________________
________________________________________________________________________________
________________________________________________________________________________
13. DNA fragments of similar size will not always resolve on a gel. This is seen in lane E in the Ideal Gel, where EcoRI fragments of 5804 bp and 5643 bp migrate as a single heavy band. These are referred to as a doublet and can be recognized because they are brighter and thicker than similarly sized singlets. What could be done to resolve the doublet fragments?
________________________________________________________________________________
________________________________________________________________________________
________________________________________________________________________________
________________________________________________________________________________
________________________________________________________________________________
________________________________________________________________________________