lab 2 instruction. a collection of statistical methods to compare several groups according to their...
Post on 20-Jan-2016
215 views
TRANSCRIPT

Lab 2 instruction
a collection of statistical methods to compare several groups according to their means on a quantitative response variable
One-Way ANOVAa special case of ANOVA when a single
factor is used
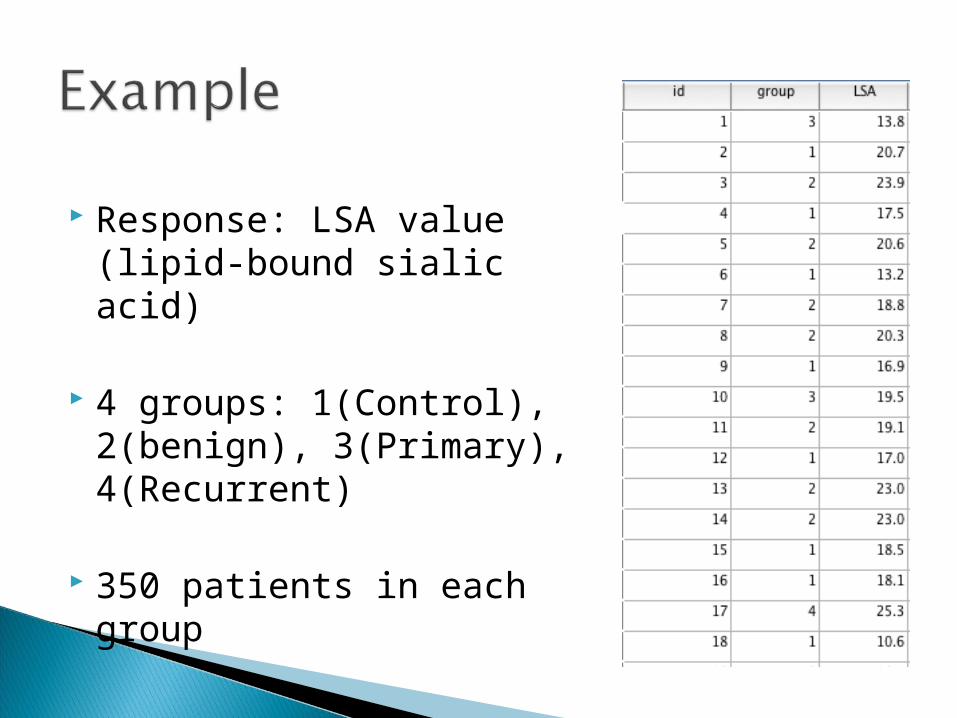
Response: LSA value (lipid-bound sialic acid)
4 groups: 1(Control), 2(benign), 3(Primary), 4(Recurrent)
350 patients in each group
Independence: both within and across the groups
Normality: population distributions of all groups are normal
the populations have equal standard deviations
Independence: setup of the experiment
Normality: boxplot / Q-Q plot
Equal std devs: ◦ Boxplot◦ Descriptive summary “Rule of thumb”: the ratio of the largest sd and the
smallest sd < 2◦ Levene’s test
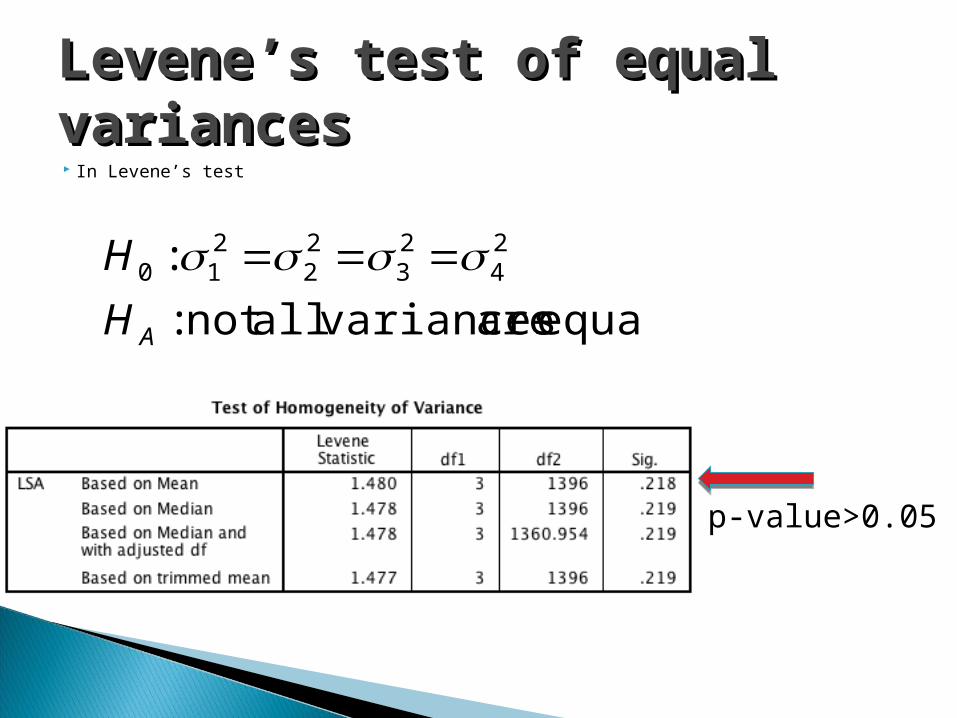
In Levene’s test
Levene’s test of equal Levene’s test of equal variancevariancess
equal are variancesallnot :
: 24
23
22
210
AH
H
p-value>0.05
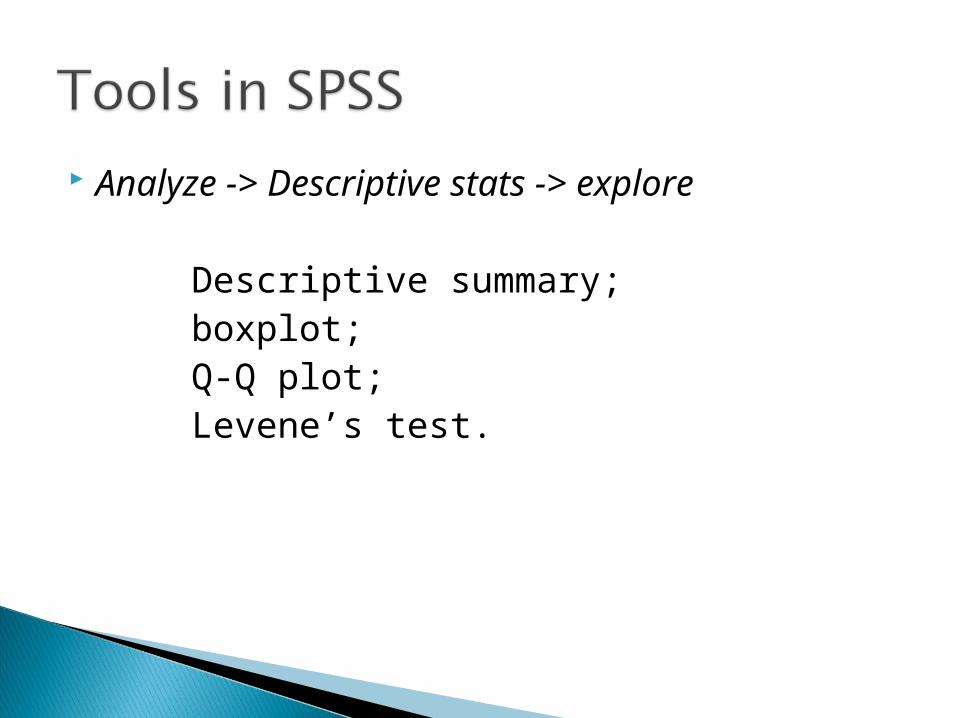
Analyze -> Descriptive stats -> explore
Descriptive summary;boxplot;Q-Q plot;Levene’s test.
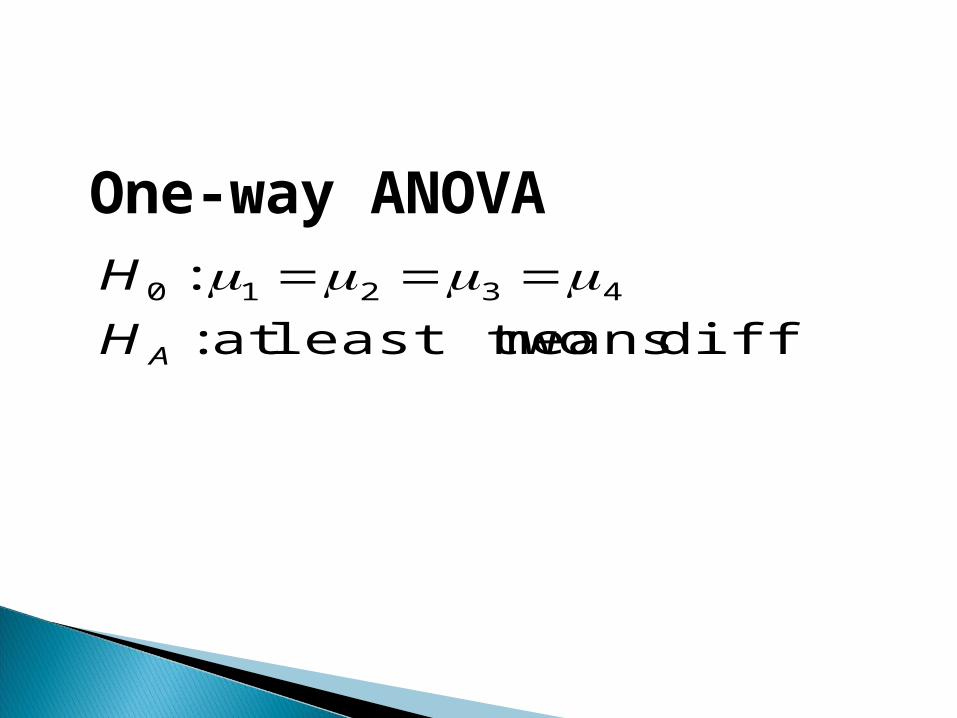
differ means least twoat :
: 43210
AH
H
One-way ANOVA
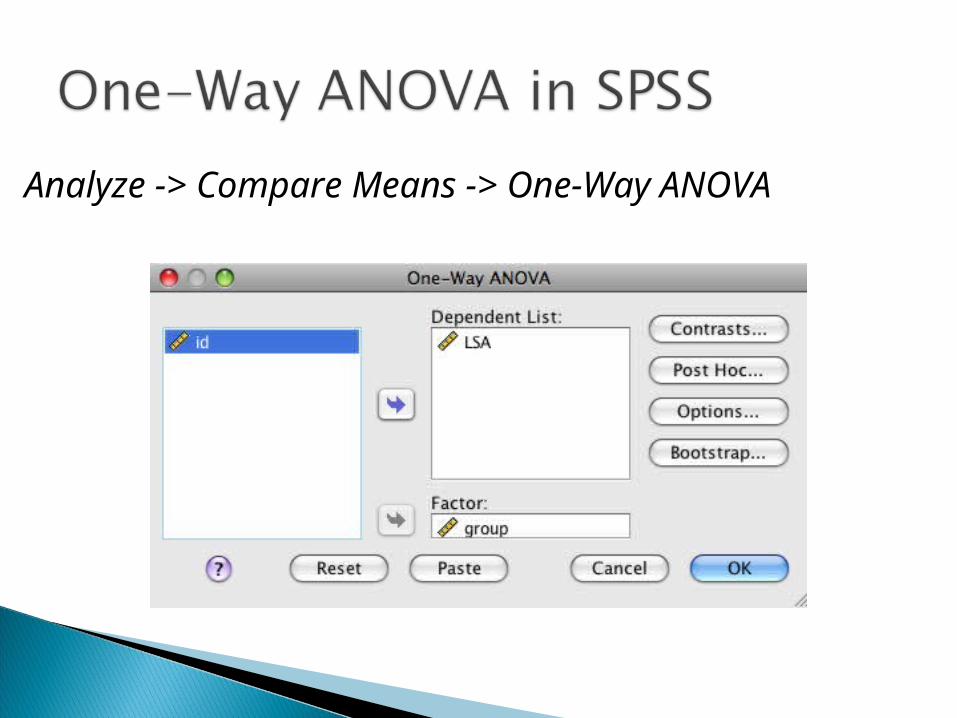
Analyze -> Compare Means -> One-Way ANOVA
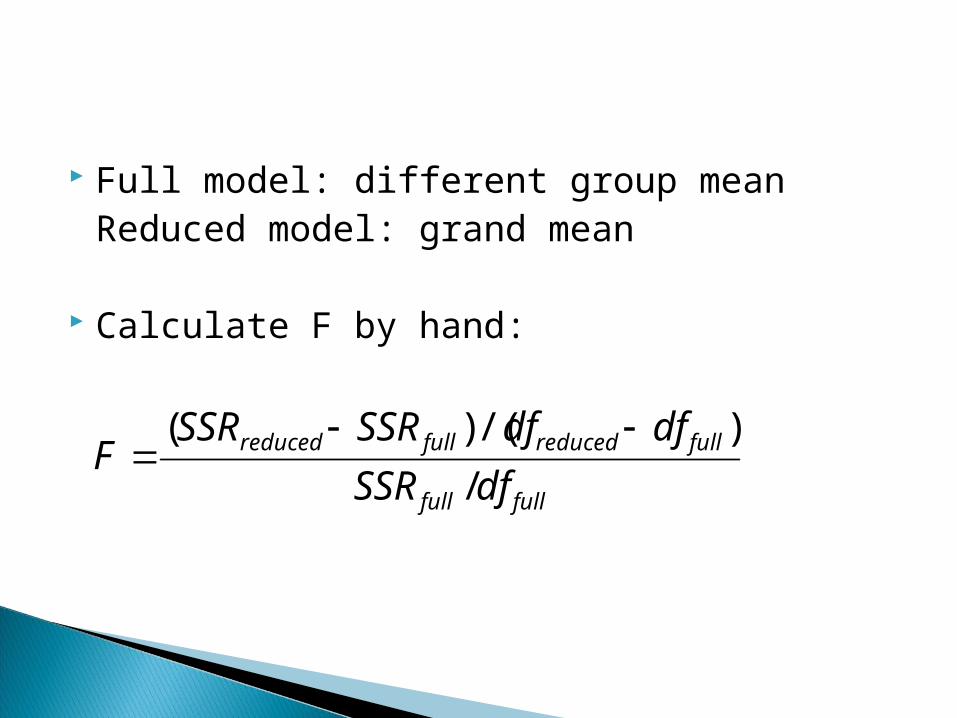
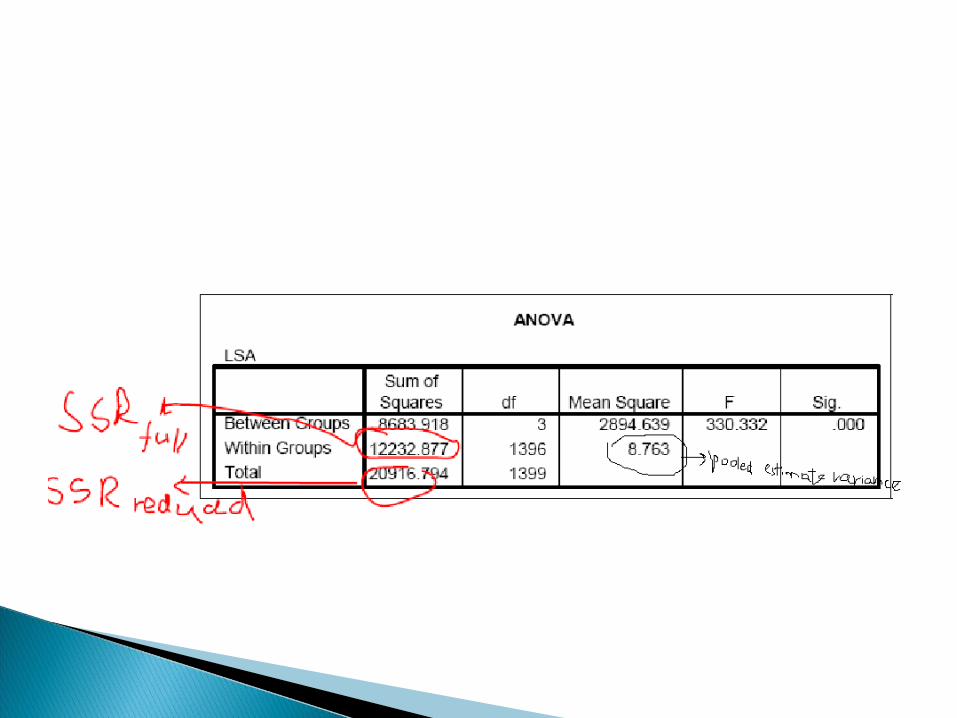
Full model: different group meanReduced model: grand mean
Calculate F by hand:
F (SSRreduced SSR full ) /(dfreduced df full )
SSR full /df full
Multiple comparisons: test the difference between each pair of means
Tukey test Scheffe test
Multiple ComparisonMultiple Comparison
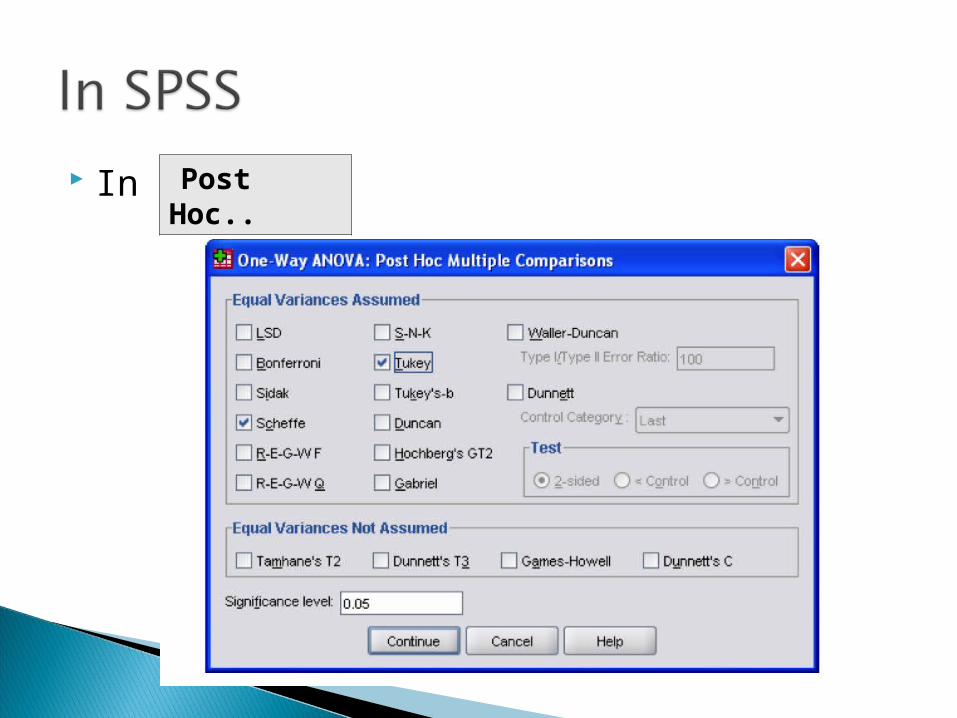
In Post Hoc..
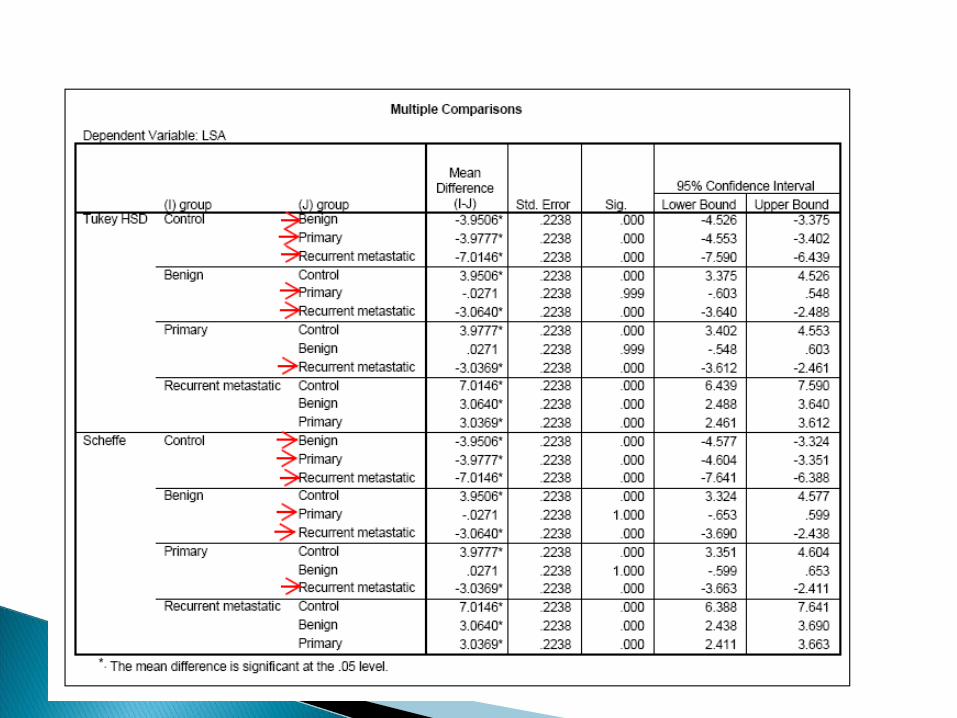
Multiple ComparisonMultiple Comparison number of pairwise comparisons Look at p-value of the hypothesis test of equalit
y of two means Check whether the confidence interval contains
zero or not
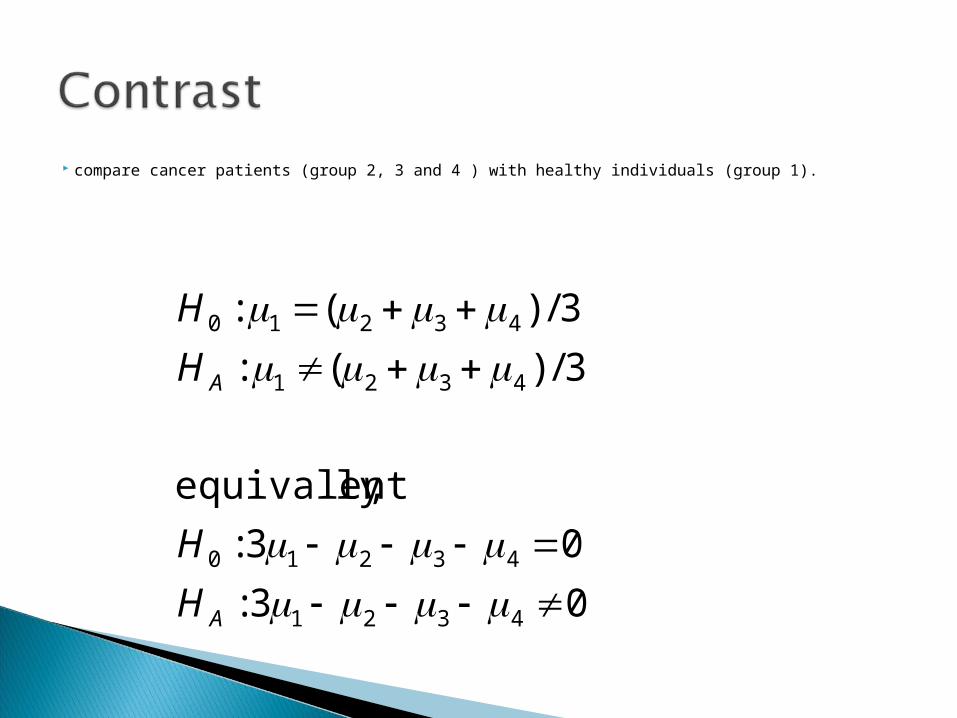
compare cancer patients (group 2, 3 and 4 ) with healthy individuals (group 1).
03:
03:
,lyequivalent
3/)(:
3/)(:
4321
43210
4321
43210
A
A
H
H
H
H
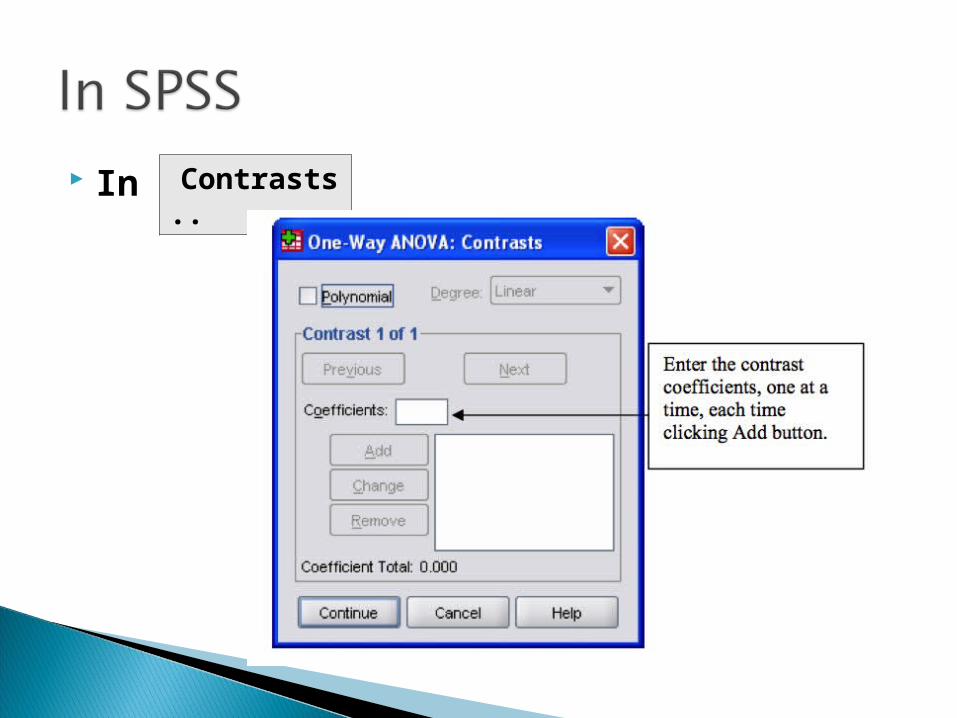
In Contrasts..
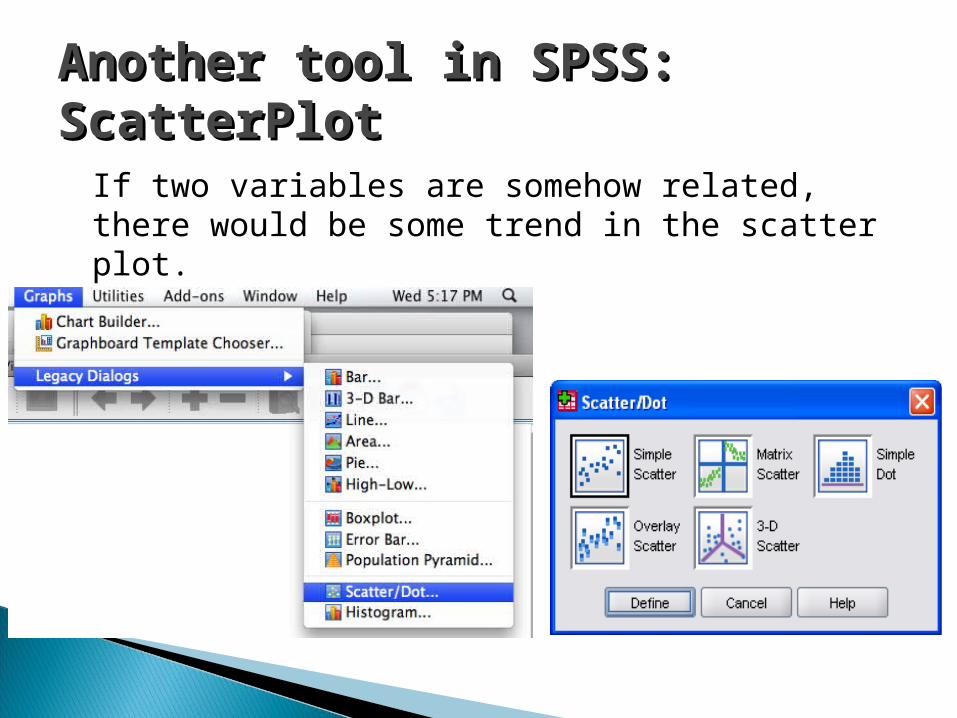
Another tool in SPSS:Another tool in SPSS:ScatterPlotScatterPlot
If two variables are somehow related, there would be some trend in the scatter plot.
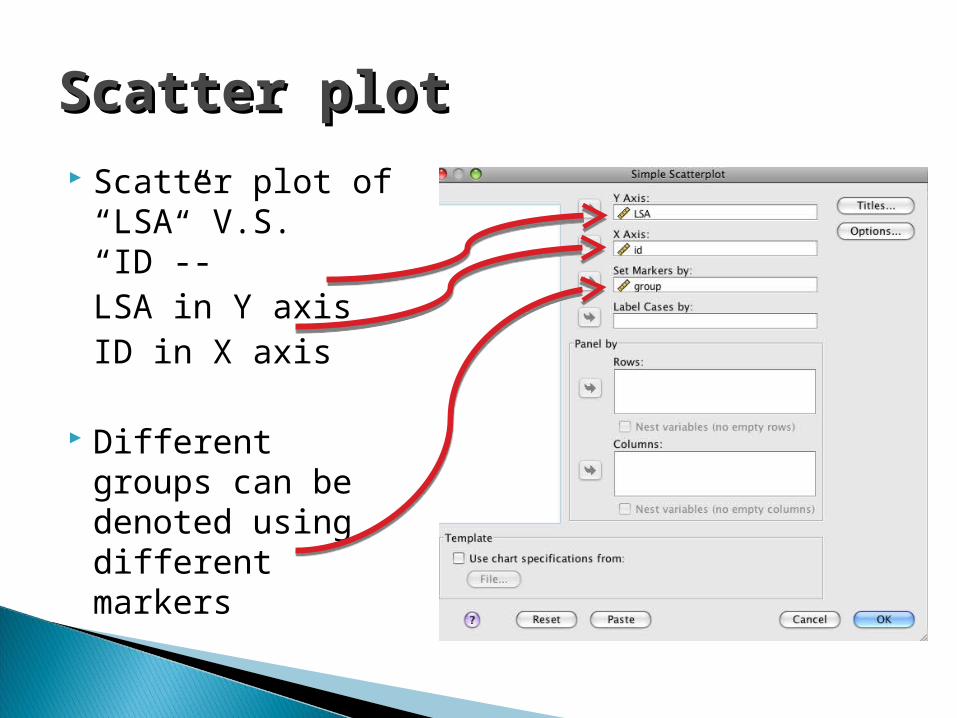
Scatter plot of “LSA” V.S. “ID”--LSA in Y axisID in X axis
Different groups can be denoted using different markers
Scatter plotScatter plot