lab 5: in situ water monitoring steven hoffman and tyler
TRANSCRIPT

Lab 5: In Situ Water Monitoring
Steven Hoffman and Tyler Lees
Environmental Issues
Dr. Tait Chirenje
Stockton University

2
Table of Contents
Table of Contents Table of Contents ............................................................................................................... 2
Abstract ............................................................................................................................. 3
Introduction ....................................................................................................................... 4
Methods ............................................................................................................................ 4
Results .............................................................................................................................. 6
Discussion ....................................................................................................................... 11
Conclusion ....................................................................................................................... 14
Part 2 ............................................................................................................................. 15
Reference List .................................................................................................................. 20

3
Abstract In situ water monitoring consists of measuring parameters to help maintain a healthy
water body. Using a Yellow Springs Instrument (YSI), parameters were measured at eight
different points on Lake Fred. These parameters included PH, Dissolved Oxygen, specific
conductance, salinity, turbidity, total suspended solids, and temperature. . The PH ranges from
4.95 – 6.61 ,specific conductivity ranges from 1.00 to 120.20 ppt, Turbidity ranges from 0.92 to
a reading of 192.00, salinity levels range from 0.06 – 0.44 ppt, temperatures range from 9.50 –
20.65 (C), and dissolved oxygen ranges from 6.66 – 12.71 mg/L. We then had to compare this
data to Moss Mill Lake’s water quality data. There were two rounds of data (2005,2010)
collected. For the first round of testing at Moss Mill Lake the PH measured in at .098 (SU),
Dissolved Oxygen (mg/L) at 6.99, specific conductance at .098(mS/cm), water temperature at
21.77 (C), turbidity at 0.9 (M) (measured using secchi disk). The data for the second round
measured 1.1 (M) with the secchi, water temperature at 26.37 (C), Dissolved Oxygen at 7.48
mg/L, PH at 4.7 (SU), and conductivity at 0.107 (mS/cm). Salinity was not measured at Moss
Mill Lake. For the second part of this lab we analyzed data from Upper Chesapeake Bay and
Upper Sassafras River.
4
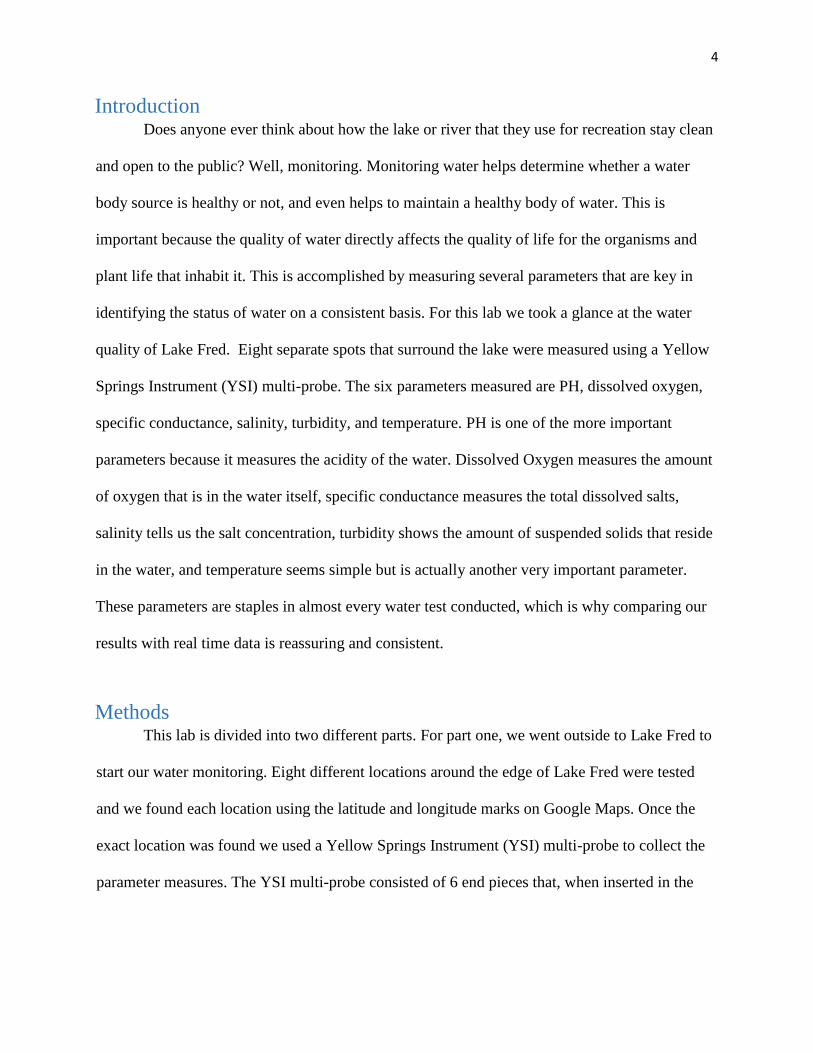
Introduction Does anyone ever think about how the lake or river that they use for recreation stay clean
and open to the public? Well, monitoring. Monitoring water helps determine whether a water
body source is healthy or not, and even helps to maintain a healthy body of water. This is
important because the quality of water directly affects the quality of life for the organisms and
plant life that inhabit it. This is accomplished by measuring several parameters that are key in
identifying the status of water on a consistent basis. For this lab we took a glance at the water
quality of Lake Fred. Eight separate spots that surround the lake were measured using a Yellow
Springs Instrument (YSI) multi-probe. The six parameters measured are PH, dissolved oxygen,
specific conductance, salinity, turbidity, and temperature. PH is one of the more important
parameters because it measures the acidity of the water. Dissolved Oxygen measures the amount
of oxygen that is in the water itself, specific conductance measures the total dissolved salts,
salinity tells us the salt concentration, turbidity shows the amount of suspended solids that reside
in the water, and temperature seems simple but is actually another very important parameter.
These parameters are staples in almost every water test conducted, which is why comparing our
results with real time data is reassuring and consistent.
Methods This lab is divided into two different parts. For part one, we went outside to Lake Fred to
start our water monitoring. Eight different locations around the edge of Lake Fred were tested
and we found each location using the latitude and longitude marks on Google Maps. Once the
exact location was found we used a Yellow Springs Instrument (YSI) multi-probe to collect the
parameter measures. The YSI multi-probe consisted of 6 end pieces that, when inserted in the
5
water, would measure, PH, dissolved oxygen, specific conductance, salinity, turbidity, and
temperature. The values recorded for each of the eight sites were written down into a notebook.
Once all the data was collected around Lake Fred we went back to the lab to enter it into an excel
spreadsheet. This spreadsheet was then transferred into arc map as a data table. To be able to
access the layer, the table had to be exported into its own feature class by right clicking and
selecting “Export Data”. After this we were able to see the eight points around Lake Fred, with
each point containing the six parameters we measured. To add a background containing Lake
Fred we chose the topographic map under the base maps toolbar. We then made graduated colors
in the data points properties for each parameter measures. We took screenshots of each graduated
color for each parameter and added them into this document.

6
Results
Figure 1: Figure 1 shows the pH values taken from each site in Lake Fred
7
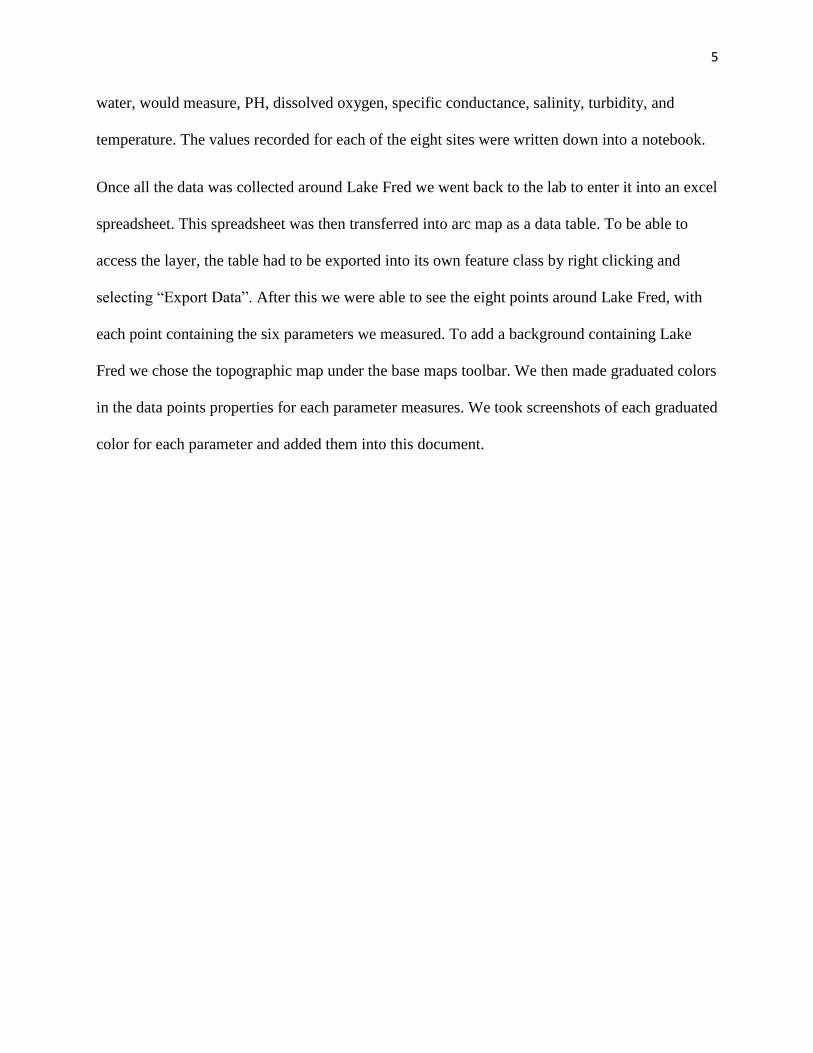
Figure 2: Figure 2 shows the Conductivity values taken from each site in Lake Fred

8
Figure 3: Figure 3 shows the Turbidity values taken from each site in Lake Fred

9
Figure 4: Figure 4 shows the Salinity values taken from each site in Lake Fred

10
Figure 5: Figure 5 shows the Temperature values taken from each site in Lake Fred

11
Figure 6: Figure 6 shows the Dissolved Oxygen values taken from each site in Lake Fred
Discussion Conducting these tests in such a small amount of time is not going to produce research
grade results, but instead a quick demonstration on what to look for. Figure 1 shows the range of
PH sampled around the lake. The PH ranges from 4.95 – 6.61, which is where we would expect
12
the lake to be at. It is slightly lower than in the summer due to the fact that it has not reached
growing season. PH typically rises during the day and in the summer because of natural
occurrence such as photosynthesis.
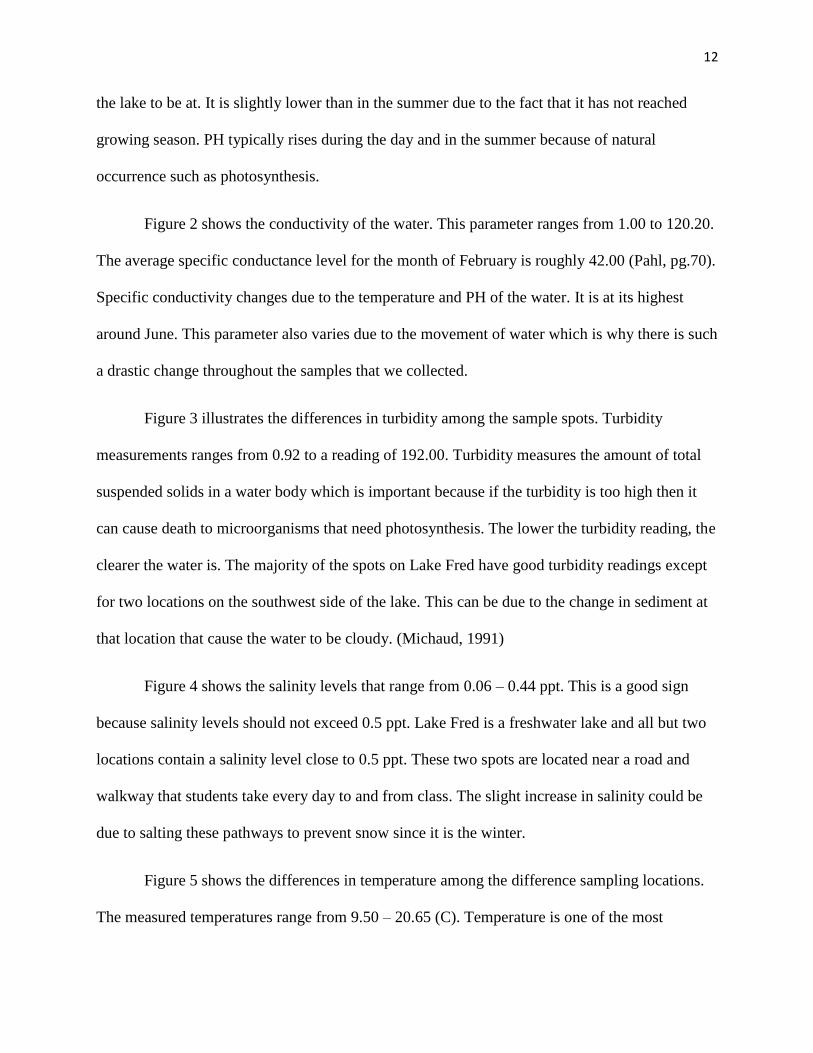
Figure 2 shows the conductivity of the water. This parameter ranges from 1.00 to 120.20.
The average specific conductance level for the month of February is roughly 42.00 (Pahl, pg.70).
Specific conductivity changes due to the temperature and PH of the water. It is at its highest
around June. This parameter also varies due to the movement of water which is why there is such
a drastic change throughout the samples that we collected.
Figure 3 illustrates the differences in turbidity among the sample spots. Turbidity
measurements ranges from 0.92 to a reading of 192.00. Turbidity measures the amount of total
suspended solids in a water body which is important because if the turbidity is too high then it
can cause death to microorganisms that need photosynthesis. The lower the turbidity reading, the
clearer the water is. The majority of the spots on Lake Fred have good turbidity readings except
for two locations on the southwest side of the lake. This can be due to the change in sediment at
that location that cause the water to be cloudy. (Michaud, 1991)
Figure 4 shows the salinity levels that range from 0.06 – 0.44 ppt. This is a good sign
because salinity levels should not exceed 0.5 ppt. Lake Fred is a freshwater lake and all but two
locations contain a salinity level close to 0.5 ppt. These two spots are located near a road and
walkway that students take every day to and from class. The slight increase in salinity could be
due to salting these pathways to prevent snow since it is the winter.
Figure 5 shows the differences in temperature among the difference sampling locations.
The measured temperatures range from 9.50 – 20.65 (C). Temperature is one of the most

13
important parameters to measure in water. Temperature can affect all other parameters. Usually
the hotter the temperature is, the more activity there is in the lake. For example, an increase in
temperature means an increase in parameters such as conductivity and acidity, but also a
decrease in the solubility of oxygen. Three spots are relatively low around the lake, right on the
southeast corner of the lake. This can be due to lake of sunlight at the time of day we took the
measurements.
Figure 6 represents the dissolved oxygen levels that we measured around the lake. These
measurements range from 6.66 – 12.71 mg/L. This is also an important parameter to measure
because all living organisms in the water need some form of oxygen to survive. Indications of a
high dissolved oxygen level are fast moving water, which Lake Fred is not. Stagnant waters such
as lakes tend to contain less dissolved oxygen. (US geological survey, 2017). Dissolved oxygen
is also directly related to temperature because cold water can hold more dissolved oxygen then
warm water. Typically dissolved oxygen levels should be around 1 mg/L to 20mg/L. Lake Fred’s
levels fall right in that range. The one trend that sticks out is that the dissolved oxygen is higher
on the north side of the lake than the southern side even though the southern side has lower
temperatures. Another factor that can cause this is an abundance of organic matter on the north
side of the lake compared to the south section of the lake.
To actually see what our results are worth, we picked another Lake in the area to
download data from. We decided to choose Moss Mill Lake. Comparing two lakes that reside
fairly close together means that the surrounding environment is fairly similar, in contrast to a
lake that is outside the town or even Atlantic County. The most recent data that was available to
view for Moss Mill Lake takes place in 2005 and then a second round of testing in 2010.
(NJDEP). Two dates were sampled, one in the summer and one in the fall of 2005. We chose to

14
analyze the fall date because the water temperature is more similar to our data’s temperature than
it is in the summer. The PH measured in at 5.45 (SU), Dissolved Oxygen (mg/L) at 6.99, specific
conductance at .098(mS/cm), water temperature at 21.77 (C), turbidity at 0.9 (M) (measured
using secchi disk). The one parameter that was not measured at Moss Mill Lake that we
measured is salinity. The second round of data sampling consisted of secchi, water temperature,
dissolved oxygen, PH, and conductivity. The Secchi measured 1.1 (M), water temperature at
26.37 (C), Dissolved Oxygen at 7.48 mg/L, PH at 4.7 (SU), and conductivity at 0.107 (mS/cm).
Salinity was not measured during this round either. This data, when comparing it to ours, is fairly
similar. The PH levels were measured in different units which is the reason why the numbers are
slightly skewed. Special conductivity is also measured in different units than our ppt unit. The
parameters of dissolved solids, turbidity and temperature all compares well with our data.
Conclusion Does anyone ever think about how the lake or river that they use for recreation stay clean
and open to the public? Well, now you know, monitoring. The monitoring that we did is only a
glimpse of what should be done to actually maintain a water body. It takes numerous tests a
month, even days, to fully monitor a lake such as Lake Fred. It is important to keep up with the
monitoring to sustain the life within the lake, especially when human impacts can harm it. Any
one of these parameters can cause a major shift in the wildlife at Lake Fred. For example, if the
dissolved oxygen becomes too low to sustain life, then the microbial, fish, and turtle populations
will die. This is also known as eutrophication. If we were to set up a month of water sampling of
these six parameters, we would get a better understand of the overall water quality of Lake Fred.

15
Part 2
Introduction
Lake Fred is a relatively small body of water to monitor and keep up. The large bodies of
water also need to be tested and checked up on. For part two of this lab we downloaded data
from a larger watershed such as the Chesapeake Bay, which we got off the Chesapeake Bay
Program website. We chose to analyze two watersheds, the Upper Chesapeake Bay and Upper
Sassafras River. The Chesapeake Bay is located between the southern part of Delaware and the
northern part of Maryland with the Sassafras River lying within it. These two watersheds contain
the same six parameters that we measured in part 2 with an extra two measurements, total
dissolved phosphorous and total dissolved nitrogen.
Methods
We downloaded data containing these parameters for both locations and put them into an
excel spreadsheet. We decided to compare data that was five years apart, 2013-2017. Using this
data in excel we were able to make the figures shown above by highlighting each parameter and
inserting them into a blank graph.

16
Results
Figure 7: Figure 7 shows the Dissolved Oxygen Values found in Upper Chesapeake Bay and Upper Sassafras River
Figure 8: Figure 8 shows the pH Values found in Upper Chesapeake Bay and Upper Sassafras River

17
Figure 9: Figure 9 shows the Salinity Values found in Upper Chesapeake Bay and Upper Sassafras River
Figure 10: Figure 10 shows the Conductivity Values found in Upper Chesapeake Bay and Upper Sassafras River

18
Figure 11: Figure 11 shows the Total Dissolved Phosphorus Values found in Upper Chesapeake Bay and Upper Sassafras River
Figure 12: Figure 12 shows the Total Dissolved Nitrogen Values found in Upper Chesapeake Bay and Upper Sassafras River

19
Figure 13: Figure 13 shows the Water Temperature Values found in Upper Chesapeake Bay and Upper Sassafras River
Discussion
There are 7 parameters that we were able to download and analyze. PH measures the
acidity in the water, dissolved oxygen measures the amount of oxygen that is in the water itself,
specific conductance measures the total dissolved salts, salinity tells us the salt concentration,
and temperature. The two new parameters that were analyzed are total dissolved phosphorous
and total dissolved nitrogen. Total dissolved phosphorous is the measure of all forms of
phosphorous found in the water. It is important to monitor phosphorous because it stimulates
growth of plankton and aquatic plants, and if levels reach too high then eutrophication can occur
(Oram, 2014). Total dissolved nitrogen is the measure of all nitrogen in a water sample. Nitrogen
can cause eutrophication as well by overstimulating the growth of algae and other aquatic plants.
The Sassafras River is a tributary to the Chesapeake Bay itself, so most of these parameters are
similar, except two. The two parameters that are drastically different are salinity and

20
conductivity. The Upper Sassafras is located inland so less of this tributary is exposed to the
saline ocean. This can be the reason that the salinity levels are so low and because of the salinity
levels being so low, the conductivity is low as well. The reason for this is because with less salt
in the water electric currents will have trouble passing through water with a low amount of
particles within it. Another trend worth noting is the total dissolved nitrogen. The level of total
dissolved nitrogen is higher consistently throughout the five years in the Chesapeake than in the
Sassafras River. This can be caused by residential homes that are located along the river bank.
One more interesting trend that we found from these graphs is that the salinity has increased over
the last five years by about 4ppt in the Chesapeake Bay. This can be caused from being located
in between two heavy industrialized coastlines, especially on the Delaware side.
Conclusion
Monitoring water quality in large watersheds is especially important because since it is a
larger body of water, there will be much more plant and animal life when compared to a specific
area. By measuring the Chesapeake Bay and the Sassafras River we got two separate datasets
with one of those datasets (Sassafras) being more specific within the other dataset (Chesapeake
Bay). Even both sets of data were located in two areas where there were dramatic changes in a
couple of parameters because of the area that they reside in. Since both areas are regulated
consistently they consist of more parameters, such as the total dissolved nitrogen and total
dissolved phosphorous.
Reference List
What We Monitor and Why. (n.d.). Retrieved February 27, 2018, from
http://dnr.maryland.gov/waters/bay/Pages/What-and-Why-We-Monitor.aspx\
21
Introductions. (n.d.). Retrieved February 27, 2018, from https://writingcenter.unc.edu/tips-and-
tools/introductions/
NJDEP Lake Monitoring Network. (n.d.). Retrieved February 27, 2018, from
http://www.state.nj.us/dep/wms/bfbm/lakes.html
(2012, September 04). Water Quality Parameters: Conductivity & Hardness. Retrieved February
27, 2018, from http://www.sciencepartners.info/module-4-water/what-is-water-
quality/water-quality-parameters-conductivity-and-hardness/
Perlman, U. H. (n.d.). Saline Water. Retrieved February 27, 2018, from
https://water.usgs.gov/edu/saline.html
Perlman, U. H. (n.d.). Water properties: Dissolved oxygen. Retrieved February 27, 2018, from
https://water.usgs.gov/edu/dissolvedoxygen.html
www.researchgate.net/publication/275353467_Electrical_Conductivity_of_Lake_Water_as_Envi
ronmental_Monitoring_A_Case_study_of_Rudra_sagar_Lake
“What We Monitor and Why.” Department of Natural Resources,
dnr.maryland.gov/waters/bay/Pages/What-and-Why-We-Monitor.aspx.