lab manual module 2 - bio365l manual/lab manual module 2.pdf · neurobiology laboratory (bio 365l)...
TRANSCRIPT

Neurobiology Laboratory (BIO 365L)
Fall Semester 2010
Friday 1-6 pm, PAI 1.04
Lab Manual: Module 2 Active Properties of Neurons

BIO365L: Neurobiology Laboratory, Fall 2010
Module 2 – Page 1
Module 2: Active Properties of Neurons Mechanisms of Action Potential Generation I. Synaptic integration in central neurons
All neurons in the brain share a common overall structure, possessing dendrites, a cell body (soma), and an axon (see Figure 1). The majority of synaptic input impinges on their highly branched dendrites, and the electrical activity from these events sum together in time and space. Synaptic activity is conveyed ultimately to the soma and axon, the latter of which is the final site of synaptic integration in the neuron. Should the summed activity in the axon exceed a certain voltage threshold, the cell initiates an action potential, the regenerative electrical event that propagates down the axon to the synaptic terminals, triggering calcium influx and neurotransmitter release onto the neuron’s network targets. Temporal summation If presynaptic inputs to a cell are active within a narrow enough time window, EPSPs and IPSPs in the postsynaptic cell may sum together to form a composite EPSP. The membrane time constant (τm) is critical here! It dictates the speed at which the membrane can repolarize, and thus the time window for temporal summation. Spatial summation Spatial summation refers to the process of combining EPSPs and IPSPs occurring in different dendritic branches of the neuron.
These PSPs sum together and propagate toward the soma and axon. Cable properties of neurons: Excitatory and inhibitory inputs impinging on the dendrites must propagate to the soma and axon like a wave. In their progress, they undergo a substantial degree of attenuation, analogous to a drop in water pressure in a garden soaker hose as the water propagates further and further from its site of “injection”. The analogy to the hose goes further, the amount of attenuation is greater the more holes (or open ion channels) that are present. You will recall that according to Ohm’s Law, V=IR, more open ion channels would result in a lower resistance and thus a smaller voltage change for a given amount of current. The cable properties of neurons are not disruptive to neurons, but rather give neurons computational power, allowing them to modify the time course and amplitude of synaptic inputs in interesting ways. II. Action potentials encode information How is “information” in the nervous system encoded? Put differently, what is it about the activity of neurons that their downstream targets are paying attention to? In
Figure 1. Dendritic morphology of a CA1 pyramidal neuron of the hippocampus.

BIO365L: Neurobiology Laboratory, Fall 2010
Module 2 – Page 2
the simplest sense, central neurons integrate multiple synaptic inputs over time and, once the membrane reaches threshold, one or more action potentials are generated. The question that remains is how each neuron commuinicates information about its inputs through these action potentials. Action potential encoding strategies: Spike waveform Although it has only recently been a focus of attention, recent work has shown that the particular waveform of the action potential is important. The amplitude and duration of the action potential can communicate important information about the neuron’s recent history, by modulating neurotransmitter release at the axon terminal (Figure 2). Also important are afterhperpolarizations (AHPs) that occur on three different timescales (the Fast, Medium, and Slow AHP). These active processes also play an important role in coding the recent history of activity by a neuron. The Fast AHP occurs immediately after tha AP and it is very brief, lasting only 2-3 ms. The medium AHP develops over 10 ms or so and can last up to 100 ms. The slow AHP can persist for a second or more in some cases.
Figure 2. Important parameters of the action potential waveform. A) Measurement of various AP parameters. Adapted from (Bean, 2007). B) The fast afterhyperpolarization (AHP) is often observed immediately after the action potential. C) The medium- and slow-AHPs are evident on a longer time scale. Note the different scale bars in B and C. Action potential encoding strategies: dynamic range Some sensory receptors and central neurons encode information in the frequency of action potential firing (pacinian corpuscles are a good example). As the stimulus intensity increases, so too does the frequency and number of action potentials that are fired. Dynamic range refers to the range of firing frequencies that the neuron is capable of sustaining in response to a stimulus. When a neuron is firing at its maximum frequency (it is at the upper limit of its dynamic range), further increases in the stimulus are no longer reflected in the neuron’s action potential output, and ambiguity about the nature of the stimulus will result. Several factors determine the particular dynamic range of firing frequencies for a particular neuron. These include the spike width, refractory period, and

BIO365L: Neurobiology Laboratory, Fall 2010
Module 2 – Page 3
afterhyperpolarizations that occur on at least three timescales. All of these properties are governed by the activity of different ion channels as we will discuss later. Action potential encoding strategies: spike patterning. In addition to the pure frequency of action potentials, the particular pattern of action potentials during a spike train can also be important. Neurons in the central nervous system show a striking diversity in their firing patters. Some neurons fire only a single spike, regardless of stimulus conditions, whereas others show spontaneous and rhythmic bursts, regular spike trains, or combinations of these patterns.
Although cells in the hippocampus and adjacent areas share many similar morphological features, they may show different firing properties due to differences in the expression of voltage-gated channels (Figure 3). In the CA1 region of the hippocampus, pyramidal neurons generally fire action potentials in regular trains. In the subiculum, firing properties are more diverse. Subicular pyramidal neurons can fire in regular trains (regular spiking, or RS). Others may show a bursting firing pattern, in which the cell fires a high frequency cluster of 2-4 action potentials. One subclass of subicular neuron fires an initial burst, followed by regular spiking (a “weak bursting
Figure 3. Firing properties of neurons from the subiculum and CA1 regions of the hippocampus.Adapted from Staff et al (2000).

BIO365L: Neurobiology Laboratory, Fall 2010
Module 2 – Page 4
neuron”, or WB. Another subclass of subicular neurons fires bursts of action potentials repetitively throughout the duration of the depolarizing stimulus.
One common feature of spike patterning in many types of cortical neurons is
spike frequency adaptation, which is the tendency for the firing frequency to decrease during a train of action potentials (Figure 4). Spike frequency adaptation plays an important role in allowing neural systems to “filter out” irrelevant or unchanging stimuli and respond only to important changes in the environment (e.g., Peron and Gabbiani, 2009).
Figure 4. A train of action potentials recorded from a CA1 pyramidal neuron. Spike frequency adaptation (SFA) is evident in the increasing intervals between action potentials during the train. It is possible to distinguish two phases of SFA. During early SFA, interspike interval increases then becomes relatively stable. Later in the spike train, the interspike interval again starts increasing. Taken from Stocker (2004), adapted from Pedarzani (2001).
III. The Action Potential: Ohm’s Law returns As we discovered in Module 1, the neural membrane is governed by Ohm’s law: V=IR. That is, the membrane voltage (V) equals the product of current across the membrane (I) and the membrane resistance (R). The resistance is determined by the number of open ion channels, and when we are considering the ion currents that generate the action potential, it is easier to substitute conductance for resistance in Ohm’s law. Remember that conductance (G) is the inverse of resistance, so R = 1/G. This allows us to reformulate ohms law as such: V = I/G And I = GV The action potential involves rapid and simultaneous changes in voltage, conductance, and current. To understand how membrane voltage, conductance, and current are

BIO365L: Neurobiology Laboratory, Fall 2010
Module 2 – Page 5
related during the action potential, we have to consider the factors that determine each of these terms. Differential distribution of ions determines the membrane voltage As you know from previous coursework, under physiological conditions neurons maintain an uneven distribution of various ions across the cell membrane. More specifically, sodium concentrations are much higher in the extracellular space while potassium concentrations are much higher in the intracellular fluid. These concentration gradients give rise to forces that tend to drive sodium into the cell and potassium out of the cell. It is important to remember that the forces associated with differences in ion concentration interact with the electrical gradients created by differences in the distribution of positive and negative ions across the membrane. For example, the intracellular space is generally negative relative to the extracellular space. This would tend to attract positively charged ions like K+ into the cell. On the other hand, the high concentration of K+ within the cell tends to repel K+ out of the cell. The state where the effects of the concentration gradient are balanced by the electrical gradient is known as the equilibrium potential for that ion (Eion). When the membrane potential is at the equilibrium potential for that ion, there will be no net movement of that ion into or out of the cell. On the other hand, when the membrane potential deviates from the equilibrium potential, the diffusion and electromotive forces are out of balance, and the net result is a force that tends to move ions into or out of the cell depending on whether the membrane potential is above or below the equilibrium potential. The Nernst equation is used to calculate the equilibrium potential for any given ion species, as long as you know concentrations of that ion outside (o) of the cell and inside (i) the cell:
Here Ex is the reversal potential for ion x, R = the gas constant, T = absolute temperature (in Kelvin), and F is Faraday’s constant. The term zx is the ionic charge of the ion, e.g., -1 for Chloride, +1 for potassium, +2 for calcium, etc. Because the only variable in the term RT/F is temperature, it is possible to simplify this ratio to a single value if we know the temperature. For simplicity’s sake, we will assume for this lab a room temperature of 20 °C, giving us a value of 25.26 for RT/F. The internal and external ionic concentrations can be estimated in most physiological systems. In the case of our lab experiments, we can measure these values quite accurately because we control the concentrations of all ions in the extracellular and intracellular domains. The external ACSF determines the extracellular concentrations, and the internal solution controls the intracellular concentrations of all ions. The composition of the internal and external solutions is given in the following table:

BIO365L: Neurobiology Laboratory, Fall 2010
Module 2 – Page 6
Internal (Pipette) solution, in mM Potassium gluconate 130 Sodium phosphocreatine 20 EGTA 0.5 HEPES 10 MgCl2 2 MgATP 2 NaGTP 2
ACSF (external saline), in mM: NaCl 130 Glucose 20 KCl 3 NaHCO3 (pH buffer) 10 NaH2PO4 2 MgCl2 1 CaCl2 2
While the Nernst equation allows us to calculate the equilibrium potential for each individual ion, the membrane potential actually is determined by a number of different ions. Moreover, at any given time, the membrane has different permeabilities to each type of ion. The Goldman-Hodgkin-Katz (GHK) equation allows us to predict the membrane potential given the concentration gradients and relative permeabilities for each type of ion involved:
lnK Na Cl
K Na Cl
Note the similarities of this equation to the Nernst equation. The GHK equation is essentially the Nernst equation extended to include multiple ion species, with the addition of a term representing the relative permeabilities of those ions (Pion). Again, RT/F can be simplified to 25.26 at room temperature. We can consider some boundary conditions to get a feel for how equilibrium potentials and ion permeability contribute to membrane potential. For example, if the membrane is permeable only to K+, that is PK = 1 and both PNa and PCl are equal to zero, then the membrane potential would move to EK. By the same logic, if the membrane was only permeable to Na+ then the membrane potential would be equal to ENa. If the membrane is permeable to all three ions, then the membrane potential will lie somewhere between the equilibrium potentials for all three ions. An important generalization from this discussion is that whenever the membrane becomes more permeable to a particular ion, the membrane potential will move toward the equilibrium potential for that ion. More specifically, open sodium channels will pull the membrane toward ENa, while open potassium channels will pull the membrane toward EK. The driving force on any particular ion species is equal to the difference between membrane voltage and the equilibrium potential for that ion If we begin with the simple case where the membrane potential is equal to the equilibrium potential for potassium (VM = EK), we can ask what would happen if

BIO365L: Neurobiology Laboratory, Fall 2010
Module 2 – Page 7
potassium channels opened in this situation. The answer is: nothing. Because the membrane potential is already at EK, there would be no net movement of K+ across the membrane. On the other hand, if the membrane potential is different from EK, there would be a force driving potassium through any open potassium channels. To generalize: when the membrane potential is at the equilibrium potential for an ion, there will be no net movement of that ion across the membrane, regardless of how many ion channels are open. In contrast, when the membrane potential is very different from the equilibrium potential for an ion, there is a strong driving force on that ion to cross the membrane through available ion channels. We can quantify this relationship as a variation on Ohm’s Law: Iion = (Vm – Eion) * Gion We are left now to examine what factors control the conductance for each particular ion species. It should be no surprise that it is the opening and closing of ion channels that control ion conductance. Voltage-gated ion channels determine the membrane conductance for each type of ion Ion channels provide the path for ionic movement across the membrane. That is, they give rise to ionic conductances. Open ion channels increase conductance for that ion, while closed ion channels reduce conductance. The hallmark of an ion channel is the channel pore which is selective for a particular ion species or a particular combination of ion species. For our purposes here, we will consider only ion channels that are selective for only one type of ion.
Figure 5. Generalized structure of ion channels Ion channels generally share a set of common structural features (Figure 5) that confer specific functional properties.
1. Pore selectivity filter: Part of the basis for the ability of both voltage and ligand-
gated ion channels to conduct ions of is simply due to the nature of the pore

BIO365L: Neurobiology Laboratory, Fall 2010
Module 2 – Page 8
forming part of the channel, which can select for ions on the basis of size and charge.
2. Voltage sensor: In order for ion channel proteins to be voltage gated, the protein
must have residues that sense voltage. The voltage-sensing region of most voltage-gated ion channels is thought to be on the 4th transmembrane segment, consisting of a series of positively charged amino acids. These residues would thus move during a voltage change, and provide the necessary energy for a conformational change in the protein.
3. Inactivation ‘gate’: There is a good body of evidence supporting that the inactivation gate is located on the C-terminus on the intracellular face of the channel. Channel inactivation is thought to occur due to binding of this intracellular, tethered part of the protein to binding sites on the inside of the channel pore.
Voltage-gated ion channels and passive membrane properties
It is extremely important to realize that the action potential is an “active” process. The voltage changes during both the upstroke and repolarization of the action potential occur at rates faster than that of passive voltage changes. Action potentials repolarize in less than a millisecond, whereas passive voltage changes, reflected by tau, the membrane time constant, are on the order of many milliseconds. This is possible because the action potential is dominated by the kinetics of the underlying voltage-gated channels (the speed at which they activate, inactivate, and deactivate). In general, below action potential threshold, changes in membrane voltage are dominated by the passive resistive and capacitive properties of the membrane. Above action potential voltage threshold, voltage-gated channels dominate voltage changes with (in general) faster kinetics. Diversity of ion channels in central neurons The simplified account of action potential generation is that the action potential begins with the activation of sodium channels which depolarize the membrane and end when sodium channels close and potassium channels repolarize the membrane. This account is accurate only in a general sense. All neurons in the brain possess many more types of voltage-gated channels which in turn display a staggering variety of properties. This diversity confers different signaling characteristics (threshold for action potential initiation, firing frequency, spike pattern, etc.). In some sense one can regard each neuron type as having an electrical “signature”. In this laboratory, we will not consider all types of voltage-gated channels. We will focus on a small subset of ion channels that are important for determining the active properties of hippocampal neurons. We can capture the essential functional properties of ion channels in many ways, and some of the most important are:

BIO365L: Neurobiology Laboratory, Fall 2010
Module 2 – Page 9
1. Voltage dependence of activation: The primary determinant of an ion channel’s function is its voltage dependence of activation. This relationship describes what proportion of ion channels is open at each particular membrane voltatge.
2. Rate of activation: In addition to knowing how voltage affects the probability of
channel opening, it is important to know how quickly a population of channels activate. Activation rates cover a broad range. Some channel types activate within a millisecond, while other channel types can take tens of milliseconds to activate. The activation rate determines how quickly the conductance through that channel type can contribute to changes in membrane potential.
3. Rate of deactivation. When a change in membrane voltage causes channels to open, once the membrane voltage returns to a potential where the channels are not activate, it can take some time for all of the channels to close. This process is known as deactivation.
4. Rate of inactivation. After activation, some types of channels will stop conducting ions after a period of time, even when the membrane voltage remains within the channels activation range. This process is known as inactivation and it occurs through a mechanism that is different from deactivation. Inactivation usually involves the movement of part of the channel protein into the channel pore, thus blocking ionic movement through the pore. Sodium channels commonly display inactivation of this type.
5. Recovery from inactivation. Once a channel has inactivated, the only thing that will relieve the inactivation is repolarization of the membrane to a potential low enough to allow recovery from inactivation. Once the membrane reaches a potential that allows recovery, the process of recovery from inactivation takes time to complete. The inactivation and delay associated with recovery from inactivation in sodium channels gives rise to the refractory period following the action potential.
Below is a description of only some of the ion channel types that are expressed by hippocampal neurons, along with descriptions of their relevant functional properties. Voltage-gated sodium channels Central neurons express several types of sodium channels. For our purposes, we will lump all of them together in a single category because of their functional similarities. The defining features of sodium channels are that the resulting sodium currents (INa) activate rapidly and inactivate rapidly, with recovery from inactivation requiring delays of a few milliseconds to tens of milliseconds.

BIO365L: Neurobiology Laboratory, Fall 2010
Module 2 – Page 10
Voltage-gated calcium channels Central neurons also express several types of calcium channels that are activated when the membrane is depolarized. These channels have diverse functional properties, but we shall simplify their actions here to the fact that calcium channels open during the action potential and allow calcium influx into the cell. The influx of calcium plays a relatively minor role in changing the membrane potential, but calcium entering the cell has a profound effect on other cellular processes, especially other ion currents as you will see below. Voltage-gated potassium channels In contrast to sodium and calcium channels, potassium channels are an extremely diverse group, with pronounced differences in their functional characteristics. Dozens of different potassium channels are expressed in the nervous system. We will consider a small subset of these channels that are often expressed in hippocampal neurons and play prominent roles in shaping their active properties. 1. Delayed rectifier (IK(DR)). A high voltage-activated (HVA) potassium channel. This channel type is a major component of the repolarization of the action potential. This channel type activates relatively rapidly and shows little inactivation (Figure 6) . At the molecular level, subunits from many different potassium channel families may give rise to this electrophysiological phenotype.
Figure 6. A) Recordings of IKDR in response to depolarizing voltage steps. B) Recordings of IKA in response to depolarizing voltage steps. C) Voltage dependence of activation for IKDR and IKA (M. Markham, unpublished). 3. A-type K+ channel (IKA). A low voltage-activated (LVA) K+ channel. This channel displays very fast activation and strong inactivation (Figure 6). This type of channel often plays a role in keeping action potentials very brief, and enabling rapid bursts of action potentials by rapidly repolarizing the cell. This channel typically consists of members of the Kv4 family of K+ channels in mammals, or theShal family in drosophila. Like D-type channels, A-type channel activation occurs at potentials near resting potential and it therefore can result in a transient suppression of action potential

BIO365L: Neurobiology Laboratory, Fall 2010
Module 2 – Page 11
firing. However, its inactivating properties render the channel’s influence sensitive to the cell’s prior level of depolarization (e.g. see Fig. 7).
Figure 7. Effect of A-type channels on the firing pattern of a central neuron. With prior membrane depolarization (via a small somatic current pulse), the cell fires a regular train of action potentials in response to a larger depolarization (resting potential=dotted line). However, a pause in action potential firing is observed in response to the same depolarization when inactivation of A-type potassium channels is removed by prior hyperpolarization (lower trace). Adapted from Kanold and Manis (1999) 2. D-type potassium channel (ID). Another LVA potassium channel. This channel is fast activating and slowly inactivating. It was first named for its tendency to delay the time to action potential firing during membrane depolarization. This channel typically consists of members of the Kv1 family of potassium channels in mammals, or the Shaker potassium channel family in drosophila.
4. M-type K+ channel (IM). This LVA K+ channel activates very slowly, deactivates slowly, and does not inactivate (Figure 9). This current activates too slowly to shape the action potential waveform. Instead, this current contributes to the medium AHP in some cells (Gu et al., 2005). When it does, the effect of this current is to produce early spike frequency adaptation.
Figure 8. Delayed firing of a pyramidal neuron in the hippocampus. D-type potassium channel contribute to the initial suppression of firing. Note the “shoulder “ of the initial depolarization, caused by the activation of potassium channels.
BIO365L: Neurobiology Laboratory, Fall 2010
Module 2 – Page 12
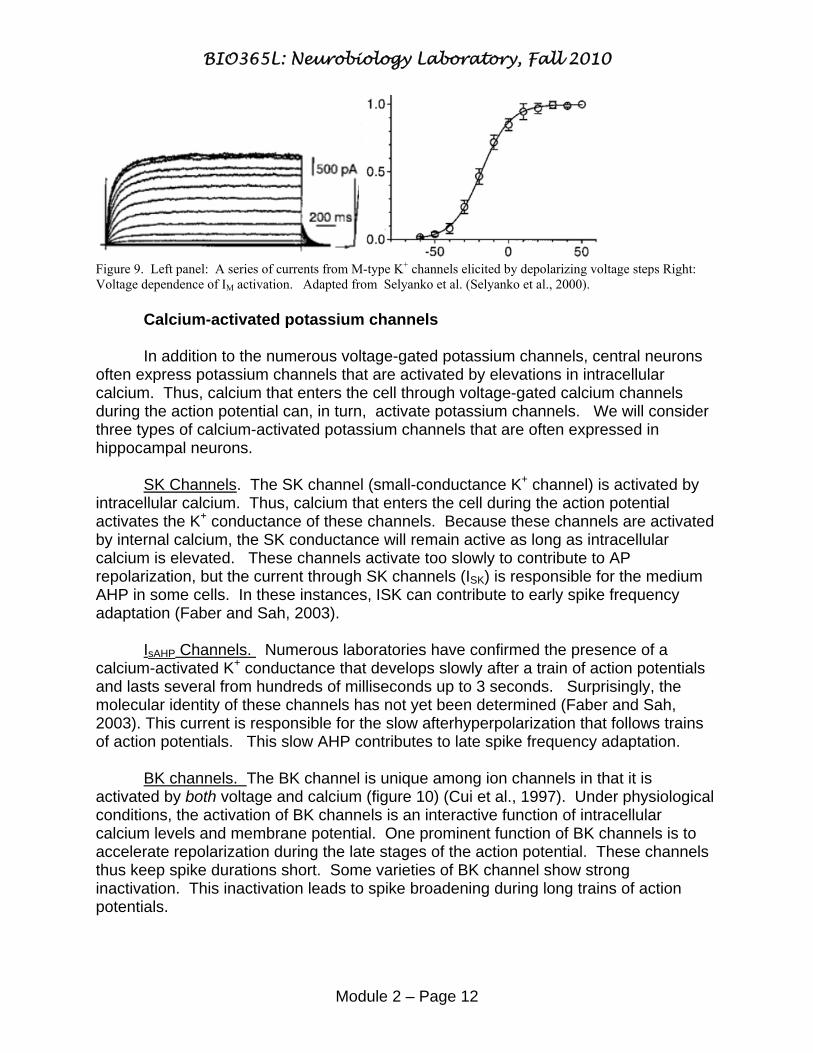
Figure 9. Left panel: A series of currents from M-type K+ channels elicited by depolarizing voltage steps Right: Voltage dependence of IM activation. Adapted from Selyanko et al. (Selyanko et al., 2000). Calcium-activated potassium channels In addition to the numerous voltage-gated potassium channels, central neurons often express potassium channels that are activated by elevations in intracellular calcium. Thus, calcium that enters the cell through voltage-gated calcium channels during the action potential can, in turn, activate potassium channels. We will consider three types of calcium-activated potassium channels that are often expressed in hippocampal neurons. SK Channels. The SK channel (small-conductance K+ channel) is activated by intracellular calcium. Thus, calcium that enters the cell during the action potential activates the K+ conductance of these channels. Because these channels are activated by internal calcium, the SK conductance will remain active as long as intracellular calcium is elevated. These channels activate too slowly to contribute to AP repolarization, but the current through SK channels (ISK) is responsible for the medium AHP in some cells. In these instances, ISK can contribute to early spike frequency adaptation (Faber and Sah, 2003). IsAHP Channels. Numerous laboratories have confirmed the presence of a calcium-activated K+ conductance that develops slowly after a train of action potentials and lasts several from hundreds of milliseconds up to 3 seconds. Surprisingly, the molecular identity of these channels has not yet been determined (Faber and Sah, 2003). This current is responsible for the slow afterhyperpolarization that follows trains of action potentials. This slow AHP contributes to late spike frequency adaptation. BK channels. The BK channel is unique among ion channels in that it is activated by both voltage and calcium (figure 10) (Cui et al., 1997). Under physiological conditions, the activation of BK channels is an interactive function of intracellular calcium levels and membrane potential. One prominent function of BK channels is to accelerate repolarization during the late stages of the action potential. These channels thus keep spike durations short. Some varieties of BK channel show strong inactivation. This inactivation leads to spike broadening during long trains of action potentials.
BIO365L: Neurobiology Laboratory, Fall 2010
Module 2 – Page 13
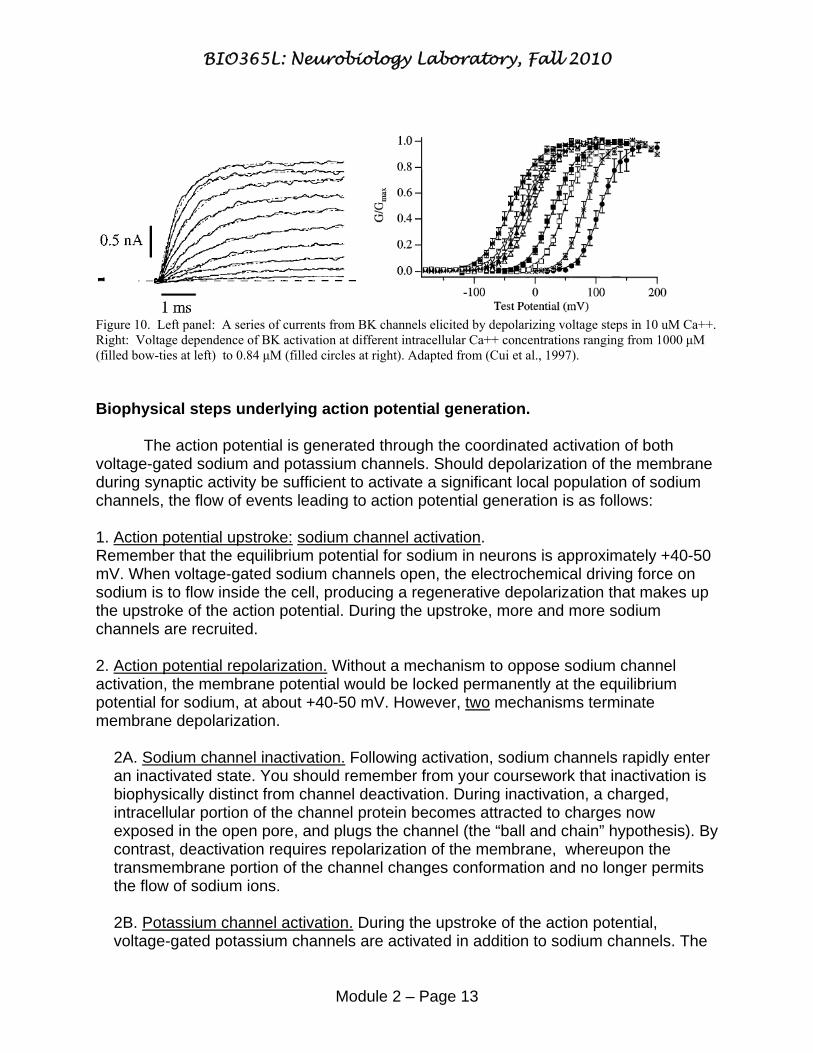
Figure 10. Left panel: A series of currents from BK channels elicited by depolarizing voltage steps in 10 uM Ca++. Right: Voltage dependence of BK activation at different intracellular Ca++ concentrations ranging from 1000 μM (filled bow-ties at left) to 0.84 μM (filled circles at right). Adapted from (Cui et al., 1997). Biophysical steps underlying action potential generation. The action potential is generated through the coordinated activation of both voltage-gated sodium and potassium channels. Should depolarization of the membrane during synaptic activity be sufficient to activate a significant local population of sodium channels, the flow of events leading to action potential generation is as follows: 1. Action potential upstroke: sodium channel activation. Remember that the equilibrium potential for sodium in neurons is approximately +40-50 mV. When voltage-gated sodium channels open, the electrochemical driving force on sodium is to flow inside the cell, producing a regenerative depolarization that makes up the upstroke of the action potential. During the upstroke, more and more sodium channels are recruited. 2. Action potential repolarization. Without a mechanism to oppose sodium channel activation, the membrane potential would be locked permanently at the equilibrium potential for sodium, at about +40-50 mV. However, two mechanisms terminate membrane depolarization.
2A. Sodium channel inactivation. Following activation, sodium channels rapidly enter an inactivated state. You should remember from your coursework that inactivation is biophysically distinct from channel deactivation. During inactivation, a charged, intracellular portion of the channel protein becomes attracted to charges now exposed in the open pore, and plugs the channel (the “ball and chain” hypothesis). By contrast, deactivation requires repolarization of the membrane, whereupon the transmembrane portion of the channel changes conformation and no longer permits the flow of sodium ions. 2B. Potassium channel activation. During the upstroke of the action potential, voltage-gated potassium channels are activated in addition to sodium channels. The

BIO365L: Neurobiology Laboratory, Fall 2010
Module 2 – Page 14
equilibrium potential for potassium is about –90 mV, far away from the peak of the action potential (around +40 mV). Thus the electrochemical driving force strongly drives potassium out of the cell, leaving net negative charges and hyperpolarizing the cell membrane. Fortunately for all living things possessing nervous systems, the speed at which potassium channels activate is slightly slower than that of sodium channels. This allows sodium channels a brief window of time in which to generate the upstroke of the action potential. Without this mismatch in activation timing, the sodium and potassium currents would cancel out, and the neuron would be inexcitable! In addition to the activation of voltage gated potassium channels, the entry of calcium during the action potential often activates BK channels, which contribute to the late phase of action potential repolarization.
3. The afterhyperpolarization (AHP). Following the action potential or a train of action potentials, AHPs occur on at least three timescales. The fast AHP is produced by K+ currents through BK channels. The medium AHP is regulated by M-type K+ channels or SK channels, and the slow AHP is produced by IsAHP, a slow calcium-activated K+ current. Summary: multiple ion currents interact to shape the AP waveform and AHP characteristics .
Figure adapted from Bean (1997). V. Mechanisms controlling spike frequency and burst patterning Just as the particular combination of ion currents in each cell determines its AP waveform, the complement of ion currents in the cell will shape spike frequency and burst patterning for that cell.

BIO365L: Neurobiology Laboratory, Fall 2010
Module 2 – Page 15
Spike frequency depends on the maintenance of very brief APs. In general, rapidly activating K+ currents contribute to the rapid repolarization necessary for a short action potential. These include fast voltage-gated K+ channels such as IKDR and IKA channels, as well as BK channels. Controlling spike frequency adaptation is most typically a function of the slower calcium-activated K+ currents. In particular, early spike frequency adaptation is produced by the currents that contribute to the medium AHP: SK channels or M-type K+ channels. Late spike frequency adaptation is due to the inhibitory K+ currents associated with the slow AHP. At very high firing frequencies, the fast AHP associated with BK channels facilitates rapid spiking and causes spike frequency adaptation very early in the spike train (Gu et al., 2007). Modulation of any of these currents can produce functionally important changes in the neuron’s dynamic range and spike-frequency adaptation. These changes are far eatfrom trivial. Modulations of AHP properties contribute to task learning (Matthews et al., 2008; Oh et al., 2009), and dysfunctions in these properties are associated with disorders such as epilepsy (Rogawski, 2000). VI. Summary The active properties of neurons give rise to the action potential. The action potential is a dynamic interaction of voltage, current, and conductance. Driving force, or voltage, is produced by the unequal distribution of ions across the cell membrane. Changes in conductance are a function of the opening and closing of ion channels selective for particular ions. These ion channels have a wide range of functional characteristics. The driving force in conjunction with changing ion conductances gives rise to ion currents across the membrane, and resulting changes in membrane potential. The active functional characteristics of neurons are shaped by the particular complement of ion channels expressed by each neuron. This determines the AP threshold, AP waveform, and firing properties of each cell that enable it to function appropriately within its network. Module 2 Experiments: Action potential signaling in hippocampal neurons In this module, Experiments 1 – 3 will allow you to observe the basic features of action potential signaling, including AP threshold, firing frequency and pattern, AP waveform characteristics, and refractory period. By completing these experiments you will get a feel for the functional characteristics of hippocampal neurons. You also will learn the techniques used to test and quantify these parameters. Using these skills, you will then go on to complete a more sophisticated set of experiments in Experiment 4 to discover mechanisms of plasticity in the active properties of hippocampal neurons. The experimental projects included in Experiment 4 will be the focus of your lab report.
BIO365L: Neurobiology Laboratory, Fall 2010
Module 2 – Page 16
Experiment 1: Voltage threshold for action potential initiation PreLab
Action potentials are initiated when inward sodium currents exceed outward potassium currents, and become regenerative. You will investigate whether this initiation point occurs at a specific voltage threshold in response to stimuli of different strengths as well as during repetitive firing. InLab 1. Set capacitance compensation and bridge balance appropriately. 2. Deliver 1000 ms step pulses and adjust current amplitude until you reach threshold current intensity. Then, deliver the same duration pulse at 5 larger intensities (but below 100 pA). Make appropriate notes below: Sweep #: ________ Current Magnitude: _________ Sweep #: ________ Current Magnitude: _________ Sweep #: ________ Current Magnitude: _________ Sweep #: ________ Current Magnitude: _________ Sweep #: ________ Current Magnitude: _________ Sweep #: ________ Current Magnitude: _________ 3. Change the resting potential (<10 mV either direction) with constant current injection through the amplifier then deliver the same sequence of current steps as above. Make appropriate notes here: Sweep #: ________ Current Magnitude: _________ Sweep #: ________ Current Magnitude: _________ Sweep #: ________ Current Magnitude: _________ Sweep #: ________ Current Magnitude: _________ Sweep #: ________ Current Magnitude: _________ Sweep #: ________ Current Magnitude: _________ PostLab Helpful Analysis Tools You can use the AnalyzeTrain macro to help with your analyses. To use this macro, first graph a single sweep of data that has one or more action potentials. Make sure that this graph is the top window by clicking on it. Now run the macro AnalyzeTrain. This macro will create three new windows. The first is a table of data that reports a number of parameters for each action potential in the train including its threshold, amplitude, width, and many others. You can copy the relevant data into a new Igor Pro table or Excel spreadsheet. The second window shows the AP train and the derivative of membrane voltage. Threshold and fast AHP are marked with green and blue crosses, respectively. The third graph shows interspike interval by spike number, a means of quantifying spike frequency adaptation.

BIO365L: Neurobiology Laboratory, Fall 2010
Module 2 – Page 17
Include these results in your blog. 1. Plot threshold voltage vs. current intensity for the first action potential initiated in each train. The action potential threshold is the voltage at which action potentials are first initiated (see diagram). Superimpose 2-3 select traces in a separate graph to illustrate your findings.
2. On the same graph, plot threshold voltage vs. current intensity for the first action potential initiated in each train after you changed the resting potential. Superimpose 2-3 select traces in a separage graph to illustrate your findings. 3. On a new graph, plot the threshold voltage by spike number within each train. Address these questions in your blog: 1. Does action potential threshold change across different stimulation intensities? 2. Do later action potentials appear to be initiated at the same voltage that the first one does? Why or why not? What does this result say about the relative balance between sodium and potassium currents during repetitive firing? 3. Does the value of the resting potential from which the action potential is initiated matter, in terms of the threshold voltage? Explain your answer. 4. Why is more current required to elicit action potentials when you hyperpolarize the cell? Experiment 2. Action potential waveforms and afterhyperpolarizations. Prelab You have learned about the different AHPs in hippocampal neurons and the ion currents underlying these AHPs. In this experiment, you will have a chance to observe the properties of the AHP characteristics.
AP
am
plitu
de
Threshold voltage

BIO365L: Neurobiology Laboratory, Fall 2010
Module 2 – Page 18
InLab 1. Set capacitance compensation and bridge balance appropriately 2. Elicit a single action potential. In the ADC_DAC panel, select the stimulus wave 1_ms_long_post_DAC as your stimulus wave. This wave delivers a brief stimulus pulse followed by a long recording interval that allows you to observe any AHPs after the action potential. You will control the amplitude of this wave by changing the multiplier in the box next to the wave name. Because this stimulus pulse is so short, you will probably need very large currents (perhaps 1000 – 2000 pA) to elicit an action potential. At these large stimulus intensities, the stimulus current can create a large artifact in your data sweep that looks like an action potential. Adjust your bridge balance frequently and carefully to minimize this artifact. Also - be sure to look closely at your data by zooming in on the voltage spike to be sure it is an action potential and not just stimulus artifact. 3. Elicit a burst of action potentials. . In the ADC_DAC panel, select the stimulus wave 500_ms_long_post_DAC as your stimulus wave. This will deliver a 500 ms current step followed by a long recording interval so you can observe any AHPs that occur. This stimulus will require a much lower intensity. Begin with a multiplier of 20 pA and increase the stimulus intensity until you get a burst of approximately 10 action potentials. PostLab Include these results in your blog. 1. Plot the single action potential. Zoom in on just the part of the graph where the action potential occurs so that the features of the single action potential are visible 2. Plot the burst of action potentials and the subsequent AHPs. It might be useful to make a second plot where you zoom in on the Y axis to highlight the AHP which will be small in comparison to the action potential amplitudes. Consider these discussion points: 1. What action potential features do you see? 2. Do you observe a fast afterhyperpolarization and or an afterdepolarization following the single action potential? What is the nature of the afterhyperpolarization following the burst of action potentials? Experiment 3. Dynamic range of frequency encoding and Spike Frequency Adaptation. PreLab Hippocampal neurons encode information about the strength of their excitatory inputs in the rate of their action potential firing. Here you will determine over what range of firing frequencies this encoding can occur. In many cases, hippocampal neurons

BIO365L: Neurobiology Laboratory, Fall 2010
Module 2 – Page 19
display spike frequency adaptation. You will assess the extent of spike frequency adaptation in your recordings. InLab 1. Set capacitance compensation and bridge balance appropriately. 2. Use the step pulse command module to deliver 1 second duration depolarizations. Start from threshold stimulation, and increase the current amplitude by 2-5 pA steps, until you detect the firing frequency (or number of action potentials during the step) no longer changes significantly. You should adjust your amplitude of your step size according to the sensitivity of the cell’s firing rate. Use smaller step increments at lower stimulus intensities when firing rate is highly sensitive to step size. Use larger step increments when you approach the upper end of the cell’s dynamic range (firing rate begins to saturate). Continue until the firing frequency saturates. That is, until the firing frequency does not increase over three or four subsequent current steps. Make appropriate notes in this table: To save yourself the trouble of counting action potential for each data sweep, you can set your current intensity, then run the macro DetectAP. This will collect a sweep of data, and report the number of action potentials in the Igor Pro command line.
Sweep # Current Ampl. Sweep # Current Ampl. Sweep # Current Ampl. PostLab Include these results in your Blog 1. In the same graph, plot 4-5 selected traces showing a range of different response frequencies. You can offset the traces so that they do not overlap. Simply click on a given trace, and hold the mouse button down for about a second. You can then move the trace with the mouse. 2. Plot AP firing frequency (Hz) vs. current strength (pA). 3. Plot spike interval by spike number for spike trains of low, intermediate and high frequency (use the Analyze Train macro to simplify this task).

BIO365L: Neurobiology Laboratory, Fall 2010
Module 2 – Page 20
Consider these discussion points in your blog: 1. What does dynamic range mean? 2. What does your plot of firing frequency vs. current strength say about the dynamic range of the cell? 3. Do you have evidence of spike frequency adaptation in your recordings? Experiment 4: Collaborative project - Characterize the Mystery Modulator The set of experiments that will be the focus of your lab report will require collaboration among all five lab groups. A number of neurotransmitters and hormones modulate the active properties of hippocampal neurons. The goal behind these experiments is to identify the effects of an unknown modulator on the firing properties of CA1 neurons and to determine the ionic targets of this modulator. This project will proceed in three phases. Phase 1: Each group will test the effects of a different channel toxin. The different channel toxins block different types of ion channels. We will use channel toxins that block sodium channels, calcium channels, M-type K+ channels, SK channels, and BK channels. While conducting these experiments and analyzing the data, you will not know which toxin your rig is using. Your task is to discover what effects your mystery toxin has on AP characteristics, F-I relationship, and spike patterning. Experimental Procedures: Begin by repeating Experiments 2 & 3 while recording from a CA1 pyramidal cell in normal ACSF. It is extremely important to adjust the bridge balance frequently and carefully to obtain valid results. The parameters we are measuring also are time sensitive, so it is important to complete the experiments quickly but not recklessly. Change your perfusion to an ACSF solution containing one of the selected toxins. Allow the new solution to wash in for 5-10 minutes, then repeat Experiments 2 & 3 again checking the bridge balance frequently. Analysis. Use the same analysis strategies as you did in Experiments 2 & 3, comparing results for normal ACSF against results in the presence of your toxin. To fully understand the effects of each toxin, it will be necessary to analyze and search as many parameters as possible. Consult with your instructor or TA for advice. After you have characterized the effects of the toxin, we will reveal what your toxin is, and the particular ion channel type that it blocks. Phase 2: Each group will test the effects of a “mystery modulator”. All five groups will be using the same modulator at this stage. This modulator is a neurotransmitter that modifies a particular ion current to change the action potential properties of hippocampal neurons. Your task is to determine which AP properties are changed by

BIO365L: Neurobiology Laboratory, Fall 2010
Module 2 – Page 21
this modulator. You will evaluate the modulator’s effects on AP threshold, AP waveform, AHP characteristics, F-I relationship, and spike patterning. The experimental procedures and analyses will be the same as in Phase 1, except that the test compound will be the mystery modulator and not various ion channel toxins. Phase 3: Integration, collaboration, and analysis. Your task as a group will be to decide which ion current(s) are being targeted by the mystery modulator. You will use the knowledge you have gained about the effects of blocking different ion currents and the effects of the mystery modulator. It will be important to consider what blocking a particular ion current does to the neuron, as well as knowing what each toxin does not do. During this phase of the project, we will discuss the results and your conclusions. You undoubtedly will identify additional experiments that will need to be run in order to clarify ambiguities or further support your conclusions.
References Bean, B. P., 2007. The action potential in mammalian central neurons. Nat. Rev.
Neurosci. 8, 451-465.
Cui, J., Cox, D. H., Aldrich, R. W., 1997. Intrinsic voltage dependence and Ca2+ regulation of mslo large conductance Ca-activated K+ channels. J. Gen. Physiol. 109, 647-673.
Faber, E. S., Sah, P., 2003. Calcium-activated potassium channels: multiple contributions to neuronal function. Neuroscientist. 9, 181-194.
Gu, N., Vervaeke, K., Hu, H., Storm, J. F., 2005. Kv7/KCNQ/M and HCN/h, but not KCa2/SK channels, contribute to the somatic medium after-hyperpolarization and excitability control in CA1 hippocampal pyramidal cells. J Physiol. 566, 689-715.
Gu, N., Vervaeke, K., Storm, J. F., 2007. BK potassium channels facilitate high-frequency firing and cause early spike frequency adaptation in rat CA1 hippocampal pyramidal cells. J Physiol. 580, 859-882.
Kanold, P. O., Manis, P. B., 1999. Transient potassium currents regulate the discharge patterns of dorsal cochlear nucleus pyramidal cells. J. Neurosci. 19, 2195-2208.
Matthews, E. A., Weible, A. P., Shah, S., Disterhoft, J. F., 2008. The BK-mediated fAHP is modulated by learning a hippocampus-dependent task. Proc Natl Acad Sci U S A. 105, 15154-15159.
Oh, M. M., McKay, B. M., Power, J. M., Disterhoft, J. F., 2009. Learning-related postburst afterhyperpolarization reduction in CA1 pyramidal neurons is mediated by protein kinase A. Proc Natl Acad Sci U S A. 106, 1620-1625.
BIO365L: Neurobiology Laboratory, Fall 2010
Module 2 – Page 22
Pedarzani, P., Mosbacher, J., Rivard, A., Cingolani, L. A., Oliver, D., Stocker, M., Adelman, J. P., Fakler, B., 2001. Control of electrical activity in central neurons by modulating the gating of small conductance Ca2+-activated K+ channels. J. Biol. Chem. 276, 9762-9769.
Peron, S., Gabbiani, F., 2009. Spike frequency adaptation mediates looming stimulus selectivity in a collision-detecting neuron. Nat. Neurosci. 12, 318-326.
Rogawski, M. A., 2000. KCNQ2/KCNQ3 K+ channels and the molecular pathogenesis of epilepsy: implications for therapy. Trends Neurosci. 23, 393-398.
Selyanko, A. A., Hadley, J. K., Wood, I. C., Abogadie, F. C., Jentsch, T. J., Brown, D. A., 2000. Inhibition of KCNQ1-4 potassium channels expressed in mammalian cells via M1 muscarinic acetylcholine receptors. J Physiol. 522 Pt 3, 349-355.
Staff, N. P., Jung, H. Y., Thiagarajan, T., Yao, M., Spruston, N., 2000. Resting and active properties of pyramidal neurons in subiculum and CA1 of rat hippocampus. J. Neurophysiol. 84, 2398-2408.
Stocker, M., 2004. Ca(2+)-activated K+ channels: molecular determinants and function of the SK family. Nat. Rev. Neurosci. 5, 758-770.

BIO365L: Neurobiology Laboratory, Fall 2010
Module 2 – Page 23
Optional supplementary experiment: Action potential refractory period PreLab You have learned in your coursework that a refractory period is the time after an action potential where a neuron is transiently rendered less excitable, or entirely inexcitable. In this experiment, you will probe this phenomenon directly using pairs of brief depolarizations. The refractory period is not only extremely important in regulating repetitive firing in neurons, it also serves as an easy experimental assay with which to eavesdrop on the complicated interactions of voltage-gated sodium and potassium channels. InLab 1. Set capacitance compensation and bridge balance appropriately. 2. You will use the macro “dualStepInjections” to deliver pairs of 1-ms step pulse stimuli with different intensities and with different intervals. When you run this macro, you will enter three parameters: step1ampl, step2ampl, and interval. Enter a current value (in pA) for step 1 and step 2 amplitude, use an interval of 200 ms at first. When you run this macro the first time, nothing will happen. Now go to the ADC_DAC panel and select Twopulse_DAC as the stimulus wave. You can now use this macro to complete the experiment. Beginning with a 200 ms interval, keep increasing the stimulus amplitudes until both steps elicit an action potential. Then begin decreasing the interstimulus interval by 20 ms increments. Note that at shorter ISIs the action potential will either change shape and/or amplitude. Continue shortening the inter-stimulus interval (ISI) until the second response falls subthreshold entirely. Now increase stim 2 amplitude by increments, up to 2000 pA. Can you trigger the second action potential? If you are able to initiate a second action potential, record the stimulus current. You are within a window of time referred to as the relative refractory period. Now continue decrease the stimulus interval by smaller increments. At very short ISIs, you will be unable to elicit an action potential with the second stimulus even with stimulus amplitudes of 2000 pA. This is the absolute refractory period. Make a note of the value of this ISI. PostLab Include these results in your Blog. 1. Make a plot of threshold current (for the second action potential) vs. interstimulus interval (ISI). As in all of your graphs, be sure to label both axes clearly, including the units in parentheses. For example, the Y-axis will be labeled Threshold current (pA). 2. Make a graph with responses to just suprathreshold stimulation. Superimpose responses to different ISIs. 3. Plot action potential amplitude (relative to rest) as a function of interstimulus interval.

BIO365L: Neurobiology Laboratory, Fall 2010
Module 2 – Page 24
Consider these discussion points in your blog: 1. Within the relative refractory period, why does the generation of the second action potential require a larger stimulus strength compared to the first? In regard to sodium channels, what are you actually changing as you increase the size of the current step (and thus the magnitude of the depolarization)? Discuss the mechanisms underlying both the absolute and relative refractory periods. 2. As you decreased the interstimulus interval, you likely noticed that the amplitude of the action potential decreased in a graded manner. Why? Be sure to discuss in your answer both sodium channel inactivation and potassium channel deactivation, and how these processes might contribute to this phenomenon.