lab on a chip 2013 qian liu
TRANSCRIPT

Cite this: Lab Chip, 2013, 13, 955
Label-free DNA quantification via a ‘pipette, aggregateand blot’ (PAB) approach with magnetic silica particleson filter paper
Received 25th August 2012,Accepted 3rd January 2013
DOI: 10.1039/c2lc40975e
www.rsc.org/loc
Jingyi Li,3ad Qian Liu,3ad Hussein Alsamarri,a Jenny A. Lounsbury,ad DorisM. Haversitickc and James P. Landers*abcd
Reliable measurement of DNA concentration is essential for a broad range of applications in biology and
molecular biology, and for many of these, quantifying the nucleic acid content is inextricably linked to
obtaining optimal results. In its most simplistic form, quantitative analysis of nucleic acids can be
accomplished by UV-Vis absorbance and, in more sophisticated format, by fluorimetry. A recently reported
new concept, the ‘pinwheel assay’, involves a label-free approach for quantifying DNA through
aggregation of paramagnetic beads in a rotating magnetic field. Here, we describe a simplified version
of that assay adapted for execution using only a pipet and filter paper. The ‘pipette, aggregate, and blot’
(PAB) approach allows DNA to induce bead aggregation in a pipette tip through exposure to a magnetic
field, followed by dispensing (blotting) onto filter paper. The filter paper immortalises the extent of
aggregation, and digital images of the immortalized bead conformation, acquired with either a document
scanner or a cell phone camera, allows for DNA quantification using a noncomplex algorithm. Human
genomic DNA samples extracted from blood are quantified with the PAB approach and the results utilized
to define the volume of sample used in a PCR reaction that is sensitive to input mass of template DNA.
Integrating the PAB assay with paper-based DNA extraction and detection modalities has the potential to
yield ‘DNA quant-on-paper’ devices that may be useful for point-of-care testing.
Introduction
Breakthroughs in methods for genetic analysis have blazed thetrail for the development of clinical diagnostic and forensicapplications. Typical work flow for DNA analysis includes DNApreparation and quantification, amplification by polymerasechain reaction (PCR), and subsequent detection (with orwithout fragment separation). The success of amplificationoften depends on the quality of prepared DNA, specificallypurity and concentration; thus, a quantification step oftenprecedes amplification and, in some cases, is critical toacquiring reliable results.
In a standard laboratory setting, UV-Vis absorbance andfluorescence spectroscopy are commonly used to quantify DNAat concentrations from nanograms down to picograms per
microliter prior to PCR, of which the performance seems tosuffice for a variety of applications. Measuring UV adsorptionat the wavelength of 260 nm is the most convenient andcommon technique to quantify DNA with concentrationaround 1–250 ng mL21. Another widely used technique isfluorescence spectroscopy, wherein fluorescent probes speci-fically bind to DNA through various mechanisms and generatefluorescent signal that are proportional to DNA mass. Forexample, the commercially available probe PicoGreen1 bindsto the minor groove of double-stranded DNA (dsDNA), anddsDNA can be detected down to 1 pg mL21. Although the limitof detection is improved using fluorescence spectroscopy,costly and sophisticated hardware is involved, and repetitivecalibration is required due to the unstable optical properties offluorescent labels.
With a view to point-of-care applications, paper-basedmicrofluidic systems have been the focus of much attentiondue to their portability, cost-effectiveness and low powerrequirements. The majority of publications in this area havebeen focused on detecting analytes such as ions,1 organicmolecules,2,3 proteins,3,4 and DNA sequences,5 optically orelectrochemically at endpoint. Govindarajan et al. recentlyreported a lab-on-paper device for cell lysis and DNA extractionas the preparation step of genetic analysis at the point of care,6
aDepartment of Chemistry, University of Virginia, McCormick Road, P. O. Box
400319, Charlottesville, Virginia, 22904, USA. E-mail: [email protected];
Tel: 1-434-243-8658bDepartment of Pathology, University of Virginia Health Science Center,
Charlottesville, Virginia, 22908, USAcDepartment of Mechanical Engineering, University of Virginia, Charlottesville,
Virginia, 22904, USAdCenter For Microsystems For The Life Sciences, University of Virginia,
Charlottesville, Virginia, VA 22904, USA
3 Contributed equally to this work.
Lab on a Chip
PAPER
This journal is � The Royal Society of Chemistry 2013 Lab Chip, 2013, 13, 955–961 | 955
Publ
ishe
d on
21
Janu
ary
2013
. Dow
nloa
ded
by P
rinc
eton
Uni
vers
ity o
n 25
/10/
2016
18:
19:1
7.
View Article OnlineView Journal | View Issue

which could be combined with microfluidic PCR systems7–9
and paper-based detection methods for rapid sample-to-resulttests. However, DNA quantification remains difficult in amicrofluidic system because of the large footprint, complexityand cost associated with the conventional techniques, and asimple DNA quantification method that can be integrated intopaper-based sample-to-result tests will provide timely feedbackto DNA isolation at the point of care, and assure samplequality for PCR and further analysis.
We have recently shown a new label-free modality for DNAquantification, the ‘pinwheel assay’, based on the aggregationof paramagnetic microbeads induced by DNA in a rotatingmagnetic field.10 Simple image analysis on the aggregationeliminates the need of fluorescent labels and correspondingoptics and enables integration of the pinwheel assay intomicrofluidic systems. In this report, we extend the assay to aneven more portable and cost-effective approach, in which theaggregates are prepared in an ‘image-ready’ form via a ‘pipet,aggregate and blot’ (PAB) approach on filter paper, and aretransformed into quantitative digital information by a photoscanner or a cell phone camera. This report evaluates theanalytical performance of the PAB assay and demonstrates anapplication of quantifying DNA templates for PCR andsubsequent detection.
In addition, consistent with the concept of developingsimple telemedicine using camera phones and paper-basedmicrofluidic devices for developing regions,4,11 the PAB assayenables rapid quantification of nanogram-scale samples priorto downstream analysis with enhanced simplicity, portabilityand cost-effectiveness compared with conventional techni-ques. Combining with paper-based DNA extraction anddetection modalities, the PAB assay could serve as a startingpoint towards more integrated lab-on-paper devices for point-of-care genetic analysis in resource-limited regions.
Experimental
Materials
1 mm Dynabeads1 MyOneTM SILANE was purchased from LifeTechnologies. 8 mm Magnesil paramagnetic beads werepurchased from Promega. Lambda phage genomic DNA (48.5kb long) was purchased from USB (Cleveland, OH). Humangenomic DNA was purified from whole blood with DNAisolation kit purchased from QIAGEN. Whole blood sampleswere donated by consenting donors. Qualitative Grade 3 FilterPaper with 6 micrometer particle retention was purchasedfrom Whatman1. Pipet tips (VWR Universal Fit Bevel PointPipet Tip) were purchased from VWR. AmpFlSTR1 COfiler1PCR Amplification Kit purchased from Applied Biosystems wasused for STR analysis.
Reagent and sample preparation
200 mL of Dynalbeads1 MyoneTM Silane was washed 3 timeswith GdnHCl solution (8 M, 16 TE, adjusted to pH 6.1 with100 mM MES) and then diluted 10 times with 6 M GdnHClsolution. 30 mL of stock Magnesil beads was washed once with
deionized, distilled water (Nanopure) followed by one washwith 8 M GdnHCl solution and resuspended in 1 mL ofGdnHCl solution to make the suspension. Human genomicDNA was purified from whole blood with QIAGEN DNAisolation kit following instructions from the manufacture.The DNA concentration of standard samples was determinedwith UV-Vis spectroscopy. DNA samples were diluted seriallywith 16 TE buffer (10 mM Tris base, 1 mM EDTA, pH 8.0) toappropriate concentrations, aliquoted, and stored at 220 uCuntil use.
DNA quantification with the PAB assay
2 mL of magnetic beads and 1 mL of DNA sample were mixed ina pipet tip, and the mixture was exposed to a magnetic fieldaround 1000 Gauss for 40 s to induce bead aggregation. The 3mL droplet was dispensed onto filter paper, forming a wet areaaround 1 cm in diameter. After the area dried by evaporationat room temperature, the image of aggregates on the paperwas acquired with EPSON Perfection V100 Photo Scanner oriPhone 3GS for data analysis.
Image processing
Images of each dispensed area were cropped from the originalphoto in TIF format. The images were imported intoMathematica in HSB (hue–saturation–brightness) mode, andthe saturation data was extracted for further analysis. Anisodata algorithm written in Mathematica10 was applied to thesaturation data of negative controls (beads without DNA), andit defined a threshold for all the images, above which thepixels represent the beads and aggregates. The total number ofthese pixels in each image (i.e., dark area) was normalized tothe negative controls, and correlated with DNA concentration.
STR analysis
STR analysis was performed according to the manufacturer’sinstruction. Briefly, DNA samples were amplified using theAmpFlSTR COfiler kit reagents, and the PCR products wereseparated on ABI PRISM 310 Genetic Analyzer, whichgenerates electropherograms for further interpretation.
Results and discussion
The pinwheel assay has been shown as a simple, cost-effective,and accurate method for DNA quantification.12 When con-sidering applications that deal with real-world samples, we aredeveloping two formats of the assay. The first is a shoebox-sized system that accommodates a multiplexed microwelldevice for parallel processing of multiple samples for DNAquantification in a high throughput manner.13 This is underdevelopment and will be ideal as a central clinical lab orresearch-focused tool.
The elegance of the pinwheel concept is its simplicity, andthe second format aims to exploit this with a focus on point-of-care testing. This involves applying the pinwheel phenomenonin an orthogonal format using smaller, more portable, cost-effective hardware with a simple-to-execute methodology. Inpoint-of-care testing, particularly with Global Health applica-
956 | Lab Chip, 2013, 13, 955–961 This journal is � The Royal Society of Chemistry 2013
Paper Lab on a Chip
Publ
ishe
d on
21
Janu
ary
2013
. Dow
nloa
ded
by P
rinc
eton
Uni
vers
ity o
n 25
/10/
2016
18:
19:1
7.
View Article Online

tions, cost-effectiveness and sensitivity must be balanced, butsimplicity for an unskilled user is a must. The PAB approach tothe pinwheel assay (Fig. 1) utilizes the most simple,inexpensive, and readily available materials in researchlaboratories – a pipet, a magnet for aggregation, filter paperfor immortalising the state of aggregation, and a cell phone asthe modality for data acquisition, transmission and analysis.
As shown in Fig. 1A, the PAB assay involves: (1) pipettingboth a suspension of silica-coated magnetic beads in GuHCland an aliquot (typically 1 mL) of DNA-containing sample, (2)promoting DNA-bead aggregation by exposure to a magneticfield, (3) dispensing the pipetted volume (blotting) onto filterpaper, (4) acquire the image of blotted filter paper with a photoscanner or a cell phone camera, and (5) transferring the datafrom the scanner to a computer for quantitative processing.Using a cell phone camera (iPhone 3GS with 3 megapixels) toacquire images also suffices for image capture and quantifica-tion. At the point of care, cell phones can be used to send datato a central laboratory and receive results through cellularnetwork, or with the computing power of a smart phone, thedata can be processed on site.
In the absence of DNA (‘2’ in Fig. 1A), the beads remain ina dispersed state within pipet tip, and when dispensed(blotted) onto filter paper, they spread over a large area. Inthe presence of DNA (‘+’ in Fig. 1A), DNA strands adsorb ontonearby silica beads driven by the chaotrope (8 M GdnHCl); theapplied magnetic field mobilizes the beads, enhancing DNA–bead interaction and, thus, promoting further aggregation.When blotted on the filter paper, the beads appear focused toa pinpoint. The images are imported into Mathematica in HSB(hue–saturation–brightness) mode. The hue data is not welldefined for white color, and the change of brightness data
appears less sensitive to bead aggregation than saturation, sothe saturation data is selected to characterize the differencebetween images. Two peaks evolve in the saturation histogramof negative controls, corresponding to the white background(saturation = 0–20) and light brown beads (saturation >20). Inthe histogram of positive controls, the white background peakremains while the other peak shift to saturation above 250,which represents the dark brown aggregates (Fig. 1B). Thechange in the saturation histogram thus provides a simplemeans to quantify the extent of aggregation, which correlateswith DNA concentration.
In order to extract quantitative information from theimages, serially diluted DNA samples were assayed by thePAB method. As shown in Fig. 2A, the saturation histogramsfor each sample was distinct, clearly illustrating the transitionfrom dispersed beads to tight aggregates as DNA concentra-tion was increased. In order to subtract the white backgroundfrom each image, a threshold needed to be established todistinguish the pixels representing the dispersed beads orbead aggregates; this was achieved by applying the isodataalgorithm reported previously to the negative controls.10 In allimages, regardless of differences in DNA concentration, thebeads and aggregates can be quantitatively represented by thenumber of pixels with a saturation above the threshold – thisis referred to as ‘dark area’. As seen in Fig. 2B, the totalnumber of pixels (i.e., dark area) decreases (due to the loss ofdispersed beads) as the aggregates evolve in the presence ofDNA. The dark area values are normalized against the negativecontrol, and correlated with DNA concentration, which fitswell in an exponential model (Fig. 2B). The sensitivity is not ashigh as previously reported with the pinwheel assay,10
primarily because the dispersed beads are not distributed on
Fig. 1 The pinwheel assay via the PAB approach. (A) General experimental procedure. (B) The two scanned images represent magnetic beads blotted on filter paperwithout and with DNA, i.e., negative and positive control respectively. (C) Saturation histograms in HSB (hue–saturation–brightness) color space of the negative andpositive controls. The red curve represents the average of the 14 replicates (gray curves).
This journal is � The Royal Society of Chemistry 2013 Lab Chip, 2013, 13, 955–961 | 957
Lab on a Chip Paper
Publ
ishe
d on
21
Janu
ary
2013
. Dow
nloa
ded
by P
rinc
eton
Uni
vers
ity o
n 25
/10/
2016
18:
19:1
7.
View Article Online
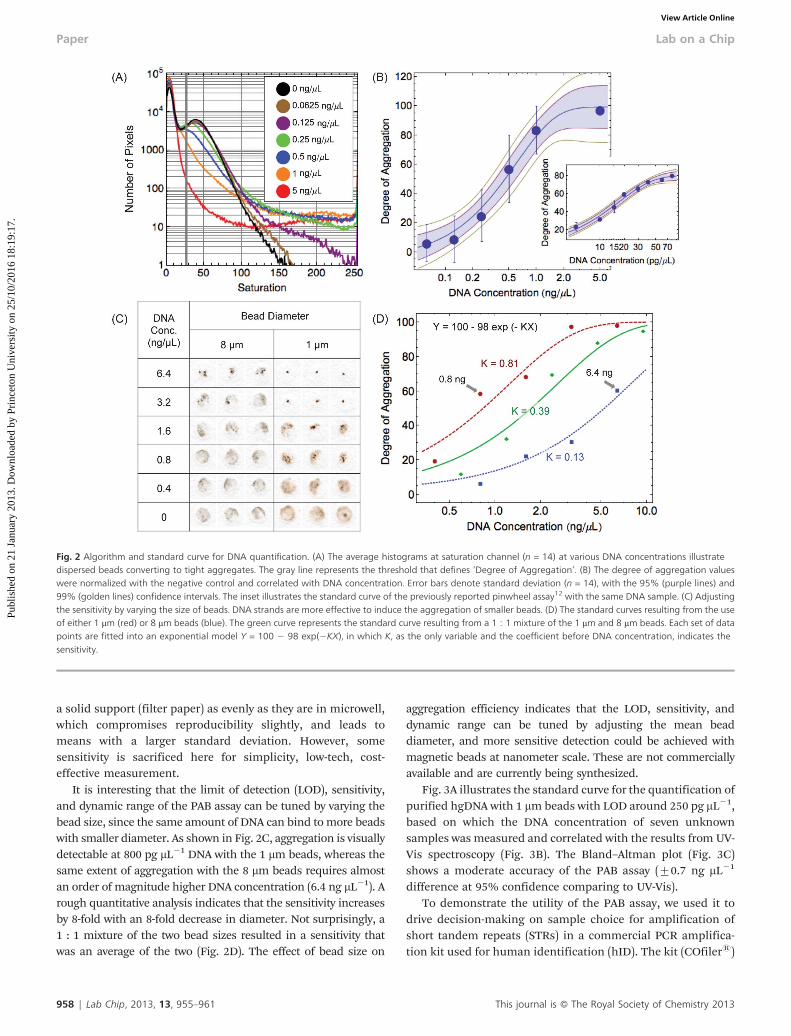
a solid support (filter paper) as evenly as they are in microwell,which compromises reproducibility slightly, and leads tomeans with a larger standard deviation. However, somesensitivity is sacrificed here for simplicity, low-tech, cost-effective measurement.
It is interesting that the limit of detection (LOD), sensitivity,and dynamic range of the PAB assay can be tuned by varying thebead size, since the same amount of DNA can bind to more beadswith smaller diameter. As shown in Fig. 2C, aggregation is visuallydetectable at 800 pg mL21 DNA with the 1 mm beads, whereas thesame extent of aggregation with the 8 mm beads requires almostan order of magnitude higher DNA concentration (6.4 ng mL21). Arough quantitative analysis indicates that the sensitivity increasesby 8-fold with an 8-fold decrease in diameter. Not surprisingly, a1 : 1 mixture of the two bead sizes resulted in a sensitivity thatwas an average of the two (Fig. 2D). The effect of bead size on
aggregation efficiency indicates that the LOD, sensitivity, anddynamic range can be tuned by adjusting the mean beaddiameter, and more sensitive detection could be achieved withmagnetic beads at nanometer scale. These are not commerciallyavailable and are currently being synthesized.
Fig. 3A illustrates the standard curve for the quantification ofpurified hgDNA with 1 mm beads with LOD around 250 pg mL21,based on which the DNA concentration of seven unknownsamples was measured and correlated with the results from UV-Vis spectroscopy (Fig. 3B). The Bland–Altman plot (Fig. 3C)shows a moderate accuracy of the PAB assay (¡0.7 ng mL21
difference at 95% confidence comparing to UV-Vis).To demonstrate the utility of the PAB assay, we used it to
drive decision-making on sample choice for amplification ofshort tandem repeats (STRs) in a commercial PCR amplifica-tion kit used for human identification (hID). The kit (COfiler1)
Fig. 2 Algorithm and standard curve for DNA quantification. (A) The average histograms at saturation channel (n = 14) at various DNA concentrations illustratedispersed beads converting to tight aggregates. The gray line represents the threshold that defines ‘Degree of Aggregation’. (B) The degree of aggregation valueswere normalized with the negative control and correlated with DNA concentration. Error bars denote standard deviation (n = 14), with the 95% (purple lines) and99% (golden lines) confidence intervals. The inset illustrates the standard curve of the previously reported pinwheel assay12 with the same DNA sample. (C) Adjustingthe sensitivity by varying the size of beads. DNA strands are more effective to induce the aggregation of smaller beads. (D) The standard curves resulting from the useof either 1 mm (red) or 8 mm beads (blue). The green curve represents the standard curve resulting from a 1 : 1 mixture of the 1 mm and 8 mm beads. Each set of datapoints are fitted into an exponential model Y = 100 2 98 exp(2KX), in which K, as the only variable and the coefficient before DNA concentration, indicates thesensitivity.
958 | Lab Chip, 2013, 13, 955–961 This journal is � The Royal Society of Chemistry 2013
Paper Lab on a Chip
Publ
ishe
d on
21
Janu
ary
2013
. Dow
nloa
ded
by P
rinc
eton
Uni
vers
ity o
n 25
/10/
2016
18:
19:1
7.
View Article Online

contains the necessary primers to facilitate multiplex ampli-fication of tetranucleotide repeat regions at seven STR loci inthe human genome; the amplified products are separated anddetected via capillary gel electrophoresis. This kit (and othersfor human ID) is sensitive to the amount of input DNA
template, specifically, the input mass of DNA added to the PCRreaction mix must fall between 0.5 and 2.5 ng. Amplificationreactions with DNA template amounts below 0.5 ng aresusceptible to loss of alleles and, sometimes, complete loci(‘dropout’), while template masses above 2.5 ng can result in
Fig. 3 Quantification of human genomic DNA extracted from blood samples. (A) A standard curve was generated with serially diluted DNA samples. (B) The DNAconcentrations of seven samples were measured with the PAB assay and compared with the results from UV-Vis spectroscopy. Error bars denote the standarddeviation of four experiments. (C) The Bland–Altman plot reveals the agreement between the PAB assay and UV-Vis spectroscopy, with a difference band of ¡0.7 ngmL21 at 95% confidence (red dashed lines).
Fig. 4 Results of STR amplification after DNA quantitation using the PAB assay. (A) Full STR profile (7 of 7 loci) obtained from the sample containing 0.90 ng mL21
DNA. (B) Full STR profile (7 of 7 loci) obtained from the sample containing 5.04 ng mL21 DNA, however, there are several additional peaks due to pull up (circled red)and non-specific amplification (circled black). (C) A partial STR profile (only 3 of 7 loci – red circles) obtained from the sample containing 0.24 ng mL21 DNA, illustratingthe loss of STR fragments when template DNA concentration is not within the optimal DNA range.
This journal is � The Royal Society of Chemistry 2013 Lab Chip, 2013, 13, 955–961 | 959
Lab on a Chip Paper
Publ
ishe
d on
21
Janu
ary
2013
. Dow
nloa
ded
by P
rinc
eton
Uni
vers
ity o
n 25
/10/
2016
18:
19:1
7.
View Article Online

the amplification of non-specific products and/or a ‘bleed’ ofsignal into other colors, (‘pull-up’) generating extraneouspeaks in the electropherogram. Both of these scenarios hinderthe ability to effectively use the profile for human ID of anindividual. For these reasons, purified samples yielding highDNA concentrations must be diluted appropriately to fallinside the recommended template mass range.
DNA was purified from a whole blood sample using acommercial solid phase extraction kit (Qiagen). The purifiedDNA was diluted with TE buffer to provide a range of sampleconcentrations. The resultant concentration of DNA was deter-mined by analysis of 1 mL of solution by the PAB method and theapparent DNA concentration was determined to be 5.04 ng mL21.Based on this value, two dilutions of this sample were made; a66 dilution yield a DNA concentration that was determined by
PAB to be 0.9 ng mL21, while a further subsequent dilution (106)yielded a DNA concentration of 0.24 ng mL21 by the PAB method.These three samples spanned a range of concentrations that fallbelow, within and above the accepted range.
Each of these was used to input into the PCR mixture foramplification, the mass of DNA contained in a 1 mL aliquot.Results in Fig. 4A show that only the sample with a putativeDNA concentration of 0.90 ng mL21 successfully yielded all 7loci without interference from extraneous peaks. Excesstemplate (5.04 ng mL21) resulted in fluorescence intensity ofsome peaks exceeding the dynamic range of detection, leadingto inaccurate multicomponent analysis (Fig. 4B), while lowconcentration sample (0.24 ng mL21) was inadequate forsufficient amplification, leading to allele and locus dropout(4 of 7 loci) (Fig. 4C). To compare the DNA concentration
Fig. 5 The PAB approach towards a portable assay for point-of-care applications. (A) The images of blotted beads on filter paper are acquired by a cell phone camerawith 3 M pixels. (B) Saturation histogram illustrates the differences between the images at various DNA concentrations despite the noise generated from low imageresolution. (C). The mean difference between the Degree of Aggregation values measured by the cell phone camera and scanner is shown, with 95% confidenceband (red dashed lines). (D) A calibration curve is generated with the data points from cell phone camera. Error bars denote the standard deviation of fourexperiments. The black dashed line represents the calibration curve obtained with scanner as a comparison.
960 | Lab Chip, 2013, 13, 955–961 This journal is � The Royal Society of Chemistry 2013
Paper Lab on a Chip
Publ
ishe
d on
21
Janu
ary
2013
. Dow
nloa
ded
by P
rinc
eton
Uni
vers
ity o
n 25
/10/
2016
18:
19:1
7.
View Article Online

values determined by PAB, UV absorbance was carried out onthe original undiluted sample yielding values of 6.47 ng mL21
compare to 5.04 ng mL21 determined by PAB. The discrepancyis explained by Fig. 2C, from which it is clear that theDynabeads (1 mm) become saturated when the DNA concen-tration exceeds 3.2 ng mL21, thus, hindering the accuracy.Although the Pinwheel effect is highly specific to DNAmolecules, i.e. protein content does not cause bead aggrega-tion or interfere with the DNA adsorption onto silica,12 proteinat relatively high concentrations (e.g. 3% BSA) increases thesample viscosity, and therefore, changes the blot pattern. Onelimitation of the PAB assay is that it cannot provideinformation on the purity of DNA sample as of yet, whichwill be addressed in ongoing studies.
While we envision the PAB method as useful for rapid DNAquantification prior to genetic analysis in resource-limited areas,using it with macroscale DNA extraction via the Qiagen kit andconventional PCR-based STR analysis is not ideal (these arecumbersome and time-consuming) for cost-effective point-of-caretesting. However, we believe that this demonstrates the potentialutility of the PAB method as playing a role in genetic analysis.Work is underway towards a paper-based total analysis system.
Consistent with the concept of simplicity and portability, wetested a cell phone camera as the detector (rather than adesktop photo scanner). The photo scanner generates digitalimages with high resolution and consistent lighting condition,which may be challenging for cell phone camera under ambientlight. The 3 M-pixel camera on iPhone 3GS was used to acquirethe images of aggregation on filter paper, resulting in a 18.7-fold decrease of the number of pixels per image. Although thischange in digital resolution leads to failure of quantifying smallaggregates represented by the noisy profile above 100 saturation(Fig. 5A), the dark area values remain distinguishable atdifferent DNA concentrations because the camera can stillquantify the area of dispersed beads, which is the majorcontributor of dark area. The standard curve generated by thecell phone camera (Fig. 5B) is comparable to the one from photoscanner (Fig. 2B), denoting the feasibility of cell phone-basedPAB assay. Considering the wide accessibility of cell phonesworldwide, the use of cell phone camera enables a truly portableand cost-effective assay for the point of care.
It is important to note that similar approaches have beendescribed in the literature, although not for DNA detection.Zhao et al. describe a colorimetric detection method using apaper-based device involving gold nanoparticle aggregation.3
With their approach, aggregated oligo-adducted gold nano-particles are disrupted by DNAse (or adenosine) in the sample.This augments the distance between the gold nanoparticlesand, this causes a color change on paper that tracks with theDNAse activity. While the PAB assay is focused on DNAdetection, it is noteworthy that it is NOT diffusion-based, andit exploits a magnetic field to induce bead aggregation. Thisshortens the reaction time by two orders of magnitude fromhours to several minutes. Second, the PAB method employs amore sophisticated algorithm to interpret the images, thusproviding a more quantitative analytical method.
Conclusions and future work
The PAB assay quantifies DNA concentration in biosamples byinducing an aggregation of magnetic beads, and then immorta-lizing the ‘extent of aggregation’ by blotting onto filter paper.While not as elegant as current approaches in ‘paper micro-fluidics’,14 immortalizing the DNA-induced aggregation state oninexpensive filter paper, and then extracting quantitativeinformation about DNA concentration from the image is,perhaps, even more rudimentary in nature. Given furtherdevelopment, this method has the potential to significantlylower the cost of DNA quantification by eliminating instrumenta-tion and, in cases where fluors are employed, circumvents thecost associated with those reagents (and more sophisticatedinstrumentation).
In conclusion, we present a simple, portable, and label-freelab-on-paper assay for DNA quantification, which can befurther combined with paper-based DNA extraction methodand microfluidic PCR for sample-to-result genetic analysis atthe point of care. Since the filter paper and magnetic beadscan be readily functionalized, thoughtfully designed surfacemodification will bring great versatility to this approach, andquantitative assays for a variety of targets can be developed.
References
1 M. M. Mentele, J. Cunningham, K. Koehler, J. Volckens andC. S. Henry, Anal. Chem., 2012.
2 J. Lankelma, Z. Nie, E. Carrilho and G. M. Whitesides, Anal.Chem., 2012.
3 W. A. Zhao, M. M. Ali, S. D. Aguirre, M. A. Brook and Y.F. Li, Anal. Chem., 2008, 80, 8431–8437.
4 A. W. Martinez, S. T. Phillips, E. Carrilho, S. W. Thomas,H. Sindi and G. M. Whitesides, Anal. Chem., 2008, 80,3699–3707.
5 A. C. Araujo, Y. Song, J. Lundeberg, P. L. Stahl andH. Brumer, 3rd, Anal. Chem., 2012, 84, 3311–3317.
6 A. V. Govindarajan, S. Ramachandran, G. D. Vigil, P. Yagerand K. F. Bohringer, Lab Chip, 2012, 12, 174–181.
7 P. J. Asiello and A. J. Baeumner, Lab Chip, 2011, 11,1420–1430.
8 S. Park, Y. Zhang, S. Lin, T. H. Wang and S. Yang,Biotechnol. Adv., 2011, 29, 830–839.
9 Y. H. Zhang and P. Ozdemir, Anal. Chim. Acta, 2009, 638,115–125.
10 D. C. Leslie, J. Li, B. C. Strachan, M. R. Begley, D. Finkler, L.A. Bazydlo, N. S. Barker, D. M. Haverstick, M. Utz and J.P. Landers, J. Am. Chem. Soc., 2012, 134, 5689–5696.
11 D. S. Lee, B. G. Jeon, C. Ihm, J. K. Park and M. Y. Jung, LabChip, 2011, 11, 120–126.
12 D. C. Leslie, J. Y. Li, B. C. Strachan, M. R. Begley, D. Finkler,L. A. L. Bazydlo, N. S. Barker, D. M. Haverstick, M. Utz andJ. P. Landers, J. Am. Chem. Soc., 2012, 134, 5689–5696.
13 J. Li and J. P. Landers, Proceedings of The 15th InternationalConference on Miniaturized Systems for Chemistry and LifeSciences, 2011, 1956–1958.
14 A. W. Martinez, S. T. Phillips and G. M. Whitesides, Anal.Chem., 2010, 82, 3–10.
This journal is � The Royal Society of Chemistry 2013 Lab Chip, 2013, 13, 955–961 | 961
Lab on a Chip Paper
Publ
ishe
d on
21
Janu
ary
2013
. Dow
nloa
ded
by P
rinc
eton
Uni
vers
ity o
n 25
/10/
2016
18:
19:1
7.
View Article Online