lab on a chip - pennsylvania state universityjuh17:huang_ph_loc... · lab on a chip paper cite...
TRANSCRIPT

Lab on a Chip
PAPER
Cite this: Lab Chip, 2015, 15, 4166
Received 24th July 2015,Accepted 26th August 2015
DOI: 10.1039/c5lc00868a
www.rsc.org/loc
A spatiotemporally controllable chemical gradientgenerator via acoustically oscillating sharp-edgestructures†
Po-Hsun Huang,a Chung Yu Chan,a Peng Li,a Nitesh Nama,a Yuliang Xie,ab
Cheng-Hsin Wei,c Yuchao Chen,a Daniel Ahmeda and Tony Jun Huang*ab
The ability to generate stable, spatiotemporally controllable concentration gradients is critical for resolving
the dynamics of cellular response to a chemical microenvironment. Here we demonstrate an
acoustofluidic gradient generator based on acoustically oscillating sharp-edge structures, which facilitates
in a step-wise fashion the rapid mixing of fluids to generate tunable, dynamic chemical gradients. By con-
trolling the driving voltage of a piezoelectric transducer, we demonstrated that the chemical gradient pro-
files can be conveniently altered (spatially controllable). By adjusting the actuation time of the piezoelectric
transducer, moreover, we generated pulsatile chemical gradients (temporally controllable). With these two
characteristics combined, we have developed a spatiotemporally controllable gradient generator. The
applicability and biocompatibility of our acoustofluidic gradient generator are validated by demonstrating
the migration of human dermal microvascular endothelial cells (HMVEC-d) in response to a generated vas-
cular endothelial growth factor (VEGF) gradient, and by preserving the viability of HMVEC-d cells after
long-term exposure to an acoustic field. Our device features advantages such as simple fabrication and
operation, compact and biocompatible device, and generation of spatiotemporally tunable gradients.
Introduction
The spatial and temporal dynamics of biomolecule gradientsare essential in many biological processes.1–6 It has beenreported that cells respond differently to spatial and temporalcharacteristics of chemical stimuli, which in turn influencescell signalling,7–9 migration,10–15 differentiation,16–18 andmetastasis.19,20 Conventional gradient-generation platformssuch as the Boyden chamber and derivatives21–23 as well asmicropipette24,25 have been adopted because of their simplic-ity of fabrication and ease of use. These platforms, however,are limited to generating only static, monotonic gradientswithout tunable spatiotemporal characteristics (e.g., magni-tude, frequency, slope, and temporal and spatial resolution).
To explore the effect of the time and space dynamics ofgradients on cellular responses, microfluidic platforms havebeen advanced to generate chemical gradients with spatio-temporal control, including Christmas-tree-like channel net-works,26,27 microjet arrays,28,29 and source-sinkconfiguration.30–32 Most of these microfluidic-based gradientgenerators still employ passive means, either passivemixing33,34 or free-diffusion,35–38 making these approachesdifficult to generate gradients with high spatiotemporal reso-lution. In contrast to passive generation of concentration gra-dients, actively generating concentration gradients offerscompelling controllability and flexibility. One can envision amicrofluidic-based device that can—by active and controlla-ble means, “active mixing”—generate concentration gradientsof biomolecules of interest with highly controllable specificspatiotemporal characteristics.
Recently, active generation of gradients has been demon-strated using acoustofluidic-based platforms; two of the mostintriguing platforms are focused travelling surface acousticwaves (F-TSAW)39 and acoustically oscillating microbubbles.40
Though the F-TSAW based platform generated gradients thatcan be rapidly switched on and off and the resulting gradientprofiles can be easily adjusted, it is limited to generating onlymonotonic (mono-directional) gradients, and its applicabilityand biocompatibility are yet unproven for biological studies.The oscillating microbubbles-based platform, likewise, can
4166 | Lab Chip, 2015, 15, 4166–4176 This journal is © The Royal Society of Chemistry 2015
aDepartment of Engineering Science and Mechanics, The Pennsylvania State
University, University Park, PA 16802, USA. E-mail: [email protected] of Chemical Engineering, The Pennsylvania State University,
University Park, PA 16802, USAc Department of Nutritional Sciences, The Pennsylvania State University,
University Park, PA 16802, USA
† Electronic supplementary information (ESI) available: Video S1 – acousticstreaming patterns generated in our device. Video S2 – generation of chemicalgradient at sharp-edge region. Video S3 – generation of chemical gradient atdownstream regions. Video S4 – generation of different types of chemical gradi-ent. Video S5 – spatiotemporally controlled generation of chemical gradients.Video S6 – the movement of HMVEC-d cells in response to a VEGF gradient. SeeDOI: 10.1039/c5lc00868a
Publ
ishe
d on
04
Sept
embe
r 20
15. D
ownl
oade
d by
Pen
nsyl
vani
a St
ate
Uni
vers
ity o
n 26
/10/
2015
11:
37:0
5.
View Article OnlineView Journal | View Issue

Lab Chip, 2015, 15, 4166–4176 | 4167This journal is © The Royal Society of Chemistry 2015
generate spatiotemporally tunable gradients. However, theinstability of microbubbles over time41–44 and the size-/tem-perature-dependent operation of the platform make it unsuit-able for biological applications where long-term cell cultureis often needed, thereby limiting the versatility of thisapproach.
Here we demonstrate an active, spatiotemporally control-lable chemical gradient generator via an acoustofluidic45–60
(i.e., the fusion of acoustics and microfluidics) strategy. Thiswork is built primarily upon our previously reported oscillat-ing sharp edges induced acoustic streaming effects.61–64 Wehave shown that the sidewall sharp-edge-based mixer61 iscapable of rapidly mixing fluids in microscale on-demand. Inspite of these features, the sidewall sharp-edge-based mixerwe demonstrated previously61 can only yield constant concen-trations. In order to achieve the concentration gradients, inthis work we employed multiple sharp-edge structures toform multiple mixing sites at once. In addition, instead ofattaching the sharp edges to the sidewall of the channel, aswe demonstrated previously,61–64 we arranged the sharp-edgestructures in the middle of the channel in a ladder-likearrangement.
By taking advantage of these newly designed device fea-tures, we can mix two different solutions in a step-wise fash-ion and thus, obtain different mixtures of serially dilutedconcentrations simultaneously in the channel; in otherwords, we can serially dilute the mixture of two differentsolutions to establish a concentration gradient. Furthermore,once various flow rate combinations of two solutions areintroduced to the device, we can, accordingly, mix two solu-tions in various ratios, resulting in various gradient profiles.Using this sharp-edge-based acoustofluidic gradient genera-tor, one can generate a concentration gradient that is notonly spatiotemporally stable, but also spatiotemporally con-trollable. Spatiotemporal control over gradient profiles canbe easily achieved by adjusting the input signal of a piezo-electric transducer (frequency, voltages, and actuation time).Compared to existing microfluidic-based gradient genera-tors,39,40 our acoustofluidic gradient generator features dis-tinct characteristics such as stability, controllability, flexibil-ity, reliability, simplicity, and temporal response. Ourplatform is a promising candidate for a wide variety of bio-logical studies where the spatiotemporal dynamics of gradi-ents is highly relevant.
Concept and device design
Fig. 1a illustrates the design and concept of ouracoustofluidic device for the generation of chemical gradi-ents. The device is simple: a single-layer polydimethylsiloxane(PDMS) channel accommodating multiple sharp-edge struc-tures inside the channel and a piezoelectric transducer.Fluids of different compositions or concentrations—for thisexample, phosphate buffered saline (PBS) and PBS containingfluorescein isothiocyanate-dextran (FITC-dextran)—are simul-taneously injected into the channel through two separate
inlets. Before the piezoelectric transducer was activated, aside-by-side laminar flow of PBS and FITC-dextran wasobserved. Once the piezoelectric transducer was activated,the sharp-edge structures acoustically oscillated and therebygenerated acoustic streaming effects around the tip of eachsharp-edge structure (Fig. 1b). The induced acoustic stream-ing effects in turn mixed PBS and FITC-dextran in a step-wisefashion because of the ladder-like arrangement of sharp-edgestructures. The step-wise mixing established a concentrationgradient of FITC-dextran which was perpendicular to thedirection of fluid flow, i.e., along the direction of channelwidth (dotted line in Fig. 1a).
Fig. 1b illustrates an acoustic streaming pattern aroundthe tip of a sharp-edge structure, as well as the mixing of dif-ferent solutions due to the generated acoustic streamingeffect. Each sharp-edge structure constructed inside the chan-nel was of identical dimension to ensure that all sharp-edgestructures would be acoustically excited at a single drivingfrequency from the piezoelectric transducer; in other words,it was to ensure that the acoustic streaming effect induced byeach oscillating sharp-edge structure was identical in termsof strength. In order to eliminate undesired acoustic stream-ing effects, the sharp-edge structure was designed to be tear-drop-like, based upon a triangular structure of width 100 μm
Fig. 1 (a) Schematic of the acoustofluidic chemical gradientgenerator. (b) Schematic of the sharp-edge structure within our device.(c) Optical image of the acoustofluidic chemical gradient generator. (d)Design of the acoustofluidic gradient generator. To demonstrate con-trollable spatial resolution of generated chemical gradients, the down-stream region of the device is divided into three regions: region 1,region 2, and region 3.
Lab on a Chip Paper
Publ
ishe
d on
04
Sept
embe
r 20
15. D
ownl
oade
d by
Pen
nsyl
vani
a St
ate
Uni
vers
ity o
n 26
/10/
2015
11:
37:0
5.
View Article Online
4168 | Lab Chip, 2015, 15, 4166–4176 This journal is © The Royal Society of Chemistry 2015
and length 400 μm. Once it was acoustically oscillated by theactuation of the piezoelectric transducer, the oscillatingsharp-edge structure generated an acoustic streaming effectaround its tip: mass transport across the channel width wasenhanced (i.e., different fluids were mixed by breaking theinterface of laminar fluids). The mixing width was defined asthe width over which the generated acoustic streaming effectspanned across the channel; in other words, the mixingwidth can be an index of the strength of generated acousticstreaming effect. A lesser “mixing width” allowed the FITC-dextran to mix with a small amount of PBS, gently dilutingthe FITC-dextran. A greater mixing width, by contrast,allowed the FITC-dextran to mix with a significant amount ofPBS, greatly diluting the FITC-dextran. Given that the mixingwidth was proportional to the strength of the acousticstreaming effect and the strength was controllable by varyingthe driving voltage of the piezoelectric transducer, weadjusted the mixing width by controlling the driving voltage.We were able to alter the concentration of the resulting mix-ture by changing the driving voltage of the piezoelectrictransducer.
Materials and methodsExperimental setup and operation
Fig. 1c is a photograph showing our acoustofluidic device forgenerating concentration gradients. The preparation of ourdevice is simple and of one-layer fabrication. In short, asingle-layer PDMS device was first prepared using soft lithog-raphy and the mold-replica technique. Afterward, the single-layer PDMS channel was bonded onto a glass slide of 150 μmthickness (Cat. no. 48404-454, VWR, USA) after a plasmasurface-treatment for 60 seconds (BD-10AS, Electro-TechnicProducts, IL, USA), followed by bonding a piezoelectric trans-ducer (Model no. 273-073, RadioShack, USA) adjacent to thePDMS device on the same glass slide with a thin layer ofepoxy (Part no. 84101, Permatex, CT, USA). The actuation ofthe piezoelectric transducer, including ON/OFF switching,driving frequency and voltage, and actuation time, was con-trolled by a function generator (AFG3011C, Tektronix, USA)and an amplifier (25A250A, Amplifier Research, USA).
Fig. 1d shows the detailed channel design of our device.The channel depth was 100 μm throughout the channel. Toshow the spatial distribution of concentration gradient, thechannel downstream from the sharp-edge-structure regionwas designed to accommodate multiple regions of variouschannel widths: region 1 (1500 μm), region 2 (1000 μm), andregion 3 (700 μm). Region 3, here called the “migrationregion”, was particularly designed to be 700 μm wide for thedemonstration of cell migration experiment with our device.The width of the channel defines the width of the gradientprofiles generated. The sharp-edge structures were 650 μmand 240 μm apart, respectively, along the direction of chan-nel width IJx-direction) and length IJy-direction). The arrange-ment of sharp-edge structures, as shown in Fig. 1d, is opti-mized primarily based on the mixing width (i.e., the width of
one paired streaming-pattern) that one sharp-edge structurecan generate when acoustically oscillated. Nevertheless, it isworth mentioning that by changing the arrangement ofsharp-edge structures, the concentration gradient profilesmight be altered accordingly.
As our acoustofluidic gradient generator works by drivingthe piezoelectric transducer, the working frequency of thetransducer was experimentally determined by sweeping fre-quency with a 50 Hz increment from 1 kHz to 100 kHz. Weobserved that when the piezoelectric transducer was activatedat 14.0 kHz, the sharp-edge structures generated strongestacoustic streaming effect. When operated at this frequency,our device maximized the mixing distance as shown inFig. 1c, indicating that more solutions could be mixed whenother experimental conditions such as input voltages andflow rates remained unchanged. The frequency of 14.0 kHzwas thus used in following experiments.
To characterize the generated concentration gradients,phosphate buffered saline (1×-PBS, Life Technology, CA, USA)and PBS containing FITC-dextran (1 mg mL−1; MW = 10 kDa,Sigma-Aldrich, MO, USA) were pumped into the channelthrough two distinct inlets. The injection of these two solu-tions was performed using two separate 1 mL syringes (BDBioscience, NJ, USA), which were independently controlled byan automated syringe pump (neMESYS, Germany).
All of the experiments were conducted on the stage of aninverted microscope (TE2000-U, Nikon, Japan) that wasequipped with a cell incubation system (Chamlide TC, LiveCell Instrument, South Korea). The cell incubation systemprovides a humidified environment at 37 °C with a CO2 levelof 5% for on-chip cell culture. All the experimental imagesand videos were captured using Nikon NIS-ElementsAdvanced Research (AR) software, and the image and videoprocessing were conducted using ImageJ (NIH, MD, USA).
Cell preparation
Human dermal microvascular endothelial cells (HMVEC-d,ATCC, VA, USA) were grown in EndoGRO-LS complete media(Millipore, MA, USA) in a CO2 incubator (Nu-4750, NuAire,MN, USA), which maintained a temperature of 37 °C and aCO2 level of 5%. Cells grown to 80–90% confluency weretrypsinized IJTrypsin-EDTA-0.05%, Gibco, Life Technologies,NY, USA), washed with PBS, re-suspended in a new culturemedium at desired cell concentrations, and seeded into thechannel for experimentation.
Cell migration
In order to verify if the concentration gradients generated byour acoustofluidic gradient generator can be applicable forcell studies, cell migration experiments using HMVEC-d cellswere conducted with our gradient generator. To do so,HMVEC-d cells were cultured on-chip inside the channel ofour device. The channels were first coated with fibronectin(100 μg mL−1; Cat. no. 356008, BD Biosciences, NJ, USA) for 1hour. After coating, the channels were flushed with PBS
Lab on a ChipPaper
Publ
ishe
d on
04
Sept
embe
r 20
15. D
ownl
oade
d by
Pen
nsyl
vani
a St
ate
Uni
vers
ity o
n 26
/10/
2015
11:
37:0
5.
View Article Online

Lab Chip, 2015, 15, 4166–4176 | 4169This journal is © The Royal Society of Chemistry 2015
several times to remove residual fibronectin. SuspendedHMVEC-d cells (1 × 10⁶ cells mL−1) were then injected intothe channel through the PBS inlet (InletPBS), and as such theywere dispersed mostly near both sidewalls of the channel.The cells were allowed for 30 minutes to adhere to the bot-tom surface of the device coated with fibronectin. Once theyadhered to the substrate, pure EndoGro-LS media andEndoGro-LS media mixed with Human VEGF 165 (50 ngmL−1; Cat. no. 293-VE-010, R&D systems, MN, USA; herecalled “VEGF”) were injected into the channel, respectively,through the PBS inlet and the FITC inlet (InletFITC) at a flowrate ratio of 5 (RFLOW = 5; QEndoGro = 2.5 mL min−1 to QVEGF =0.5 mL min−1). Prior to the onset of establishing a VEGF gra-dient, we took an image to record the initial positions of theHMVEC-d cells (t = 0 hours). Once the VEGF gradient wasestablished, images were taken every 5 minutes to record cellmovement. After 6 hours, the VEGF gradient was shut off,and the cell migration region was divided into three zones(two side zones and one center zone). We tracked the move-ment of those cells seeded initially in two side zones, whilethose seeded in the center zone were excluded because theybarely moved in response to a high-concentration VEGF after6 hours (Fig. S1†).
We determined the number of cells for different types ofmovement. For comparison, cell migration experiments inwhich cells were exposed to only EndoGro medium wereconducted as a negative control (N-control). In addition, as apositive control (P-control), cell migration experiments wereconducted with media of the same conditions as the experi-mental group, but the VEGF gradient was OFF-state (in theabsence of acoustic field). Three independent experimentswere carried out for each of the three groups.
Cell viability
To evaluate the biocompatibility of our acoustofluidic gradi-ent generator for cell study, cell viability in our device wasassessed after lasting exposure to an acoustic field. Theassessment of cell viability was carried out by staining theHMVEC-d cells with live-stain Calcein-AM (CaAM) (Life Tech-nologies, NY, USA) and propidium iodide (PI) (Sigma-Aldrich,MO, USA) after exposure to the acoustic field for 6 hours inour device. To do so, 1 mL PBS containing 1 μL Calcein-AMas well as 1 μL PI was infused into the channel at a flow rateof 2 μL min−1 for 15 minutes. Afterward, pure PBS wasinjected at a flow rate of 2 μL min−1 for 15 minutes to washout residual viability dyes. As a control group, we assessedthe cell viability of those HMVEC-d cells which were culturedin the channel for 6 hours with no exposure to the acousticfield. Three independent experiments were performed forboth the control and experimental groups.
Statistical analysis
Data were presented as group means ± standard deviation(SD), and were analyzed by one-way ANOVA test using Prism
6.0 (GraphPad Software Inc., CA, USA). Differences amongtreatment groups were determined by Tukey's Multiple Com-parison test. A p-value of less than 0.05 was considered statis-tically significant.
Results and discussionCharacterization of flow patterns in our device
The shape and arrangement of the sharp-edge structureswere redesigned in this work, differing greatly from struc-tures designed in our previous work.61–64 We first conductedexperiments to verify if the sharp-edge structures, once acous-tically oscillated by the piezoelectric transducer, can induceacoustic streaming effects in the channel. Therefore, we firstvisualized and characterized the flow patterns and the acous-tic streaming patterns generated inside the channel of ouracoustofluidic device, by injecting into the channel DI watercontaining dragon green fluorescent beads of 1.9 μm diame-ter (Bangs Laboratories, IN, USA). Fig. 2 shows the experi-mentally observed and numerically simulated flow patternsand acoustic streaming effects at the sharp-edge-structureregion. Without a background flow, the fluorescent beadsremained stationary in the absence of an acoustic field (i.e.,the piezoelectric transducer was inactivated), as shown inFig. 2a. In the presence of an acoustic field (i.e., the piezo-electric transducer was activated), acoustic streaming effectsdeveloped around the tip of each sharp-edge structure as aresult of acoustically oscillating sharp-edge structures, asshown in Fig. 2b. Upon the introduction of a backgroundflow (from left to right), a laminar flow profile was observedwhen the piezoelectric transducer was inactivated (Fig. 2d);once the piezoelectric transducer was activated, the acousticstreaming effect could develop around the tip of each sharp-edge structure. It is worth noting that the background flowsignificantly suppressed the acoustic streaming pattern tonarrow rolls, as shown in Fig. 2e. A real-time video showingthe flow profiles and the acoustic streaming patterns devel-oped inside the channel can be found in ESI† (Video S1).
To understand the complex flow patterns developed insidethe microfluidic channel with sharp-edge structures, weconducted numerical simulations of the bead trajectories.The acoustic streaming flow was calculated using the pertur-bation approach.65 The details of this approach and the parti-cle tracking methodology can be found elsewhere.62 Thenumerical simulations of particle trajectories both withoutand with the background flow are shown in Fig. 2c and f,respectively. The numerical results are in good qualitativeagreement with the experimentally observed trajectories. Itwas observed in simulations that the background flow veloc-ity can be tuned in conjunction with the input power ofacoustic actuation to control the suppression of the acousticstreaming. The correspondence between flow patterns bothexperimentally observed and numerically simulated impliesthat the operation of our device can be predicted andcontrolled.
Lab on a Chip Paper
Publ
ishe
d on
04
Sept
embe
r 20
15. D
ownl
oade
d by
Pen
nsyl
vani
a St
ate
Uni
vers
ity o
n 26
/10/
2015
11:
37:0
5.
View Article Online

4170 | Lab Chip, 2015, 15, 4166–4176 This journal is © The Royal Society of Chemistry 2015
Generation of concentration gradients
In this section, we validated the generation of concentrationgradient using PBS and FITC-dextran solutions. The two solu-tions were independently pumped into the channel at differ-ent flow rates (QPBS = 2.5 μL min−1 & QFITC = 0.5 μL min−1).Unless otherwise specified, in this work the flow rate ratio(RFLOW = QPBS/QFITC = 5) of PBS and FITC-dextran remainedconstant for all experiments. To quantitatively characterizethe concentration gradients generated using our device, fluo-rescent images were captured from different regions: sharp-edge-structure region, region 1, region 2, and the migrationregion (region 3), followed by normalizing their fluorescenceintensity to that of 100% FITC-dextran (1 mg mL−1) measuredat the region upstream the sharp-edge-structure region. Fig.3a–c show the fluorescent images of FITC-dextran concentra-tion gradients at different regions and under different inputvoltages. When the piezoelectric transducer was off, a side-by-side laminar flow was observed due to low Reynolds num-ber in the microfluidic channel (Fig. 3a). Once the piezoelec-tric transducer was turned on with a voltage of 10 VPP, theacoustic streaming induced mixing in a step-wise fashion,thereby generating concentration gradients of FITC-dextran(Fig. 3b). As the input voltage was increased to 15 VPP, themixing width increased owing to the increase in the strengthof acoustic streaming; as a result, FITC-dextran (bright por-tion) was mixed with more PBS (dark portion), generating ashallower FITC-dextran gradient than that generated by10 VPP.
Fig. 3d–f show the corresponding normalized gradientprofiles under different input voltages at the three regions
(with different channel widths) downstream the channel.When the piezoelectric transducer was OFF, steeper gradientprofiles were formed solely from the free diffusion of PBSand FITC-dextran. As the input voltage was increased, theincreased mixing width enabled the mixing of FITC-dextranwith more PBS buffer, forming shallower gradient profiles.Once a driving voltage of 25 VPP was applied, a nearly flat gra-dient profile was established because the mixing spanned theentire channel due to stronger acoustic streaming. Theresults demonstrate that by adjusting the input voltage (i.e.,adjusting the mixing distance), the gradient profiles are mod-ulated, proving our acoustofluidic gradient generator spa-tially controllable. Additionally, the plots also illustrate thatthe width of gradient profiles could be tuned over a range, inthis work from 1500 μm to 700 μm, by changing the width ofthe channel downstream. We expect that the width of gradi-ent profile can be further widened to several millimeters, ornarrowed down to 50 μm.34 By alternating the piezoelectrictransducer, the gradient could be actively formed andremoved in real time (Video S2†), and even in downstreamregions the gradient could still be established and shut offwithin just a few seconds (Video S3†). This not only showsthe temporal controllability of our device, but also revealsthat we can expose cells from one gradient to another (e.g.,from gradient-OFF to gradient-ON) within a few seconds.
To demonstrate the flexibility of our sharp-edge-based gra-dient generator, furthermore, we constructed the sharp-edgestructures in an arrangement which established another gra-dient profile. As shown in Fig. S2,† we reconfigured thearrangements of the sharp-edge structures to establishanother type of gradient profile. With this specific
Fig. 2 (a) Fluorescent polystyrene beads seeded randomly inside the microchannel for visualization of flow profiles. (b) Experimentally observedstreaming profile around the sharp-edge structures on acoustic actuation visualized via trajectories of 1.9 μm diameter fluorescent beads. (c)Numerically simulated trajectories of 80 beads seeded uniformly inside the channel showing good qualitative agreement with the experimentalresults in (b). (d) Flow profile around sharp-edge structures due to a background laminar flow in the absence of acoustic actuation. (e) Experimen-tally observed trajectories of 1.9 μm diameter fluorescent beads. These resulted from the combination of acoustically generated streaming and thebackground laminar flow. (f) Numerically simulated trajectories of 80 beads seeded uniformly inside the channel about the structures shown in (e).Scale bar: 500 μm.
Lab on a ChipPaper
Publ
ishe
d on
04
Sept
embe
r 20
15. D
ownl
oade
d by
Pen
nsyl
vani
a St
ate
Uni
vers
ity o
n 26
/10/
2015
11:
37:0
5.
View Article Online

Lab Chip, 2015, 15, 4166–4176 | 4171This journal is © The Royal Society of Chemistry 2015
arrangement of sharp-edge structures, a mono-directional,linear gradient was generated. By adjusting the driving volt-age of the piezoelectric transducer, the gradient profile wasadjusted accordingly. Additionally, the temporal controllabil-ity of this type of gradient was also tested by alternating thepiezoelectric transducer (Video S4†). The results show theflexibility of our sharp-edge-based gradient generator. Inother words, we can, in conjunction with the simulationapproach we reported,62 arrange the sharp-edge structuresdifferently to establish concentration gradients with pre-scribed characteristics.
The effect of flow rate on the gradient generation
Our acoustofluidic gradient generator mixes two fluids asinduced by the acoustic streaming effect. This effect can besuppressed by introducing higher flow rates into the chan-nel.61,62 In this work we also investigated the effect of flowrate, including the total flow rate (QTOTAL = QPBS + QFITC) andthe flow rate ratio inside the channel, on the formation of a
FITC-dextran concentration gradient under a constant drivingvoltage. When studying the effect of total flow rate, we keptthe flow rate ratio constant (RFLOW = 5), while graduallyincreasing the flow rates of PBS and FITC-dextran. Fig. 4ashows the fluorescent images captured at the sharp-edge-structure region when various total flow rates were appliedwith a driving voltage of 25 VPP. At a lower total flow rate(QTOTAL = 3 μL min−1; QPBS = 2.5 μL min−1; QFITC = 0.5 μLmin−1), a nearly-complete mixing of FITC and PBS in thechannel was observed (Fig. 4a), yielding a flat concentrationprofile (Fig. 4c). Along with the increase in total flow rate, themixing width was reduced (Fig. 4a), forming steeper gradientprofiles (Fig. 4c). The results suggest that under a fixed inputvoltage, the ability to oscillate sharp-edge structures toinduce acoustic streaming could be suppressed by high flowrates, which is in accordance with our previous finding.61,62
In other words, we could alternate the total flow rate toadjust the gradient profiles. Under two different flow rates,mixing behavior at the sharp-edge-structure region was com-pared in response to the change in driving voltage (Fig. S3†).
Fig. 3 Fluorescent images of generated FITC-dextran gradients at different regions (from left to right: sharp-edge-structure region, region 1,region 2, and region 3) when (a) the piezoelectric transducer is inactive, and the piezoelectric transducer is on at (b) 10 VPP and (c) 15 VPP. The plotsshow the corresponding gradient profiles under different voltages at three regions downstream the channel: (d) region 1: 1500 μm wide, (e) region2: 1000 μm wide, and (f) region 3: 700 μm wide. The results show that spatially controlled gradients may be generated by adjusting the input volt-age of the piezoelectric transducer and the channel width downstream the channel.
Lab on a Chip Paper
Publ
ishe
d on
04
Sept
embe
r 20
15. D
ownl
oade
d by
Pen
nsyl
vani
a St
ate
Uni
vers
ity o
n 26
/10/
2015
11:
37:0
5.
View Article Online

4172 | Lab Chip, 2015, 15, 4166–4176 This journal is © The Royal Society of Chemistry 2015
When changing the flow rate ratio while maintaining thetotal flow rate (QTOTAL = 6 μL min−1) and the driving voltage(25 VPP), we could shift the position of the interface of twosolutions. As such we established various concentration gra-dient profiles (Fig. 4b and d). Moreover, as shown in Fig. 4e,once the total flow rate was changed along with the flow rateratio (QFITC = 1 μL min−1 = constant), we generated gradientprofiles (Fig. 4e) different from those in Fig. 4d. The resultsonce again show that with our device, the widths and heightsof gradient profiles (or a related measure such as the slope ofa gradient profile) are easily controlled by adjusting the flowrates of two solutions.
Temporal control of gradient generation
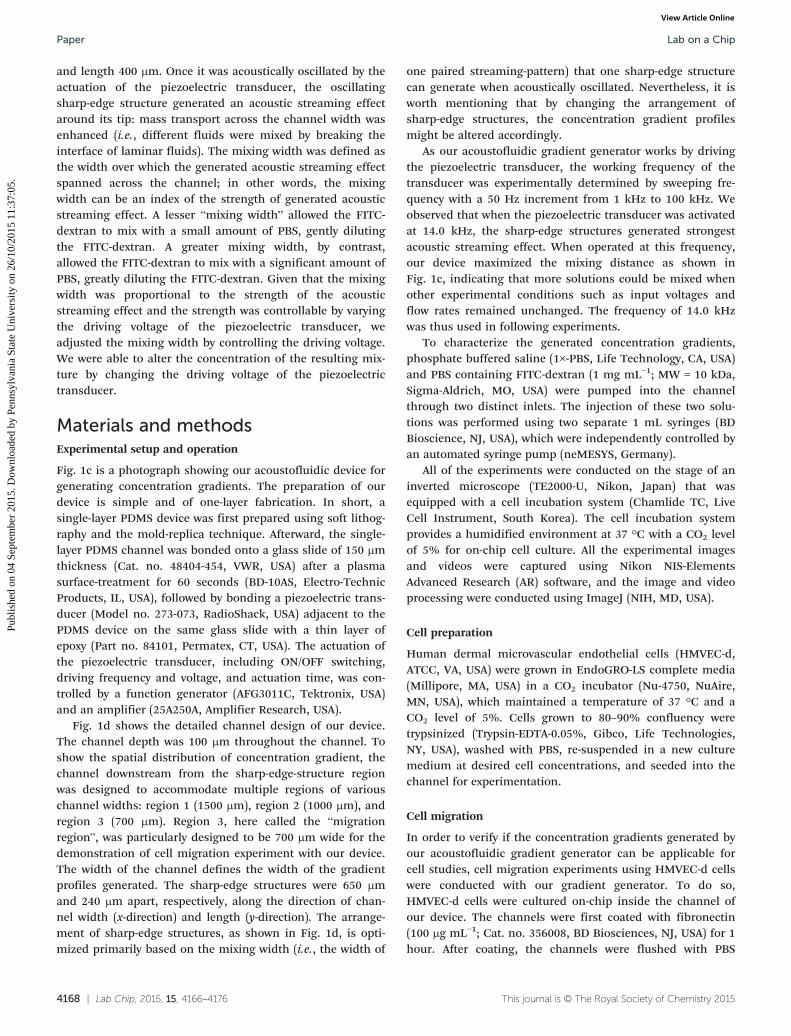
In contrast to existing passive gradient generators,33,34 ourdevice generates concentration gradients in an active fashion– a feature of particular importance for time-dependent cellstudies. Aside from the ability to generate static concentra-tion gradients of various profiles by adjusting the flow rateand the input voltage, our acoustofluidic device generatestemporally controllable gradients by modulation of the inputsignal of the piezoelectric transducer. Fig. 5a shows the fluo-rescent images of a complete cycle of gradient generation by
alternately triggering the piezoelectric transducer with aperiod (TTrigger) of 4 seconds (i.e., 2 s ON and 2 s OFF). Alter-nating the piezoelectric transducer, we generated an alternat-ing gradient profile at an alternating frequency of 0.25 Hz(Video S2† and Fig. 5b), which is comparable to otherexisting acoustic-based gradient generators.39,40 By adjustingthe triggering period, we will be able to generate gradientprofiles of various alternating frequencies. The results demon-strate that our device generates not only spatial concentrationgradients, but also temporal concentration gradients. Thetemporal resolution of our acoustofluidic gradient generator,namely the alternating frequency, can be further improved byincreasing the flow rate, or even changing the arrangementof the sharp-edge structures; however, there are a few thingsthat need to be taken into consideration. Increasing flowrate, for example, may also generate high flow shear stressesthat may result in undesirable cellular behavior; additionally,when introducing high flow rates, higher driving voltageswould be required to generate gradient profiles similar tothose generated under low flow rates.
To further demonstrate the spatiotemporal controllabilityof our acoustofluidic gradient generator, we alternated thepiezoelectric transducer by sweeping the driving frequencyfor different time intervals. Fig. 5c and d show the corre-sponding concentration profiles at the region of interest
Fig. 4 Fluorescent images of mixing behavior of FITC-dextran and DI water at the sharp-edge-structure region by varying (a) the total flow ratesof the fluids inside the channel (the flow ratio remained constant), and (b) the flow rate ratio of the two fluids (the total flow rate remained con-stant). The plots show the corresponding gradient profiles at region 3 downstream the channel by changing (c) the total flow rates of the fluidsinside the channel (the flow ratio remains constant, i.e., RFLOW = 5), (d) the flow rate ratio of the two fluids (the total flow rate remains constant),and (e) the flow ratio of the two fluids (the total flow rate is varied). These results demonstrate that by adjusting the total flow rate and the flowrate ratio, various gradient profiles may be generated using our acoustofluidic device.
Lab on a ChipPaper
Publ
ishe
d on
04
Sept
embe
r 20
15. D
ownl
oade
d by
Pen
nsyl
vani
a St
ate
Uni
vers
ity o
n 26
/10/
2015
11:
37:0
5.
View Article Online
Lab Chip, 2015, 15, 4166–4176 | 4173This journal is © The Royal Society of Chemistry 2015
(ROI) by sweeping the driving frequency from 13.0 to 14.0kHz, respectively, with sweeping times (TSweep) of 4 and8 seconds (Video S5†). We generated spatiotemporallycontrollable gradient profiles, and this capability can beuseful to elucidate time-resolving cellular signalingdynamics.
Cell migration in our acoustofluidic device
Thus far, we have demonstrated the capability and spatiotem-poral controllability of our sharp-edge-based gradient genera-tor via the aforementioned experiments and characteriza-tions. To further validate our device for cell studies (i.e.,
Fig. 5 (a) Fluorescent images showing a complete cycle of gradient generation at an ON/OFF frequency of 0.25 Hz (T = 4 s). The plots show thecorresponding fluorescence intensity profiles at regions of interest (ROI) in (a), when the gradient generator was operated at (b) an ON/OFFfrequency of 0.25 Hz, (c) by sweeping the working frequency of the piezoelectric transducer from 13 kHz to 14 kHz within 4 s, and (d) within 8 s.The results demonstrate the spatiotemporal control of the chemical gradient generation using our acoustofluidic device.
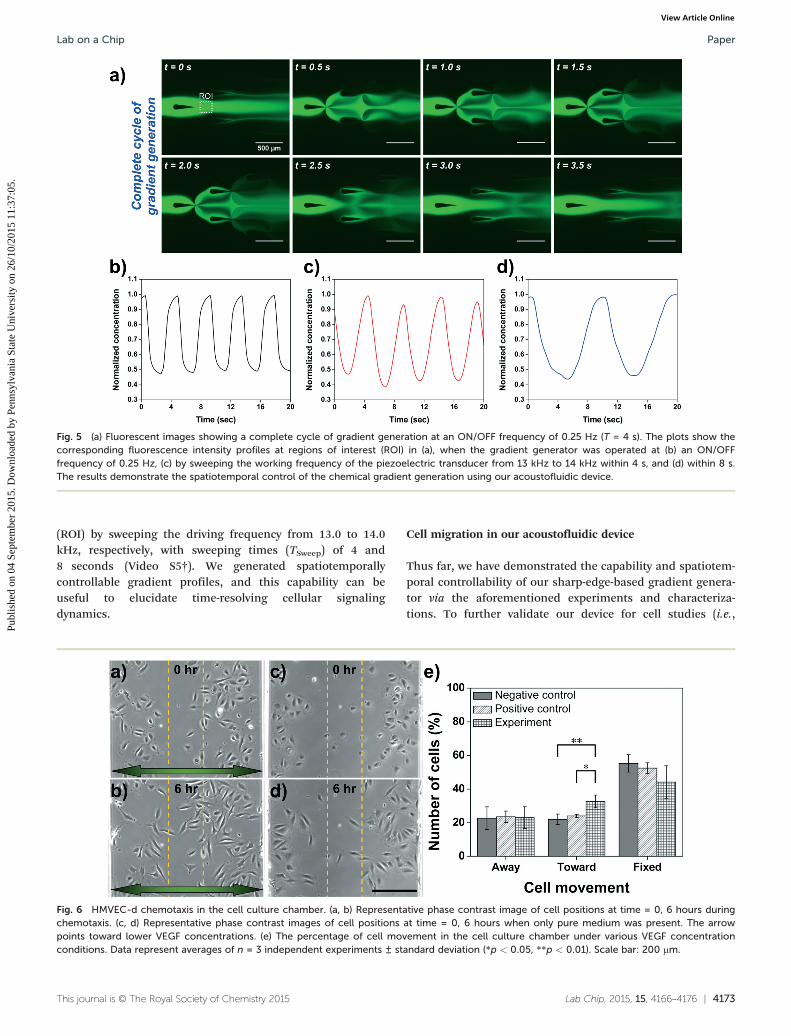
Fig. 6 HMVEC-d chemotaxis in the cell culture chamber. (a, b) Representative phase contrast image of cell positions at time = 0, 6 hours duringchemotaxis. (c, d) Representative phase contrast images of cell positions at time = 0, 6 hours when only pure medium was present. The arrowpoints toward lower VEGF concentrations. (e) The percentage of cell movement in the cell culture chamber under various VEGF concentrationconditions. Data represent averages of n = 3 independent experiments ± standard deviation (*p < 0.05, **p < 0.01). Scale bar: 200 μm.
Lab on a Chip Paper
Publ
ishe
d on
04
Sept
embe
r 20
15. D
ownl
oade
d by
Pen
nsyl
vani
a St
ate
Uni
vers
ity o
n 26
/10/
2015
11:
37:0
5.
View Article Online

4174 | Lab Chip, 2015, 15, 4166–4176 This journal is © The Royal Society of Chemistry 2015
applicability and biocompatibility), we conducted HMVEC-dcell migration experiments within our acoustofluidic gradientgenerator.
To demonstrate HMVEC-d cell migration in response to aVEGF concentration gradient generated by our device, thechannels were injected with pure EndoGro-LS media andEndoGro-LS containing VEGF, respectively, at QEndoGro = 2.5mL min−1 and QVEGF = 0.5 mL min−1. Under an input voltageof 15 VPP, a VEGF gradient profile as shown in Fig. 3f (15 VPP)was generated with a maximum concentration of ~25 ngmL−1 in the center of the channel, and a minimum concen-tration of ~10 ng mL−1 near both the sidewalls. The positionof each HMVEC-d cell was recorded by taking images every 5minutes, from t = 0 to 6 hours. Fig. 6a and b show the rela-tive position of HMVEC-d cells, respectively, before and after6 hours' exposure to the VEGF gradient (experimental group).As shown in Fig. 6e, when exposed to the VEGF gradient for 6hours, 33% of the cells seeded initially in the two sidewallzones had migrated toward the center of the channel (higherVEGF concentration), 23% of the cells migrated toward thesidewall (lower VEGF concentration), and 44% barely moved.In the absence of a VEGF gradient (negative-control group:pure medium only), by contrast, a striking decrease of nearly11% (from 33% to 22%) in the number of cells migratingtoward the center was observed, along with changes in thenumber of cells moving toward the sidewall (23%) and barelymoving (55%). Additionally, in the presence of a VEGF gradi-ent which was formed solely from diffusion (positive controlgroup; Fig. 3f), the number of cells moving toward the centerincreased by only about 2% (from 22% to 24%), with insignif-icant changes in the number of cells moving toward the
sidewall (~24%) and barely moving (~52%). Collectively, thenumber of cells moving toward the center when exposed to aVEGF gradient was statistically greater than those which wereexposed to the pure medium and the diffusion-based VEGFgradient. The results demonstrate that our acoustofluidicdevice generates VEGF gradients which in turn initiateHMVEC-d chemotaxis, demonstrating the capability of ourdevice for cell chemotaxis studies. Time-lapse images show-ing the HMVEC-d migration inside the channel of our deviceover 6 hours and 16 hours can be found in ESI† (Video S6).
Cell viability in the presence of lasting acoustic field
Our acoustofluidic device operates based upon acousticstreaming effects induced by the activation of a piezoelectrictransducer. We assessed cell viability upon acoustic stream-ing induced by sharp-edge structures as well as an appliedacoustic field, by subjecting cells to the acoustic field for 6hours (driving voltage = 20 VPP). Fig. 7 illustrates cell viabilitywithin the channel of our gradient generation device. As therepresentative bright-field images show, we monitored thecell viability for cells which were seeded in the sharp-edge-structure region and the migration region (region 3) (Fig. 7a).After 6 hours' exposure to the acoustic field, HMVEC-d cellsstill adhered to the substrate without any irregular morphol-ogy. Further, the HMVEC-d cells seeded in both the sharp-edge-structure region and the migration region remained via-ble; no dead cells were observed (Fig. 7b). The results arecomparable to those obtained in control-group experiments(absence of an acoustic field) (Fig. 7c). These results illustrate
Fig. 7 (a) Representative bright field (BF) images showing the cell morphology at sharp-edge-structure regions and cell migration regions.Corresponding fluorescent images showing the cell viability after 6 hours (b) in the absence of an acoustic field (control group) and (c) in thepresence of an acoustic field (experimental group). Scale bar: 200 μm.
Lab on a ChipPaper
Publ
ishe
d on
04
Sept
embe
r 20
15. D
ownl
oade
d by
Pen
nsyl
vani
a St
ate
Uni
vers
ity o
n 26
/10/
2015
11:
37:0
5.
View Article Online

Lab Chip, 2015, 15, 4166–4176 | 4175This journal is © The Royal Society of Chemistry 2015
that our acoustofluidic gradient-generation device isbiocompatible.
Extending the assessment of cell viability, we found thatafter 16 hours' exposure to an acoustic field (driving voltage =20 VPP), the HMVEC-d cells were still viable and present withnormal morphology at different regions inside the channel(Fig. S4†). These results again prove our device biocompati-ble, as well as viable for cell studies where long-term cell cul-ture is required.
Conclusions
Chemical gradient which are spatiotemporally stable and oftunable concentration can be generated using our sharp-edge-based acoustofluidic gradient generator. In contrast toexisting microfluidic gradient generators, in which the gradi-ents are formed solely based on passive mechanisms, ourdevice forms gradients in an active, controllable manner.Using our device, it is possible to generate gradients withcomplex profiles by changing the flow rate ratio of co-flowingfluids (stimulant and buffer), the driving voltage of the piezo-electric transducer, and the arrangement of sharp-edge struc-tures (spacing). Moreover, temporally changing gradients canbe easily generated by varying the driving voltage and theactuation time of the piezoelectric transducer. Our device iswell-suited for many chemical/biological studies and applica-tions, such as investigating cell chemotaxis, differentiation,migration, and drug discovery in dynamic chemical environ-ments. The effect of pulsatile chemical gradient upon cellulardynamics can be unveiled and much temporal informationabout cell signaling will be extracted upon development ofour platform.
Acknowledgements
This research was supported by National Institutes of Health(1 R01 GM112048-01A1 and 1R33EB019785-01), National Sci-ence Foundation (CBET-1438126 and IIP-1534645), and thePenn State Center for Nanoscale Science (MRSEC) under grantDMR-1420620. Components of this work were conducted atthe Penn State node of the NSF-funded National Nanotechnol-ogy Infrastructure Network.
References
1 E. K. Sackmann, A. L. Fulton and D. J. Beebe, Nature,2014, 507, 181–189.
2 E. Berthier and D. J. Beebe, Lab Chip, 2014, 12, 3241–3247.3 S. Kim, H. J. Kim and N. L. Jeon, Integr. Biol., 2010, 2,
584–603.4 T. M. Keenan and A. Folch, Lab Chip, 2008, 8, 34–57.5 C. Y. Chan, P.-H. Huang, F. Guo, X. Ding, V. Kapur, J. D.
Mai, P. K. Yuen and T. J. Huang, Lab Chip, 2013, 13,4697–4710.
6 D. Irimia, Annu. Rev. Biomed. Eng., 2010, 12, 259–284.7 A. Ainla, E. T. Jansson, N. Stepanyants, O. Orwar and A.
Jesorka, Anal. Chem., 2010, 82, 4529–4536.
8 J. Atencia, G. A. Cooksey and L. E. Locascio, Lab Chip,2012, 12, 309–316.
9 J. van Zon, M. Barkoulas and A. van Oudenaarden, Nat.Commun., 2014, 6, 1–11.
10 D. Jowhar, G. Wright, P. C. Samson, J. P. Wikswo and C.Janetopoulos, Integr. Biol., 2010, 2, 648–658.
11 T. S. Shimizu, Y. Tu andH. C. Berg,Mol. Syst. Biol., 2010, 6, 382.12 T. Ahmed, T. S. Shimizu and R. Stocker, Nano Lett., 2010, 10,
3379–3385.13 N. L. Jeon, H. Baskaran, S. K. W. Dertinger, G. M.
Whitesides, L. van de Water and M. Toner, Nat. Biotechnol.,2002, 20, 826–830.
14 A. Nakajima, S. Ishihara, D. Imoto and S. Sawai, Nat.Commun., 2014, 5, 1–14.
15 B. Meier, A. Zielinski, C. Weber, D. Arcizet, S. Youssef, T.Franosch, J. O. Rädler and D. Heinrich, Proc. Natl. Acad. Sci.U. S. A., 2011, 108, 11417–11422.
16 B. G. Chung, L. A. Flanagan, S. W. Rhee, P. H. Schwartz,A. P. Lee, E. S. Monuki and N. L. Jeon, Lab Chip, 2005, 5,401–406.
17 A. Shamloo, M. Heibatollahi and M. R. K. Mofrad, Integr.Biol., 2015, 7, 335–344.
18 J. Y. Park, C. M. Hwang, S. H. Lee and S.-H. Lee, Lab Chip,2007, 7, 1673–1680.
19 S. J. Wang, W. Saadi, F. Lin, C. Minh-Canh Nguyen and N. L.Jeon, Exp. Cell Res., 2004, 300, 180–189.
20 B. Lin, T. Yin, Y. I. Wu, T. Inoue and A. Levchenko, Nat.Commun., 2015, 6, 6619.
21 S. Boyden, J. Exp. Med., 1962, 115, 453–466.22 S. H. Zigmond, J. Cell Biol., 1977, 75, 606–616.23 D. Zicha, G. A. Dunn and A. F. Brown, J. Cell Sci., 1991, 99(Pt
4), 769–775.24 R. W. Gundersen and J. N. Barrett, Science, 1979, 206,
1079–1080.25 H. Song, G. Ming, Z. He, M. Lehmann, L. McKerracher, M.
Tessier-Lavigne and M. Poo, Science, 1998, 281, 1515–1518.26 F. Lin, W. Saadi, S. W. Rhee, S.-J. Wang, S. Mittal and N. L.
Jeon, Lab Chip, 2004, 4, 164–167.27 D. Irimia, S.-Y. Liu, W. G. Tharp, A. Samadani, M. Toner and
M. C. Poznansky, Lab Chip, 2006, 6, 191–198.28 T. M. Keenan, C. H. Hsu and A. Folch, Appl. Phys. Lett.,
2006, 89, 114103.29 B. G. Chung, F. Lin and N. L. Jeon, Lab Chip, 2006, 6,
764–768.30 B. Mosadegh, C. Huango, J. W. Park, H. S. Shin, B. G.
Chung, S. K. Hwang, K. H. Lee, H. J. Kim, J. Brody and N. L.Jeon, Langmuir, 2007, 23, 10910–10912.
31 W. Saadi, S. W. Rhee, F. Lin, B. Vahidi, B. G. Chung andN. L. Jeon, Biomed. Microdevices, 2007, 9, 627–635.
32 A. Shamloo, N. Ma, M.-M. Poo, L. L. Sohn and S. C.Heilshorn, Lab Chip, 2008, 8, 1292–1299.
33 S. K. W. Dertinger, D. T. Chiu, N. L. Jeon and G. M.Whitesides, Anal. Chem., 2001, 73, 1240–1246.
34 N. L. Jeon, S. K. W. Dertinger, D. T. Chiu, I. S. Choi, A. D.Stroock and G. M. Whitesides, Langmuir, 2000, 16,8311–8316.
Lab on a Chip Paper
Publ
ishe
d on
04
Sept
embe
r 20
15. D
ownl
oade
d by
Pen
nsyl
vani
a St
ate
Uni
vers
ity o
n 26
/10/
2015
11:
37:0
5.
View Article Online

4176 | Lab Chip, 2015, 15, 4166–4176 This journal is © The Royal Society of Chemistry 2015
35 H. Wu, B. Huang and R. N. Zare, J. Am. Chem. Soc.,2006, 128, 4194–4195.
36 J. Atencia, J. Morrow and L. E. Locascio, Lab Chip, 2009, 9,2707–2714.
37 K. Hattori, S. Sugiura and T. Kanamori, Lab Chip, 2009, 9,1763–1772.
38 T. Frank and S. Tay, Lab Chip, 2013, 13, 1273–1281.39 G. Destgeer, S. Im, B. H. Ha, J. H. Jung, M. A. Ansari and H.
Jin Sung, Appl. Phys. Lett., 2014, 104, 023056.40 D. Ahmed, C. Y. Chan, S.-C. S. Lin, H. S. Muddana, N. Nama,
S. J. Benkovic and T. J. Huang, Lab Chip, 2013, 13, 328–331.41 P.-H. Huang, M. I. Lapsley, D. Ahmed, Y. Chen, L. Wang and
T. J. Huang, Appl. Phys. Lett., 2012, 101, 141101.42 A. R. Tovar, M. V. Patel and A. P. Lee, Microfluid. Nanofluid.,
2011, 10, 1269–1278.43 D. Ahmed, X. Mao, B. K. Juluri and T. J. Huang, Microfluid.
Nanofluid., 2009, 7, 727–731.44 D. Ahmed, X. Mao, J. Shi, B. K. Juluri and T. J. Huang, Lab
Chip, 2009, 9, 2738–2741.45 H. Bruus, Lab Chip, 2012, 12, 20–28.46 M. Wiklund, R. Green and M. Ohlin, Lab Chip, 2012, 12,
2438–2451.47 P. Li, Z. Mao, Z. Peng, L. Zhou, Y. Chen, P.-H. Huang, C. I.
Truica, J. J. Drabick, W. S. El-Deiry, M. Dao, S. Suresh andT. J. Huang, Proc. Natl. Acad. Sci. U. S. A., 2015, 112,4970–4975.
48 P. B. Muller, R. Barnkob, M. J. H. Jensen and H. Bruus, LabChip, 2012, 12, 4617–4627.
49 Y. Chen, A. A. Nawaz, Y. Zhao, P.-H. Huang, J. P. McCoy, S. J.Levine, L. Wang and T. J. Huang, Lab Chip, 2014, 14, 916–923.
50 Y. Xu, A. Hashmi, G. Yu, X. Lu, H.-J. Kwon, X. Chen and J.Xu, Appl. Phys. Lett., 2013, 102, 023702.
51 A. Hashmi, G. Heiman, G. Yu, M. Lewis, H. J. Kwon and J.Xu, Microfluid. Nanofluid., 2013, 14, 591–596.
52 W.-K. Tseng, J.-L. Lin, W.-C. Sung, S.-H. Chen and G.-B. Lee,J. Micromech. Microeng., 2006, 16, 539–548.
53 I. Iranmanesh, R. Barnkob, H. Bruus and M. Wiklund,J. Micromech. Microeng., 2013, 23, 105002.
54 Y. Chen, X. Ding, S.-C. Steven Lin, S. Yang, P.-H. Huang, N.Nama, Y. Zhao, A. A. Nawaz, F. Guo, W. Wang, Y. Gu, T. E.Mallouk and T. J. Huang, ACS Nano, 2013, 7, 3306–3314.
55 F. Guo, P. Li, J. B. French, Z. Mao, H. Zhao, S. Li, N. Namaand J. R. Fick, Proc. Natl. Acad. Sci. U. S. A., 2015, 112,43–48.
56 J. Shi, D. Ahmed, X. Mao, S.-C. S. Lin, A. Lawit and T. J.Huang, Lab Chip, 2009, 9, 2890–2895.
57 J. Shi, H. Huang, Z. Stratton, Y. Huang and T. J. Huang, LabChip, 2009, 9, 3354–3359.
58 X. Ding, S.-C. S. Lin, B. Kiraly, H. Yue, S. Li, I.-K. Chiang, J.Shi, S. J. Benkovic and T. J. Huang, Proc. Natl. Acad. Sci. U.S. A., 2012, 109, 11105–11109.
59 S. Li, X. Ding, F. Guo, Y. Chen, M. I. Lapsley, S.-C. S. Lin, L.Wang, J. P. McCoy, C. E. Cameron and T. J. Huang, Anal.Chem., 2013, 85, 5468–5474.
60 X. Ding, Z. Peng, S.-C. S. Lin, M. Geri, S. Li, P. Li, Y. Chen,M. Dao, S. Suresh and T. J. Huang, Proc. Natl. Acad. Sci. U. S.A., 2014, 111, 12992–12997.
61 P.-H. Huang, Y. Xie, D. Ahmed, J. Rufo, N. Nama, Y. Chen,C. Y. Chan and T. J. Huang, Lab Chip, 2013, 13,3847–3852.
62 N. Nama, P.-H. Huang, T. J. Huang and F. Costanzo, LabChip, 2014, 14, 2824–2836.
63 P.-H. Huang, N. Nama, Z. Mao, P. Li, J. Rufo, Y. Chen, Y.Xie, C.-H. Wei, L. Wang and T. J. Huang, Lab Chip, 2014, 14,4319–4323.
64 P.-H. Huang, L. Ren, N. Nama, S. Li, P. Li, X. Yao, R. A.Cuento, C.-H. Wei, Y. Chen, Y. Xie, A. A. Nawaz, Y. G. Alevy,M. J. Holtzman, J. P. McCoy, S. J. Levine and T. J. Huang,Lab Chip, 2015, 15, 3125–3131.
65 X. Ding, P. Li, S.-C. S. Lin, Z. S. Stratton, N. Nama, F. Guo,D. Slotcavage, X. Mao, J. Shi, F. Costanzo and T. J. Huang,Lab Chip, 2013, 13, 3626–3649.
Lab on a ChipPaper
Publ
ishe
d on
04
Sept
embe
r 20
15. D
ownl
oade
d by
Pen
nsyl
vani
a St
ate
Uni
vers
ity o
n 26
/10/
2015
11:
37:0
5.
View Article Online