lab_03 manual measurements of s11_s21 in db
TRANSCRIPT
8/12/2019 Lab_03 Manual Measurements of S11_S21 in DB
http://slidepdf.com/reader/full/lab03-manual-measurements-of-s11s21-in-db 1/9
3-1
ECE 451Automated Microwave Measurements Laboratory
Experiment No. 3
Manual Measurements of |S11| in dB and |S21| in dB Usingthe HP8756A Swept Amplitude Analyzer
The purpose of this lab is to make manual measurements of the |S11| in dB and the |S21|in dB of an unknown using the HP8756A Swept Amplitude Analyzer. Follow theinstructions below.
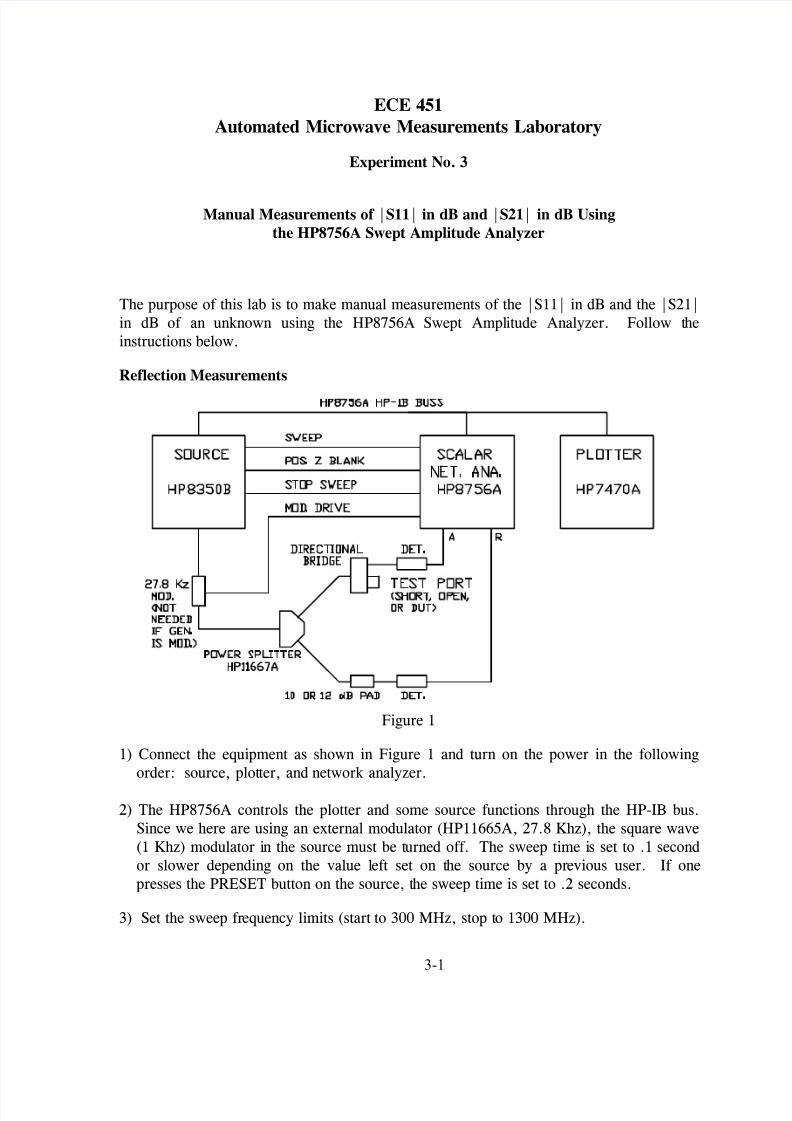
Reflection Measurements
Figure 1 1) Connect the equipment as shown in Figure 1 and turn on the power in the following
order: source, plotter, and network analyzer.
2) The HP8756A controls the plotter and some source functions through the HP-IB bus.Since we here are using an external modulator (HP11665A, 27.8 Khz), the square wave(1 Khz) modulator in the source must be turned off. The sweep time is set to .1 secondor slower depending on the value left set on the source by a previous user. If one presses the PRESET button on the source, the sweep time is set to .2 seconds.
3) Set the sweep frequency limits (start to 300 MHz, stop to 1300 MHz).
8/12/2019 Lab_03 Manual Measurements of S11_S21 in DB
http://slidepdf.com/reader/full/lab03-manual-measurements-of-s11s21-in-db 2/9
3-2
4) Set the source power level to +10 dBm.
5) The HP8756A has two identical channels. For reflection measurements only onechannel is required. Turn off channel 2 by pressing SHIFT (blue) then 2 CHAN OFF
(blue). If channel 1 is off, press any button in the channel 1 column to turn it on.
6) The next step is to calibrate the system using a short and an open. Step though thefollowing procedure:a. Press MAIN MENU (Yellow Button),b. Change the scale factor to 10 dB/div by pressing the SCALE button followed by
keying in 10 dB,c. Change the reference position to 2 or 3 divisions above the center line by stepping to
POSN using the REF button followed by rotating the entry knob,d. Press CAL,e. Press SHORT/OPEN,
f. Press CHAN 1,g. Step to A/R by pressing channel 1 MEAS RATIO,h. Follow the on-screen instructions to connect a short to the Test Port of the directional
bridge and then press STORE SHORT.i. Repeat step (h) for the open, j. Step to M-MEM by pressing channel 1 DISPLAY button.
7) Measure your unknown by connecting it to the Test Port of the directional bridge.
8) Press CURSOR to put a cursor on the trace. Move the cursor by rotating the entry knobto your assigned frequencies and record Return Loss values. Change the sweep time
from .1 seconds to .2 seconds and again record the |S11| in dB values. If the two setsof values differ, which is correct and why?
9) Turn off the cursor. Obtain a hard copy plot by pressing PLOT in the main menu.After making sure there is paper in the plotter, press PLOT ALL to obtain the actual plot.
8/12/2019 Lab_03 Manual Measurements of S11_S21 in DB
http://slidepdf.com/reader/full/lab03-manual-measurements-of-s11s21-in-db 3/9
3-3
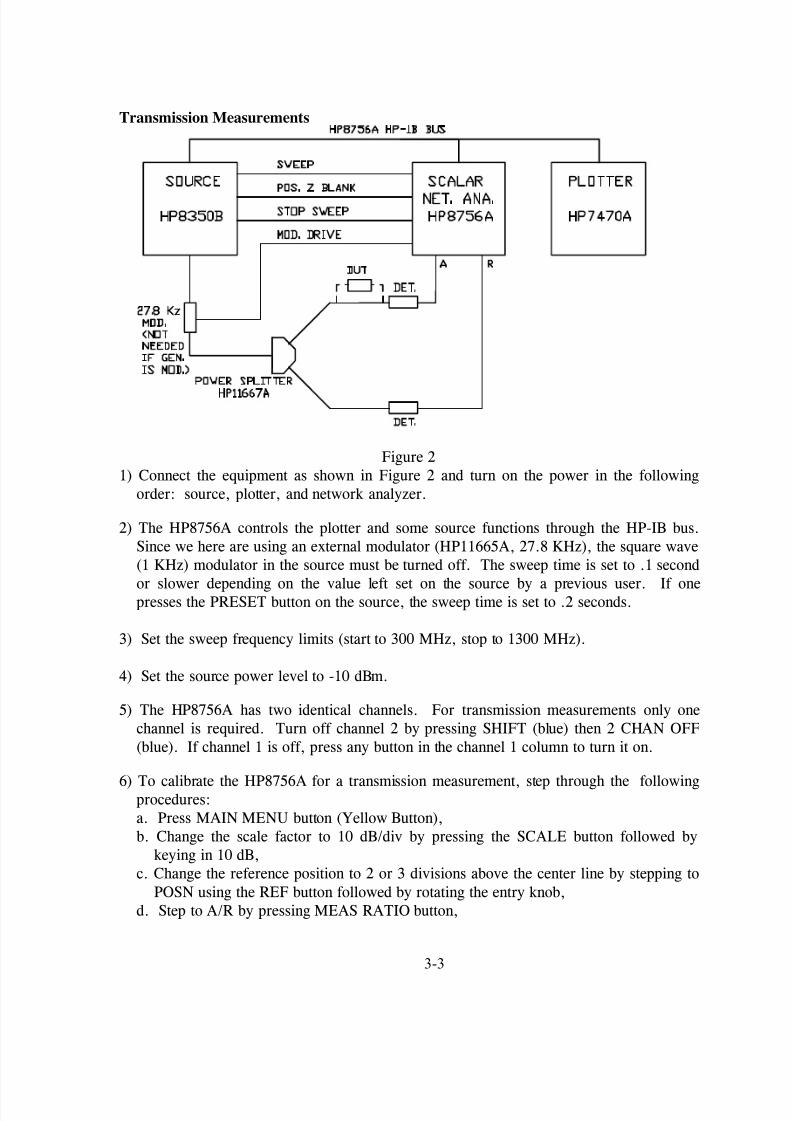
Transmission Measurements
Figure 21) Connect the equipment as shown in Figure 2 and turn on the power in the following
order: source, plotter, and network analyzer.
2) The HP8756A controls the plotter and some source functions through the HP-IB bus.Since we here are using an external modulator (HP11665A, 27.8 KHz), the square wave(1 KHz) modulator in the source must be turned off. The sweep time is set to .1 second
or slower depending on the value left set on the source by a previous user. If one presses the PRESET button on the source, the sweep time is set to .2 seconds.
3) Set the sweep frequency limits (start to 300 MHz, stop to 1300 MHz).
4) Set the source power level to -10 dBm.
5) The HP8756A has two identical channels. For transmission measurements only onechannel is required. Turn off channel 2 by pressing SHIFT (blue) then 2 CHAN OFF(blue). If channel 1 is off, press any button in the channel 1 column to turn it on.
6) To calibrate the HP8756A for a transmission measurement, step through the following procedures:a. Press MAIN MENU button (Yellow Button),b. Change the scale factor to 10 dB/div by pressing the SCALE button followed by
keying in 10 dB,c. Change the reference position to 2 or 3 divisions above the center line by stepping to
POSN using the REF button followed by rotating the entry knob,d. Step to A/R by pressing MEAS RATIO button,

8/12/2019 Lab_03 Manual Measurements of S11_S21 in DB
http://slidepdf.com/reader/full/lab03-manual-measurements-of-s11s21-in-db 4/9
3-4
e. Step to MEAS by pressing the DISPLAY button,f. Connect THRU by connecting the B detector directly to the power splitter,g. Press the SHIFT (Blue) followed by pressing the DISPLAY button (this puts the trace
on the display into channel 1 memory),h. Step to M-MEM by pressing the Display button (this subtracts the measured trace
from the trace in memory).
9) Connect the two port device to be tested between the power splitter and the B detector.The trace you see on the display is the measured scalar transmission characteristics ofthe device being tested.
10) Press CURSOR to put a cursor on the trace. Move the cursor by rotating the entryknob to your assigned frequencies and record the trace values. If the sweep time is .1second, increase the sweep time to various values (.2, .5,... 1), until you are sure thetrace does not change. If increasing the sweep time changed the original trace, re-recordthe trace values.
11) Turn off the cursor. Obtain a hard copy plot by pressing PLOT in the main menu.After making sure there is paper in the plotter, press PLOT ALL to obtain the actual plot.
8/12/2019 Lab_03 Manual Measurements of S11_S21 in DB
http://slidepdf.com/reader/full/lab03-manual-measurements-of-s11s21-in-db 5/9
3-5
8/12/2019 Lab_03 Manual Measurements of S11_S21 in DB
http://slidepdf.com/reader/full/lab03-manual-measurements-of-s11s21-in-db 6/9
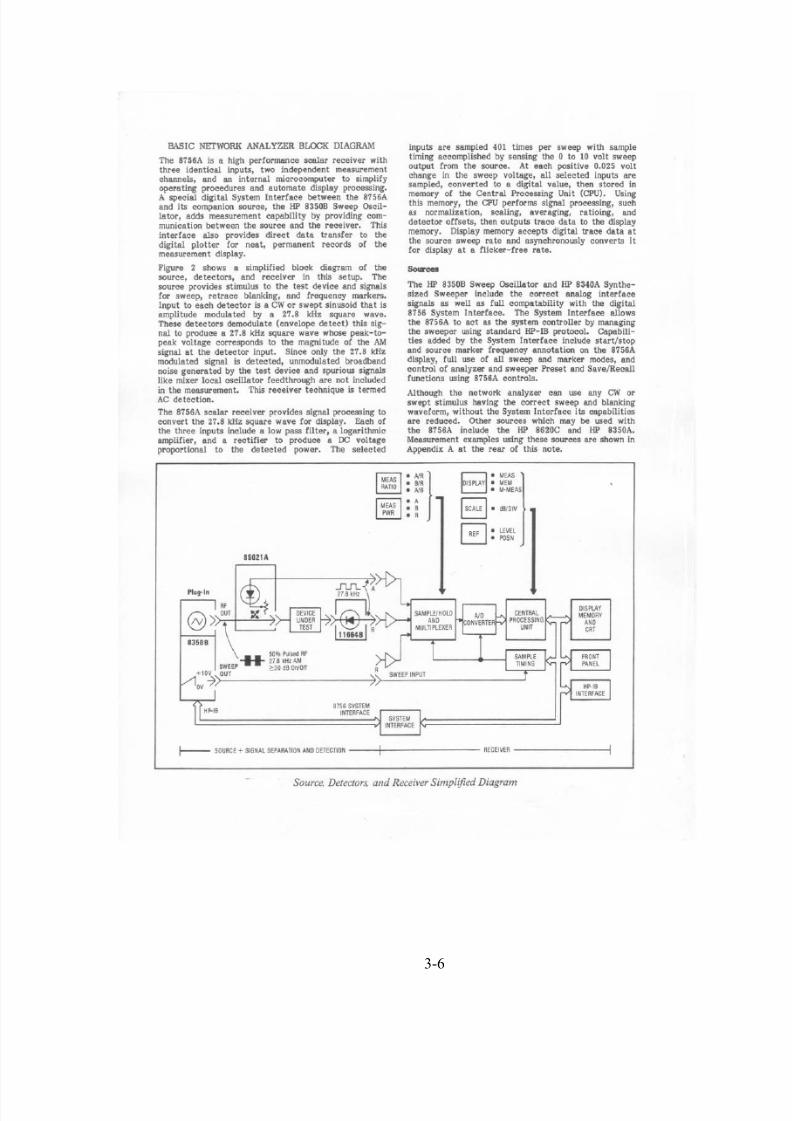
3-6

8/12/2019 Lab_03 Manual Measurements of S11_S21 in DB
http://slidepdf.com/reader/full/lab03-manual-measurements-of-s11s21-in-db 7/9
3-7
8/12/2019 Lab_03 Manual Measurements of S11_S21 in DB
http://slidepdf.com/reader/full/lab03-manual-measurements-of-s11s21-in-db 8/9
3-8

8/12/2019 Lab_03 Manual Measurements of S11_S21 in DB
http://slidepdf.com/reader/full/lab03-manual-measurements-of-s11s21-in-db 9/9
3-9