labeling chem boxes in arc gis
DESCRIPTION
Easy to update data on the map•Time frame of data shown can easily be changed•Results above an action level can be shown in bold to stand out.•Avoid typos and incorrect data. Data errors can be blamed on the lab.•Data is presented uniformly.TRANSCRIPT

Labeling “Chemboxes” in ArcGIS
Automating Sampling Data Labels

Problem
• We needed constantly updated maps of groundwater well sampling results.
• The need for maps showing one year of data or three years of data.
• Not too many examples of this on the Internet.
Solution
• Automate labeling using VBScript Expression
Benefits of Scripting
• Easy to update data on the map
• Time frame of data shown can easily be changed
• Results above an action level can be shown in bold to stand out.
• Avoid typos and incorrect data. Data errors can be blamed on the lab.
• Data is presented uniformly.

One Year sample of Data

Three years of sample data

Process
Flatten data tables (data from Lab or data validation)
Join data to shapefile containing sample locations
Write VBScript Expression

Flatten data tables
• Pivot Table in Excel
• Or build a query to output a flattened table in Microsoft Access
• Also know as denormalizing a database
This makes it easier to join your Sample/Well Locations to your sample data. Allows for simple access to data for scripting labels in ArcGIS. No need for data arrays or FOR NEXT programming Loops.

Create One to Many Relationship
One Location to many results.
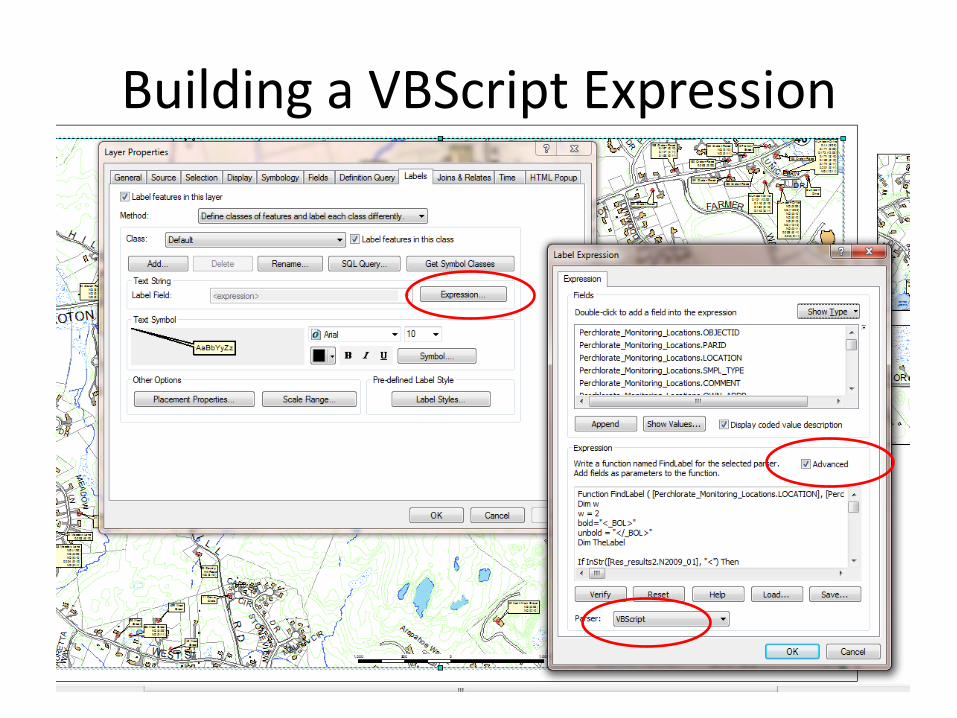
Building a VBScript Expression

The Script
Function FindLabel ( [Sample_Monitoring_Locations.LOCATION], [Sample_Monitoring_Locations.WC_Location], [Sample_Monitoring_Locations.PARID], [Res_results2.N2012_02] , [Res_results2.N2011_12] , [Res_results2.N2011_11] , [Res_results2.N2011_10] , [Res_results2.N2011_09] , [Res_results2.N2011_08] …
Define and
populate your
variables with
data from the
table.
Sample_Monitoring_Locations shapefile joined with
Res_Results2 (lab results) Table.
Lab Results Table Column in Table (August 2009)
Sample Location Shapefile
Parcel ID Column in Shapefile

One routine per month
If InStr([Res_results.N2009_01], "<") Then [Res_results2.N2009_01] = Replace([Res_results2.N2009_01], "<", "<") Else [Res_results2.N2009_01] = [Res_results2.N2009_01] End If If IsNumeric(trim([Res_results2.N2009_01])) Then If cint(trim([Res_results2.N2009_01])) > w Then bold = "<BOL>" End if End if If trim([Res_results2.N2009_01]) <> "" Then TheLabel = TheLabel & vbnewline & bold & [Res_results2.N2009_01] & " (1/09)" & unbold End if
If results are not null then
include label. Trim removes
blank spaces.
If the string
contains < “less
than” swap it out
with an
equivalent
character code.
Parse number from
String. If greater
than MCL then Bold.
This routine is repeated for every month of data Changing the date/Column name of course

End the function and replace ‘&’
TheLabel =
Replace([sample_Monitoring_Locations.WC_Location], "&", "&") & TheLabel
FindLabel = TheLabel
End Function

Displaying < > and & Symbols Using Equivalent Character Codes
I used this work around: If InStr([Res_results.N2009_01], "<") Then [Res_results2.N2009_01] = Replace([Res_results2.N2009_01], "<", "<") TheLabel = Replace([sample_Monitoring_Locations.WC_Location], "&", "&") & TheLabel
ESRI Desktop Help mentions this work around:
Function FindLabel ([LABELFIELD])
NewString = Replace([LABELFIELD],"&","&")
FindLabel = "<ITA>" & NewString & "</ITA>" End Function

Balance text size to avoid overlap

Resources
• “Using VBSript to Build Complex Labels in ArcGIS” Arcuser Magazine, Oct-Dec 2004
(deals mostly with text formatting)
• ESRI Help on building Label expressions
• “Advanced Labeling in ArcMap with VBScript Findlabel Functions” by Chad Cooper
• Note: Maplex was used mainly to stack label location name.


Query in Access to
