labeling genetically modified food in indiacera-gmc.org/docs/sabp_reports/bansal_gruere_2010.pdf ·...
TRANSCRIPT
IFPRI Discussion Paper 00946
January 2010
Labeling Genetically Modified Food in India Economic Consequences in Four Marketing Channels
Sangeeta Bansal
Guillaume Gruère
Environment and Production Technology Division
INTERNATIONAL FOOD POLICY RESEARCH INSTITUTE
The International Food Policy Research Institute (IFPRI) was established in 1975. IFPRI is one of 15 agricultural research centers that receive principal funding from governments, private foundations, and international and regional organizations, most of which are members of the Consultative Group on International Agricultural Research (CGIAR).
FINANCIAL CONTRIBUTORS AND PARTNERS IFPRI’s research, capacity strengthening, and communications work is made possible by its financial contributors and partners. IFPRI receives its principal funding from governments, private foundations, and international and regional organizations, most of which are members of the Consultative Group on International Agricultural Research (CGIAR). IFPRI gratefully acknowledges the generous unrestricted funding from Australia, Canada, China, Finland, France, Germany, India, Ireland, Italy, Japan, Netherlands, Norway, South Africa, Sweden, Switzerland, United Kingdom, United States, and World Bank.
AUTHORS Sangeeta Bansal, Jawaharlal Nehru University Chairperson and Associate Professor in Economics, Centre for International Trade and Development, School of International Studies [email protected] Guillaume Gruère, International Food Policy Research Institute Research Fellow, Environment and Production Technology Division [email protected]
Notices 1 Effective January 2007, the Discussion Paper series within each division and the Director General’s Office of IFPRI were merged into one IFPRI–wide Discussion Paper series. The new series begins with number 00689, reflecting the prior publication of 688 discussion papers within the dispersed series. The earlier series are available on IFPRI’s website at http://www.ifpri.org/publications/results/taxonomy%3A468. 2 IFPRI Discussion Papers contain preliminary material and research results. They have not been subject to formal external reviews managed by IFPRI’s Publications Review Committee but have been reviewed by at least one internal and/or external reviewer. They are circulated in order to stimulate discussion and critical comment.
Copyright 2010 International Food Policy Research Institute. All rights reserved. Sections of this material may be reproduced for personal and not-for-profit use without the express written permission of but with acknowledgment to IFPRI. To reproduce the material contained herein for profit or commercial use requires express written permission. To obtain permission, contact the Communications Division at [email protected].
iii
Contents
Acknowledgments v
Abstract vi
1. Introduction 1
2. Expected Economic Effects of GM Food Labeling 3
3. GM Food Labeling and Consumer Reaction 5
4. Private Costs Associated with GM Food Labeling 11
5. From Theory to Practice: Enforcing GM Food Labeling 20
6. Implications of GM Food Labeling in the Four Marketing Channels 23
7. Conclusion 26
Appendix A: The Indian Draft Rule on GM Food Labeling 31
Appendix B: Market Chain of Cottonseed Oil 32
Appendix C: Market Chain of Soybean Oil 38
Appendix D: Market Chain Analysis of Brinjal 43
Appendix E: Rice Production and Market 45
References 49
iv
List of Tables
1. Mean WTP for non-GM food in relative terms (percentage of price) 6
2. Consumer WTP for pesticide-free or GM vegetables in relative terms 7
3. Estimated annual cost of labeling 11
4. Comparative prices of various edible oils for 2008 (in Rs per 15 kg) 14
5. Summary of the effects of GM labeling on the four marketing channels 26
6. Voluntary (V) versus mandatory (M) labeling: Likely differences 29
B.1. Cottonseed oil production 32
B.2. Percentage share of consumption of edible oils in India 32
B.3. Input costs incurred in processing 20 kg of raw cotton to obtain lint, oil, and oil cake 35
B.4. Value of output obtained from 20 kg of raw cotton 36
B.5. Cottonseed oil market shares of major companies in Gujarat 36
B.6. Estimated cost structure 37
C.1. Estimated production of vegetable oils in India (in thousands of tons) 38
C.2. Estimated consumption share (percentages) of major oils by end use, 2001/02 41
C.3. Vegetable oil imports by India in recent years (million metric tons) 42
D.1. Area, production, and productivity of brinjal in India 43
E.1. Statewide monthly average consumption of wheat and rice per person in rural and urban areas of India, 1999/2000 46
E.2. Export of rice from India (2000/01 to 2003/04) 47
List of Figures
1. Labeling policy decision making 3
B.1. Production and marketing chain of cotton products 33
B.2. Value chain of cotton 34
C.1. Processing and marketing chain of soybean derivatives in India 40
D.1. Marketing chain for Brinjal 44
E.1. Shares in food grain production in India (1987–2007) 45
v
ACKNOWLEDGMENTS
Several people have provided input in the form of knowledge and expertise. We would like to thank all the meeting and survey participants in Delhi and Gujarat, especially Mr. Anil Grover. Research assistance of Saptarshi Basu Roy Choudhury, Susmita Mitra, Amartya Saha and Parag Dey is gratefully acknowledged. This project was supported by the South Asia Biosafety Program, an IFPRI-led program funded by the U.S. Agency for International Development. Views expressed in this report are those of the authors’ alone.
vi
ABSTRACT
In 2006, India proposed a draft rule requiring the labeling of all genetically modified (GM) foods and products derived thereof. In this paper, we use primary and secondary market data to assess the economic implications of introducing such a mandatory labeling policy for GM food. We focus on four products that would likely be the first affected by such a regulation in India: cottonseed oil, soybean oil, brinjal (eggplant), and rice.
We find that GM food labeling would generate a specific market outcome for each of these products. With GM labeling, virtually all cottonseed oil would be labeled as GM, with limited costs for all actors involved, but also limited benefit for consumers. Labeling soybean oil derived from GM crops could affect market shares for edible oils at the benefit of domestic oils, and non-GM soybean oil could appear on the market at a very limited scale. Labeling GM brinjal would be extremely challenging. Assuming it was implemented, some non-GM brinjal would be sold at a premium in high-income retail outlets, while virtually all others would be labeled GM. A similar outcome would occur for rice, with high-quality rice used for both domestic consumption and exports markets certified non-GM and most of the remaining rice labeled as GM.
In each of the cases, labeling would generate significant adjustment costs for the industry and large enforcement costs, and consumer benefit would not always be visible and would highly depend on the degree of enforcement. In fact, voluntary labeling could achieve less-distorted results with lower costs and therefore appears to be a superior regulatory solution. Still, provided enforcement is ensured, a well-designed mandatory labeling regulation with limited product coverage, a non-zero labeling threshold, and an informative labeling content would lead to a much better outcome and lower costs in India than the current draft rule, especially if it is accompanied by a large awareness campaign regarding GM food and consumer safety in India.
Keywords: genetically modified food, labeling, food marketing, India
1
1. INTRODUCTION
In the last few years, India has become one of the leading nations in the development and use of genetically modified (GM) crops. Although only GM cotton has been commercially released thus far, its commercial success is undeniable. In 2008/09, six years after its introduction, the area devoted to GM cotton was expected to exceed 70 percent of the total cotton production area (James 2008). Despite a number of controversies, it is generally recognized that Bt cotton has contributed to the observed leap in cotton productivity, turning India into a major cotton exporter (Gruere, Mehta-Bhatt, and Sengupta 2008). India is also a leading Asian nation in research and development of GM crops. Despite the absence of new commercial releases, several crops have reached an advanced stage in the research and regulatory pipeline, including different types of GM rice, a GM mustard, GM cabbage, and GM brinjal (eggplant).
Much of the success of biotechnology in India can be attributed to the presence of a relatively functional, even if imperfect, biosafety system. Under current law, the commercial release of any GM product requires approval from the Genetic Engineering Approval Committee (GEAC). Besides environment safety tests, the GEAC requires extensive food safety tests for new GM products. The process is comprehensive but has been criticized, in part for its lack of transparency and of coordination among agencies. The Indian government has taken steps to revise the system, and a new bill is about to be introduced in the Indian Parliament. At the same time, several areas related to GM food and feed products have also been under consideration.
In particular, in 2006, the Ministry of Health and Family Welfare has proposed a mandatory labeling policy for all GM foods. The proposed draft rule (see Appendix A) would require GM foods to bear a label stating that they have been subject to genetic modification after their approval for consumption by the safety authority. This would be required for all GM products, whether they are primary or processed food, food ingredients, or food additives derived from a GM food, even if there are no quantifiable traces of recombinant DNA in the food product (e.g., refined oils derived from GM products). The requirements would be applicable for both domestically produced and imported food items. With imported foods, the label would also indicate that the product has been cleared for marketing and use in the country of origin.
Although GM labeling may appear to be a trivial regulatory matter, international experience has shown that it can have far-reaching consequences for consumer choice, the food industry, international trade, and ultimately technological choice in farmers’ fields. Gruere and Rao (2007) provide a comprehensive review of the evidence on GM food labeling worldwide. Based on their analysis, they draw several key lessons from international experience. In particular they find that mandatory labeling in developed countries has not effectively resulted in consumer choice or information and is associated with non-negligible costs. On the other hand, mandatory labeling policies in developing countries have largely been unenforced and therefore ineffective. Comparing the Indian draft rule with existing regulations, Gruere and Rao (2007) conclude that India’s proposed rule is “among the most stringent globally.”
In parallel, Bansal and Ramaswami (2007) analyze the economic rationale behind the use of GM food labeling with reference to India. They consider two arguments used to support mandatory labeling: first, the presence of known adverse health impacts; and second, the consumer’s right to know. In the first case, they argue, labeling is not the appropriate solution; the product should be banned. The second case reflects a situation where some consumers may not wish to consume GM foods. In this case, a niche market for non-GM labeled product is likely to occur even without mandatory labeling. Thus, there is no additional advantage of a mandatory labeling system.
The goal of this report is to complement these previous studies by providing an assessment of the economic implications of introducing GM food labeling in four marketing channels in India. Using evidence from primary and secondary data from India, the study aims to analyze the expected effects of labeling four products— cottonseed oil, soybean oil, brinjal, and rice—for producers, market chain actors, consumers, and taxpayers.
2
These four products are selected because of their current or future association with GM crops. Cottonseed oil is largely used for cooking purposes and would be the first product affected by GM food labeling. India also imports a number of GM food products from other countries, but among these, soybean oil is the most likely to be subject to labeling. GM brinjal is in the process of being commercialized and would be the first transgenic food crop to enter the Indian market. Several types of GM rice are also at the development stage in India and may in the future be released, with significant implications for GM labeling.
To support the analysis, we conducted a rapid market chain analysis of these four products, using qualitative surveys from market chain actors and available data. Cottonseed oil and soybean oil are two products available on the market, and we collected primary data for these from market chain actors. In contrast, the case of the future GM brinjal is mostly based on secondary data. Lastly, GM rice is only exploratory at this stage and relies on a rapid review of available information. The results of the market chain analysis are presented in the appendix; we will only present the key considerations for GM labeling in the core of the paper.
As a caveat, it should be noted the entire analysis in this study is based on the assumption that the safety of human health and the environment has been ensured at the approval stage and is not a matter of concern at the stage of formulating labeling policy.
In the next section, we provide a summary of the expected economic effects of GM labeling and use it to build our analysis of the case studies.
3
2. EXPECTED ECONOMIC EFFECTS OF GM FOOD LABELING
It is often believed that a labeling requirement implies simply the addition of a sticker to signal a targeted attribute on specific products. However, this proves to be a misleading view, especially with GM food, for two reasons.
First, the imposition of a label on a product is intended to have an effect on consumer information, but food companies that have to display this label on their products can also react before the labeling rule is in place and avoid displaying a label. The chain reaction between labeling requirements, consumer perception, and ingredient choice is key to understanding the market effects of GM food labeling (Carter and Gruere 2003b).
Second, enforcement may be very challenging, especially if labeling applies not only to products containing detectable GM ingredients but also to products that are derived from GM ingredients but may not contain detectable GM traces. In such case, labeling requires a reliable identity preservation system from the raw product to the final product, which is highly difficult to implement.
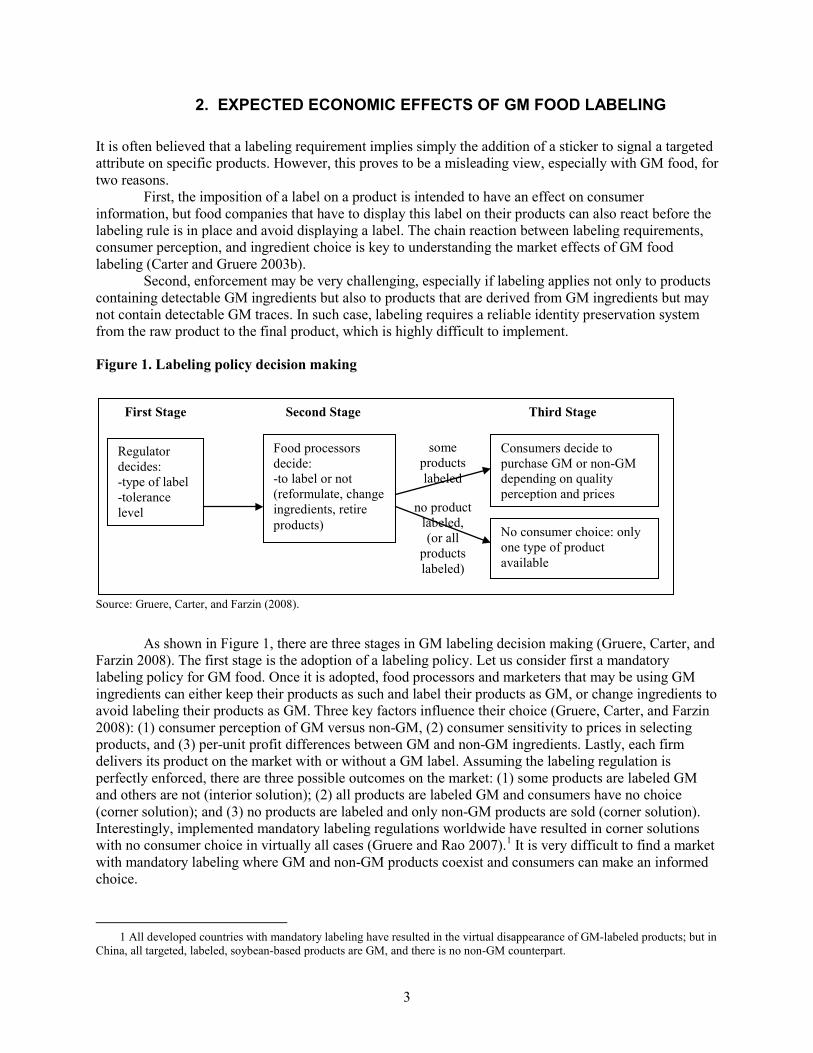
Figure 1. Labeling policy decision making
Source: Gruere, Carter, and Farzin (2008).
As shown in Figure 1, there are three stages in GM labeling decision making (Gruere, Carter, and Farzin 2008). The first stage is the adoption of a labeling policy. Let us consider first a mandatory labeling policy for GM food. Once it is adopted, food processors and marketers that may be using GM ingredients can either keep their products as such and label their products as GM, or change ingredients to avoid labeling their products as GM. Three key factors influence their choice (Gruere, Carter, and Farzin 2008): (1) consumer perception of GM versus non-GM, (2) consumer sensitivity to prices in selecting products, and (3) per-unit profit differences between GM and non-GM ingredients. Lastly, each firm delivers its product on the market with or without a GM label. Assuming the labeling regulation is perfectly enforced, there are three possible outcomes on the market: (1) some products are labeled GM and others are not (interior solution); (2) all products are labeled GM and consumers have no choice (corner solution); and (3) no products are labeled and only non-GM products are sold (corner solution). Interestingly, implemented mandatory labeling regulations worldwide have resulted in corner solutions with no consumer choice in virtually all cases (Gruere and Rao 2007).1
1 All developed countries with mandatory labeling have resulted in the virtual disappearance of GM-labeled products; but in
China, all targeted, labeled, soybean-based products are GM, and there is no non-GM counterpart.
It is very difficult to find a market with mandatory labeling where GM and non-GM products coexist and consumers can make an informed choice.
Regulator decides: -type of label -tolerance level
Food processors decide: -to label or not (reformulate, change ingredients, retire products)
Consumers decide to purchase GM or non-GM depending on quality perception and prices
No consumer choice: only one type of product available
no product labeled, (or all
products labeled)
some products labeled
First Stage Second Stage Third Stage
4
A fourth outcome can be reached if the labeling regulation is poorly or incompletely enforced: mislabeling of products. If the GM label generates potentially negative perceptions among consumers, then few products, if any, will carry a label despite their potential GM content. On the other hand, if the GM labeling is at least partially enforced but is too difficult or not profitable for food companies to implement, then companies will all label their product as GM, whether or not the products contain GM ingredients. Either way, the products do not display truthful and accurate information, making the regulation ineffective, if not useless.
In the case of voluntary labeling, the decision-making chain is slightly different: the structure of incentives is completely reversed (bottom-up) but can lead to similar outcomes. Assuming non-GM food is perceived as higher quality by consumers, food companies can decide to use only non-GM ingredients in order to publicize their product as non-GM. In markets where GM products tend to be mixed with non-GM, this process has a cost that is transmitted to the consumers’ price. Consumers who are willing to avoid GM ingredients can purchase the product for a price premium. In the end, one of the four outcomes can still be reached: (1) some products have non-GM labels, (2) no products have a non-GM label, (3) all products carry the non-GM label, or (4) mislabeling occurs.2
This rapid analysis helps identify three critical factors in evaluating the effects of GM labeling: (1) the potential consumer reaction to a product with or without a label, (2) the costs and market adjustments associated with a labeling policy, and (3) the public enforcement effort. We discuss these three factors in the following three sections, using the four case studies in India as examples. We will then look at the overall economic implications for the four market channels and draw general conclusions.
But the outcome of a voluntary approach is more directly related to consumer demand than that of mandatory labeling and therefore less likely to distort actual consumer preferences (Gruere, Carter, and Farzin 2008).
2 This reasoning is simplified, as organic products present a non-GM alternative already on the market. In fact, in most
countries with GM products, there are organic non-GM products, and therefore in most cases consumers have a choice and can avoid GM products for a premium (e.g., see Gruere 2006 for Canada and France).
5
3. GM FOOD LABELING AND CONSUMER REACTION
3.1. Evidence from the Literature A significant number of studies have been published on consumers’ attitude toward GM food in different countries (Lusk et al. 2005; Smale et al. 2009). A smaller group of studies has focused on the issue of labeling and consumers’ willingness to pay (WTP) for GM food labeling. However, we found only four studies related to consumer acceptance of GM food and GM food labeling in India (Anand, Mittelhammer, and McCluskey 2007; Deodhar, Ganesh, and Chern 2007; Krishna and Qaim 2008; Bansal, Chakravarty, and Ramaswami 2008). While we are aware of the limitations in the methodologies employed in consumer studies, including the frequent upward biases of WTP estimates with stated preference methods, these studies still provide a useful indication of Indian consumer preferences and consequently their potential reaction to GM-labeled products.3
Anand, Mittelhammer, and McCluskey (2007) conducted a survey of consumers’ WTP for two types of GM wheat in New Delhi and Patna, India, in 2005. Their contingent valuation study focuses on estimating urban consumers’ WTP for chapati made with either first-generation (herbicide-resistant) GM wheat or second-generation (good for the heart) GM wheat. With the former, they also subject consumers to either positive or negative information on the technology and the health risk it may be associated with.
In this section, we will briefly review the results of these studies.
The first result shows that without any information, consumers are willing to a pay a 7 percent premium for GM-wheat-derived chapati. However, this figure has to be put into context: Fewer than 46 percent of these consumers considered themselves either very or somewhat knowledgeable about GM foods; the remainder was unaware of GM food. The second important result is that information exposure is critical in determining whether or not consumers are willing to purchase GM wheat products. An evocation of possible health risk can completely alter attitudes against GM. On the contrary, positive information can have relatively moderate effects on WTP. This underlines the possible role of media in the outcome of labeling.
Deodhar, Ganesh, and Chern (2007) provide a second study of consumer understanding and WTP for GM food in India. Their study is based on an open consumer survey in the city of Ahmadabad, Gujarat, and a complementary Internet survey, both led in 2006. In each survey, the authors investigate the level of awareness of consumers and their attitude toward GM food, and then they elicit consumer WTP for GM cottonseed oil (derived from GM cotton), GM golden rice (vitamin A–enriched rice), and chicken meat from animals fed with GM food.
Their first finding is that surveyed consumers are largely unaware of GM food. Only 11 percent of city survey respondents are either very well or somewhat informed about GM foods or genetically modified organisms (GMOs). More than 92 percent of city respondents admit that they don’t know whether or not GM technology has been used to create pest-resistant cotton. In contrast, Internet respondents claim to be more informed, with 85 percent claiming at least some knowledge of GM food and more than 70 percent correctly agreeing with the claim describing Bt cotton.4
The second finding relates directly to the issue of GM food labeling. Of the Internet and city respondents, 94.5 and 97 percent, respectively, consider the labeling of GM food as somewhat or very important, compared with 96 percent of Anand, Mittelhammer, and McCluskey (2007) respondents. However, the results tend to change when considering a possible cost associated with labeling: 28 percent of city respondents would not support labeling anymore with any cost, and an additional 36 percent would not if the price increase exceeds 5 percent. Overall, 64 and 47 percent of city and Internet respondents (respectively) would not support labeling if it results in 5 percent price increases.
3 For more on methodological issues, see Lusk et al. (2005) and Smale et al. (2009). 4 Bt cotton is a cotton genetically modified to express a toxin from the soil bacterium Bacillus thuringiensis (Bt) in order to
provide resistance to Lepidoptera insects, more specifically the cotton bollworms. A similar toxin is expressed by Bt Brinjal (eggplant) to provide resistance against the shoot and fruit borer.
6
A third finding of Deodhar, Ganesh, and Chern (2007) is mean WTP for non-GM alternatives. They find that, on average, consumers have a negative WTP for non-GM rice and non-GM cottonseed oil compared with GM alternatives (golden rice, and cottonseed oil derived from Bt cotton). In contrast they find a small but positive WTP for chicken fed with non-GM feed, as shown in Table 1.
Table 1. Mean WTP for non-GM food in relative terms (percentage of price)
Non-GM r ice (relative to golden r ice)
Non-GM cottonseed oil
Non-GM- fed chicken
All respondents –19.5% –16.12% 0.58% Non-GM respondents 41% 43% 5% GM respondents –48% –50% –4% Indifferent respondents –4.97% 14.72% 0.008% Source: Deodhar, Ganesh, and Chern (2007). Note: Non-GM respondents are those who said they would buy non-GM at equal price; GM respondents are those who would buy GM at equal price; and indifferent is all others.
An interesting implication of this result is the case of cottonseed oil. The authors incorrectly state that there is no GM cottonseed oil sold for food. In fact, with more than 24 percent of the cotton area officially GM in Gujarat in 2006 and much more unofficial Bt cotton seed, and with no segregation system, it is clear that a large proportion of cottonseed oil sold in Gujarat was derived from GM cotton that year. But without knowing this, responding consumers claim to have a positive WTP for GM cottonseed oil. Of course, these are stated preferences; they may not represent what consumers actually would do if faced with the choice in the market. Even so, assuming stable preferences and representativeness, this implies that imposing GM labels would not result in significant loss of market shares for GM cottonseed oil, ceteris paribus.
Krishna and Qaim (2008) focus more specifically on consumer reaction to the use of Bt vegetables, noting that Bt brinjal, a GM eggplant resistant to insects, is being field tested. This type of GM product is different from all the previous ones in that it would be potentially beneficial to both producers (reducing costs and pesticide sprays) and consumers (reducing health risk via less pesticide residues). Their survey also focuses on urban consumers, with a sample of 645 consumers distributed between five cities: New Delhi, Bangalore, Kolar, Kolkata, and Barddhaman.
Krishna and Qaim (2008) first note that consumer perception of the potential benefit of Bt brinjal will depend on (1) their awareness of pesticide residues and (2) their knowledge of the potential risks associated with pesticide residues. Krishna and Qaim measure these two factors and find a significant heterogeneity across locations. Consumers in the West Bengal cities of Kolkata and Barddhaman are both more aware of pesticide residues and more conscious about their risks, probably because the pesticide residue phenomenon is more important and more subject to media attention there. In contrast, respondents from the Karnataka cities of Bangalore and Kolar are both less aware and less concerned with pesticide residues.
Next, the authors conduct a contingent valuation survey to estimate the WTP for pesticide-residue-free vegetables and for Bt vegetables. A summary of the results is shown in Table 2. They find that there is a strong demand for pesticide-residue-free vegetables. However, the demand for Bt vegetables is not as strong. Although they do find that, on average, consumers would be willing to pay more for Bt vegetables than non-Bt vegetables, the relative price premium is rather small and masks a large heterogeneity.
7
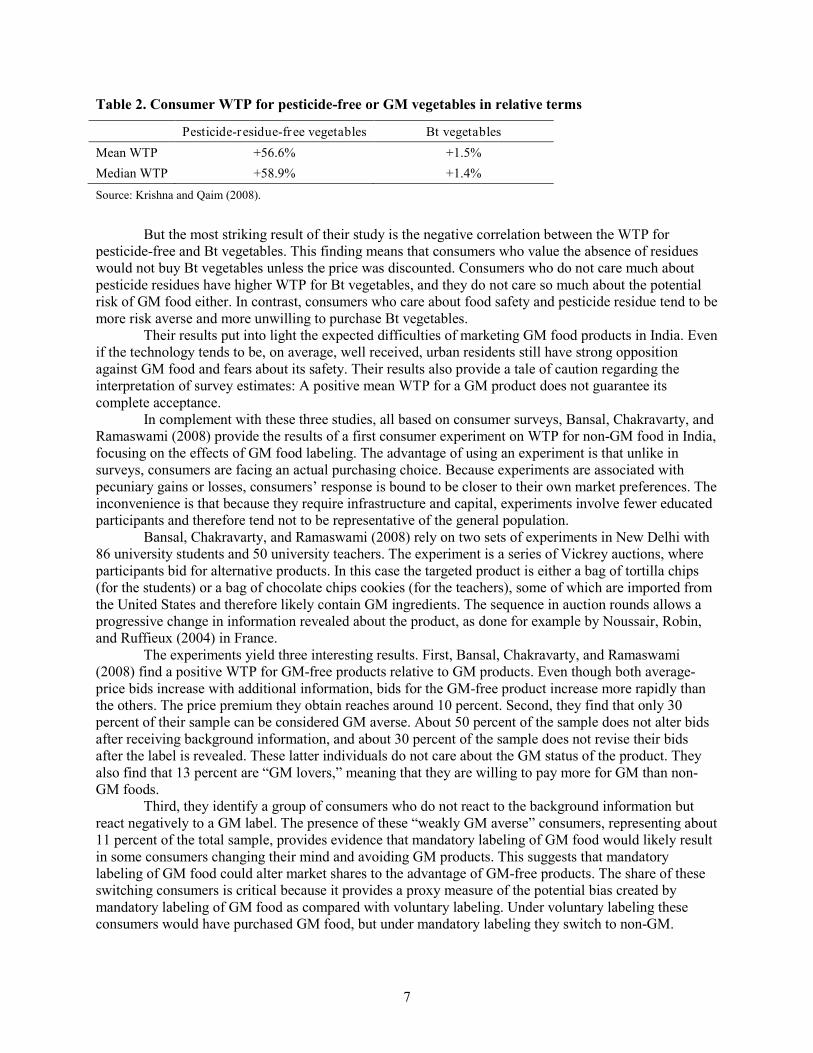
Table 2. Consumer WTP for pesticide-free or GM vegetables in relative terms
Pesticide-residue-free vegetables Bt vegetables Mean WTP +56.6% +1.5% Median WTP +58.9% +1.4% Source: Krishna and Qaim (2008).
But the most striking result of their study is the negative correlation between the WTP for pesticide-free and Bt vegetables. This finding means that consumers who value the absence of residues would not buy Bt vegetables unless the price was discounted. Consumers who do not care much about pesticide residues have higher WTP for Bt vegetables, and they do not care so much about the potential risk of GM food either. In contrast, consumers who care about food safety and pesticide residue tend to be more risk averse and more unwilling to purchase Bt vegetables.
Their results put into light the expected difficulties of marketing GM food products in India. Even if the technology tends to be, on average, well received, urban residents still have strong opposition against GM food and fears about its safety. Their results also provide a tale of caution regarding the interpretation of survey estimates: A positive mean WTP for a GM product does not guarantee its complete acceptance.
In complement with these three studies, all based on consumer surveys, Bansal, Chakravarty, and Ramaswami (2008) provide the results of a first consumer experiment on WTP for non-GM food in India, focusing on the effects of GM food labeling. The advantage of using an experiment is that unlike in surveys, consumers are facing an actual purchasing choice. Because experiments are associated with pecuniary gains or losses, consumers’ response is bound to be closer to their own market preferences. The inconvenience is that because they require infrastructure and capital, experiments involve fewer educated participants and therefore tend not to be representative of the general population.
Bansal, Chakravarty, and Ramaswami (2008) rely on two sets of experiments in New Delhi with 86 university students and 50 university teachers. The experiment is a series of Vickrey auctions, where participants bid for alternative products. In this case the targeted product is either a bag of tortilla chips (for the students) or a bag of chocolate chips cookies (for the teachers), some of which are imported from the United States and therefore likely contain GM ingredients. The sequence in auction rounds allows a progressive change in information revealed about the product, as done for example by Noussair, Robin, and Ruffieux (2004) in France.
The experiments yield three interesting results. First, Bansal, Chakravarty, and Ramaswami (2008) find a positive WTP for GM-free products relative to GM products. Even though both average-price bids increase with additional information, bids for the GM-free product increase more rapidly than the others. The price premium they obtain reaches around 10 percent. Second, they find that only 30 percent of their sample can be considered GM averse. About 50 percent of the sample does not alter bids after receiving background information, and about 30 percent of the sample does not revise their bids after the label is revealed. These latter individuals do not care about the GM status of the product. They also find that 13 percent are “GM lovers,” meaning that they are willing to pay more for GM than non-GM foods.
Third, they identify a group of consumers who do not react to the background information but react negatively to a GM label. The presence of these “weakly GM averse” consumers, representing about 11 percent of the total sample, provides evidence that mandatory labeling of GM food would likely result in some consumers changing their mind and avoiding GM products. This suggests that mandatory labeling of GM food could alter market shares to the advantage of GM-free products. The share of these switching consumers is critical because it provides a proxy measure of the potential bias created by mandatory labeling of GM food as compared with voluntary labeling. Under voluntary labeling these consumers would have purchased GM food, but under mandatory labeling they switch to non-GM.
8
3.2. Expected Consumer Reactions: Views from the Market
Cottonseed and Soybean Oils
As part of a more comprehensive market chain analysis for cottonseed oil (see Appendix B and C), we conducted a qualitative survey of the Khari Baoli wholesale food grain market in Delhi in September 2008. Khari Baoli is Asia’s largest wholesale spice market and is situated in the Chandni Chowk area of old Delhi. We surveyed about 20 wholesale and retail shops and found cottonseed oil in only four shops. Each of the four shops that had cottonseed oil stored only a single brand of oil in a 15-kg tin. The label on the tins displayed the brand but did not have any information on the nutritional content of the oil. The availability of only the 15-kg tin and lack of information on nutritional content may suggest that either the oil is used by the fast-food and carry-out industry or sold in loose form in smaller quantities.
Among all edible oils, the most expensive oil was groundnut oil. According to surveyed shopkeepers, sunflower oil is the most popular oil in Delhi. Consumers are reportedly very concerned about the brand of the oil and prices but not about the GM status of the product. Shopkeepers had never encountered any query from consumers as to whether the products are GM or non-GM. The shopkeepers themselves had no idea about the concept of GMOs.
No evidence was found in these markets or while interviewing other market actors in the major cottonseed oil–producing state of Gujarat (see Appendix B) of the appearance of any non-GM cottonseed oil since the introduction of GM cotton. Surveyed cottonseed oil refiners and sellers do not consider it a profitable asset. According to the executives of N.K. Proteins Ltd. and other surveyed oil houses (see Appendix B), consumers in Gujarat are not aware of whether the edible oils they are consuming are GM or not; they are simply concerned with the price of different products. They noted that the market is very competitive and that consumers are very price sensitive, purchasing the least costly brand.5
The situation is similar with soybean oil. No labeled GM or non-GM soybean oil is being sold. India does not produce GM soybeans and does not allow the importation of GM soybeans, but it does import soybean oil from the largest GM-food-producing countries (see Appendix C). IASL (2002) found that Indian importers and consumers are very price sensitive and unwilling to pay large premiums for close substitutes with different qualities, such as oils with a slightly different color or flavor, shelf life, or nutritional characteristics. Indeed, available market data suggest that there are a number of substitutes in the edible oil market (see Appendix C).
The labels on packaged cottonseed oil contain information that is mandatory by Indian food laws: quantity, ingredients, date of manufacture, and nutritional content of oil. However, none of the oil produced by these major companies was found to display the GM status, despite the fact that all these brands of oils are derived from GM cotton.
Overall, the absence of GM-labeled oils reflects the lack of incentive to market non-GM oil. There could be two possible reasons explaining this finding. First, consumers do not perceive any difference between the GM and non-GM variant of the oil, and therefore, producers do not have any incentive to pay for non-GM segregation. This could be because consumers are not aware of GM foods, they do not sufficiently care about the GM status of the product, or they cannot afford to pay a price premium for non-GM variants even if these are preferred. The non-GM oil is likely to be more expensive because cotton yields from non-GM seeds are lower and imported soybean oil may be cheaper at least during the nonharvest season. In addition, its supply requires costs of identity preservation.
In fact, both factors seem to have played a role. Consumers are very sensitive to the price of vegetable oil and switch to the cheapest oil. Furthermore, cottonseed oil is consumed by lower-income groups and soybean oil is considered non-premium-quality oil. Lower income consumers also have a low level of awareness of GM products. The WTP a price premium for non-GM cottonseed or soybean oil is not large enough to cover the cost of marketing a non-GM alternative.
5 All surveyed executives and traders in the local mills and oil houses knew about Bt cotton. However, the workers engaged
in manual labor had no idea about Bt and non-Bt cotton.
9
Brinjal
The market for brinjal is disorganized: It includes multiple intermediaries at different levels, and a very fragmented set of retailers (see Appendix D for details). To assess likely consumers’ perception of quality and price sensitivity for different brinjal varieties, we conducted a qualitative survey of vegetable sellers in different markets in Delhi in October and November 2008. The survey covered mobile van day-to-day sellers in Munirka; fixed shops, from small to large, in the Greater Kailash and Chittaranjan Park markets; and retail chains Le Marche at PVR Priya complex in Vasant Vihar, Reliance Fresh in Savitri Nagar, Big Apple in Malviya Nagar, Safal in Ramakrishna Puram, LM 365 in Munirka, and Spencers Fresh in South Extension. Sellers were questioned on how their customers perceive different qualities of vegetables and fruits available at their shops. The sellers were then informed about the likely introduction of Bt brinjal and questioned about expected consumer reactions.
Most of the local mobile van day-to-day sellers in Munirka noted that their customer base is not fixed; they sell to a different set of customers every day. Consumers purchase small quantities of brinjals, mostly according to their daily requirement, and are mainly concerned about the freshness of vegetables. Consumers also have a preference for non-infested brinjals (i.e., without a hole), but they are price sensitive and negotiate to get the lowest possible price. Due to high competition, the sellers generally choose to sell less-expensive vegetables that have freshly arrived in the mandi. When sellers were informed that Bt brinjal would likely cost less and that (in the absence of labeling requirement) consumers would not be able to distinguish between Bt and non-Bt variety by seeing or tasting the two varieties, all of them promptly said that they would only sell the Bt variety. They expected that even if they tried to sell the conventional non-Bt variety, buyers would not trust them and would not pay a higher price.
Large, fixed shops in Greater Kailash and Chittaranjan Park markets claim to enjoy a greater degree of trust with regular customers. To maintain their customer base, these shopkeepers are careful in maintaining the quality of their produce, especially when the quality attributes are verifiable by consumers (e.g., taste, freshness). But the shopkeepers also confirmed that consumers are very price sensitive. For example, even though the less-produced desi kheera (indigenous cucumber) is tastier and healthier, the cheaper variety of cucumber sells the most. Still, these shops do have a clientele that is quality conscious and wants to buy the best of fruits and vegetables. This group, however, forms a small share of total customers and belongs mainly to the well-off and educated class. They generally make their purchases for the week or place orders in advance. It was noted, however, that the number of these customers has been decreasing over time due to the arrival of the new-generation retail chains like Reliance Fresh, Le Marche, Spencers Fresh, Big Apple, and many others that are preferred for better facilities and general shopping environment.
Rice
Because of the diversity of markets selling rice, it is more difficult to assess the reaction of rice marketers. Our rapid market overview indicates that a large number of rice varieties are largely sold to consumers in bulk by numerous small sellers and that rice is the main consumption item of millions of low-income households (see Appendix E). In this context, assuming one or more GM rice varieties were available, the introduction of labeling would not necessarily result in significant consumption changes for the largest share of the market. There is evidence, however, that non-GM segregation would be used for high-quality basmati rice.
India is the largest producer and exporter of basmati rice in the world. The annual production of basmati rice in the country is around 1–1.5 million tons a year, of which around two-thirds is exported (see Appendix E). Saudi Arabia accounts for the major chunk of basmati imports from India. The other markets for basmati rice exports are Kuwait, United Kingdom, United Arab Emirates, Yemen, United States, Canada, Germany, Australia, Austria, Norway, Russia, Singapore, Iran, Kuwait, Bahrain, Spain, Italy, France, Denmark, and other European Union countries.6
6 Source:
Most of these countries have market and
http://www.rice-trade.com/basmati-rice-india.html.
10
trade regulations for GM food, leading Indian basmati traders to vocally oppose the introduction or even field experimentation of GM rice in India (Gruere and Sengupta 2009).
Besides basmati (and organic) exports, there could be some demand for non-GM aromatic rice domestically, mostly in urban areas. The significant debates around the possible release of Bt brinjal, as related in the press, indicates the existence of a segment of consumers opposed to GM food products, as observed in other countries. Companies selling packaged premium priced rice that are targeting this segment may very well look for this opportunity to further differentiate their products.7
3.3. Synthesis
By reviewing the literature and complementing it with our own assessment of the respective industries, we have a relatively clear picture of consumers’ potential reaction to GM-labeled products in the four markets. Although all four cases involve trade-offs between perceived quality (and risk) and price sensitivity, there are differences across cases.
Generally speaking, the two examples of edible oils are likely to generate the least consumer aversion, for a number of reasons. These processed products are not considered to be of high quality8
In contrast, the labeling of brinjal and rice is bound to create more significant consumer reactions. Because brinjal is a whole, fresh produce, whether or not it is GM could matter to a nonzero share of consumers. But because rice is even more commonly consumed in most Indian states, it may generate at least as much reaction. Still, in both cases, just like for the edible oil examples, any consumer effect will be directly related to the level of awareness of and type of information consumers have about GM food. Currently, a very large share of Indian consumers are simply unaware of and uninformed about GM crops (despite relatively wide press coverage of GM food issues in India).
; they are in a market where the demand is relatively price elastic; and they have a significant number of close substitutes. Cottonseed oil, having the lower perceived quality and price, will likely generate less reaction to GM labeling than soybean oil. Furthermore, GM soybean oil is imported, not produced in India, and if the country of origin and the GM status was labeled (as proposed in the draft rule), Indian non-GM alternatives may appear more appealing to Indian consumers.
7 Interestingly, a colleague of the authors reported advertising for a company selling non-GM aromatic rice at a premium
price in and around Kolkata in September 2009. This misleading claim (there is no GM rice in India), while anecdotal, already reveals the interest of companies in trying to keep their rice non-GM.
8 The low aversion toward GM cottonseed oil could be partially because the oil does not contain any GM material.
11
4. PRIVATE COSTS ASSOCIATED WITH GM FOOD LABELING
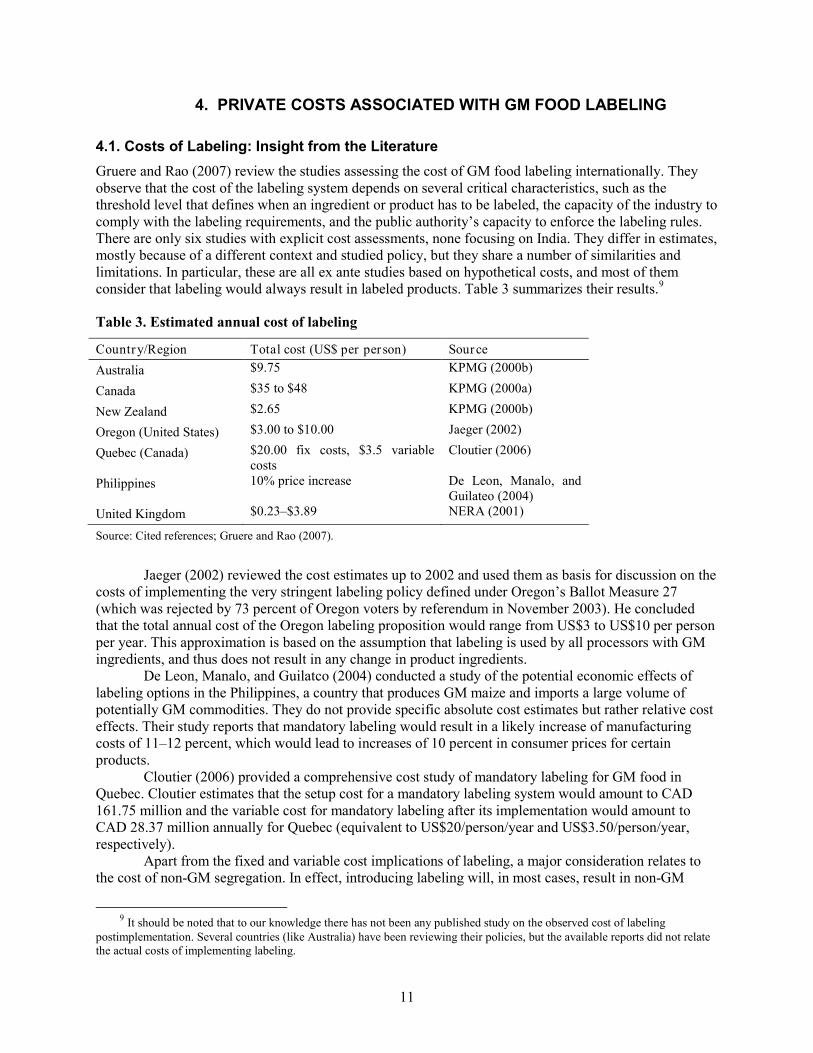
4.1. Costs of Labeling: Insight from the Literature Gruere and Rao (2007) review the studies assessing the cost of GM food labeling internationally. They observe that the cost of the labeling system depends on several critical characteristics, such as the threshold level that defines when an ingredient or product has to be labeled, the capacity of the industry to comply with the labeling requirements, and the public authority’s capacity to enforce the labeling rules. There are only six studies with explicit cost assessments, none focusing on India. They differ in estimates, mostly because of a different context and studied policy, but they share a number of similarities and limitations. In particular, these are all ex ante studies based on hypothetical costs, and most of them consider that labeling would always result in labeled products. Table 3 summarizes their results.9
Table 3. Estimated annual cost of labeling
Country/Region Total cost (US$ per person) Source Australia $9.75 KPMG (2000b)
Canada $35 to $48 KPMG (2000a)
New Zealand $2.65 KPMG (2000b)
Oregon (United States) $3.00 to $10.00 Jaeger (2002)
Quebec (Canada) $20.00 fix costs, $3.5 variable costs
Cloutier (2006)
Philippines 10% price increase De Leon, Manalo, and Guilateo (2004)
United Kingdom $0.23–$3.89 NERA (2001)
Source: Cited references; Gruere and Rao (2007).
Jaeger (2002) reviewed the cost estimates up to 2002 and used them as basis for discussion on the costs of implementing the very stringent labeling policy defined under Oregon’s Ballot Measure 27 (which was rejected by 73 percent of Oregon voters by referendum in November 2003). He concluded that the total annual cost of the Oregon labeling proposition would range from US$3 to US$10 per person per year. This approximation is based on the assumption that labeling is used by all processors with GM ingredients, and thus does not result in any change in product ingredients.
De Leon, Manalo, and Guilatco (2004) conducted a study of the potential economic effects of labeling options in the Philippines, a country that produces GM maize and imports a large volume of potentially GM commodities. They do not provide specific absolute cost estimates but rather relative cost effects. Their study reports that mandatory labeling would result in a likely increase of manufacturing costs of 11–12 percent, which would lead to increases of 10 percent in consumer prices for certain products.
Cloutier (2006) provided a comprehensive cost study of mandatory labeling for GM food in Quebec. Cloutier estimates that the setup cost for a mandatory labeling system would amount to CAD 161.75 million and the variable cost for mandatory labeling after its implementation would amount to CAD 28.37 million annually for Quebec (equivalent to US$20/person/year and US$3.50/person/year, respectively).
Apart from the fixed and variable cost implications of labeling, a major consideration relates to the cost of non-GM segregation. In effect, introducing labeling will, in most cases, result in non-GM
9 It should be noted that to our knowledge there has not been any published study on the observed cost of labeling
postimplementation. Several countries (like Australia) have been reviewing their policies, but the available reports did not relate the actual costs of implementing labeling.
12
segregation. For food companies that want to use only pure non-GM ingredients, there are two possibilities: Either they use more costly, alternative ingredients, or they purchase non-GM equivalents of their ingredients for a premium. In the first case, the cost implication of labeling can be measured by the difference between the price of the potentially GM good and the alternative, which highly depends on the product, production process, and international market. In the second, it is necessary to dive into ranges of cost estimates of non-GM segregation, which depend on commodity, time, and modalities (Gruere 2009).
Who pays for segregation and identity preservation? This question has been debated in the literature, and the answer is complex. Desquilbet and Bullock (2009) provide a comprehensive analysis of the cost distribution and incentives associated with segregation and show that they depend on several factors, including the technology cost (and market structure), the structure of segregation costs, and consumers’ reluctance to adopt GM products. Their model shows that the coexistence of GM, non-GM, and identity-preserved (pure) non-GM products on the market will differ according to these various parameters. They argue that the segregation of one type of product can involve an external cost on the other: for instance, non-GM segregation will have some indirect cost on GM production because of diseconomies of scale.
Lastly, GM food labeling can also have an effect on demand, which can be considered a cost for the industry. In addition to the shift of weakly GM-averse (or switching) consumers toward non-GM alternatives (Bansal, Chakravarty, and Ramaswami 2008), mandatory labeling may result in consumers’ avoiding the potentially GM products altogether.10
4.2. Cottonseed Oil
These two effects are specific to mandatory labeling, as opposed to voluntary labeling.
As part of the market chain analysis (see Appendix B), we surveyed 12 local processing mills for cottonseed oil in Kadi, Mehsana, and Sidhpur11 in the state of Gujarat. Representatives from these mills claimed that virtually all the cottonseeds they are receiving are derived from Bt cotton. They also mentioned that the oil yield from Bt cottonseeds is higher than that from non-Bt cottonseeds, and on average the seeds give 15 percent oil.12
According to the surveyed company representatives from oil refiners, the major cost difference associated with providing GM-free cottonseed oil would arise initially, when washed cottonseed oil is purchased. Instead of buying washed cottonseed oil derived from GM cotton, they would buy oil derived from non-GM cotton. The other costs would remain the same for the two varieties. The company executives were very categorical in stating that they were not going to bear any additional cost to produce non-GM oil and that the entire cost difference would be passed on to the consumers.
Using this and other information from the market chain analysis (Appendix B), we can assess the likely implications of GM labeling. Suppose the draft rule regarding mandatory labeling of GM foods is implemented. Two scenarios may emerge.
Scenario 1: One Variant—Commingled GM Oil
In the first scenario, the market continues to supply only one variant, which is commingled GM oil. This scenario may occur when—
10 This was observed at a low scale in China, where it was found that soybean oil lost a few percentage market shares to the
benefit of other oils, in part, if not completely, because of the GM label (Lin et al. 2008). 11 Gujarat has about 250 ginning and pressing units, which are called local mills in the area. There is competition among the
mills both to procure raw material and to sell lint to spinning mills. 12The all-India average oil yield is 12.5 percent (SEAI). The oil yields in India are lower than the world average, which is
18–20 percent.
13
1. Consumers’ level of awareness does not get affected by mandatory labeling and, therefore, their WTP for the non-GM variant does not increase (ceteris paribus). The labeling would be simply pasting a sticker to the product at a negligible cost, about Rs 0.50 per can.13
2. GM-averse consumers move to alternative vegetable oils like soybean oil, mustard oil, groundnut oil, sunflower oil, and the like.
14 Again, the direct cost of labeling would be negligible, but in this case labeling could result in a significant shift in market shares for vegetable oils to the detriment of cottonseed oil.15
Scenario 2: Both Variants of Oil labeled
Because of the competitive structure of the industry, this lower demand would result in lower retail prices, which could translate into lower cottonseed oil prices. Revenues of mills and refineries would likely decrease.
In the second scenario, the market supplies both variants of oil duly labeled. Suppose the mandatory labeling law increases consumer awareness of GM food and generates consumer aversion toward GM foods. Further, assume that a share of consumers is willing to pay a price premium for non-GM cottonseed oil. In response to consumer demand, the market supplies both GM and non-GM cottonseed oil with labeling.
Cottonseed oil cannot be tested for GM status; thus the process has to be accompanied by a documentation system in the marketing chain. There are two ways in which identity of the product can be preserved: One is having two separate marketing channels, and the other is via contract farming.
With a dual production system, the costs of segregation and identity preservation of GM-free foods can be divided into three components, as follows:
• First, at the field level, because production of washed cottonseed oil is only a side business of the local mills, it seems unlikely that the demand for GM-free oil would significantly affect the cropping pattern. Thus, the cost may not be large if there is no visible adjustment.
• Second, mills would have to transport and store the two variants of raw cotton in separate containers to ensure that there is no commingling. The process of ginning would have to be performed separately for both variants. For this, mills could either identify some ginning units for processing the GM-free variety exclusively, or the machines would need to be thoroughly cleaned between processing of the two variants. The cottonseeds obtained from the ginning process would need to be stored and crushed separately. Finally, the oil would need to be stored in separate containers. Segregated stocks would have to be transported in smaller containers. The traders and manufacturers would not be able to reap economies of scale. Labor-associated costs would also likely increase to support training and to control the segregation process. Separate accounts and schedules would need to be maintained for the two variants.
• Third, at the oil refinery level, because of a competitive market, the additional cost of segregation would be passed on to refineries in the form of increased price of washed cottonseed oil. In addition, refineries would incur other costs of transporting two variants of washed cottonseed oil separately to the refineries, storing them separately, refining the two variants separately, and packing them in separate packages duly labeled.
13 Here we are assuming that the onus is on the producer who claims GM-free status to be able to prove it. Suppliers of GM
foods who label their products accordingly do not have to prove so and therefore do not have to incur the cost of segregation and identity preservation.
14 Even though soybean oil is the next best alternative to cottonseed oil, it may also be derived from GM soybeans because India imports large quantities of crude soybean oil (Appendix C).
15 Interestingly, the domestic oil industry was expecting a rise in prices of domestic soybean, mustard, and groundnut oil with the introduction of mandatory labeling in 2006, because of its expected negative effect on consumer demand for GM-labeled imported soybean oil (Karvy Comtrade Ltd. 2006). However, the fact that cottonseed oil would also potentially suffer from this labeling requirement was not noted.
14
An alternative to setting up two separate marketing channels for GM and non-GM variants is through contracting farmers to produce conventional (non-GM, or GM-free) cotton. Manufacturers may ensure GM-free status of their product by sourcing it directly from farmers and processing it exclusively.
We could not find examples of contract farming for GM-free cotton or cottonseed oil in India,16 but a closely related market is that for organic cotton.17
Maximum Segregation Cost
Organic farming requires that certain agricultural practices be followed. Typically, a field has to be certified as not having used chemical fertilizer or pesticide for three years; chemical tests are conducted on soil samples to ensure that there are no residues. We contacted Super Spinning Mills, which is the first major textile enterprise to market organic cotton through contract farming in India. With certification from the Control Union World group for its natural fiber–processing standards, it has acquired 2,000 acres in Orissa and 350 acres in Tamil Nadu under organic cotton production. Certification is mandatory for organic cotton production and processing, and it involves close supervision of production practices and pre-agreed fixed prices. The entire marketing system is based on an assured price premium and therefore a sufficient demand.
Whether by contract farming or dual production systems, the separation of non-GM will clearly involve costs. We cannot provide a precise cost estimate, but because of the competitive nature of the market and the substitutability of oils, the maximum total cost for segregating GM-free cottonseed oil will be the price premium for comparable or even higher quality oils. This is because if the price premium for GM-free cottonseed oil exceeded the price difference between cottonseed oil and the higher quality oil, no one would buy GM-free cottonseed oil.
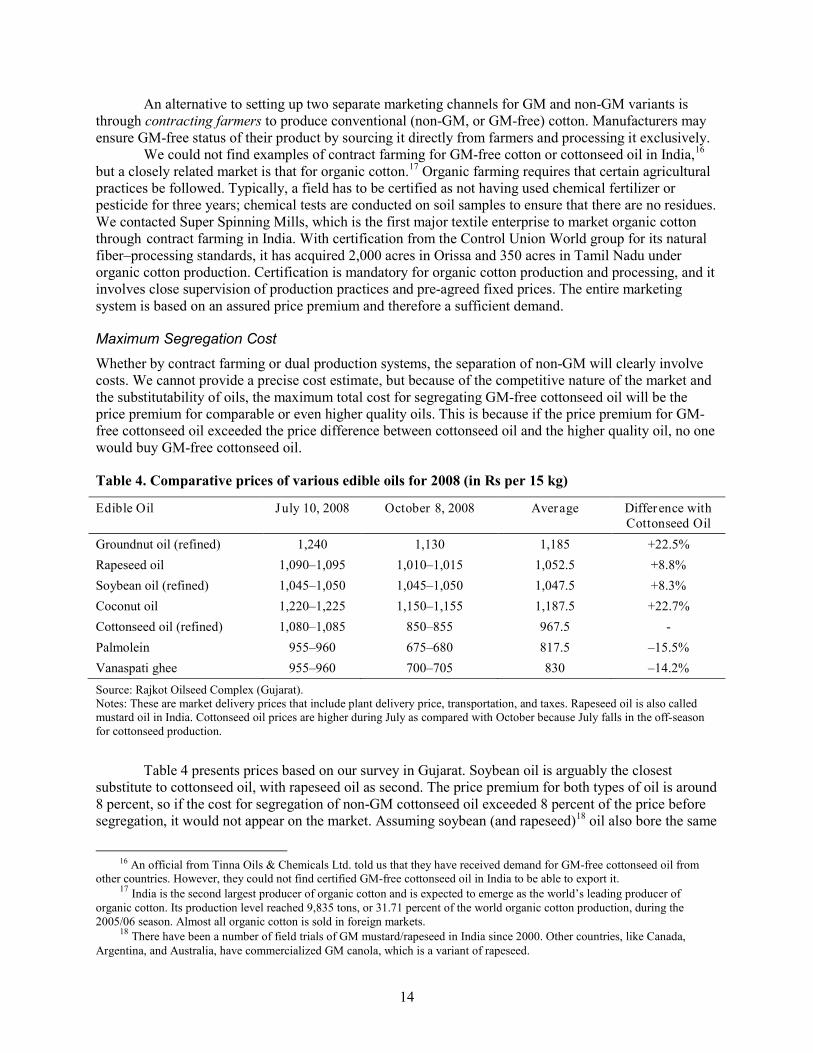
Table 4. Comparative prices of various edible oils for 2008 (in Rs per 15 kg)
Edible Oil July 10, 2008 October 8, 2008 Average Difference with Cottonseed Oil
Groundnut oil (refined) 1,240 1,130 1,185 +22.5% Rapeseed oil 1,090–1,095 1,010–1,015 1,052.5 +8.8% Soybean oil (refined) 1,045–1,050 1,045–1,050 1,047.5 +8.3% Coconut oil 1,220–1,225 1,150–1,155 1,187.5 +22.7% Cottonseed oil (refined) 1,080–1,085 850–855 967.5 - Palmolein 955–960 675–680 817.5 –15.5% Vanaspati ghee 955–960 700–705 830 –14.2% Source: Rajkot Oilseed Complex (Gujarat). Notes: These are market delivery prices that include plant delivery price, transportation, and taxes. Rapeseed oil is also called mustard oil in India. Cottonseed oil prices are higher during July as compared with October because July falls in the off-season for cottonseed production.
Table 4 presents prices based on our survey in Gujarat. Soybean oil is arguably the closest substitute to cottonseed oil, with rapeseed oil as second. The price premium for both types of oil is around 8 percent, so if the cost for segregation of non-GM cottonseed oil exceeded 8 percent of the price before segregation, it would not appear on the market. Assuming soybean (and rapeseed)18
16 An official from Tinna Oils & Chemicals Ltd. told us that they have received demand for GM-free cottonseed oil from
other countries. However, they could not find certified GM-free cottonseed oil in India to be able to export it.
oil also bore the same
17 India is the second largest producer of organic cotton and is expected to emerge as the world’s leading producer of organic cotton. Its production level reached 9,835 tons, or 31.71 percent of the world organic cotton production, during the 2005/06 season. Almost all organic cotton is sold in foreign markets.
18 There have been a number of field trials of GM mustard/rapeseed in India since 2000. Other countries, like Canada, Argentina, and Australia, have commercialized GM canola, which is a variant of rapeseed.
15
GM labeling requirements, other oils could be used. In particular, groundnut oil is considered the highest quality available. The price difference for groundnut oil was around 22 percent of the cottonseed oil price in 2008. On this basis, if non-GM cottonseed oil resulted in a 23 percent increase in price, it would not appear in the market.
4.3. Soybean Oil The nature of the supply chain for soybean oil (see details in Appendix C) has an important bearing on the likely costs of GM labeling. As noted in the market analysis, imported crude oil enters the Indian market at the refining stage, and imported refined oil enters the Indian market at the marketing stage. Thus, the possibility of commingling domestic and imported oil exists at these two stages. Once the oil gets commingled, it would become difficult to distinguish GM and non-GM soybean oil. The problem becomes even more difficult because the relevant GMO DNA/protein is broken down in the process of crushing soybeans; it is retained in the soy meal, but the oil does not contain proteins. Therefore, the only way in which the non-GM soybean oil could be certified to be so is through an identity-preserved supply chain.19
Overall, the costs would depend on whether the market continues to supply commingled oil labeled as GM or if the two variants are supplied duly labeled
20
Scenario I: Commingled Soybean Oil Labeled GM
; once again, two possible scenarios emerge.
In the first scenario, the market continues to supply commingled soybean oil labeled as GM. There are no segregation costs, but other costs could incur.
First, manufacturers would have to pay for the printing of GM labels on packages of soybean oil. Edible oil is sold in pouches. According to surveyed manufacturers, for printing on pouches, rotogravure printing is used. A rotogravure printing press has one printing unit for each color. For each color an additional cylinder is required, at a cost of Rs 18,000–20,000. The total cost would depend on the number of colors in the label.
Second, if it is not profitable to supply non-GM soybean oil because of the lack of demand, GM-averse consumers could still switch away from soybean oil to other edible oils. To avoid GM labeling, some producers may also switch away from soybean oil ingredients. Reputed fast-food chains like McDonald’s, Pizza Hut, and others might prefer to use other edible oils instead of soybean oil, assuming they are required to display GM ingredients. Similarly, reputed brand food processors like Frito-Lay may also switch away from soybean oil. This movement would reduce revenues of the soybean oil industry and could depress the price of soy products. This may also impose an upward pressure on the prices of other edible oils.
In fact, the Indian vegetable oil industry has been expecting such consumer reaction. Karvy Comtrade Ltd. (2006) reported that future prices of soybean oils had risen by 7–7.7 percent in the span of nine trading days after the announcement of the labeling rule for GM food. They further argued that such labeling would greatly increase the demand and price of domestic oils (such as soy, mustard, and groundnut) because imported soybean oil would have to carry a GM label and would therefore scare consumers.
Interestingly, this suggests that labeling may serve as a nontariff barrier to trade to the local industry, as argued in the literature (e.g., see Carter and Gruere 2003a). In February 2006, there were reports from the Solvent Extractor Association that the government could very well be considering the
19 The seasonality of the market could play a role in separating imported and domestically produced oils. During fall and
winter, refineries exclusively process the domestically extracted oil, and from April to September they refine imported oil. 20 The labeling costs would be significantly lower for the products made from whole soybean and soy meal than for refined
soybean oil, because India neither produces nor imports GM soybeans. Thus, there is no need for segregation. In fact a non-GM certificate can be obtained for soy meals based on simple testing (see Appendix C).
16
introduction of GM labeling as a means to raise domestic prices of edible oils (Low 2006). The precipitation to announce a labeling policy may therefore have been at least partially motivated by the domestic edible oil industry, which had been facing large increases in imports that year.21
Scenario II: Both Variants Supplied
For both variants to be supplied, the product identity needs to be preserved throughout the supply chain. Identity preservation can be achieved in two ways—having two separate production and marketing channels, with a focus on separating imported GM soybean oil; or exclusively processing domestic soybeans and retailing the extracted products as non-GM while keep all others commingled with GM. We analyze the likely costs for each of these.
Under a dual marketing channel system, the focus would be on imports, because they are the source of all GM-derived soybean oil. China has actually been implementing such a system but focusing on imported soybeans rather than soybean oil. In China’s system, all imported soybeans, which are considered GM, are separated from conventional domestic soybeans from the port to the final product. Imported products are then used primarily for soybean oil production and soy meal for animal feed, and domestic products are used for whole bean production. As a result, in certain eastern Chinese cities, consumers are only offered GM-labeled soybean oil in supermarkets, but other soy products do not carry a GM label (Lin et al. 2008).
In India, the segregation process would begin at the ports where crude and refined soybean oil is imported. Imported soybean oil would need to be stored separately from domestically produced oil. The two variants of soybean oil would have to be refined separately. Cleaning the refinery would involve new costs and production delays. Refined oil would then need to be stored and transported separately. This would create diseconomies of scale.
Once they reached distribution centers, the two variants would need to be packaged and labeled differently. This would involve additional printing costs. More importantly, with the variations in soybean production, the composition of soybean oil domestically produced and imported would vary from year to year. This may lead to a mismatch between the inventory of the packaging material for the two variants and their respective demand, with a shortage of one kind and surplus of the other.
There would also be overhead costs associated with establishing and maintaining systems for identity preservation, extra staff time and training, testing at each stage in the marketing chain, and legal costs associated with possible liability. As discussed in Appendix C, a very large proportion of soybean oil is blended with other oils to obtain blended refined oil or vanaspati. The segregation process would continue to the stages of manufacturing blended oil and vanaspati. The (legal) blended oil and vanaspati would go through a similar segregation process.
Production of soybean and extraction and refining of oil are concentrated in the western parts of India, but consumption is diffused all over India; therefore, transporting the oil from the production to processing and consumption centers requires significant travel and significant storage capacity. The entire process and the bulk handling nature of commodity trade would be affected, which would increase the costs of production. This would also potentially increase the observed under-capacitation of the edible oil processing sector.
In the case of contract farming, other costs would be involved, similar to the chain for non-GM soy meal.22
21 In a meeting in Delhi in August 2006, government representatives of the ministry of health were wrongly repeating that
labeling would apply only to imports, when it was clear that the draft rule on labeling would also apply to domestic cottonseed oil (IFPRI 2007). A rule on imports only would be in violation of India’s WTO obligations.
We contacted a company named Tinna, which has taken an initiative in backward integration with farmers through Krishi Vikas Kendras (KVKs). It has established more than 30 KVKs reaching out to more than 100,000 farmers farming on 50,000 hectares of land. KVKs provide agri-inputs to farmers. They apprise farmers on ideal farming practices and also make available product testing facilities. In turn, the company procures produce from farmers at the market rates. According to the company
22 See Appendix C for more information on this marketing channel.
17
representatives, the additional costs of procuring oilseeds through this initiative are about Rs 200–300 per ton. The company, however, reported gains in terms of procuring a regular supply of assured quality oilseeds to its plants and independence from foreign imports.23
Additionally, other costs for the economy would be incurred. Some big refineries may refrain from importing soybean oil because of a negative reputation effect, affecting India’s edible oil import basket, and would import more (arguably less healthy) palm oil at the detriment of soybean oil. Alternatively, they may source soybean oil from non-GM sources, resulting in trade diversion away from countries producing GM soy oil. Again, this would affect capacity utilization of refineries.
Reputed producers may also avoid using GM soybean oil. If the soybean oil forms a small proportion of ingredients, the costs of switching away from GM-derived to certified non-GM soybean oil would be relatively small compared with total raw material costs. These costs are likely to be borne by the suppliers. However, when soybean oil is used as a cooking medium or for frying purposes, the switch away from GM would affect the total cost of the product more significantly. The increased cost would likely be passed on to the consumers in the form of higher prices.
Maximum Cost of Non-GM Segregation
As with cottonseed oil, segregating GM from non-GM soybean oil will not happen if the cost of segregation results in a premium that exceeds the price difference of higher quality oils. Price estimates from Table 4 suggest that rapeseed oil is sold at an almost identical price and groundnut oil is only sold at a 13 percent price premium compared with soybean oil. Assuming the share of consumers willing to avoid GM is relatively limited, they would be able to buy rapeseed oil. However, if the share was larger and/or the price for rapeseed oil was to increase, consumers would only purchase non-GM soybean oil if its price premium was less than 13 percent of the original price.
4.4. Brinjal As explained in detail in Appendix D, brinjal is a widely consumed vegetable sold in loose form in the Indian vegetable market. In this context, the implementation of a GM labeling regulation, if GM brinjal is commercialized, would be quite challenging.
One of the main issues for implementation is the lack of packaging. According to surveyed sellers, brinjals cannot be packed in 1 kilogram packages, as is often done with some other vegetables, purely for weighing convenience for the consumers. The two main reasons are, first, if any brinjal in the pack gets rotten or stale, the whole pack will be rejected; and second, it is difficult to maintain air circulation and temperature within the pack, an essential requirement to keep these vegetables fresh.
To counter these problems, the urban retail chain Reliance Fresh wraps each premium quality brinjal separately when selling them in a packaged form. The better quality brinjals are separated in the warehouse during the sorting process, wrapped individually, and then brought to the stores for sale. In this way, the temperature is maintained and the vegetable remains fresh for a longer time. Packaged vegetables are sold at a price premium. The price differential between the packed and loose form is about Rs 1.5–2 per kilo (or about 10 percent of the loose form price). The process is economically viable because consumers from higher income groups visit these stores and are willing to pay a premium for the better quality vegetables. The advantage of segregation is that consumers do not have to spend time selecting the good vegetables.24
But this remains a very small niche compared with the overall market for brinjal.
For comparison, we looked for another vegetable in the retail stores that is sold with a label and has gone through a segregation process. Retail chains like Big Apple, Spencers Fresh, Le Marche, and
23 Communication with Anil Grover. 24 High-quality gourds are also sold packaged and labeled as “bottle gourd premium.” The price differential from loose form
was Rs 2 per kilo on the day of the survey. The other vegetables sold in both the forms are ladies’ finger (okra) and onions.
18
Reliance Fresh sell a premium vegetable called a sugar-free potato. The price premium is approximately 50 percent (Rs 5–6/kg) for the sugar-free variety. To draw an analogy with the potential segregation of non-GM brinjal, we traced back the supply chain for this potato. Sugar-free potatoes are treated chemically in cold storage to ensure that they do not turn sweet. While sending these potatoes separately to the mandi, the owners of the cold storages attach a letter specifying the particular sacks containing sugar-free potatoes. The wholesalers in the mandi taste potato samples before purchasing. They then store the sacks separately by marking them. Local vendors or the retail chains purchase the sugar-free potatoes from wholesalers at a higher rate. If they wish, they also check them by tasting samples. The market chain works well, notably because of the taste difference—which would not be possible with the brinjal.25
In the absence of GM brinjal in the Indian market at present, we can only build a hypothetical market scenario. Based on the results of Chong (2005) and Krishna and Qaim (2008), it is likely that GM brinjal would be sold at a lower price and that consumers would be willing to accept Bt brinjal at a price discount. Thus, certified non-GM, conventional brinjal would carry a price premium.
If the market size of consumers willing to pay more for the conventional variety is small, then the market would continue to supply commingled brinjals. Some consumers may stop using brinjal and substitute other vegetables, leading to some possible loss in the market share of brinjal. But because brinjals are among the most common vegetables, most people would likely continue to purchase them.
Since brinjal is sold in loose form, mostly in unorganized markets in India, a dual marketing system with identity preservation is unlikely to appear. First, our survey in the different types of vegetable markets in Delhi suggested that product segregation of GM and non-GM brinjals would be very difficult to monitor and enforce, especially in traditional markets. Chances of commingling are very high because of uneducated labors and sellers. Second, even if identity preservation was maintained at each stage of the market chain, price-sensitive buyers would likely buy the cheaper GM variety sold by the local vendors in the markets and fixed vegetable shops. They would not pay a higher price for the non-GM variety because of lack of trust in sellers. Third, even if retail chains had customers willing to pay a price premium for the non-GM brinjal, maintaining two marketing channels with product segregation and identity preservation might not be a viable option. The alternative route of procuring non-GM brinjal directly from farmers could be used by premium buyers if they face a sufficient demand for non-GM brinjal.
For these reasons, the segregation of Bt and non-Bt variety and implementing mandatory labeling will be difficult in the case of brinjal. Restaurants and the pickle industry will most likely buy the cheapest variety of brinjals. Among household buyers, there is evidence that low- and middle-income consumers are mainly concerned about the price and freshness of vegetables. Consumers demanding non-GM varieties will generally not purchase from the local sellers because of the trust factor. They might trust reputed big brands of retail chains that could use a contract farming scheme.
4.5. Rice Appendix E provides a rapid review of the rice market in India. In the absence of GM rice, we can only build a hypothetical market scenario that would emerge if GM rice was introduced and a mandatory labeling law was implemented. The observed price range for different rice varieties on retail markets suggests that both GM and non-GM rice would be supplied even in the absence of mandatory labeling policy. The poor, and especially those below the poverty line, would more likely buy low-priced GM rice (or a GM rice mix). At the same time, the high-priced non-GM variety can be produced and supplied with proper labeling to the demand of domestic consumers and to export markets.
In fact, a separate marketing channel for premium quality rice (basmati and organic) already exists in India, along with DNA testing facilities. Implementing a GM labeling policy would be easier for this market segment. Basmati rice, however, represents just 1 percent of total rice production, and certified organic rice production represents even less. The same challenges would be encountered to
25 There were two other examples with voluntary labeling in the market: the imported Washington apple and sweet tamarind that were sold at a high price premium (more than 100% for Washington apple). However, in both cases, consumers can verify the labels by visual inspection and taste.
19
implement a GM labeling policy for the remaining 99 percent of rice sold in loose form through unorganized markets as would be encountered with brinjal.
4.6. Synthesis With regard to the private cost of labeling, there is a clear dichotomy between the edible oils and the two other food items. Because they are packaged goods, and despite the fact that they are not always properly labeled, cottonseed oil and soybean oil could be relatively easily labeled by food manufacturers. Nevertheless, there are differences between the two oils; because India does not produce GM soybeans, a segregation system for non-GM soybean oil could be implemented at least at a small scale. It would be much more difficult to separate non-GM cottonseed oil in a country with over 70 percent adoption for GM cotton, unless the system is based on contract farming systems already in place (i.e., those using organic cotton).
The main issue with brinjal relates to the labeling means. Currently brinjal is not sold packaged, and although packaging could be done for high-quality brinjal sold to high-income urban consumers in new retail markets, this does not seem to be a viable option for the rest of the market. A sticker system would be extremely difficult to implement given the millions of traders and sellers involved in marketing brinjal all over the country. The fact that the market chain is unorganized makes the cost difficult to estimate.
The labeling of rice is the most difficult of the four food items to assess given the market size and its complexity. Certain rice varieties (basmati) are already subject to sophisticated marketing and packaging schemes that could adapt quite well to a labeling requirement. But these are not representative of constraints for other varieties of rice. Because most rice is traded in bulk, a complete segregation system seems unlikely. And because most of the rice is sold unpackaged, labeling would be quite challenging and might require unconventional labeling means (e.g., posters on display at shops).
20
5. FROM THEORY TO PRACTICE: ENFORCING GM FOOD LABELING
Food labeling is not new in India. Under the Prevention of Food Adulteration Act, 1954 (and the PFA rules, 1955), packaged food product labels in English or Hindi must display certain information: the ingredients, the manufacturer’s address, the weight, the lot number, the date of manufacturing/packaging, the maximum retail price (MRP), an irradiation logo if the food is irradiated, the presence of added colors or flavors, and a mark denoting whether the food is vegetarian or not (USDA-FAS 2004). In addition, other specifications are required for labels of infant food, condensed milk, milk powder, and vegetable oils. A draft notification on nutrition labeling was developed in 2005.
Product labeling of any kind is meant to provide information to the consumer, but this can be a challenge in a country where not all consumers are well informed nor are able to access information. The literacy rate in 2001 was only 65.38 percent and varies from 47.53 percent to 90.92 percent across states, which suggests a low understanding of food labels. There is no comprehensive evidence on the use of food label information, but a few studies are available. In particular, a recent Internet survey conducted by Nielsen in 2008 26
Yet, even if consumers read food labels, the use of labels is not ubiquitous. Many Indian food manufacturers and imported food producers reportedly fall short of providing the information required by law. For instance, certain sellers have been found to sell at prices exceeding the MRP, exceeding an artificially decreased MRP, or with fake MRP labels over the regular ones (e.g., Anand 2007).
found that over a third of responding consumers claim to always check food labels when shopping. But it also found that 46 percent of respondents admit to understanding food labels only partially, and 5 percent do not understand food labels at all. Obviously, this type of survey has very significant limitations, considering its method of sampling, which makes the results difficult to generalize to the Indian population. But if literate, educated, Internet-using consumers do not understand labels, then many others probably will not either.
In such cases, consumers are encouraged to file complaints against the retailers/manufacturers. Exemplary penalties are given to companies in violation of the regulations. There is evidence that the expiration date regulation, among others, has been violated (The Hindu 2005), which reportedly remains the most important information for urban consumers (AFIC 2008). Imported products are also under scrutiny, with violations resulting in bans of products (Red Orbit 2008). However, there is evidence that consumers have a low awareness of these laws (Kishtwaria et. al. 2004).
In this context of relatively imperfect enforcement and low awareness of rules and consumer protection, the announcement of the draft rule on GM food labeling was received with high skepticism by stakeholders involved in the food industry (Mishra 2006). The fact that it was designed as a strict and very comprehensive regulation prompted observers to wonder about testing infrastructures.27
5.1. Public Sector Cost of Labeling
The question of whether consumers would actually be able to understand and use a GM label was also raised. Even if food labels were actually being used by consumers, only a very small portion would likely be able to understand what genetically modified means.
A mandatory labeling law for GM food would be meaningful only if there is certification that verifies the labeled status and if government agencies have a mechanism to test the authenticity of that certification. Thus for the public sector, the cost of labeling would be that of providing a certification procedure and an enforcement mechanism.
Methods of detection designed to test presence of GM content aim at detecting either the newly produced protein or the foreign DNA. These methods are broadly classified as protein-based methods of
26 See http://in.nielsen.com/news/20080811.shtml 27 For instance, a senior scientist at the National Bureau of Plant Genetic Resources noted that “India has no lab that can
actually do large-scale testing for food with GM traces as low as 1 per cent” (Mishra 2006).
21
detection and DNA-based methods of detection, respectively.28
According to surveyed officials from the Indian Council of Agricultural Research (ICAR), the Government of India does not have adequate technical capacity to test genetic content of any food item. Having a certification mechanism for identity preservation would impose significant adjustment and inspection costs and would bear the risk of undetectable frauds.
A major limitation of these methods is that they are not applicable for oils because the proteins of the “foreign” DNA are largely retained by the de-oiled cake, and the oils contain very minute foreign DNA that cannot be reliably tested or quantified. The only way to ensure that cottonseed oil is non-GM would be to provide reliable documentation (identity preservation) in support of the claim.
In the case of the two edible oils, labeling would create important enforcement challenges, because of the impossibility of using reliable testing at the final product stage. This means that if GM and non-GM alternatives are marketed, a viable documentation system of some sort would have to be introduced. Even with a sophisticated documentation system, fraud could not be completely avoided.
Apart from testing, the sale of oil in loose form with illegal blending, which is common in rural areas, small towns and even in many parts of large cities (see Appendix C), would create challenges for the implementation of a GM labeling policy.29
On the other hand, the enforcement of GM labels on brinjal or rice may be eased by the fact that the products would be easy to test, and therefore fraud could actually be detected. Assuming a two-variant market outcome, the public cost of enforcement of brinjal labels would be relatively lower, but the private cost is higher than for edible oils. The testing of rice is feasible, with the use of conventional testing methods, but it would require a significant amount of new infrastructure and a large number of inspection facilities. Labeling rice would likely involve higher public costs but lower private costs than would brinjal. Enforcement would be extremely difficult, and in all likelihood, given the scope of the market, the public cost associated with implementation of GM labels on rice would exceed those involved in the three other case studies.
Qualitative evidence from surveyed markets in New Delhi shows that traders buy edible oil in bulk from the wholesalers and transport the oil in barrels to the shops. There, the oil is pumped into tanks with the help of a motorized pump. These tanks are connected to the taps in the shop through a network of pipes. The tanks, containers, and measures are seldom cleaned. Furthermore, the incentive to blend cheaper oils with more expensive oils is high. Thus, the probability of commingling is very high in this entire process.
5.2. Enforcement and Labeling Outcomes In studying the implications of labeling in the four market channels, we implicitly assumed that labeling would be enforced, but it is highly probable that it would not be forcefully implemented. Apart from intrinsic difficulties, other countries’ experience suggests that anti-GM nongovernmental organizations (NGOs) can play a significant role in the degree of enforcement (e.g., Gruere and Rao 2007; Gruere and Sengupta 2009). What would be a realistic labeling scenario for GM food products in India? We consider three possibilities: no visible enforcement, partial enforcement on all products, and partial enforcement on certain products.
No Visible Enforcement
With no visible enforcement, the law is published but not enforced by public authorities, in the sense that there is no inspection whatsoever. Food companies and other food chain agents (wholesalers and retailers) may either voluntarily comply or not. The only risk they run if they do not label is if third parties (NGOs) sample their products and find them in violation of the law.
28 A detailed description of these methods is given in Annexure III of De Leon, Manalo, and Guilatco (2004). 29 It should be noted that while it is mandatory to sell edible oil in a packaged form in Delhi, other states do not follow this
rule. The implementation is poor even in Delhi.
22
This risk is more important if the agent/company is a major player in the sector, if it has a branded image, if the product is likely to actually include or be derived from GM ingredients, and if the product can be easily tested. Thus, big cottonseed oil or importing soybean oil companies may prefer to label their products regardless of the content. But smaller oil units and medium or small brinjal or rice sellers (which constitutes a very large portion of these two markets) would not do so. In these latter two cases, however, high-end companies like vegetable supermarkets or rice exporters will voluntarily label their products as non-GM, with or without a labeling law.
Naturally, if millions of GM products are not labeled, the regulation loses its purpose and usefulness. Additionally, the possibility that GM-labeled products may not all include GM ingredients reinforces the failure of the regulation. Consumers will have no certainty of the GM content on GM-labeled and unlabeled product.
Partial Enforcement on All Products
Suppose the law is published, and there is some partial effort to enforce it. The complementary action by third-party inspections (of NGOs or others) will ensure that the main companies in organized food channels comply with the regulation. Most of the cottonseed oil and soybean oil would be labeled (with possible limited labeling violation in small units). Blended oil sold in a loose form containing cottonseed oil or soybean oil would violate labeling requirements. But partial enforcement on all products still does not provide any credible guarantees in the unorganized sectors with a multitude of small-size actors. With produce or loosely sold grains, the difference between partial enforcement on all products and no enforcement at all is only marginal. And if millions of products are supposed to be labeled but are not, and there is uncertainty of the GM content of GM-labeled product, then the labeling regulation fails its own objectives.
Partial Enforcement on Certain Products
A number of sources have noted that the interest of labeling was not related only to consumers but also to domestic production (particularly in the edible oil sector). With partial enforcement on certain products, the government could focus most of its effort on imported products. These products are easier to target and control, because of the limited number of entry points. The consequence of this strategy would be very similar to partial enforcement on all products, since soybean oil importers would likely label their products anyway. But if there was no visible enforcement and partial cheating in the domestic cottonseed oil sector, this would also run the risk of a backlash from the exporting country related to the use of process-based GM labeling as a nontariff barrier. Such a reaction could quickly evolve into a trade dispute, which would likely result in India’s being found in violation of its WTO obligations.
5.3. Synthesis The introduction of mandatory labeling for any product would involve significant implementation costs and challenges for regulatory authorities. According to surveyed authorities, there is currently no capacity for testing GM products in any Indian state. Thousands of inspectors would have to be hired and trained in each state. The system would require new documentation systems in the processed food industry and new packaging schemes in the informal food sector. A major public awareness campaign would be needed to inform all middlemen, sellers, and wholesale and retail outlet agents about the new requirement. Even under these conditions, the new regulation would likely be imperfectly enforced. In particular, products with informal marketing systems (brinjal, rice) are at a high risk of commonly being mislabeled: unlabeled GM products and non-GM products labeled GM. In other words, labeling does in fact involve a high cost of entry, a difficult transition, and the setting up of a relatively costly system in the long run, with no guarantee of success, especially because of the numerous small intermediaries involved in the food market chain.
23
6. IMPLICATIONS OF GM FOOD LABELING IN THE FOUR MARKETING CHANNELS
6.1. Cottonseed Oil Our survey of processing mills and refineries in the major producing state of Gujarat suggested that none of the brands is selling labeled GM or GM-free cottonseed oil. This indicates that consumers do not really care about the GM status of the oil or that consumers of non-GM products do not represent a sufficient share of the market to encourage labeling. A possible reason could be that this oil is consumed by lower echelons of society who are either unaware of GMOs in India or are unwilling to pay for or unable to afford GM-free oil. If their incomes increased they may switch to other vegetable oils like groundnut.
The effective additional cost of GM labeling would depend on whether the market supplies both variants of the product or only one variant, either GM or non-GM. As long as only a single GM variant is supplied, the direct labeling costs for the private sector are equal to the cost of pasting a sticker, since the market is basically covered with GM cotton. Even so, this could result in a share of consumers purchasing other oils, therefore lowering revenues for cottonseed oil producers. On the other hand, if the market supplies both variants of labeled product, then labeling costs would include the cost of segregation and identity preservation, which would largely exceed the basic cost of a sticker. With a competitive edible oil market, any additional costs due to labeling would be passed on to consumers. If this additional cost of segregation is too high (e.g., higher than 8 percent), consumers may prefer purchasing other vegetable oils. Assuming the segregation cost is lower than the price premium for oil substitutes, whether both variants are supplied in the market or not would directly depend on the consumers’ WTP for buying non-GM cottonseed oil.
As noted in Section 3, Deodhar, Ganesh, and Chern (2007) found that the awareness about GM technology was extremely low among consumers in Gujarat. After informing the respondents about the pros and cons of GM foods, more than 70 percent were willing to consume GM foods even if GM and non-GM foods were available for the same price. In fact, on average, Deodhar, Ganesh, and Chern (2007) found a negative WTP for non-GM cottonseed oil and noted that the more relatively expensive non-GM food is, the less likely consumers are to purchase it.
Combining these results with our own suggests that the most likely scenario to emerge after the implementation of mandatory labeling is that only GM cottonseed oil would be available in the market. In this case, the direct cost of labeling would be just the cost of pasting the sticker, which is trivial, just Rs 0.50 per unit. At the same time, if a small share of consumers switch to other vegetable oils, millers and refineries could incur losses, but these are unlikely to be significant. Additional costs for the public sector would be involved in setting up a regulatory mechanism to ensure truthful labeling.
But more importantly, with such an outcome, labeling would not be useful or beneficial to consumers. It would not provide consumers any choice—only GM cottonseed oil—and the information used would be limited especially if consumers remain unaware of what genetically modified means. Furthermore, the information may not always be completely truthful; in regions that still produce conventional non-GM cotton (and/or organic cotton), non-GM cottonseed oil would possibly still be labeled GM. In the small likelihood that labeling did result in consumers switching to other oils, the price of cottonseed oil might decrease (because of inelastic supply), to the benefit of the poorest consumers. But because current consumers do not care about the use of GM cottonseed in oil, it is unlikely that this decreasing price effect would be any significant.
The market size for non-GM cottonseed oil is likely to be very small and does not provide enough incentive to manufacturers to create two separate marketing channels. In the future, if consumers’ WTP for non-GM products became much higher, the most cost-effective alternative to ensure supply of GM-free raw materials would be through contract farming and voluntary labeling schemes. Given the widespread adoption of Bt cotton in India, contract farming and the use of organic rather than conventional cotton appear to be the only feasible ways to develop a non-GM cottonseed oil market niche.
24
6.2. Soybean Oil GM soybean is not approved for commercial cultivation in India. India does not import GM soybeans either; however, it imports 40–45 percent of its soybean oil for consumption from Argentina, Brazil, and the United States—the three leading producers of GM soybean.
We find that the costs of labeling GM soybean oil would vary depending on how the market reacts to the labeling law. We identified two scenarios that may emerge in the presence of labeling requirements. If the market continues to supply commingled soybean oil labeled as GM, the most important source of costs would be in the form of GM-averse consumers switching away from soybean oil to other edible oils. The food sector may switch ingredient use away from soy in favor of other oils. This would affect relative prices of edible oils, to the detriment of soybean oil producers and domestic soybean producers.
On the other hand, the market may react to the labeling laws by supplying both variants through identity preservation. This could be achieved by having two separate processing and marketing channels. In this case, the segregation costs need to be taken in account. An alternative way to supply certified non-GM soybean oil to the market is through exclusively procuring and processing domestically produced soybeans and marketing them separately, which would also involve costs.
Which of these scenarios would emerge in the soybean oil sector? Presently, none of the brands sold in the Indian market have a non-GM label. In this context, the most likely scenario would be the market continuing to supply commingled soy oil labeled as GM oil.
However, this outcome could change, and is more likely to change than that for cottonseed oil, especially if consumers are found to be label sensitive. Certain consumers may perceive that GM labels are meant to notify of health hazards and therefore prefer choosing products without a GM label. Because of this consumer perception, processors may expect that labeled GM products would be avoided by consumers and therefore change the composition of their product. As a consequence, rapeseed oil might replace soybean oil for producing margarine, and soy lecithin might be replaced by chemical emulsifiers. Such a shift in market could encourage domestic soybean producers and refiners to develop a non-GM soybean oil market niche.
But even such a niche would have its limits. Consumers in India have a preference for traditional oils such as groundnut oil or rapeseed oil, but the demand is price elastic. The consumption of soybean oil and palm oil has increased significantly over the past two decades because of their lower prices. Segregating non-GM oil would impose some costs on the soybean oil–processing sector that would be passed on to the consumers. If the resulting process significantly increased the price of soybean oil, the niche market would risk being unviable.
On the outset, although there are significant costs of labeling the product, would consumers benefit from labeling? With a mandatory labeling policy, the high-end consumers may get more information to facilitate their choice, but this could be at the expense of a majority of the other consumers who get neither more information nor greater choice but might have to pay higher prices (if non-GM becomes common) or switch to more onerous alternatives (if less soybean oil is sold on the market).
Finally, it should be noted that the costs of labeling would substantially increase if GM soybeans were approved for commercial cultivation in India.
6.3. Brinjal Bt brinjal has not yet been approved for commercial cultivation in India, but it is has passed all the regulatory requirements of the biosafety authority as of October 2009. If approved by the Government of India, it would be the first GM food crop in the Indian markets.
Organized retail is in its infancy in India, covering less than 1 percent of the market. Fruits and vegetables are largely sold in a loose form in the unorganized sector in India. Except for making pickles, brinjal is not used by the processing industry. Thus, if the labeling is meant to be applicable for packaged products, brinjal lies outside the policy net. If, however, the policy applies to all GM foods, whether packaged or not (as under the 2006 draft law), its implementation would be extremely difficult.
25
The implementation of a mandatory labeling policy for GM brinjal would likely require introducing a new marketing system in India—selling vegetables in a packaged form. Given the present market structure, this would be very difficult costwise. Furthermore, different types of packaging would be required to accommodate the different sizes and shapes of brinjal. This would require building a large inventory of many types of packaging means. Because Indian consumers are very price sensitive, any increase in cost may reduce the market size of brinjal.
An alternative to packaging would be pasting a sticker on every brinjal. In the initial stages of commercial release of Bt brinjal when it is introduced in select districts, it may be possible to paste a sticker on each and every Bt brinjal. But would brinjals reach consumers with the sticker? Since the Bt varieties would be sold at a price discount (Krishna and Qaim 2008), sellers would have an incentive to remove the sticker on the way and sell it as conventional non-infested brinjal. Sellers’ incentives would increase because consumers cannot verify whether the brinjals are GM or non-GM, and it may not be feasible for the regulatory authority to monitor, test, and detect GM content in vegetables of the multitude of vegetable sellers. Enforcement becomes even more complex because vegetable sellers may themselves not know at which stage in the marketing chain the sticker was removed.
If the adoption of Bt brinjal is commercially successful for the initial adopters, widespread adoption of Bt varieties is possible in other parts of India as well, as has been the case with Bt cotton.30
Furthermore, more than 99 percent of food and grocery in India is sold informally through street hawkers and small and large fixed shops. Hawkers would not in any way be able to guarantee the claim on the sticker, even if it is correct. Consequently, it can be expected that consumers would have little trust in the stickers. One implication is that small farmers who cannot afford or access certification might end up selling their produce as GM even when they are producing it with conventional seeds. This segment of the farmers would suffer the most because they would benefit neither from the increased productivity nor from any price premium for producing non-GM brinjal.
Once a majority of farmers adopt Bt varieties, it will become difficult to paste stickers on every brinjal that comes to the market.
31
Only retail chains would be able to supply certified non-GM varieties, which they may procure directly from farmers via contracts and identity preservation. Customers would be more likely to trust the labels provided by the reputed stores. But the retail stores would likely do so voluntarily even in the absence of GM food labeling, as with certain fruits. For the rest of the vegetable sellers, GM and non-GM brinjals would be sold in a commingled form. Consumers would not get more information or greater choice by the mandatory labeling policy.
6.4. Rice Labeled basmati rice and organic rice are examples of voluntary labeling in response to market demand. Consumers are willing to pay a significant price premium for these varieties.
Our rapid overview of the rice market suggests that there is an established niche market for premium quality rice, both in the domestic and the export markets. If GM rice was introduced in India, there would still remain a demand for labeled non-GM rice, even if additional costs are incurred in ensuring their supply. The additional costs would be relatively low for premium varieties because they already use separate marketing channels. As a result, there would be both GM and non-GM rice duly labeled, even if potential mislabeling could also occur. This result contrasts with the three other cases, where a corner solution appears to be the most likely result.
Another important observation is that all the states (except West Bengal) where rice is a staple diet are rice-deficient states. Consumers would benefit if GM rice is made available at a lower price, and therefore GM rice might be more widely accepted in these states. However, implementing labeling for small producers, millers, and traders operating in the unorganized market would likely be very difficult.
30 Chong (2005) finds that farmers’ adoption decisions of Bt brinjal are guided by commercial success. 31 Here we are assuming that non-Bt conventional varieties are sold at a price premium and the onus of proving lies with the
farmers who claim their produce to be non-Bt.
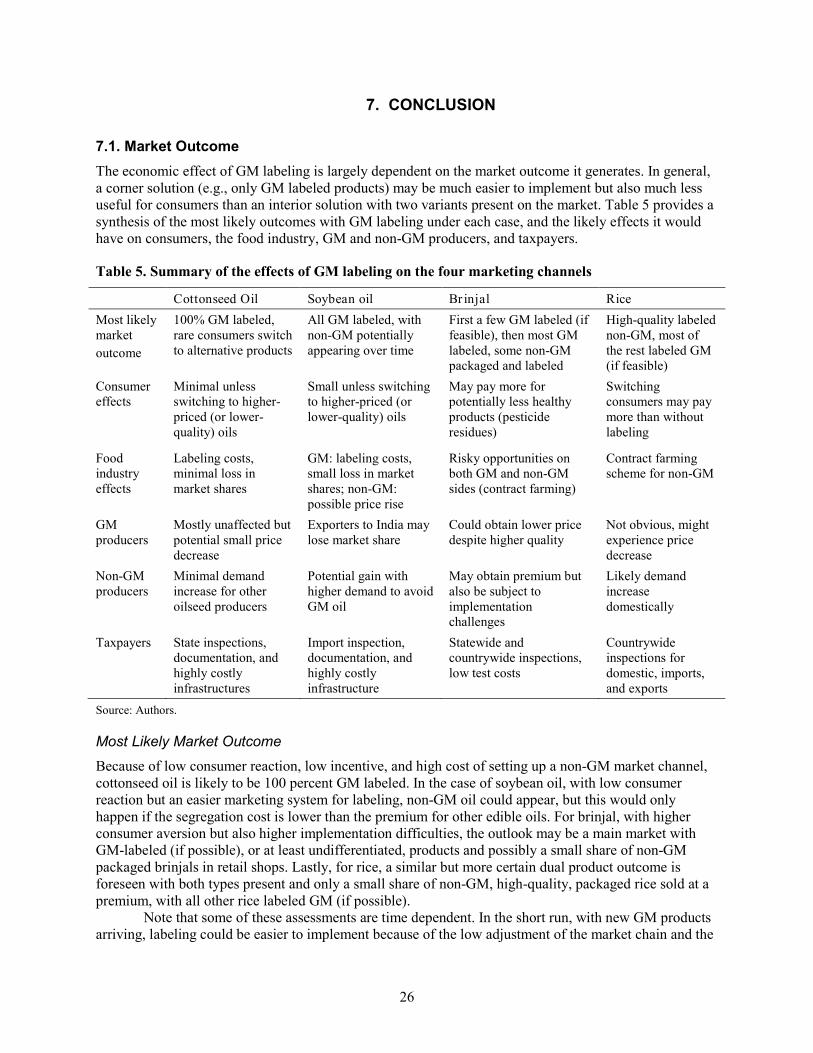
26
7. CONCLUSION
7.1. Market Outcome The economic effect of GM labeling is largely dependent on the market outcome it generates. In general, a corner solution (e.g., only GM labeled products) may be much easier to implement but also much less useful for consumers than an interior solution with two variants present on the market. Table 5 provides a synthesis of the most likely outcomes with GM labeling under each case, and the likely effects it would have on consumers, the food industry, GM and non-GM producers, and taxpayers.
Table 5. Summary of the effects of GM labeling on the four marketing channels
Cottonseed Oil Soybean oil Br injal Rice Most likely market outcome
100% GM labeled, rare consumers switch to alternative products
All GM labeled, with non-GM potentially appearing over time
First a few GM labeled (if feasible), then most GM labeled, some non-GM packaged and labeled
High-quality labeled non-GM, most of the rest labeled GM (if feasible)
Consumer effects
Minimal unless switching to higher-priced (or lower-quality) oils
Small unless switching to higher-priced (or lower-quality) oils
May pay more for potentially less healthy products (pesticide residues)
Switching consumers may pay more than without labeling
Food industry effects
Labeling costs, minimal loss in market shares
GM: labeling costs, small loss in market shares; non-GM: possible price rise
Risky opportunities on both GM and non-GM sides (contract farming)
Contract farming scheme for non-GM
GM producers
Mostly unaffected but potential small price decrease
Exporters to India may lose market share
Could obtain lower price despite higher quality
Not obvious, might experience price decrease
Non-GM producers
Minimal demand increase for other oilseed producers
Potential gain with higher demand to avoid GM oil
May obtain premium but also be subject to implementation challenges
Likely demand increase domestically
Taxpayers State inspections, documentation, and highly costly infrastructures
Import inspection, documentation, and highly costly infrastructure
Statewide and countrywide inspections, low test costs
Countrywide inspections for domestic, imports, and exports
Source: Authors.
Most Likely Market Outcome
Because of low consumer reaction, low incentive, and high cost of setting up a non-GM market channel, cottonseed oil is likely to be 100 percent GM labeled. In the case of soybean oil, with low consumer reaction but an easier marketing system for labeling, non-GM oil could appear, but this would only happen if the segregation cost is lower than the premium for other edible oils. For brinjal, with higher consumer aversion but also higher implementation difficulties, the outlook may be a main market with GM-labeled (if possible), or at least undifferentiated, products and possibly a small share of non-GM packaged brinjals in retail shops. Lastly, for rice, a similar but more certain dual product outcome is foreseen with both types present and only a small share of non-GM, high-quality, packaged rice sold at a premium, with all other rice labeled GM (if possible).
Note that some of these assessments are time dependent. In the short run, with new GM products arriving, labeling could be easier to implement because of the low adjustment of the market chain and the
27
large presence of non-GM products for differentiation. However, if these technologies appear to be successful for farmers, the adoption levels are likely to increase rapidly, as with Bt cotton. This means that the segregation of non-GM will be harder, and most products will simply be labeled as GM.
Consumer Effects
Beyond the basic consumer effect, it is important to note that information and choice are not guaranteed with GM labeling. Our study actually finds that in the four cases, a GM labeling policy would result in most (if not all) products labeled GM. Some products would even be mislabeled as GM by food sellers to avoid penalties. The fact that almost the entire domestic market would be covered by labeled items would not enhance consumer choice.
Furthermore, mandatory labeling is not likely to be more effective than voluntary labeling in that regard. Given the potential demand, non-GM-labeled rice and brinjal will likely appear even without a GM labeling requirement. The only visible effects of mandatory labeling would be to encourage consumers with unstable preferences (switching consumers) to avoid GM-labeled products, as shown by Bansal, Chakravarty, and Ramaswami (2008). The mere existence of these consumers ensures that mandatory labeling would only create more doubts and fears about the use of GM food products that would have passed all safety tests imposed by the Indian regulatory bodies.
Ironically, GM labeling might also encourage consumers to consume more of arguably “less healthy” products. Risk-averse consumers concerned with potential long-term effects of GM foods and sensitive to a labeling scheme might prefer switching to conventional food items with well-known short-term health risk effects, like brinjals with more pesticide residues, or palm oil, which contains less healthy fatty acids.
Food Industry
With regard to the food industry, the competitive structure matters. The edible oil market is quite competitive and relatively thin. Any new marginal cost would most likely be passed on to consumers. This is an additional reason why non-GM edible oils are unlikely to appear: Too high a price premium would jeopardize the existence of a niche market. In addition, the segregation process required for the implementation of a mandatory labeling policy may result in further reducing the capacity utilization of the edible oil–processing sector that already operates under capacity. Although an aggressive media campaign against imported GM soybean oil could effectively increase the demand for domestic non-GM alternatives and reduce soy oil imports, the fact that India’s demand for edible oil increases faster than its production levels (see Appendix C) increases the likelihood that GM soybean imports will not disappear. At a minimum, these products would shift to be used in catering, restaurants, and so forth, where a label is not required.
The twofold structure of the retail brinjal market seems propitious to price and quality differentiation, with partial cost absorption by the main market actors. Price increases may be observed for high-quality, non-GM produce, while others will sell at similar low prices solely based on produce quality. One of the possible scenarios we eliminated is one in which GM brinjal would be sold at a price premium because of its intrinsic higher quality (lower pesticide residues). This outcome is not impossible but seems to be difficult to imagine in view of consumer studies and the large information campaign by NGOs against GM brinjal (e.g., Financial Express 2008; Ghosh 2008). Such a premium would have to appear during the first few seasons with limited production, but a limited, labeled production would also facilitate targeted consumer campaign by opponents to GM brinjal. In the absence of mandatory labeling, non-GM brinjal would still remain widely available in India during the first season, to become rarer in the long run.
It is difficult to clearly isolate the effect on the whole rice industry. The current structure suggests that only high-price and high-quality varieties will be differentiated as non-GM, but the fact that rice production is very large and dispersed could push toward a coexistence of several regional dual marketing schemes with GM and non-GM rice available for different consumers.
28
Producers
The main effect for GM producers may be associated with a decrease in demand and price. This is more likely to happen with close non-GM substitutes and a significant consumer reaction to a GM-labeled product, especially at the beginning of GM production for basic commodities like brinjal or rice. GM soybean oil exporters could lose a significant market share if consumers switched to other oils, but labeling is unlikely to result in a ban of soybean oil in India. Existing or new non-GM producers selling their products as non-GM would obviously experience the exact opposite effects with possible demand and price increases.
Of course, all non-GM producers that do not make any effort to differentiate would experience the same effect as GM producers, without the benefit of the technology. In the long run, labeling will push all producers either to label and adopt or to entertain the option of selling more profitable, certified non-GM products at a much higher cost, if there is a market. Assuming the technology is effectively increasing productivity and that there is a non-GM market share, farmers that do not adopt nor certify are certain to lose. In that sense, mandatory labeling of GM food is pushing farmers to adopt GM or market their products as non-GM. In contrast, if India did not label, non-GM certification would still exist, but producers would not necessarily lose as much if they decided to keep their practices and technology unchanged.
Taxpayers
The main difference across cases relates to the difficulty of enforcement and the scope of the industry. As previously said, including highly processed products like refined oils in the mandatory labeling would largely increase the complexity of enforcement. Together with the lack of detectable material, complexity of enforcement is one of the reasons why almost all GM food labeling regulations worldwide do exclude these products (Gruere and Rao 2007). The fact that rice and brinjal are commonly sold everywhere would also increase the cost of enforcement and eventually result in additional government funding. All other public costs are common to all products.
7.2. Application to Other Food Products The four products were picked strategically because they will likely be the first affected by a new GM labeling regulation. But GM food labeling would apply to other products that are likely to reach the Indian market in coming years. On the production side, crops such as maize, golden rice, sorghum, potato, mustard, papaya, tomato, and soybeans could come to the market in the near future. On the import side, products derived from sugar beet, sugarcane, or wheat could add to the current GM soy-based products imported in India.
The economic implication of labeling these different products will depend on the three critical factors discussed in section 2. Still, it is highly probable that these outcomes will be similar to one or more of our case studies. More specifically, we expect that highly processed products, like edible oils from GM corn or rapeseed, or sugar derived from GM sugar beet or sugarcane, would generate results similar to cottonseed and soybean oils. Products that are only imported will resemble the soybean oil case study. Fresh produce like papaya or tomato would likely follow the brinjal example. And major cereals like wheat, sorghum, or maize would follow the example of rice.
But the commercialization or import of these new products is not independent from the presence of a labeling policy. The introduction of a mandatory labeling regulation will affect what enters the Indian market. If price decreases are observed, together with incremental costs for implementation, or if the labeled products are targeted by anti-GM NGOs, the food companies will discourage farmers to grow new GM crops, and exporters will avoid India. This could have dramatic consequences if labeling manages to discourage the use of high-potential technologies like drought-resistant or salt-resistant rice. If used as a targeting tool of a market barrier, labeling may prevent millions of Indian farmers accessing promising tools for productivity increase, at the expense of the whole Indian population.
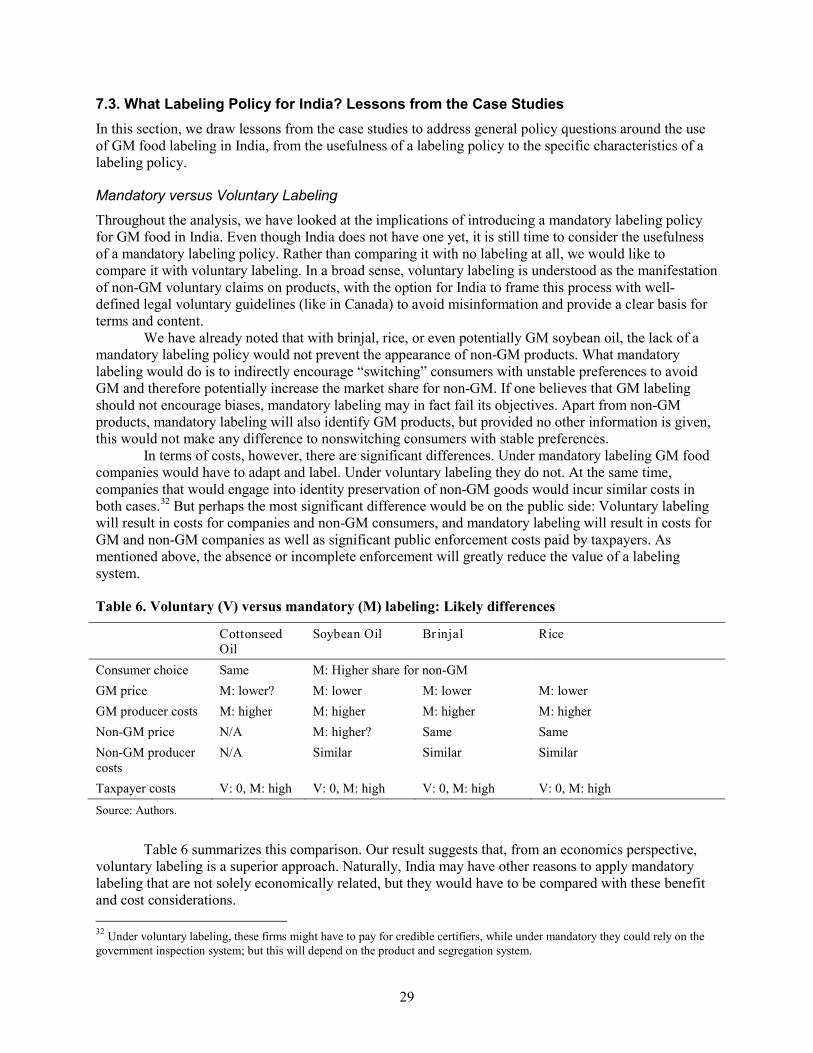
29
7.3. What Labeling Policy for India? Lessons from the Case Studies In this section, we draw lessons from the case studies to address general policy questions around the use of GM food labeling in India, from the usefulness of a labeling policy to the specific characteristics of a labeling policy.
Mandatory versus Voluntary Labeling
Throughout the analysis, we have looked at the implications of introducing a mandatory labeling policy for GM food in India. Even though India does not have one yet, it is still time to consider the usefulness of a mandatory labeling policy. Rather than comparing it with no labeling at all, we would like to compare it with voluntary labeling. In a broad sense, voluntary labeling is understood as the manifestation of non-GM voluntary claims on products, with the option for India to frame this process with well-defined legal voluntary guidelines (like in Canada) to avoid misinformation and provide a clear basis for terms and content.
We have already noted that with brinjal, rice, or even potentially GM soybean oil, the lack of a mandatory labeling policy would not prevent the appearance of non-GM products. What mandatory labeling would do is to indirectly encourage “switching” consumers with unstable preferences to avoid GM and therefore potentially increase the market share for non-GM. If one believes that GM labeling should not encourage biases, mandatory labeling may in fact fail its objectives. Apart from non-GM products, mandatory labeling will also identify GM products, but provided no other information is given, this would not make any difference to nonswitching consumers with stable preferences.
In terms of costs, however, there are significant differences. Under mandatory labeling GM food companies would have to adapt and label. Under voluntary labeling they do not. At the same time, companies that would engage into identity preservation of non-GM goods would incur similar costs in both cases.32
Table 6. Voluntary (V) versus mandatory (M) labeling: Likely differences
But perhaps the most significant difference would be on the public side: Voluntary labeling will result in costs for companies and non-GM consumers, and mandatory labeling will result in costs for GM and non-GM companies as well as significant public enforcement costs paid by taxpayers. As mentioned above, the absence or incomplete enforcement will greatly reduce the value of a labeling system.
Cottonseed Oil
Soybean Oil Br injal Rice
Consumer choice Same M: Higher share for non-GM GM price M: lower? M: lower M: lower M: lower GM producer costs M: higher M: higher M: higher M: higher Non-GM price N/A M: higher? Same Same Non-GM producer costs
N/A Similar Similar Similar
Taxpayer costs V: 0, M: high V: 0, M: high V: 0, M: high V: 0, M: high Source: Authors.
Table 6 summarizes this comparison. Our result suggests that, from an economics perspective, voluntary labeling is a superior approach. Naturally, India may have other reasons to apply mandatory labeling that are not solely economically related, but they would have to be compared with these benefit and cost considerations. 32 Under voluntary labeling, these firms might have to pay for credible certifiers, while under mandatory they could rely on the government inspection system; but this will depend on the product and segregation system.
30
In what follows, we still assume that India chose to implement a mandatory labeling policy to focus on the specific characteristics it should have, and under what condition its use would be most effective.
Labeling Characteristics: Coverage, Threshold, and Content
The comparison of case studies has demonstrated the expected difficulties of implementing labeling to all products in India. The most difficult challenges relate to the labeling of unpackaged products and to the inclusion of highly processed products. As noted in Section 5, the potential failure of mandatory labeling would be closely related to enforcement difficulties for these types of products.
Yet the coverage of a labeling regulation does not have to be as wide as the one under the draft rule. Every GM food-labeling regulation includes exceptions (Gruere and Rao 2007). In most countries, only GM-containing products are required to be labeled; highly processed products that do not contain GM material are exempt. Animal products derived from GM feed are also exempt from GM labeling regulations in almost all countries. The use of process-based labeling is really about the choice of farming production systems, or whether farmers use GM seeds or not. But is this really what Indian consumers want to know in priority? A comparison of the marginal benefits of including all products versus the cost of such broad and challenging implementation would almost certainly rule against the inclusion of process-based products.
Similarly, the choice of a threshold level for the GM designation and whether GM applies to all ingredients regardless of their weight contribution in the final product are significant determinants of the implementation cost of a labeling system. But at the same time, the marginal benefit to consumers may not be as large as the cost difference. India’s draft rule presently does not have a tolerance level, which is impractical and likely to make any enforcement unrealistic (0 percent tolerance is generally considered to be infeasible in largely traded products). Choosing a 1, 3, or 5 percent tolerance level for adventitious presence of GM products may not make much difference to consumers if what matters is whether the product is or is not GM overall. If it makes a difference, the price of non-GM may also make a difference to consumer demand. A number of Asian countries have a nonzero tolerance level applied only to major ingredients (e.g., Japan, 5 percent; South Korea, 3 percent; see Carter and Gruere 2003a). If an ingredient is minor and represents 0.1 percent of a food product, should it be regulated at the 0.1 percent; that is, should a product with 0.01 percent possible GM traces be considered and labeled GM when 99.99 percent of the product is in fact conventional? This question should be addressed in view of the economic implications of GM food labeling in a country like India.
Lastly, we have not considered the issue of the information to display on a label. Gruere and Rao (2007) have noted that writing only whether a product or ingredient is GM or contains or is derived from GM ingredients would not bring any useful information. Adding the fact that the GM product has been approved by the government could at least show that this is not a label related to safety considerations. For instance, the label could say, “GM brinjal, approved by the Government of India.” Doing this would probably lessen the share of consumers switching to a non-GM product because of mandatory labeling.
Necessary Conditions to Increase Likelihood of Success
Besides the specific characteristics of labeling, our analysis has outlined four necessary conditions to maximize the chance of success:
1. Enforcement should be considered a priority. 2. Implementation efforts should focus on both domestic and imported products. 3. Labeling should be accompanied by information awareness campaigns about GM crops. 4. Labeling should be accompanied by a large public information campaign related to the safety
of GM products and the biosafety regulatory requirements to ensure their safety. These four conditions would ensure that GM labels do not come only as meaningless statements or simple hazard warnings, potentially distorting perceptions and choice.
31
APPENDIX A: THE INDIAN DRAFT RULE ON GM FOOD LABELING
The following is an excerpt from the Draft Rules to Amend Prevention of Food Adulteration Rules, 1955.
1. These rules may be called the Prevention of Food Adulteration (……. Amendment) Rules, 2006. 2. They shall come into force on the date of their final publication in the Official Gazette.
In the Prevention of Food Adulteration Rules, 1955 (hereinafter referred to as the said rules) after rule 37D, the following shall be inserted, namely, (i) “37- E Labeling of Genetically Modified Food:– Genetically engineered or modified foods means food and food ingredients composed of or containing genetically modified or engineered organisms obtained through modern biotechnology, or food and food ingredients produced, from but not containing, genetically modified or engineered organisms obtained through modern biotechnology; In addition to the labeling provisions as prescribed under these rules, the genetically modified food shall also conform to the following labeling requirements:
a. GM food, derived there from, whether it is primary or processed or any ingredient of food, food additives or any food product that may contain GM material shall be compulsorily labeled, without any exceptions;
b. the label of all package(s) of GM food(s) or foods containing ingredients, derived from biotechnology or bioengineering or food additives or any food product that may contain GM material shall indicate that they have been subject to genetic modification. These provisions will be applicable to all such products both imported or domestically produced; and
c. the label of imported GM food or derived there from, whether it is primary or processed or any ingredient of food, food additives or any food product that may contain GM material shall also indicate that the product has been cleared for marketing and use in the country of origin so that the verification, if needed can be taken up with that country without having to resort to testing.”
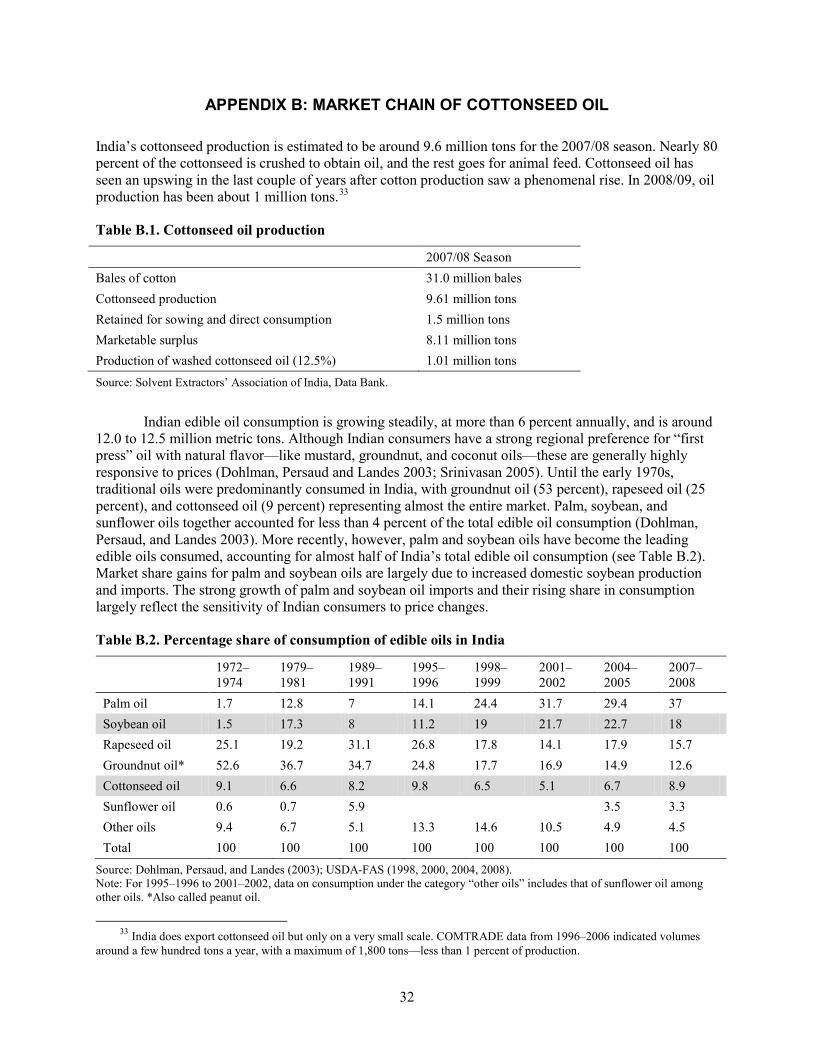
32
APPENDIX B: MARKET CHAIN OF COTTONSEED OIL
India’s cottonseed production is estimated to be around 9.6 million tons for the 2007/08 season. Nearly 80 percent of the cottonseed is crushed to obtain oil, and the rest goes for animal feed. Cottonseed oil has seen an upswing in the last couple of years after cotton production saw a phenomenal rise. In 2008/09, oil production has been about 1 million tons.33
Table B.1. Cottonseed oil production
2007/08 Season Bales of cotton 31.0 million bales Cottonseed production 9.61 million tons Retained for sowing and direct consumption 1.5 million tons Marketable surplus 8.11 million tons Production of washed cottonseed oil (12.5%) 1.01 million tons Source: Solvent Extractors’ Association of India, Data Bank.
Indian edible oil consumption is growing steadily, at more than 6 percent annually, and is around 12.0 to 12.5 million metric tons. Although Indian consumers have a strong regional preference for “first press” oil with natural flavor—like mustard, groundnut, and coconut oils—these are generally highly responsive to prices (Dohlman, Persaud and Landes 2003; Srinivasan 2005). Until the early 1970s, traditional oils were predominantly consumed in India, with groundnut oil (53 percent), rapeseed oil (25 percent), and cottonseed oil (9 percent) representing almost the entire market. Palm, soybean, and sunflower oils together accounted for less than 4 percent of the total edible oil consumption (Dohlman, Persaud, and Landes 2003). More recently, however, palm and soybean oils have become the leading edible oils consumed, accounting for almost half of India’s total edible oil consumption (see Table B.2). Market share gains for palm and soybean oils are largely due to increased domestic soybean production and imports. The strong growth of palm and soybean oil imports and their rising share in consumption largely reflect the sensitivity of Indian consumers to price changes.
Table B.2. Percentage share of consumption of edible oils in India
1972–1974
1979–1981
1989–1991
1995–1996
1998–1999
2001–2002
2004–2005
2007–2008
Palm oil 1.7 12.8 7 14.1 24.4 31.7 29.4 37 Soybean oil 1.5 17.3 8 11.2 19 21.7 22.7 18 Rapeseed oil 25.1 19.2 31.1 26.8 17.8 14.1 17.9 15.7 Groundnut oil* 52.6 36.7 34.7 24.8 17.7 16.9 14.9 12.6 Cottonseed oil 9.1 6.6 8.2 9.8 6.5 5.1 6.7 8.9 Sunflower oil 0.6 0.7 5.9 3.5 3.3 Other oils 9.4 6.7 5.1 13.3 14.6 10.5 4.9 4.5 Total 100 100 100 100 100 100 100 100
Source: Dohlman, Persaud, and Landes (2003); USDA-FAS (1998, 2000, 2004, 2008). Note: For 1995–1996 to 2001–2002, data on consumption under the category “other oils” includes that of sunflower oil among other oils. *Also called peanut oil.
33 India does export cottonseed oil but only on a very small scale. COMTRADE data from 1996–2006 indicated volumes
around a few hundred tons a year, with a maximum of 1,800 tons—less than 1 percent of production.
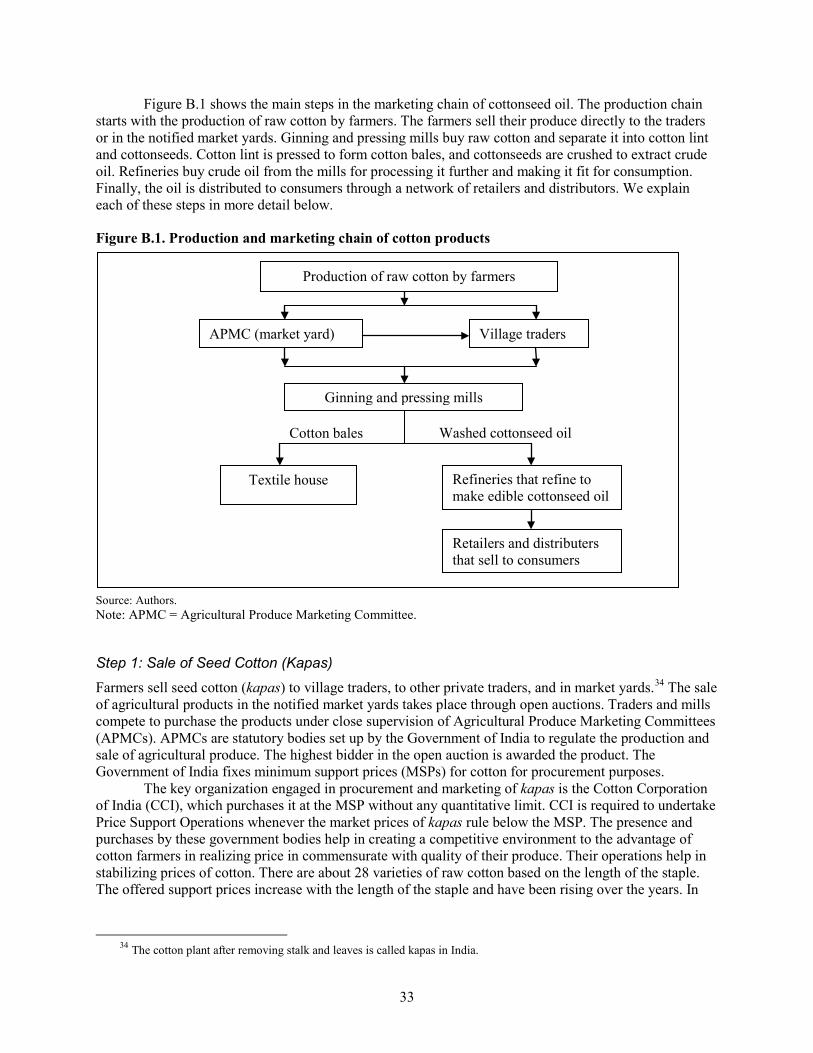
33
Figure B.1 shows the main steps in the marketing chain of cottonseed oil. The production chain starts with the production of raw cotton by farmers. The farmers sell their produce directly to the traders or in the notified market yards. Ginning and pressing mills buy raw cotton and separate it into cotton lint and cottonseeds. Cotton lint is pressed to form cotton bales, and cottonseeds are crushed to extract crude oil. Refineries buy crude oil from the mills for processing it further and making it fit for consumption. Finally, the oil is distributed to consumers through a network of retailers and distributors. We explain each of these steps in more detail below.
Figure B.1. Production and marketing chain of cotton products
Source: Authors. Note: APMC = Agricultural Produce Marketing Committee.
Step 1: Sale of Seed Cotton (Kapas)
Farmers sell seed cotton (kapas) to village traders, to other private traders, and in market yards.34
The key organization engaged in procurement and marketing of kapas is the Cotton Corporation of India (CCI), which purchases it at the MSP without any quantitative limit. CCI is required to undertake Price Support Operations whenever the market prices of kapas rule below the MSP. The presence and purchases by these government bodies help in creating a competitive environment to the advantage of cotton farmers in realizing price in commensurate with quality of their produce. Their operations help in stabilizing prices of cotton. There are about 28 varieties of raw cotton based on the length of the staple. The offered support prices increase with the length of the staple and have been rising over the years. In
The sale of agricultural products in the notified market yards takes place through open auctions. Traders and mills compete to purchase the products under close supervision of Agricultural Produce Marketing Committees (APMCs). APMCs are statutory bodies set up by the Government of India to regulate the production and sale of agricultural produce. The highest bidder in the open auction is awarded the product. The Government of India fixes minimum support prices (MSPs) for cotton for procurement purposes.
34 The cotton plant after removing stalk and leaves is called kapas in India.
Production of raw cotton by farmers
APMC (market yard) Village traders
Ginning and pressing mills
Textile house Refineries that refine to make edible cottonseed oil
Cotton bales Washed cottonseed oil
Retailers and distributers that sell to consumers
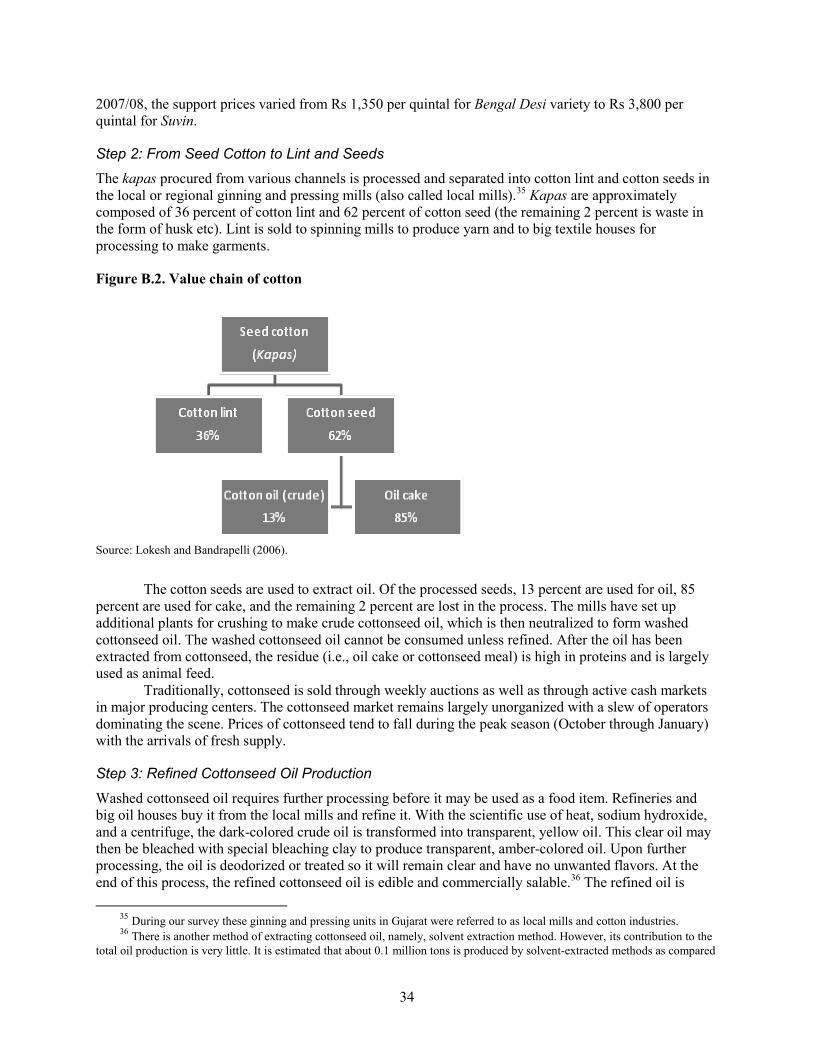
34
2007/08, the support prices varied from Rs 1,350 per quintal for Bengal Desi variety to Rs 3,800 per quintal for Suvin.
Step 2: From Seed Cotton to Lint and Seeds
The kapas procured from various channels is processed and separated into cotton lint and cotton seeds in the local or regional ginning and pressing mills (also called local mills).35
Figure B.2. Value chain of cotton
Kapas are approximately composed of 36 percent of cotton lint and 62 percent of cotton seed (the remaining 2 percent is waste in the form of husk etc). Lint is sold to spinning mills to produce yarn and to big textile houses for processing to make garments.
Source: Lokesh and Bandrapelli (2006).
The cotton seeds are used to extract oil. Of the processed seeds, 13 percent are used for oil, 85 percent are used for cake, and the remaining 2 percent are lost in the process. The mills have set up additional plants for crushing to make crude cottonseed oil, which is then neutralized to form washed cottonseed oil. The washed cottonseed oil cannot be consumed unless refined. After the oil has been extracted from cottonseed, the residue (i.e., oil cake or cottonseed meal) is high in proteins and is largely used as animal feed.
Traditionally, cottonseed is sold through weekly auctions as well as through active cash markets in major producing centers. The cottonseed market remains largely unorganized with a slew of operators dominating the scene. Prices of cottonseed tend to fall during the peak season (October through January) with the arrivals of fresh supply.
Step 3: Refined Cottonseed Oil Production
Washed cottonseed oil requires further processing before it may be used as a food item. Refineries and big oil houses buy it from the local mills and refine it. With the scientific use of heat, sodium hydroxide, and a centrifuge, the dark-colored crude oil is transformed into transparent, yellow oil. This clear oil may then be bleached with special bleaching clay to produce transparent, amber-colored oil. Upon further processing, the oil is deodorized or treated so it will remain clear and have no unwanted flavors. At the end of this process, the refined cottonseed oil is edible and commercially salable.36
35 During our survey these ginning and pressing units in Gujarat were referred to as local mills and cotton industries.
The refined oil is
36 There is another method of extracting cottonseed oil, namely, solvent extraction method. However, its contribution to the total oil production is very little. It is estimated that about 0.1 million tons is produced by solvent-extracted methods as compared
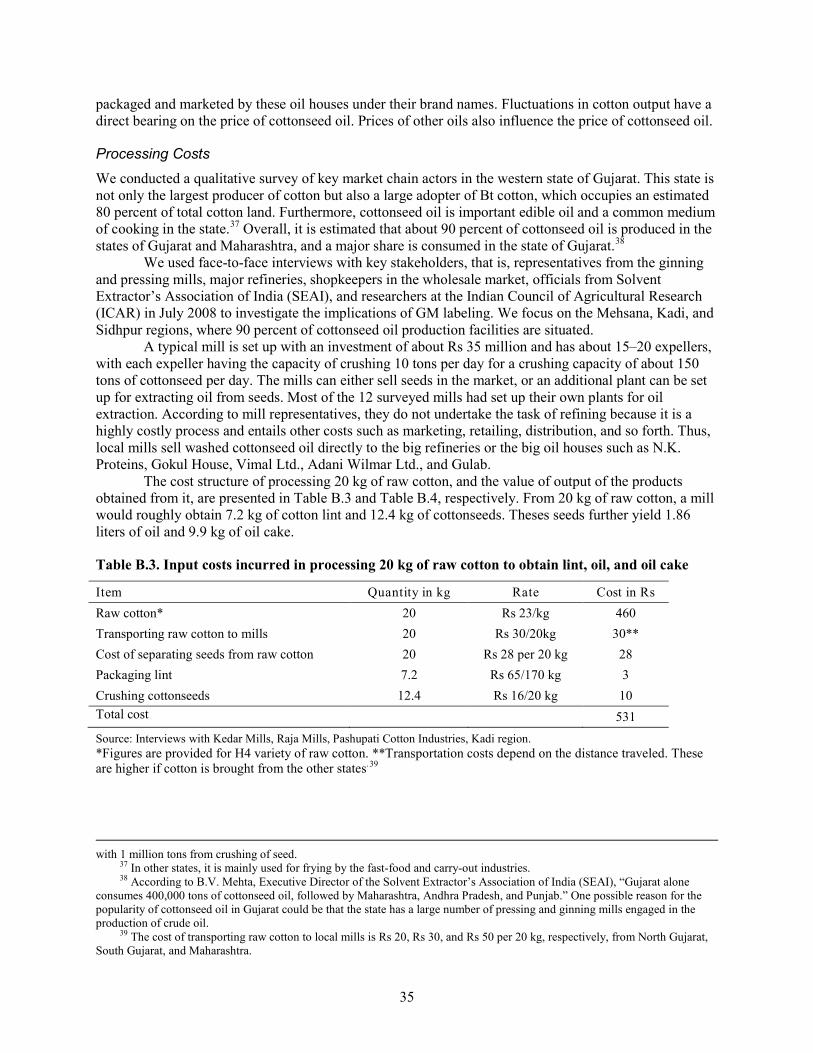
35
packaged and marketed by these oil houses under their brand names. Fluctuations in cotton output have a direct bearing on the price of cottonseed oil. Prices of other oils also influence the price of cottonseed oil.
Processing Costs
We conducted a qualitative survey of key market chain actors in the western state of Gujarat. This state is not only the largest producer of cotton but also a large adopter of Bt cotton, which occupies an estimated 80 percent of total cotton land. Furthermore, cottonseed oil is important edible oil and a common medium of cooking in the state.37 Overall, it is estimated that about 90 percent of cottonseed oil is produced in the states of Gujarat and Maharashtra, and a major share is consumed in the state of Gujarat.38
We used face-to-face interviews with key stakeholders, that is, representatives from the ginning and pressing mills, major refineries, shopkeepers in the wholesale market, officials from Solvent Extractor’s Association of India (SEAI), and researchers at the Indian Council of Agricultural Research (ICAR) in July 2008 to investigate the implications of GM labeling. We focus on the Mehsana, Kadi, and Sidhpur regions, where 90 percent of cottonseed oil production facilities are situated.
A typical mill is set up with an investment of about Rs 35 million and has about 15–20 expellers, with each expeller having the capacity of crushing 10 tons per day for a crushing capacity of about 150 tons of cottonseed per day. The mills can either sell seeds in the market, or an additional plant can be set up for extracting oil from seeds. Most of the 12 surveyed mills had set up their own plants for oil extraction. According to mill representatives, they do not undertake the task of refining because it is a highly costly process and entails other costs such as marketing, retailing, distribution, and so forth. Thus, local mills sell washed cottonseed oil directly to the big refineries or the big oil houses such as N.K. Proteins, Gokul House, Vimal Ltd., Adani Wilmar Ltd., and Gulab.
The cost structure of processing 20 kg of raw cotton, and the value of output of the products obtained from it, are presented in Table B.3 and Table B.4, respectively. From 20 kg of raw cotton, a mill would roughly obtain 7.2 kg of cotton lint and 12.4 kg of cottonseeds. Theses seeds further yield 1.86 liters of oil and 9.9 kg of oil cake.
Table B.3. Input costs incurred in processing 20 kg of raw cotton to obtain lint, oil, and oil cake
Item Quantity in kg Rate Cost in Rs Raw cotton* 20 Rs 23/kg 460 Transporting raw cotton to mills 20 Rs 30/20kg 30** Cost of separating seeds from raw cotton 20 Rs 28 per 20 kg 28 Packaging lint 7.2 Rs 65/170 kg 3 Crushing cottonseeds 12.4 Rs 16/20 kg 10 Total cost 531 Source: Interviews with Kedar Mills, Raja Mills, Pashupati Cotton Industries, Kadi region. *Figures are provided for H4 variety of raw cotton. **Transportation costs depend on the distance traveled. These are higher if cotton is brought from the other states.39
with 1 million tons from crushing of seed.
37 In other states, it is mainly used for frying by the fast-food and carry-out industries. 38 According to B.V. Mehta, Executive Director of the Solvent Extractor’s Association of India (SEAI), “Gujarat alone
consumes 400,000 tons of cottonseed oil, followed by Maharashtra, Andhra Pradesh, and Punjab.” One possible reason for the popularity of cottonseed oil in Gujarat could be that the state has a large number of pressing and ginning mills engaged in the production of crude oil.
39 The cost of transporting raw cotton to local mills is Rs 20, Rs 30, and Rs 50 per 20 kg, respectively, from North Gujarat, South Gujarat, and Maharashtra.
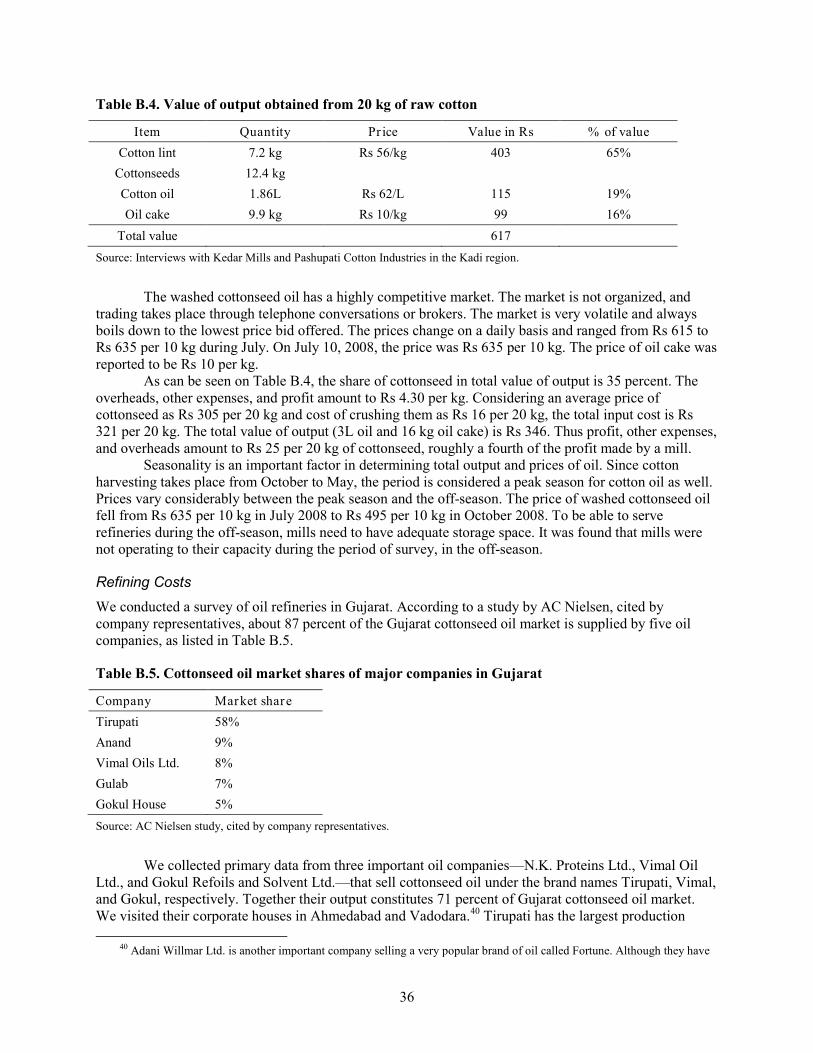
36
Table B.4. Value of output obtained from 20 kg of raw cotton
Item Quantity Pr ice Value in Rs % of value Cotton lint 7.2 kg Rs 56/kg 403 65%
Cottonseeds 12.4 kg Cotton oil 1.86L Rs 62/L 115 19% Oil cake 9.9 kg Rs 10/kg 99 16%
Total value 617 Source: Interviews with Kedar Mills and Pashupati Cotton Industries in the Kadi region.
The washed cottonseed oil has a highly competitive market. The market is not organized, and trading takes place through telephone conversations or brokers. The market is very volatile and always boils down to the lowest price bid offered. The prices change on a daily basis and ranged from Rs 615 to Rs 635 per 10 kg during July. On July 10, 2008, the price was Rs 635 per 10 kg. The price of oil cake was reported to be Rs 10 per kg.
As can be seen on Table B.4, the share of cottonseed in total value of output is 35 percent. The overheads, other expenses, and profit amount to Rs 4.30 per kg. Considering an average price of cottonseed as Rs 305 per 20 kg and cost of crushing them as Rs 16 per 20 kg, the total input cost is Rs 321 per 20 kg. The total value of output (3L oil and 16 kg oil cake) is Rs 346. Thus profit, other expenses, and overheads amount to Rs 25 per 20 kg of cottonseed, roughly a fourth of the profit made by a mill.
Seasonality is an important factor in determining total output and prices of oil. Since cotton harvesting takes place from October to May, the period is considered a peak season for cotton oil as well. Prices vary considerably between the peak season and the off-season. The price of washed cottonseed oil fell from Rs 635 per 10 kg in July 2008 to Rs 495 per 10 kg in October 2008. To be able to serve refineries during the off-season, mills need to have adequate storage space. It was found that mills were not operating to their capacity during the period of survey, in the off-season.
Refining Costs
We conducted a survey of oil refineries in Gujarat. According to a study by AC Nielsen, cited by company representatives, about 87 percent of the Gujarat cottonseed oil market is supplied by five oil companies, as listed in Table B.5.
Table B.5. Cottonseed oil market shares of major companies in Gujarat
Company Market share Tirupati 58% Anand 9% Vimal Oils Ltd. 8% Gulab 7% Gokul House 5% Source: AC Nielsen study, cited by company representatives.
We collected primary data from three important oil companies—N.K. Proteins Ltd., Vimal Oil Ltd., and Gokul Refoils and Solvent Ltd.—that sell cottonseed oil under the brand names Tirupati, Vimal, and Gokul, respectively. Together their output constitutes 71 percent of Gujarat cottonseed oil market. We visited their corporate houses in Ahmedabad and Vadodara.40
40 Adani Willmar Ltd. is another important company selling a very popular brand of oil called Fortune. Although they have
Tirupati has the largest production
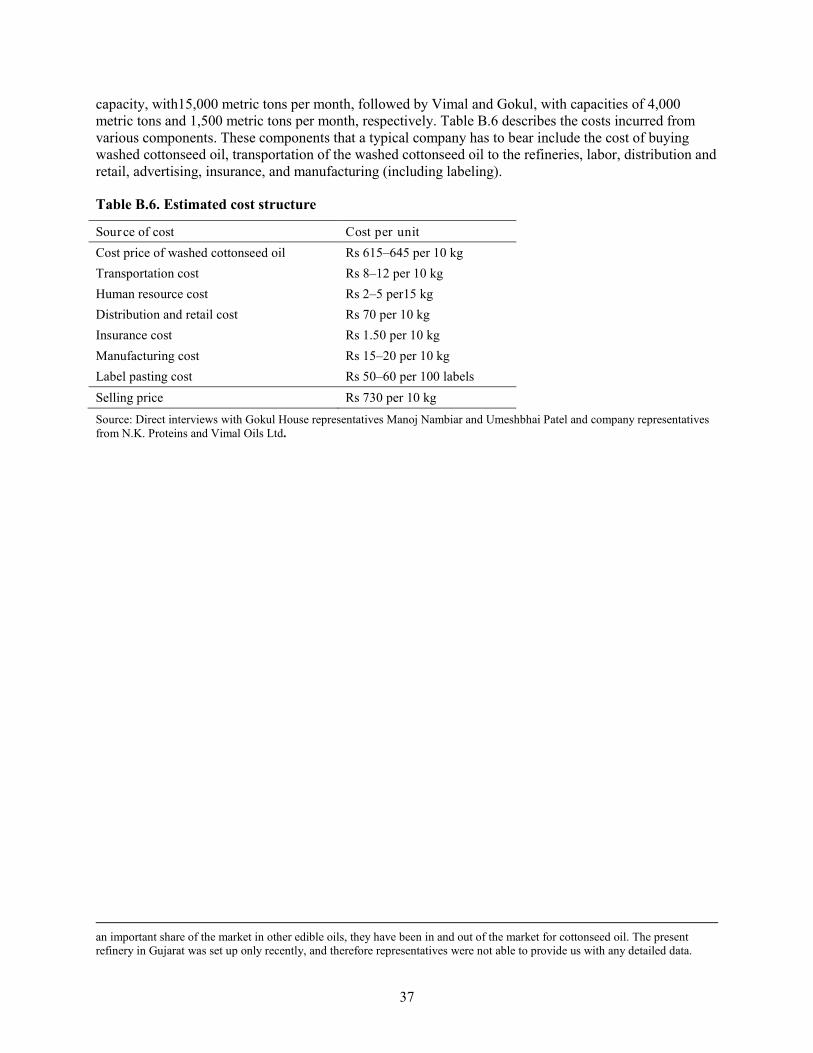
37
capacity, with15,000 metric tons per month, followed by Vimal and Gokul, with capacities of 4,000 metric tons and 1,500 metric tons per month, respectively. Table B.6 describes the costs incurred from various components. These components that a typical company has to bear include the cost of buying washed cottonseed oil, transportation of the washed cottonseed oil to the refineries, labor, distribution and retail, advertising, insurance, and manufacturing (including labeling).
Table B.6. Estimated cost structure
Source of cost Cost per unit Cost price of washed cottonseed oil Rs 615–645 per 10 kg Transportation cost Rs 8–12 per 10 kg Human resource cost Rs 2–5 per15 kg Distribution and retail cost Rs 70 per 10 kg Insurance cost Rs 1.50 per 10 kg Manufacturing cost Rs 15–20 per 10 kg Label pasting cost Rs 50–60 per 100 labels Selling price Rs 730 per 10 kg Source: Direct interviews with Gokul House representatives Manoj Nambiar and Umeshbhai Patel and company representatives from N.K. Proteins and Vimal Oils Ltd.
an important share of the market in other edible oils, they have been in and out of the market for cottonseed oil. The present refinery in Gujarat was set up only recently, and therefore representatives were not able to provide us with any detailed data.
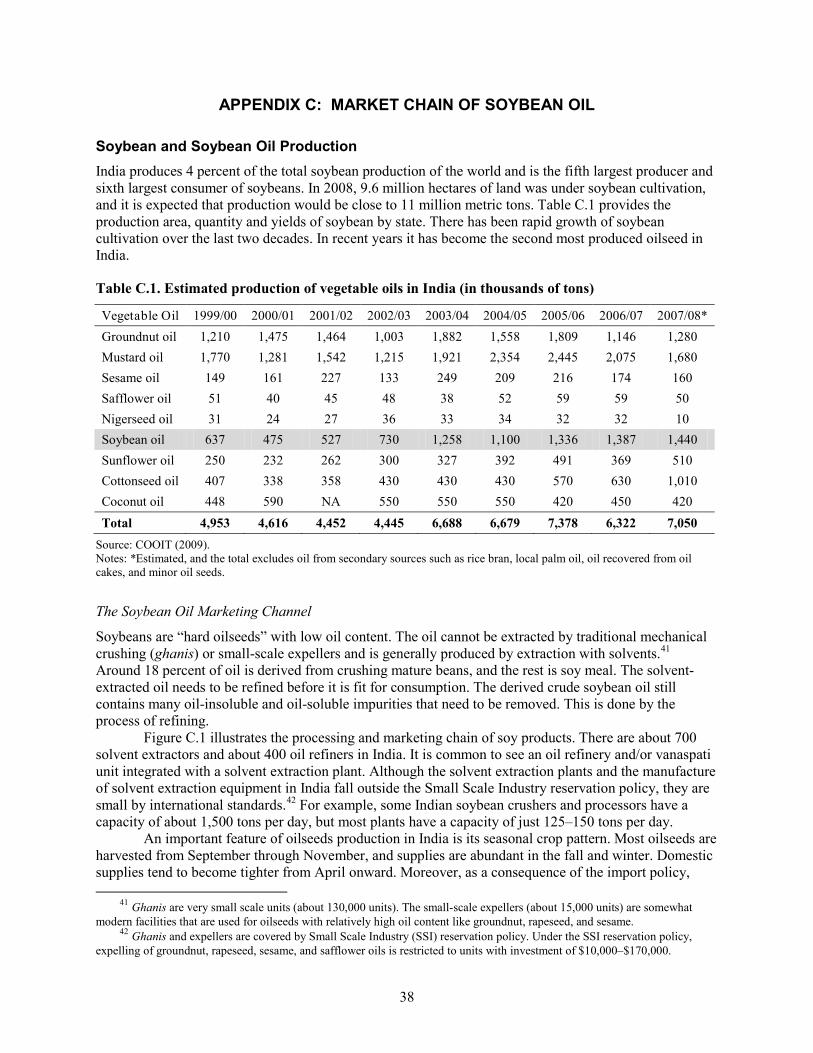
38
APPENDIX C: MARKET CHAIN OF SOYBEAN OIL
Soybean and Soybean Oil Production India produces 4 percent of the total soybean production of the world and is the fifth largest producer and sixth largest consumer of soybeans. In 2008, 9.6 million hectares of land was under soybean cultivation, and it is expected that production would be close to 11 million metric tons. Table C.1 provides the production area, quantity and yields of soybean by state. There has been rapid growth of soybean cultivation over the last two decades. In recent years it has become the second most produced oilseed in India.
Table C.1. Estimated production of vegetable oils in India (in thousands of tons)
Vegetable Oil 1999/00 2000/01 2001/02 2002/03 2003/04 2004/05 2005/06 2006/07 2007/08* Groundnut oil 1,210 1,475 1,464 1,003 1,882 1,558 1,809 1,146 1,280 Mustard oil 1,770 1,281 1,542 1,215 1,921 2,354 2,445 2,075 1,680 Sesame oil 149 161 227 133 249 209 216 174 160 Safflower oil 51 40 45 48 38 52 59 59 50 Nigerseed oil 31 24 27 36 33 34 32 32 10 Soybean oil 637 475 527 730 1,258 1,100 1,336 1,387 1,440 Sunflower oil 250 232 262 300 327 392 491 369 510 Cottonseed oil 407 338 358 430 430 430 570 630 1,010 Coconut oil 448 590 NA 550 550 550 420 450 420 Total 4,953 4,616 4,452 4,445 6,688 6,679 7,378 6,322 7,050
Source: COOIT (2009). Notes: *Estimated, and the total excludes oil from secondary sources such as rice bran, local palm oil, oil recovered from oil cakes, and minor oil seeds.
The Soybean Oil Marketing Channel
Soybeans are “hard oilseeds” with low oil content. The oil cannot be extracted by traditional mechanical crushing (ghanis) or small-scale expellers and is generally produced by extraction with solvents.41
Figure C.1 illustrates the processing and marketing chain of soy products. There are about 700 solvent extractors and about 400 oil refiners in India. It is common to see an oil refinery and/or vanaspati unit integrated with a solvent extraction plant. Although the solvent extraction plants and the manufacture of solvent extraction equipment in India fall outside the Small Scale Industry reservation policy, they are small by international standards.
Around 18 percent of oil is derived from crushing mature beans, and the rest is soy meal. The solvent-extracted oil needs to be refined before it is fit for consumption. The derived crude soybean oil still contains many oil-insoluble and oil-soluble impurities that need to be removed. This is done by the process of refining.
42
An important feature of oilseeds production in India is its seasonal crop pattern. Most oilseeds are harvested from September through November, and supplies are abundant in the fall and winter. Domestic supplies tend to become tighter from April onward. Moreover, as a consequence of the import policy,
For example, some Indian soybean crushers and processors have a capacity of about 1,500 tons per day, but most plants have a capacity of just 125–150 tons per day.
41 Ghanis are very small scale units (about 130,000 units). The small-scale expellers (about 15,000 units) are somewhat
modern facilities that are used for oilseeds with relatively high oil content like groundnut, rapeseed, and sesame. 42 Ghanis and expellers are covered by Small Scale Industry (SSI) reservation policy. Under the SSI reservation policy,
expelling of groundnut, rapeseed, sesame, and safflower oils is restricted to units with investment of $10,000–$170,000.
39
oilseeds are not imported in India. Low oilseed yields, poor transport and storage facilities, the variability in oilseed production, and the inaccessibility to imported oilseeds make it difficult for processors to procure regular supplies throughout the year, resulting in low-capacity utilization. On average, the solvent extraction plants operate around the domestic raw material harvest period, or at about 30–40 percent of capacity. According to World Bank estimates, low-capacity utilization for solvent extractors has resulted in soybean processing costs in India that are 40 percent higher than in China and 90 percent greater than in the United States.
The processing sector is also characterized by low profit margins due to high competition. The availability of cheap imported vegetable oil has reduced the margins of the solvent extraction industry considerably. According to company representatives, the integrated solvent extractor and oil refinery plant operate at a bare 1 percent profit margin.
Non-GM Soymeals
About 82 percent of soybeans are used to produce soy meals. The domestic consumption of soy meal in India is limited (about 30 percent of total domestic production), and most of it is exported in the form of de-oiled cake.43
In 2007/08, of the 6.4 million metric tons of soymeal produced in India, only 1.92 million metric tons were consumed domestically and the rest was exported. Indian soymeals are more competitive in world markets than other domestically produced meals, possibly because soybeans are processed in relatively modern solvent extraction facilities. They also benefit from foreign demand for non-GM soymeal. The Export Inspection Council of India (Ministry of Commerce and Industry, Government of India) issues a blanket non-GMO certificate for all exported soymeals because all soy meal produced in India is non-GM. Private firms also provide certification and testing facilities. There are five or six such labs in India. According to Geo Chem, a testing lab in Bangalore, the cost of getting a sample of 200 gm tested is Rs 8,000 and takes three to four days.
43 Over the years, soy meal consumption in India is rising. This could be attributed to the growing poultry industry in India.
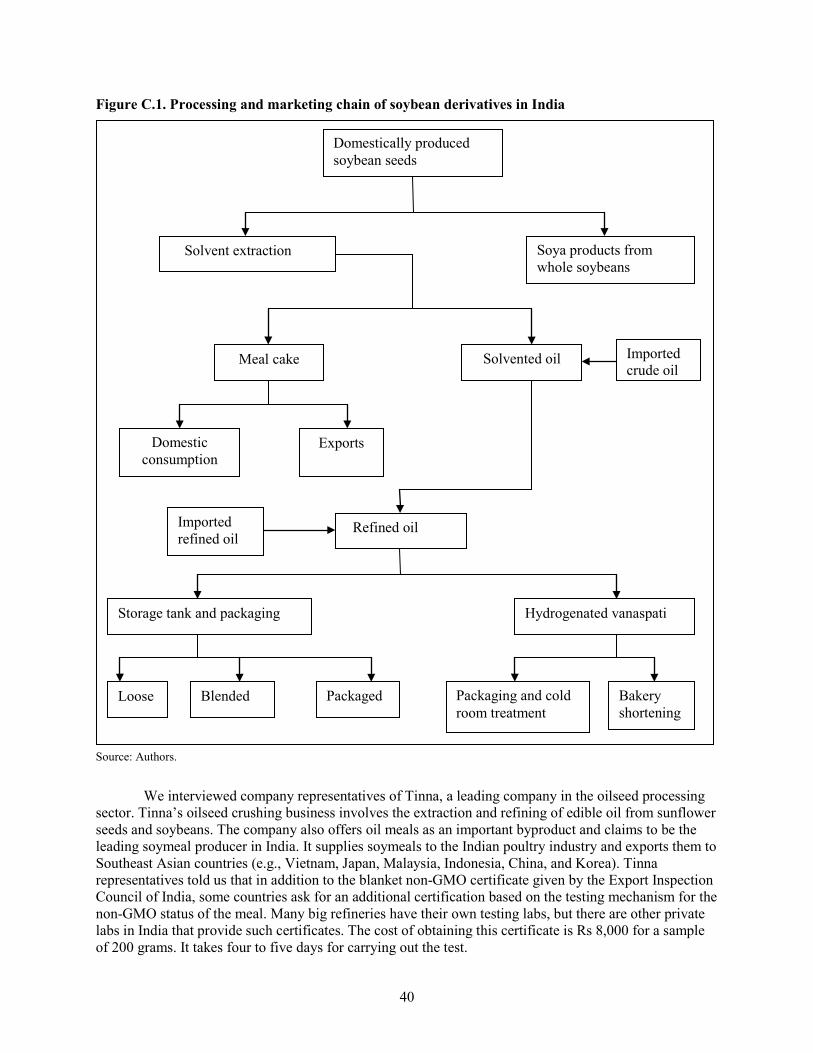
40
Figure C.1. Processing and marketing chain of soybean derivatives in India
Source: Authors.
We interviewed company representatives of Tinna, a leading company in the oilseed processing sector. Tinna’s oilseed crushing business involves the extraction and refining of edible oil from sunflower seeds and soybeans. The company also offers oil meals as an important byproduct and claims to be the leading soymeal producer in India. It supplies soymeals to the Indian poultry industry and exports them to Southeast Asian countries (e.g., Vietnam, Japan, Malaysia, Indonesia, China, and Korea). Tinna representatives told us that in addition to the blanket non-GMO certificate given by the Export Inspection Council of India, some countries ask for an additional certification based on the testing mechanism for the non-GMO status of the meal. Many big refineries have their own testing labs, but there are other private labs in India that provide such certificates. The cost of obtaining this certificate is Rs 8,000 for a sample of 200 grams. It takes four to five days for carrying out the test.
Domestically produced soybean seeds
Solvent extraction
Meal cake
Refined oil
Solvented oil
Imported refined oil
Domestic consumption
Exports
Loose Blended Packaged Packaging and cold room treatment
Bakery shortening
Soya products from whole soybeans
Storage tank and packaging Hydrogenated vanaspati
Imported crude oil
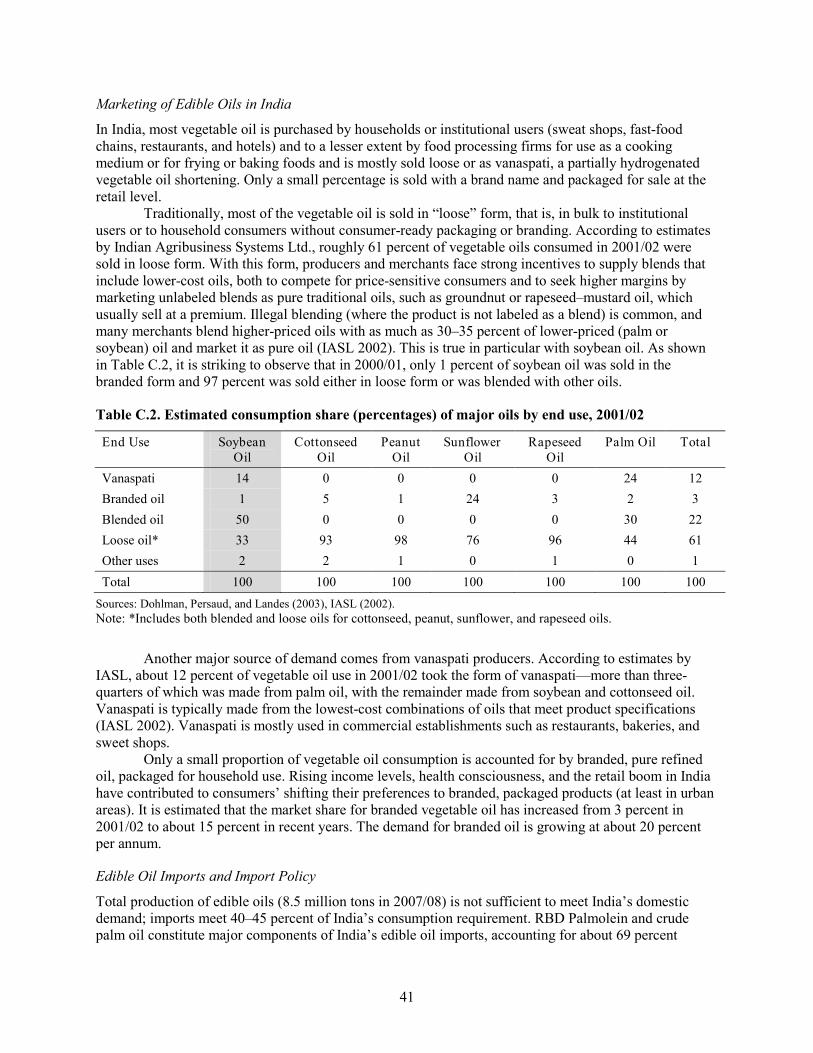
41
Marketing of Edible Oils in India
In India, most vegetable oil is purchased by households or institutional users (sweat shops, fast-food chains, restaurants, and hotels) and to a lesser extent by food processing firms for use as a cooking medium or for frying or baking foods and is mostly sold loose or as vanaspati, a partially hydrogenated vegetable oil shortening. Only a small percentage is sold with a brand name and packaged for sale at the retail level.
Traditionally, most of the vegetable oil is sold in “loose” form, that is, in bulk to institutional users or to household consumers without consumer-ready packaging or branding. According to estimates by Indian Agribusiness Systems Ltd., roughly 61 percent of vegetable oils consumed in 2001/02 were sold in loose form. With this form, producers and merchants face strong incentives to supply blends that include lower-cost oils, both to compete for price-sensitive consumers and to seek higher margins by marketing unlabeled blends as pure traditional oils, such as groundnut or rapeseed–mustard oil, which usually sell at a premium. Illegal blending (where the product is not labeled as a blend) is common, and many merchants blend higher-priced oils with as much as 30–35 percent of lower-priced (palm or soybean) oil and market it as pure oil (IASL 2002). This is true in particular with soybean oil. As shown in Table C.2, it is striking to observe that in 2000/01, only 1 percent of soybean oil was sold in the branded form and 97 percent was sold either in loose form or was blended with other oils.
Table C.2. Estimated consumption share (percentages) of major oils by end use, 2001/02
End Use Soybean Oil
Cottonseed Oil
Peanut Oil
Sunflower Oil
Rapeseed Oil
Palm Oil Total
Vanaspati 14 0 0 0 0 24 12 Branded oil 1 5 1 24 3 2 3 Blended oil 50 0 0 0 0 30 22 Loose oil* 33 93 98 76 96 44 61 Other uses 2 2 1 0 1 0 1 Total 100 100 100 100 100 100 100
Sources: Dohlman, Persaud, and Landes (2003), IASL (2002). Note: *Includes both blended and loose oils for cottonseed, peanut, sunflower, and rapeseed oils.
Another major source of demand comes from vanaspati producers. According to estimates by IASL, about 12 percent of vegetable oil use in 2001/02 took the form of vanaspati—more than three-quarters of which was made from palm oil, with the remainder made from soybean and cottonseed oil. Vanaspati is typically made from the lowest-cost combinations of oils that meet product specifications (IASL 2002). Vanaspati is mostly used in commercial establishments such as restaurants, bakeries, and sweet shops.
Only a small proportion of vegetable oil consumption is accounted for by branded, pure refined oil, packaged for household use. Rising income levels, health consciousness, and the retail boom in India have contributed to consumers’ shifting their preferences to branded, packaged products (at least in urban areas). It is estimated that the market share for branded vegetable oil has increased from 3 percent in 2001/02 to about 15 percent in recent years. The demand for branded oil is growing at about 20 percent per annum.
Edible Oil Imports and Import Policy
Total production of edible oils (8.5 million tons in 2007/08) is not sufficient to meet India’s domestic demand; imports meet 40–45 percent of India’s consumption requirement. RBD Palmolein and crude palm oil constitute major components of India’s edible oil imports, accounting for about 69 percent
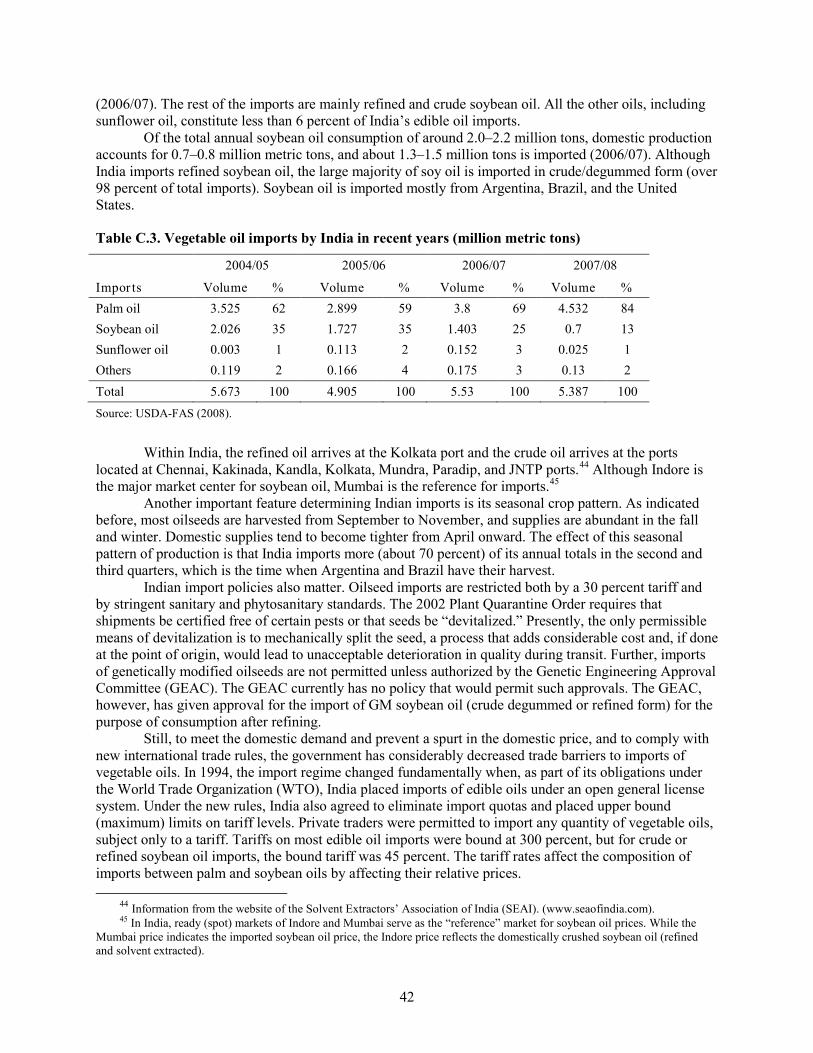
42
(2006/07). The rest of the imports are mainly refined and crude soybean oil. All the other oils, including sunflower oil, constitute less than 6 percent of India’s edible oil imports.
Of the total annual soybean oil consumption of around 2.0–2.2 million tons, domestic production accounts for 0.7–0.8 million metric tons, and about 1.3–1.5 million tons is imported (2006/07). Although India imports refined soybean oil, the large majority of soy oil is imported in crude/degummed form (over 98 percent of total imports). Soybean oil is imported mostly from Argentina, Brazil, and the United States.
Table C.3. Vegetable oil imports by India in recent years (million metric tons)
2004/05 2005/06 2006/07 2007/08
Impor ts Volume % Volume % Volume % Volume % Palm oil 3.525 62 2.899 59 3.8 69 4.532 84 Soybean oil 2.026 35 1.727 35 1.403 25 0.7 13 Sunflower oil 0.003 1 0.113 2 0.152 3 0.025 1 Others 0.119 2 0.166 4 0.175 3 0.13 2 Total 5.673 100 4.905 100 5.53 100 5.387 100 Source: USDA-FAS (2008).
Within India, the refined oil arrives at the Kolkata port and the crude oil arrives at the ports located at Chennai, Kakinada, Kandla, Kolkata, Mundra, Paradip, and JNTP ports.44 Although Indore is the major market center for soybean oil, Mumbai is the reference for imports.45
Another important feature determining Indian imports is its seasonal crop pattern. As indicated before, most oilseeds are harvested from September to November, and supplies are abundant in the fall and winter. Domestic supplies tend to become tighter from April onward. The effect of this seasonal pattern of production is that India imports more (about 70 percent) of its annual totals in the second and third quarters, which is the time when Argentina and Brazil have their harvest.
Indian import policies also matter. Oilseed imports are restricted both by a 30 percent tariff and by stringent sanitary and phytosanitary standards. The 2002 Plant Quarantine Order requires that shipments be certified free of certain pests or that seeds be “devitalized.” Presently, the only permissible means of devitalization is to mechanically split the seed, a process that adds considerable cost and, if done at the point of origin, would lead to unacceptable deterioration in quality during transit. Further, imports of genetically modified oilseeds are not permitted unless authorized by the Genetic Engineering Approval Committee (GEAC). The GEAC currently has no policy that would permit such approvals. The GEAC, however, has given approval for the import of GM soybean oil (crude degummed or refined form) for the purpose of consumption after refining.
Still, to meet the domestic demand and prevent a spurt in the domestic price, and to comply with new international trade rules, the government has considerably decreased trade barriers to imports of vegetable oils. In 1994, the import regime changed fundamentally when, as part of its obligations under the World Trade Organization (WTO), India placed imports of edible oils under an open general license system. Under the new rules, India also agreed to eliminate import quotas and placed upper bound (maximum) limits on tariff levels. Private traders were permitted to import any quantity of vegetable oils, subject only to a tariff. Tariffs on most edible oil imports were bound at 300 percent, but for crude or refined soybean oil imports, the bound tariff was 45 percent. The tariff rates affect the composition of imports between palm and soybean oils by affecting their relative prices.
44 Information from the website of the Solvent Extractors’ Association of India (SEAI). (www.seaofindia.com). 45 In India, ready (spot) markets of Indore and Mumbai serve as the “reference” market for soybean oil prices. While the
Mumbai price indicates the imported soybean oil price, the Indore price reflects the domestically crushed soybean oil (refined and solvent extracted).
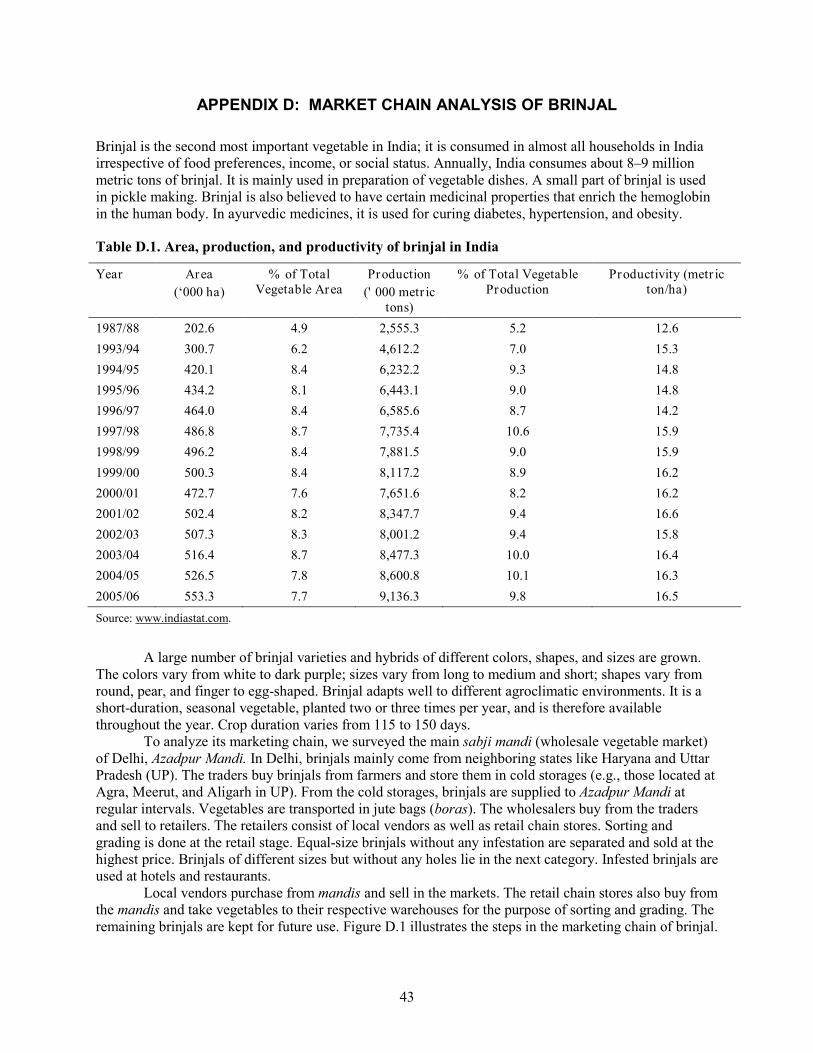
43
APPENDIX D: MARKET CHAIN ANALYSIS OF BRINJAL
Brinjal is the second most important vegetable in India; it is consumed in almost all households in India irrespective of food preferences, income, or social status. Annually, India consumes about 8–9 million metric tons of brinjal. It is mainly used in preparation of vegetable dishes. A small part of brinjal is used in pickle making. Brinjal is also believed to have certain medicinal properties that enrich the hemoglobin in the human body. In ayurvedic medicines, it is used for curing diabetes, hypertension, and obesity.
Table D.1. Area, production, and productivity of brinjal in India
Source: www.indiastat.com.
A large number of brinjal varieties and hybrids of different colors, shapes, and sizes are grown. The colors vary from white to dark purple; sizes vary from long to medium and short; shapes vary from round, pear, and finger to egg-shaped. Brinjal adapts well to different agroclimatic environments. It is a short-duration, seasonal vegetable, planted two or three times per year, and is therefore available throughout the year. Crop duration varies from 115 to 150 days.
To analyze its marketing chain, we surveyed the main sabji mandi (wholesale vegetable market) of Delhi, Azadpur Mandi. In Delhi, brinjals mainly come from neighboring states like Haryana and Uttar Pradesh (UP). The traders buy brinjals from farmers and store them in cold storages (e.g., those located at Agra, Meerut, and Aligarh in UP). From the cold storages, brinjals are supplied to Azadpur Mandi at regular intervals. Vegetables are transported in jute bags (boras). The wholesalers buy from the traders and sell to retailers. The retailers consist of local vendors as well as retail chain stores. Sorting and grading is done at the retail stage. Equal-size brinjals without any infestation are separated and sold at the highest price. Brinjals of different sizes but without any holes lie in the next category. Infested brinjals are used at hotels and restaurants.
Local vendors purchase from mandis and sell in the markets. The retail chain stores also buy from the mandis and take vegetables to their respective warehouses for the purpose of sorting and grading. The remaining brinjals are kept for future use. Figure D.1 illustrates the steps in the marketing chain of brinjal.
Year Area (‘000 ha)
% of Total Vegetable Area
Production (' 000 metr ic
tons)
% of Total Vegetable Production
Productivity (metr ic ton/ha)
1987/88 202.6 4.9 2,555.3 5.2 12.6 1993/94 300.7 6.2 4,612.2 7.0 15.3 1994/95 420.1 8.4 6,232.2 9.3 14.8 1995/96 434.2 8.1 6,443.1 9.0 14.8 1996/97 464.0 8.4 6,585.6 8.7 14.2 1997/98 486.8 8.7 7,735.4 10.6 15.9 1998/99 496.2 8.4 7,881.5 9.0 15.9 1999/00 500.3 8.4 8,117.2 8.9 16.2 2000/01 472.7 7.6 7,651.6 8.2 16.2 2001/02 502.4 8.2 8,347.7 9.4 16.6 2002/03 507.3 8.3 8,001.2 9.4 15.8 2003/04 516.4 8.7 8,477.3 10.0 16.4 2004/05 526.5 7.8 8,600.8 10.1 16.3 2005/06 553.3 7.7 9,136.3 9.8 16.5
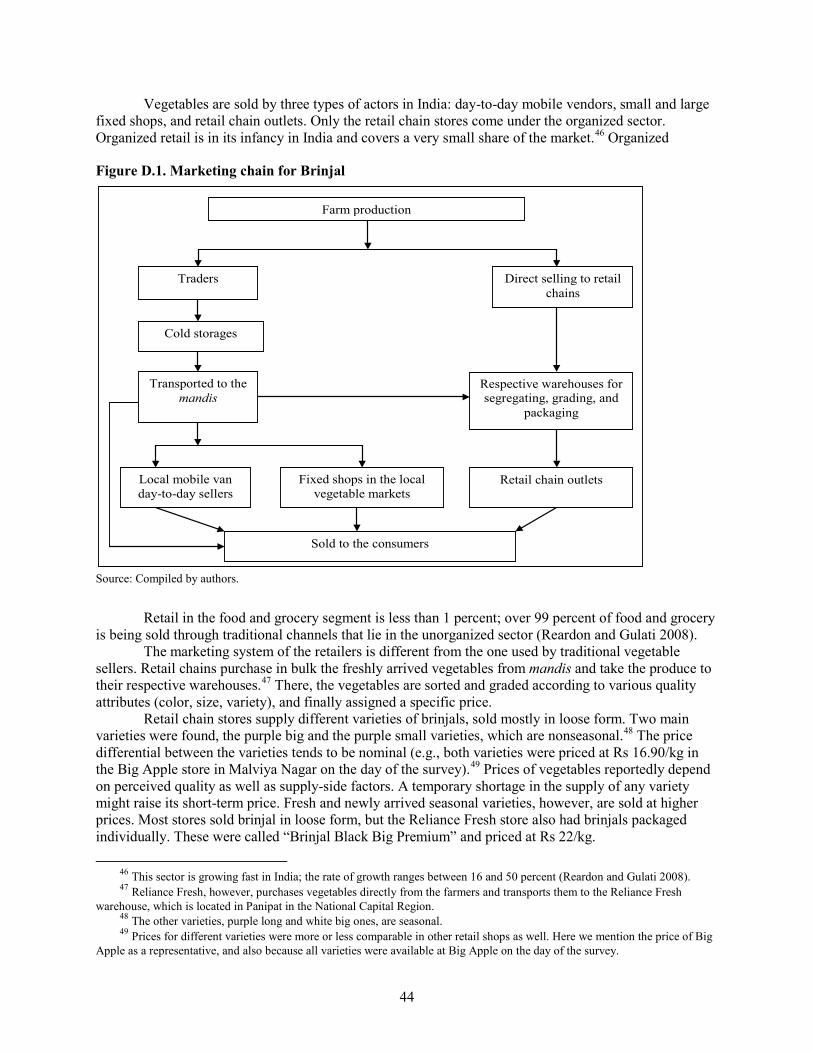
44
Vegetables are sold by three types of actors in India: day-to-day mobile vendors, small and large fixed shops, and retail chain outlets. Only the retail chain stores come under the organized sector. Organized retail is in its infancy in India and covers a very small share of the market.46
Figure D.1. Marketing chain for Brinjal
Organized
Source: Compiled by authors.
Retail in the food and grocery segment is less than 1 percent; over 99 percent of food and grocery is being sold through traditional channels that lie in the unorganized sector (Reardon and Gulati 2008).
The marketing system of the retailers is different from the one used by traditional vegetable sellers. Retail chains purchase in bulk the freshly arrived vegetables from mandis and take the produce to their respective warehouses.47
Retail chain stores supply different varieties of brinjals, sold mostly in loose form. Two main varieties were found, the purple big and the purple small varieties, which are nonseasonal.
There, the vegetables are sorted and graded according to various quality attributes (color, size, variety), and finally assigned a specific price.
48 The price differential between the varieties tends to be nominal (e.g., both varieties were priced at Rs 16.90/kg in the Big Apple store in Malviya Nagar on the day of the survey).49
46 This sector is growing fast in India; the rate of growth ranges between 16 and 50 percent (Reardon and Gulati 2008).
Prices of vegetables reportedly depend on perceived quality as well as supply-side factors. A temporary shortage in the supply of any variety might raise its short-term price. Fresh and newly arrived seasonal varieties, however, are sold at higher prices. Most stores sold brinjal in loose form, but the Reliance Fresh store also had brinjals packaged individually. These were called “Brinjal Black Big Premium” and priced at Rs 22/kg.
47 Reliance Fresh, however, purchases vegetables directly from the farmers and transports them to the Reliance Fresh warehouse, which is located in Panipat in the National Capital Region.
48 The other varieties, purple long and white big ones, are seasonal. 49 Prices for different varieties were more or less comparable in other retail shops as well. Here we mention the price of Big
Apple as a representative, and also because all varieties were available at Big Apple on the day of the survey.
Farm production
Transported to the mandis
Respective warehouses for segregating, grading, and
packaging
Local mobile van day-to-day sellers
Fixed shops in the local vegetable markets
Retail chain outlets
Sold to the consumers
Cold storages
Traders
Direct selling to retail chains
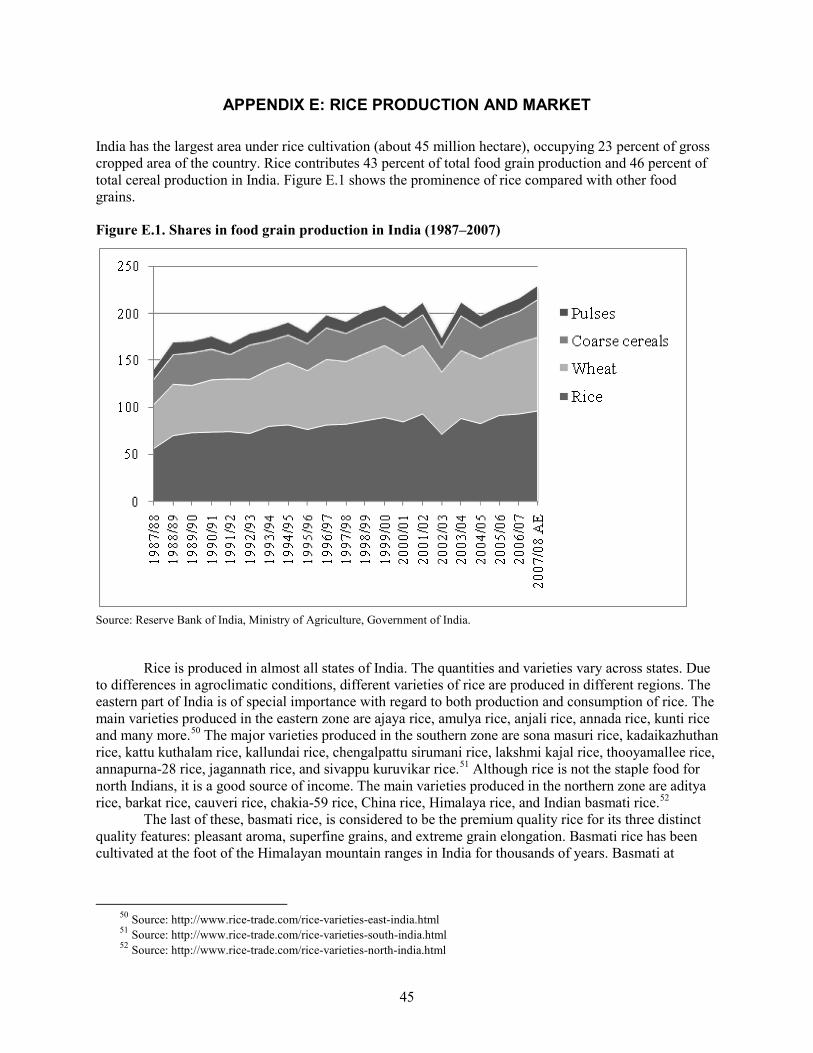
45
APPENDIX E: RICE PRODUCTION AND MARKET
India has the largest area under rice cultivation (about 45 million hectare), occupying 23 percent of gross cropped area of the country. Rice contributes 43 percent of total food grain production and 46 percent of total cereal production in India. Figure E.1 shows the prominence of rice compared with other food grains.
Figure E.1. Shares in food grain production in India (1987–2007)
Source: Reserve Bank of India, Ministry of Agriculture, Government of India.
Rice is produced in almost all states of India. The quantities and varieties vary across states. Due to differences in agroclimatic conditions, different varieties of rice are produced in different regions. The eastern part of India is of special importance with regard to both production and consumption of rice. The main varieties produced in the eastern zone are ajaya rice, amulya rice, anjali rice, annada rice, kunti rice and many more.50 The major varieties produced in the southern zone are sona masuri rice, kadaikazhuthan rice, kattu kuthalam rice, kallundai rice, chengalpattu sirumani rice, lakshmi kajal rice, thooyamallee rice, annapurna-28 rice, jagannath rice, and sivappu kuruvikar rice.51 Although rice is not the staple food for north Indians, it is a good source of income. The main varieties produced in the northern zone are aditya rice, barkat rice, cauveri rice, chakia-59 rice, China rice, Himalaya rice, and Indian basmati rice.52
The last of these, basmati rice, is considered to be the premium quality rice for its three distinct quality features: pleasant aroma, superfine grains, and extreme grain elongation. Basmati rice has been cultivated at the foot of the Himalayan mountain ranges in India for thousands of years. Basmati at
50 Source: http://www.rice-trade.com/rice-varieties-east-india.html 51 Source: http://www.rice-trade.com/rice-varieties-south-india.html 52 Source: http://www.rice-trade.com/rice-varieties-north-india.html
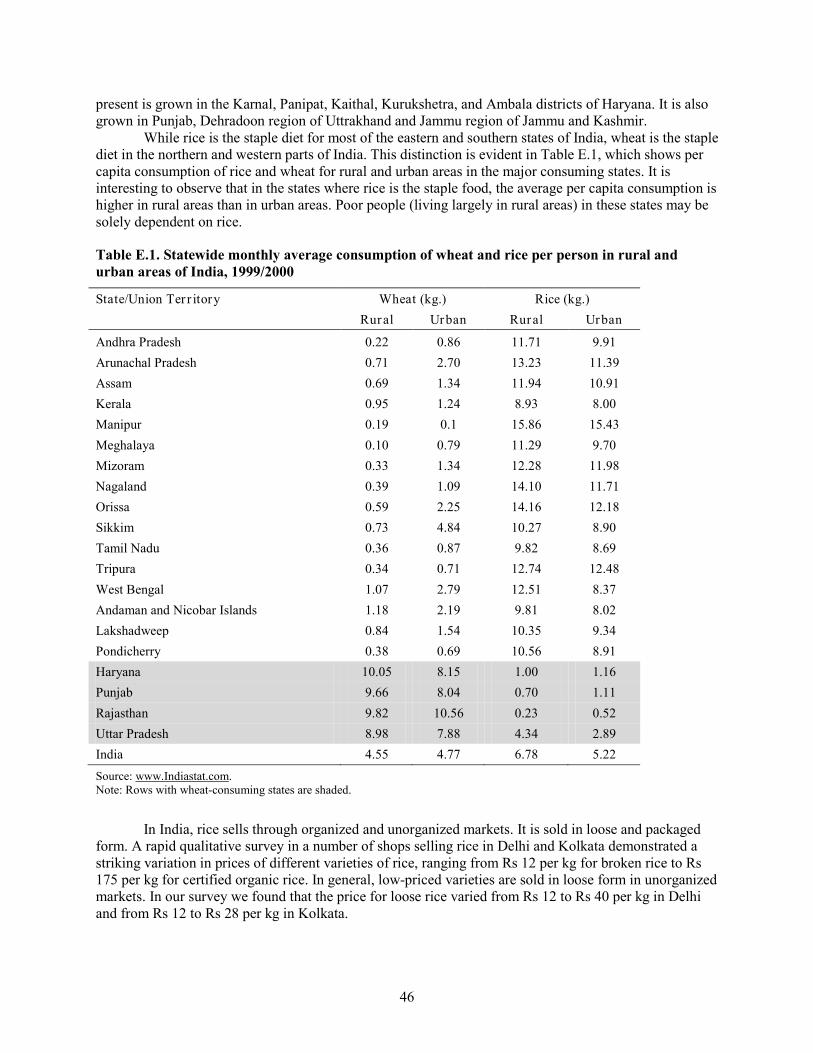
46
present is grown in the Karnal, Panipat, Kaithal, Kurukshetra, and Ambala districts of Haryana. It is also grown in Punjab, Dehradoon region of Uttrakhand and Jammu region of Jammu and Kashmir.
While rice is the staple diet for most of the eastern and southern states of India, wheat is the staple diet in the northern and western parts of India. This distinction is evident in Table E.1, which shows per capita consumption of rice and wheat for rural and urban areas in the major consuming states. It is interesting to observe that in the states where rice is the staple food, the average per capita consumption is higher in rural areas than in urban areas. Poor people (living largely in rural areas) in these states may be solely dependent on rice.
Table E.1. Statewide monthly average consumption of wheat and rice per person in rural and urban areas of India, 1999/2000
State/Union Ter r itory Wheat (kg.) Rice (kg.) Rural Urban Rural Urban
Andhra Pradesh 0.22 0.86 11.71 9.91 Arunachal Pradesh 0.71 2.70 13.23 11.39 Assam 0.69 1.34 11.94 10.91 Kerala 0.95 1.24 8.93 8.00 Manipur 0.19 0.1 15.86 15.43 Meghalaya 0.10 0.79 11.29 9.70 Mizoram 0.33 1.34 12.28 11.98 Nagaland 0.39 1.09 14.10 11.71 Orissa 0.59 2.25 14.16 12.18 Sikkim 0.73 4.84 10.27 8.90 Tamil Nadu 0.36 0.87 9.82 8.69 Tripura 0.34 0.71 12.74 12.48 West Bengal 1.07 2.79 12.51 8.37 Andaman and Nicobar Islands 1.18 2.19 9.81 8.02 Lakshadweep 0.84 1.54 10.35 9.34 Pondicherry 0.38 0.69 10.56 8.91 Haryana 10.05 8.15 1.00 1.16 Punjab 9.66 8.04 0.70 1.11 Rajasthan 9.82 10.56 0.23 0.52 Uttar Pradesh 8.98 7.88 4.34 2.89 India 4.55 4.77 6.78 5.22 Source: www.Indiastat.com. Note: Rows with wheat-consuming states are shaded.
In India, rice sells through organized and unorganized markets. It is sold in loose and packaged form. A rapid qualitative survey in a number of shops selling rice in Delhi and Kolkata demonstrated a striking variation in prices of different varieties of rice, ranging from Rs 12 per kg for broken rice to Rs 175 per kg for certified organic rice. In general, low-priced varieties are sold in loose form in unorganized markets. In our survey we found that the price for loose rice varied from Rs 12 to Rs 40 per kg in Delhi and from Rs 12 to Rs 28 per kg in Kolkata.
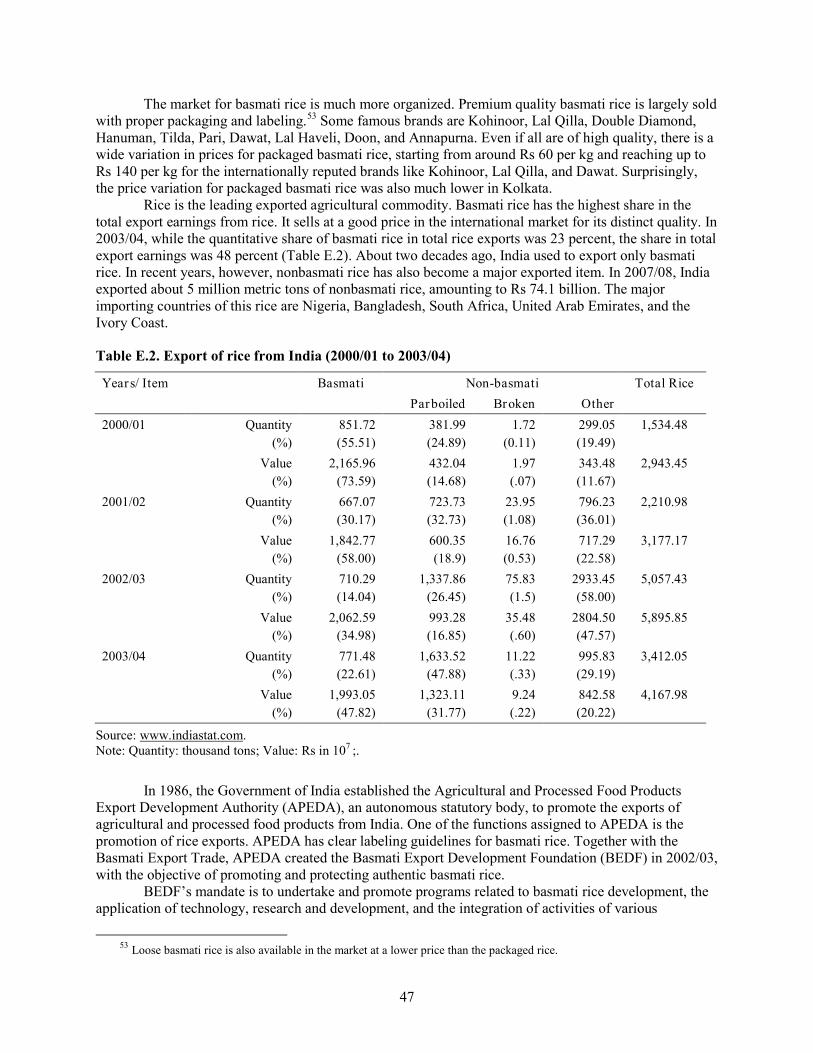
47
The market for basmati rice is much more organized. Premium quality basmati rice is largely sold with proper packaging and labeling.53
Rice is the leading exported agricultural commodity. Basmati rice has the highest share in the total export earnings from rice. It sells at a good price in the international market for its distinct quality. In 2003/04, while the quantitative share of basmati rice in total rice exports was 23 percent, the share in total export earnings was 48 percent (Table E.2). About two decades ago, India used to export only basmati rice. In recent years, however, nonbasmati rice has also become a major exported item. In 2007/08, India exported about 5 million metric tons of nonbasmati rice, amounting to Rs 74.1 billion. The major importing countries of this rice are Nigeria, Bangladesh, South Africa, United Arab Emirates, and the Ivory Coast.
Some famous brands are Kohinoor, Lal Qilla, Double Diamond, Hanuman, Tilda, Pari, Dawat, Lal Haveli, Doon, and Annapurna. Even if all are of high quality, there is a wide variation in prices for packaged basmati rice, starting from around Rs 60 per kg and reaching up to Rs 140 per kg for the internationally reputed brands like Kohinoor, Lal Qilla, and Dawat. Surprisingly, the price variation for packaged basmati rice was also much lower in Kolkata.
Table E.2. Export of rice from India (2000/01 to 2003/04)
Years/ Item Basmati Non-basmati Total Rice
Parboiled Broken Other 2000/01 Quantity
(%) 851.72 (55.51)
381.99 (24.89)
1.72 (0.11)
299.05 (19.49)
1,534.48
Value (%)
2,165.96 (73.59)
432.04 (14.68)
1.97 (.07)
343.48 (11.67)
2,943.45
2001/02 Quantity (%)
667.07 (30.17)
723.73 (32.73)
23.95 (1.08)
796.23 (36.01)
2,210.98
Value (%)
1,842.77 (58.00)
600.35 (18.9)
16.76 (0.53)
717.29 (22.58)
3,177.17
2002/03 Quantity (%)
710.29 (14.04)
1,337.86 (26.45)
75.83 (1.5)
2933.45 (58.00)
5,057.43
Value (%)
2,062.59 (34.98)
993.28 (16.85)
35.48 (.60)
2804.50 (47.57)
5,895.85
2003/04 Quantity (%)
771.48 (22.61)
1,633.52 (47.88)
11.22 (.33)
995.83 (29.19)
3,412.05
Value (%)
1,993.05 (47.82)
1,323.11 (31.77)
9.24 (.22)
842.58 (20.22)
4,167.98
Source: www.indiastat.com. Note: Quantity: thousand tons; Value: Rs in 107 ;.
In 1986, the Government of India established the Agricultural and Processed Food Products Export Development Authority (APEDA), an autonomous statutory body, to promote the exports of agricultural and processed food products from India. One of the functions assigned to APEDA is the promotion of rice exports. APEDA has clear labeling guidelines for basmati rice. Together with the Basmati Export Trade, APEDA created the Basmati Export Development Foundation (BEDF) in 2002/03, with the objective of promoting and protecting authentic basmati rice.
BEDF’s mandate is to undertake and promote programs related to basmati rice development, the application of technology, research and development, and the integration of activities of various
53 Loose basmati rice is also available in the market at a lower price than the packaged rice.
48
stakeholders (such as farmers, millers, traders, and exporters) in the production and marketing chain of authentic basmati rice.
At the initiative of APEDA, the Uttar Pradesh government provided land for the Basmati Research Farm and for the Lab-cum-Office Complex within the precinct of Sardar Vallabhbhai Patel University of Agriculture and Technology at Modipuram, in Meerut. Starting in 2003, these institutions have carried out successful programs to produce high-quality and authentic foundation seeds of basmati varieties at the farm, certified by the Uttar Pradesh State Seed Certification Agency. There is a great demand for the high-quality seeds produced by the Basmati Research Farm of BEDF in all the basmati-growing states. The authentic basmati seed is disseminated to the farmers and sold at a subsidized rate. BEDF has also been undertaking extension services and front-line demonstrations for farmers in the basmati-growing states in kharif season each year. BEDF has state-of-the-art, world-class laboratory facilities for DNA testing and quality testing of basmati rice. These facilities are available to basmati traders at a reasonable cost.54
In India, certified organic rice is also sold through niche outlets. Organic rice is sold at a higher price than conventional basmati rice. On the day of the survey two different types of organic rice were found in Fabindia showroom in Vasant Kunj—organic long-grain white basmati (Rs 175 per kg) and organic long-grain brown basmati (Rs 160 per kg).
54 Source: http://www.apeda.com/apedawebsite/about_apeda/bas_ex_dev_found.htm
49
REFERENCES
Anand, A., R. C. Mittelhammer, and J. J. McCluskey. 2007. Consumer response to information and second-generation genetically modified food in India. Journal of Agricultural & Food Industrial Organization 5, Article 8.
Anand, G. 2007. Overpricing of tiles detected. The Hindu. <http://www.thehindu.com/2007/08/24/stories/2007082462380300.htm> August 24, 2007.
Asian Food Information Centre (AFIC). 2008. Food biotechnology: Consumer perceptions of food biotechnology. Summary of key findings for India. Bangkok, Thailand: Asian Food Information Centre.
Bansal, S., and B. Ramaswami. 2007. The economics of GM food labels: An evaluation of mandatory labeling proposals in India. IFPRI Discussion Paper 00704. Washington, D.C.: International Food Policy Research Institute.
Bansal, B., S. Chakravarty, and B. Ramaswami. 2008. Mandatory labeling and aversion to GM foods. Experimental evidence from India. Donor report.
Carter, C. A., and G. P. Gruere. 2003a. International approaches to the labeling of genetically modified food. Choice Second Quarter 2003. <http://www.choicemagazine.org>
Carter, C. A., and G. P. Gruere. 2003b. Mandatory labeling of genetically modified food: Does it really provide consumer choice? AgBioForum 6 (1&2): 68–70.
Central Organisation for Oil Industry & Trade (COOIT). 2009. Estimated production of vegetable oils in India. <http://www.cooit.org/index.php?option=com_content&view=article&id=152:estimated-production-of-vegetable-oils-in-india&catid=59:statistics&Itemid=107> Accessed March 19, 2009.
Chong, M. 2005. Perception of the risks and benefits of Bt eggplant by Indian farmers. Journal of Risk Research 8 (7–8): 617–634
Cloutier, M. 2006. Etude Economique sur les Coûts Relatifs à l’Etiquetage Obligatoire des Filières Génétiquement Modifiées (GM) versus non–GM au Niveau Québécois. [Economic survey on the costs relating to mandatory labeling of the genetically modified (GM) versus non–GM at the Quebec level]. Report presented to the Ministère de l’Agriculture des Pêcheries et de l’Alimentation du Québec. University of Québec in Montréal, Department of Management and Technology.
De Leon, A., A. Manalo, and F. C. Guilatco. 2004. The cost implications of GM food labeling in the Philippines. Manila: The Philippine Bureau of Food and Drugs.
Deodhar, S. Y., S. Ganesh, and W. S. Chern. 2007. Emerging markets for GM foods: An Indian perspective on consumer understanding and willingness to pay. IIMA Working Paper No. 2007-06-08. Ahmedabad, India: Indian Institute of Management Ahmedabad (IIMA).
Desquilbet, M., and D. Bullock. 2009. Who pays the costs of non-GMO segregation and identity preservation? American Journal of Agricultural Economics 91 (3): 656–672.
Dohlman, E., S. Persaud, and R. Landes. 2003. India’s edible oil sector: Imports fill rising demand. Electronic Outlook Report OCS-0903-01. November 2003. Washington, D.C.: United States Department of Agriculture, Economic Research Service (USDA-ERS).
Financial Express. 2008. Protest against GM crops in Delhi. May 6, 2008.
Ghosh, L. 2008. Coming soon to your table: Modified brinjal. Daily News & Analysis (DNA), August 31, 2008.
Gruere, G. P. 2009. Asynchronous approvals of GM products, price inflation, and the codex annex: What low level presence policy for APEC countries? Conference paper presented at the summer symposium of the International Agricultural Trade Research Consortium in Seattle. <http://iatrc.software.umn.edu/activities/symposia/2009Seattle/seattle-Gruere.pdf> June 2009.
Gruere, G. P., C. A. Carter, and Y. H. Farzin. 2008. What labeling policy for consumer choice? The case of genetically modified food in Canada and Europe. Canadian Journal of Economics 41 (4): 1472–1497.
50
Gruere, G. P., P. Mehta-Bhatt, and D. Sengupta. 2008. Bt cotton and farmer suicides in India: Reviewing the evidence. IFPRI Discussion Paper N. 808. Washington, D.C.: International Food Policy Research Institute.
Gruere, G., and S. R. Rao. 2007. A review of international labeling policies of genetically modified food to evaluate India’s proposed rule. AgBioForum 10 (1): 51–64.
Gruere, G, and D. Sengupta. 2009. The effects of GM-free private standards on biosafety policymaking in developing countries. Food Policy 34 (5): 399–406.
Hindu, The. 2005. Ban on beer without expiry data label. The Hindu. <http://www.thehindu.com/2005/01/10/stories/2005011012240300.htm> January 9, 2005.
Indian Agribusiness Systems Limited (IASL), 2002. Determinants of U.S. soybean oil demand and U.S. market share in India. January 2002. New Delhi, India: IASL.
International Food Policy Research Institute (IFPRI). 2007. Economic considerations of biosafety and biotechnology regulations in India. Conference proceedings. New Delhi, India. Washington, D.C.: IFPRI and New Delhi: RIS. <http://www.ifpri.org/pubs/books/IndiaProc/IndiaProc.pdf> August 25–26, 2007.
Jaeger, W. K. 2002. Economics issues and Oregon ballot measure 27: Labeling of genetically modified foods (EM 8817). Corvallis, Oregon: Oregon State University.
James, C. 2008. Global status of commercialized biotech/GM crops: 2008. (ISAAA Briefs No 39). Ithaca NY: International Service for the Acquisition of Agri-biotech Applications (ISAAA).
Karvy Comtrade Ltd. 2006. GM food labeling. Likely impacts on the prices of vegetable oils in India. <www.sanwariaagro.com/GM%20labelling.pdf>
Kishtwaria, J., A. Sharma, N. Vyas, and S. Sharma. 2004. Consumer awareness regarding legislation organisations and consumer protection laws. Journal of Social Sciences 8 (1): 69–72.
KPMG International. 2000a. Potential costs of mandatory labeling of food products derived from biotechnology in Canada. Ottawa: KPMG Consulting.
KPMG International. 2000b. Report on the costs of labeling genetically modified foods. Canberra: KPMG Consulting.
Krishna, V. V., and M. Qaim. 2008. Consumer attitudes toward gm food and pesticide residues in India. Review of Agricultural Economics 30 (2): 233–251.
Lin, W., F. Tuan, Y. Dai, F. Zhong, and X. Chen. 2008. Does biotech labeling affect consumers’ purchasing decisions? A case study of vegetable oils in Nanjing, China. AgBioForum 11 (2): 123–133.
Lokesh, M and R. K. Bandrapalli. 2006. Marketing potential of coastal agricultural produce: A case study of Saurashtra, Gujarat, report submitted to Coastal Salinity Prevention Cell, Rajkot in 2006.
Low, B. 2006. Interview: India may not change veg oil duties in budget. Dow Jones Newswires. February 23, 2006.
Lusk, J. L., M. Jamal, L. Kurlander, M. Roucan, and L. Taulman. 2005. A meta-analysis of genetically modified food valuation studies. Journal of Agricultural and Resource Economics 30: 28–44.
Mishra, S. 2006. Legally modified. Government of India plans for GM food labelling in India. Down to Earth. <http://www.downtoearth.org.in/full6.asp?foldername=20060430&filename=news&sec_id=4&sid=3> April 19, 2006.
National Economic Research Associates (NERA). 2001. Economic appraisal of options for extension of legislation on GM labeling: A final report for the Foods Standards Agency of the United Kingdom.
Noussair, C., S. Robin, and B. Ruffieux. 2004. Do consumers really refuse to buy genetically modified food? The Economic Journal 114 (1): 102–120.
Reardon, T., and A. Gulati. 2008. The rise of supermarkets and their development implications. International experience relevant for India. IFPRI Discussion paper N.752. Washington, D.C.: International Food Policy Research Institute. < http://www.ifpri.org/pubs/dp/ifpridp00752.asp>
51
Red Orbit. 2008. Imported food products reportedly come under scanner for defying PFA Act. <http://www.redorbit.com/news/display/?id=1346062> April 17, 2008.
Rice Trade B2B Marketplace. 2009. Data on rice trade by varieties. <http://www.rice-trade.com/> Accessed December 2008.
Smale, M., P. Zambrano, G. Gruere, J. Falck-Zepeda, I. Matuschke, D. Horna, L. Nagarajan, I. Yrremaredy, and H. Jones. 2009. Impacts of transgenic crops in developing countries during the first decade: Approaches, findings, and future directions. IFPRI Food Policy Review 10. Washington D.C.: International Food Policy Research Institute.
Srinivasan, P. V. 2005. Impact of trade liberalization on India’s oilseed and edible oils sector. Report prepared for IGIDR-ERS/USDA Project: Indian Agricultural Markets and Policy.
United States Department of Agriculture Foreign Agricultural Service (USDA-FAS). 1998. Counselor and attaché reports. Official Statistics, Cotton, Oilseeds, Tobacco and Seeds Division. Washington, D.C.: USDA. <http://www.fas.usda.gov/oilseeds/circular/1998/98-12/table16.pdf> December 1998.
United States Department of Agriculture Foreign Agricultural Service (USDA-FAS). 2000. Counselor and attaché reports, Official Statistics, Cotton, Oilseeds, Tobacco and Seeds Division. Washington, D.C.: USDA. <http://www.fas.usda.gov/oilseeds/circular/2000/00-12/table15.pdf> December 2000.
United States Department of Agriculture Foreign Agricultural Service (USDA-FAS), 2004. Oilseeds: World markets and trade circular series FOP 12-04. Washington, D.C.: USDA. <http://www.fas.usda.gov/oilseeds/circular/2004/04-12/FULL.pdf> December 2004.
United States Department of Agriculture Foreign Agricultural Service (USDA-FAS), 2008. Oilseeds: World markets and trade circular series FOP 11-08. Washington, D.C.: USDA. <http://www.fas.usda.gov/oilseeds/circular/2008/Nov/oilseedsfull1108.pdf> November 2008.

RECENT IFPRI DISCUSSION PAPERS
For earlier discussion papers, please go to www.ifpri.org/pubs/pubs.htm#dp. All discussion papers can be downloaded free of charge.
945. Toward a typology of food security in developing countries. Bingxin Yu, Liangzhi You, and Shenggen Fan, 2010.
944. Paving the way for development? The impact of transport infrastructure on agricultural production and poverty reduction in the Democratic Republic of Congo. John Ulimwengu, Jose Funes, Derek Headey, and Liangzhi You, 2009.
943. Formal–informal economy linkages and unemployment in South Africa. Rob Davies and James Thurlow, 2009.
942. Recent food prices movements: A time series analysis. Bryce Cooke and Miguel Robles, 2009.
941. Decentralization, agricultural services and determinants of input use in Nigeria. Kamiljon T. Akramov, 2009.
940. How important are peer effects in group lending? Estimating a static game of incomplete information. Shanjun Li, Yanyan Liu, and Klaus Deininger, 2009.
939. Rice production responses in Cambodia. Bingxin Yu and Shenggen Fan, 2009.
938. A latent class approach to investigating consumer demand for genetically modified staple food in a developing country: The case of gm bananas in Uganda. Enoch Kikulwe, Ekin Birol, Justus Wesseler, and José Falck-Zepeda, 2009.
937. Cluster-based industrialization in China: Financing and performance. Cheryl Long and Xiaobo Zhang, 2009.
936. Sensitivity of welfare effects estimated by equilibrium displacement model: A biological productivity growth for semisubsistence crops in Sub-Sahara African market with high transaction costs. Hiroyuki Takeshima, 2009.
935. Assessing household vulnerability to climate change: The case of farmers in the Nile Basin of Ethiopia. Temesgen T. Deressa, Rashid M. Hassan, and Claudia Ringler, 2009.
934. Do external grants to district governments discourage own-revenue generation?: A look at local public finance dynamics in Ghana. Tewodaj Mogues, Samuel Benin, and Godsway Cudjoe, 2009.
933. Impacts of prenatal and environmental factors on child growth: Evidence from Indonesia. Futoshi Yamauchi, Katsuhiko Higuchi, and Rita Nur Suhaeti, 2009.
932. Rich consumers and poor producers: Quality and rent distribution in global value chains. Johan F.M. Swinnen and Anneleen Vandeplas, 2009.
931. Economic growth and distribution of income: A Growth model to fit Ghanaian data. Harumi T. Nelson , Terry L. Roe, and Xinshen Diao, 2009.
930. Trade liberalization, poverty, and food security in India. Manoj Panda and A. Ganesh-Kumar, 2009.
929. Improving the proof: Evolution of and emerging trends in impact assessment methods and approaches in agricultural development. Mywish K. Maredia, 2009.
928. Improving diet quality and micronutrient nutrition: Homestead food production in Bangladesh. Lora Iannotti, Kenda Cunningham, and Marie Ruel, 2009.
927. Land-tenure policy reforms: Decollectivization and the Doi Moi System in Vietnam. Michael Kirk and Tuan Nguyen, 2009.
926. “Crossing the river while feeling the rocks:” Incremental land reform and its impact on rural welfare in China. John W. Bruce and Zongmin Li, 2009.
925. Rich food for poor people: Genetically improved tilapia in the Philippines. Sivan Yosef, 2009.
924 .Rural and urban linkages: Operation Flood’s role in India’s dairy development. Kenda Cunningham, 2009.
923. The global effort to eradicate rinderpest. Peter Roeder and Karl Rich, 2009.
922. The mungbean transformation: Diversifying crops, defeating malnutrition. Subramanyan Shanmugasundaram, J. D. H. Keatinge, and Jacqueline d’Arros Hughes, 2009.
921. Private sector responses to public investments and policy reforms: The case of fertilizer and maize market development in Kenya. Joshua Ariga and T. S. Jayne, 2009.
INTERNATIONAL FOOD POLICY RESEARCH INSTITUTE
www.ifpri.org
IFPRI HEADQUARTERS
2033 K Street, NW Washington, DC 20006-1002 USA Tel.: +1-202-862-5600 Fax: +1-202-467-4439 Email: [email protected]
IFPRI ADDIS ABABA
P. O. Box 5689 Addis Ababa, Ethiopia Tel.: +251 11 6463215 Fax: +251 11 6462927 Email: [email protected]
IFPRI NEW DELHI
CG Block, NASC Complex, PUSA New Delhi 110-012 India Tel.: 91 11 2584-6565 Fax: 91 11 2584-8008 / 2584-6572 Email: [email protected]