labmanual - new mexico state university
TRANSCRIPT

2015/2016(http://astronomy.nmsu.edu/astro/Ast110Fall2015.pdf)
1

2

Contents
1 Introduction to the Astronomy 110 Labs 5
2 The Origin of the Seasons 21
3 The Surface of the Moon 41
4 Shaping Surfaces in the Solar System: The Impacts of Comets andAsteroids 55
5 Introduction to the Geology of the Terrestrial Planets 69
6 Kepler’s Laws and Gravitation 87
7 The Orbit of Mercury 107
8 Measuring Distances Using Parallax 121
9 Optics 135
10 The Power of Light: Understanding Spectroscopy 151
11 Our Sun 169
12 The Hertzsprung-Russell Diagram 187
3

13 Mapping the Galaxy 203
14 Galaxy Morphology 219
15 How Many Galaxies Are There in the Universe? 241
16 Hubble’s Law: Finding the Age of the Universe 255
17 World-Wide Web (Extra-credit/Make-up) Exercise 269
A Fundamental Quantities 271
B Accuracy and Significant Digits 273
C Unit Conversions 274
D Uncertainties and Errors 276
4

Name:
Lab 1
Introduction to the Astronomy 110Labs
1.1 Introduction
Astronomy is a physical science. Just like biology, chemistry, geology, and physics, as-tronomers collect data, analyze that data, attempt to understand the object/subjectthey are looking at, and submit their results for publication. Along the way as-tronomers use all of the mathematical techniques and physics necessary to understandthe objects they examine. Thus, just like any other science, a large number of math-ematical tools and concepts are needed to perform astronomical research. In today’sintroductory lab, you will review and learn some of the most basic concepts neces-sary to enable you to successfully complete the various laboratory exercises you willencounter later this semester. When needed, the weekly laboratory exercise you areperforming will refer back to the examples in this introduction—so keep the workedexamples you will do today with you at all times during the semester to use as a refer-ence when you run into these exercises later this semester (in fact, on some occasionsyour TA might have you redo one of the sections of this lab for review purposes).
1.2 The Metric System
Like all other scientists, astronomers use the metric system. The metric system isbased on powers of 10, and has a set of measurement units analogous to the Englishsystem we use in everyday life here in the US. In the metric system the main unitof length (or distance) is the meter, the unit of mass is the kilogram, and the unit
5

of liquid volume is the liter. A meter is approximately 40 inches, or about 4” longerthan the yard. Thus, 100 meters is about 111 yards. A liter is slightly larger than aquart (1.0 liter = 1.101 qt). On the Earth’s surface, a kilogram = 2.2 pounds. In theAstronomy 110 labs you will mostly encounter units of length/distance (variations onthe meter).
As you have almost certainly learned, the metric system uses prefixes to change scale.For example, one thousand meters is one “kilometer”. One thousandth of a meter isa “millimeter”. The prefixes that you will encounter in this class are listed in Table1.
Table 1: Metric System PrefixesPrefix Name Prefix Symbol Prefix Value
Giga G 1,000,000,000 (one billion)Mega M 1,000,000 (one million)kilo k 1,000 (one thousand)centi c 0.01 (one hundredth)milli m 0.001 (one thousandth)micro µ 0.0000001 (one millionth)nano n 0.0000000001 (one billionth)
In the metric system 3,600 meters is equal to 3.6 kilometers; while 0.8 meter is equalto 80 centimeters, which in turn equals 800 millimeters, etc. In the lab exercises thissemester we will encounter a large range in sizes and distances. For example, youwill measure the sizes of some objects/things in class in millimeters, talk about thewavelength of spectral lines in nanometers, and measure the sizes of features on theSun that are larger than 100,000 kilometers.
1.2.1 Beyond the Metric System
When we talk about the sizes or distances to those objects beyond the surface of theEarth, we begin to encounter very large numbers. For example, the average distancefrom the Earth to the Moon is 384,000,000 meters or 384,000 kilometers (km). Thedistances found in astronomy are usually so large that we have to switch to a unitof measurement that is much larger than the meter, or even the kilometer. In andaround the solar system, astronomers use “Astronomical Units”. An AstronomicalUnit is the mean distance between the Earth and the Sun. One Astronomical Unit(AU) = 149,600,000 km. For example, Jupiter is about 5 AU from the Sun, whilePluto’s average distance from the Sun is 39 AU. With this change in units, it is easyto talk about the distance to other planets. It is more convenient to say that Saturnis 9.54 AU away than it is to say that Saturn is 1,427,184,000 km from Earth.
6

When we talk about how far away the stars are in our own Milky Way galaxy, we haveto switch to an even larger unit of distance to keep the numbers manageable. Onesuch unit is the “light year”. A light year (ly) is the distance light travels in one year.The speed of light is enormous: 300,000 kilometers per second (km/s) or 186,000 milesper second. Since one year contains 31,536,000 seconds, one ly = 9,460,000,000,000km! The nearest star, Alpha Centauri, is 4.2 ly away. The Milky Way galaxy is morethan 150,000 light years across. The nearest galaxy with a size similar to that ofthe Milky Way, the Andromeda Galaxy (see the sky chart for November online athttp://astronomy.nmsu.edu/tharriso/skycharts.html for a picture and description ofthe Andromeda galaxy), is 2.2 million light years away!
In the Parallax lab we will introduce the somewhat odd unit of “parsecs”. For now,we will simply state that one parsec (“pc”) = 3.26 ly. Thus, Alpha Centauri is 1.28pc away. During the semester you will frequently hear the term parsec, kiloparsec(1 thousand pc), Megaparsec (1 million pc), and even the term Gigaparsec (1 billionpc). Astronomers have borrowed the prefixes from the metric system to constructtheir own shorthand way of describing extremely large distances. The AndromedaGalaxy is at a distance of 700,000 pc = 0.7 Megaparsecs (“Mpc”).
1.2.2 Changing Units and Scale Conversion
Changing units (like those in the previous paragraph) and/or scale conversion is some-thing you must master during this semester. The concept is fairly straightforward,so let’s just work some examples.
1. Convert 34 meters into centimeters
Answer: Since one meter = 100 centimeters, 34 meters = 3,400 centimeters.
2. Convert 34 kilometers into meters:
3. If one meter equals 40 inches, how many meters are there in 400 inches?
4. How many centimeters are there in 400 inches?
5. How many parsecs are there in 1.4 Mpc?
6. How many AU are there in 299,200,000 km?
7

One technique that you will use this semester involves measuring a photograph orimage with a ruler, and converting the measured number into a real unit of size (ordistance). One example of this technique is reading a road map. In the next figureis a map of the state of New Mexico. Down at the bottom left hand corner is a scalein Miles and Kilometers.
Figure 1.1: A map of New Mexico
Map Exercises (using a ruler determine):
1) How many kilometers is it from Las Cruces to Albuquerque?
8

2) What is the distance in miles from the border with Arizona to the border withTexas if you were to drive along I40?
3) If you were to drive 100 km/hr (kph), how long would it take you to go from LasCruces to Albuquerque?
4) If one mile = 1.6 km, how many miles per hour (mph) is 100 kph?
1.3 Squares, Square Roots, and Exponents
In several of the labs this semester you will encounter squares, cubes, and squareroots. Let us briefly review what is meant by such terms as squares, cubes, squareroots and exponents. The square of a number is simply that number times itself: 3× 3 = 32 = 9. The exponent is the little number “2” above the three. 52 = 5 × 5= 25. The exponent tells you how many times to multiply that number by itself: 84
= 8 × 8 × 8 × 8 = 4096. The square of a number simply means the exponent is 2(three squared = 32), and the cube of a number means the exponent is three (fourcubed = 43). Here are some examples:
1) 72 = 7 × 7 = 49
2) 75 = 7 × 7 × 7 × 7 × 7 = 16,807
3) The cube of 9 = 93 = 9 × 9 × 9 = 729
4) The exponent of 1216 is 16
5) 2.563 = 2.56 × 2.56 × 2.56 = 16.777
Your turn:
7) 63 =
8) 44 =
9) 3.12 =
9

The concept of a square root is easy to understand, but is much harder to calculate(we usually have to use a calculator). The square root of a number is that numberwhose square is the number: the square root of 4 = 2 because 2 × 2 = 4. The squareroot of 9 is 3 (9 = 3 × 3). The mathematical operation of a square root is usuallyrepresented by the symbol “
√”, as in
√9 = 3. But mathematicians also represent
square roots using a fractional exponent of one half: 91/2 = 3. Likewise, the cuberoot of a number is represented as 271/3 = 3 (3 × 3 × 3 = 27). The fourth rootis written as 161/4 (= 2), and so on. We will encounter square roots in the algebrasection shortly. Here are some examples/problems:
1)√100 = 10
2) 10.53 = 10.5 × 10.5 × 10.5 = 1157.625
3) Verify that the square root of 17 (√17 = 171/2) = 4.123
1.4 Scientific Notation
The range in numbers encountered in Astronomy is enormous: from the size of sub-atomic particles, to the size of the entire universe. You are certainly comfortablewith numbers like ten, one hundred, three thousand, ten million, a billion, or even atrillion. But what about a number like one million trillion? Or, four thousand onehundred and fifty six million billion? Such numbers are too cumbersome to handlewith words. Scientists use something called “Scientific Notation” as a short handmethod to represent very large and very small numbers. The system of scientific no-tation is based on the number 10. For example, the number 100 = 10 × 10 = 102. Inscientific notation the number 100 is written as 1.0 × 10². Here are some additionalexamples:
Ten = 10 = 1 × 10 = 1.0 × 101
One hundred = 100 = 10 × 10 = 102 = 1.0 × 10²
One thousand = 1,000 = 10 × 10 × 10 = 103 = 1.0 × 10³
One million = 1,000,000 = 10 × 10 × 10 × 10 × 10 × 10 = 106 = 1.0 ×10⁶
Ok, so writing powers of ten is easy, but how do we write 6,563 in scientific notation?6,563 = 6563.0 = 6.563 × 10³. To figure out the exponent on the power of ten, wesimply count-up the numbers to the left of the decimal point, but do not include theleft-most number. Here are some other examples:
10
1,216 = 1216.0 = 1.216 × 10³
8,735,000 = 8735000.0 = 8.735000 × 10⁶
1,345,999,123,456 = 1345999123456.0 = 1.345999123456 × 10¹²
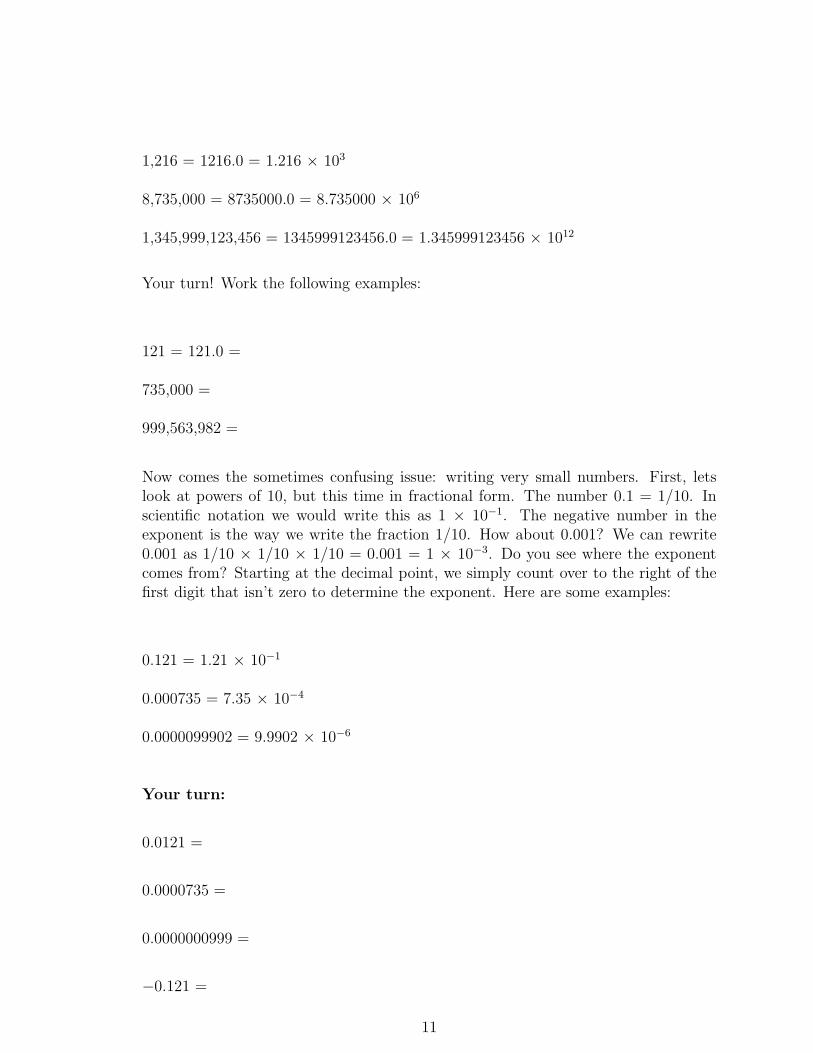
Your turn! Work the following examples:
121 = 121.0 =
735,000 =
999,563,982 =
Now comes the sometimes confusing issue: writing very small numbers. First, letslook at powers of 10, but this time in fractional form. The number 0.1 = 1/10. Inscientific notation we would write this as 1 × 10⁻¹. The negative number in theexponent is the way we write the fraction 1/10. How about 0.001? We can rewrite0.001 as 1/10 × 1/10 × 1/10 = 0.001 = 1 × 10⁻³. Do you see where the exponentcomes from? Starting at the decimal point, we simply count over to the right of thefirst digit that isn’t zero to determine the exponent. Here are some examples:
0.121 = 1.21 × 10⁻¹
0.000735 = 7.35 × 10⁻⁴
0.0000099902 = 9.9902 × 10⁻⁶
Your turn:
0.0121 =
0.0000735 =
0.0000000999 =
−0.121 =
11

There is one issue we haven’t dealt with, and that is when to write numbers inscientific notation. It is kind of silly to write the number 23.7 as 2.37 × 101, or 0.5as 5.0 × 10⁻¹. You use scientific notation when it is a more compact way to write anumber to insure that its value is quickly and easily communicated to someone else.For example, if you tell someone the answer for some measurement is 0.0033 meter,the person receiving that information has to count over the zeros to figure out whatthat means. It is better to say that the measurement was 3.3 × 10⁻³ meter. Buttelling someone the answer is 215 kg, is much easier than saying 2.15 × 10² kg. Itis common practice that numbers bigger than 10,000 or smaller than 0.01 are bestwritten in scientific notation.
How do we multiply and divide two numbers in Scientific Notation? It is a three stepprocess: 1) multiply (divide) the numbers out front, 2) add (subtract) the exponents,and 3) reconstruct the number in Scientific Notation. It is easier to just show someexamples:
(2 × 104) × (3 × 105) = (2 × 3) × 10(4+5) = 6 × 10⁹
(2.00 × 104) × (3.15 × 107) = (2.00 × 3.15) × 10(4+7) = 6.30 × 10¹¹
(2 × 104) × (6 × 105) = (2 × 6) × 10(4+5) = 12 × 109 = 1.2 × 10¹⁰
(6 × 10⁴) ÷ (3 × 10⁸) = (6 ÷ 3) × 10(4−8) = 2 × 10⁻⁴
(3.0 × 10⁴) ÷ (6.0 × 10⁸) = (3.0 ÷ 6.0) × 10(4−8) = 0.5 × 10−4 = 5.0 × 10⁻⁵
Your turn:
(6 × 103) × (3 × 102) =
(8.0 × 10¹⁸) ÷ (4.0 × 10¹⁴) =
Note how we rewrite the exponent to handle cases where the number out front isgreater than 10, or less than 1.
1.5 Algebra
Because this is a freshman laboratory, we do not use high-level mathematics. But wedo sometimes encounter a little basic algebra and we need to briefly review the main
12

concepts. Algebra deals with equations and “unknowns”. Unknowns, or “variables”,are usually represented as a letter in an equation: y = 3x + 7. In this equation both“x” and “y” are variables. You do not know what the value of y is until you assign avalue to x. For example, if x = 2, then y = 13 (y = 3×2 + 7 = 13). Here are someadditional examples:
y = 5x + 3, if x=1, what is y? Answer: y = 5×1 + 3 = 5 + 3 = 8
q = 3t + 9, if t=5, what is q? Answer: q = 3×5 + 9 = 15 + 9 = 24
y = 5x2 + 3, if x=2, what is y? Answer: y = 5×(22) + 3 = 5×4 + 3 = 20 + 3 = 23
What is y if x = 6 in this equation: y = 3x + 13 =
These problems were probably easy for you, but what happens when you have thisequation: y = 7x + 14, and you are asked to figure out what x is if y = 21? Let’s dothis step by step, first we re-write the equation:
y = 7x + 14
We now substitute the value of y (y = 21) into the equation:
21 = 7x + 14
Now, if we could get rid of that 14 we could solve this equation! Subtract 14 fromboth sides of the equation:
21 − 14 = 7x + 14 − 14 (this gets rid of that pesky 14!)
7 = 7x (divide both sides by 7)
x = 1
Ok, your turn: If you have the equation y = 4x + 16, and y = 8, what is x?
We frequently encounter more complicated equations, such as y= 3x2 + 2x − 345, orp2 = a3. There are ways to solve such equations, but that is beyond the scope of ourintroduction. However, you do need to be able to solve equations like this: y2 = 3x+ 3 (if you are told what “x” is!). Let’s do this for x = 11:
13

Copy down the equation again:
y2 = 3x + 3
Substitute x = 11:
y2 = 3×11 + 3 = 33 + 3 = 36
Take the square root of both sides:
(y2)1/2 = (36)1/2
y = 6
Did that make sense? To get rid of the square of a variable you have to take thesquare root: (y2)1/2 = y. So to solve for y2, we took the square root of both sides ofthe equation.
1.6 Graphing and/or Plotting
The last subject we want to discuss is graphing data, and the equation of a line. Youprobably learned in high school about making graphs. Astronomers frequently usegraphs to plot data. You have probably seen all sorts of graphs, such as the plotof the performance of the stock market shown in the next figure (1.2). A plot likethis shows the history of the stock market versus time. The “x” (horizontal) axisrepresents time, and the “y” (vertical) axis represents the value of the stock market.Each place on the curve that shows the performance of the stock market is representedby two numbers, the date (x axis), and the value of the index (y axis). For example,on May 10 of 2004, the Dow Jones index stood at 10,000.
Plots like this require two data points to represent each point on the curve or in theplot. For comparing the stock market you need to plot the value of the stocks versusthe date. We call data of this type an “ordered pair”. Each data point requires avalue for x (the date) and y (the value of the Dow Jones index). In the next tableis the data for how the temperature changes with altitude near the Earth’s surface.As you climb in altitude the temperature goes down (this is why high mountains canhave snow on them year round, even though they are located in warm areas). Thedata in this table is plotted in the next figure.
14

Figure 1.2: The change in the Dow Jones stock index over one year (from April 2003to July 2004).
15

Temperature vs. AltitudeAltitude Temperature(feet) oF0 59.0
2,000 51.94,000 44.76,000 37.68,000 30.510,000 23.312,000 16.214,000 9.116,000 1.9
Looking at the plot of temperature versus altitude, we see that a straight line can bedrawn through the data points. We can figure out the equation of this straight lineand then predict the temperature at any altitude. In high school you learned thatthe equation of a line was y = mx + b, where “m” is the “slope” of the line, and “b”is the “y intercept”. The y intercept is simply where the line crosses the y-axis. Inthe plot, the y intercept is at 59.0, so b = 59. So, we can rewrite the equation forthis line as y = mx + 59.0. How can we figure out m? Simple, pick any other datapoint and solve the equation–let’s choose the data at 10,000 feet. The temperature(y) is 23.3 at 10,000 feet (= x): 23.3 = 10000m + 59. Subtracting 59 from both sidesshows 23.3 − 59 = 10000x + 59 − 59, or −35.7 = 10000m. To find m we simplydivide both sides by 10,000: m = −35.7/10000 = −0.00357. In scientific notation,the equation for the temperature vs. altitude is y = −3.57×10⁻³x + 59.0. Why is theslope negative? What is happening here? As you go up in altitude, the temperaturegoes down. Increasing the altitude (x) decreases the temperature (y). Thus, the slopehas to be negative.
Using the equation for temperature versus altitude just derived, what is thetemperature at 20,000 feet?
Ok, your turn. On the blank sheet of graph paper in Figure 1.4 plot the equation y= 2x + 2 for x = 1, 2, 3, and x = −1, −2, and −3. What is the y intercept of thisline? What is its slope?
While straight lines and perfect data show up in science from time to time, it is actu-ally quite rare for real data to fit perfectly on top of a line. One reason for this is thatall measurements have error. So, even though there might be a perfect relationshipbetween x and y, the noise of the measurements introduces small deviations from theline. In other cases, the data are approximated by a line. This is sometimes calleda best-fit relationship for the data. An example of a plot with real data is shownin Figure 1.5. In this case, the data suggest that there is a general trend between
16

Figure 1.3: The change in temperature as you climb in altitude with the data fromthe preceding table. At sea level (0 ft altitude) the surface temperature is 59oF. Asyou go higher in altitude, the temperature goes down.
the absolute magnitude (MV) and the Orbital Period in certain types of binary stars.But some other factor plays a role in determining the final relationship, so some starsdo not fit very well, and hence their absolute magnitudes cannot be estimated verywell from their orbital periods (the vertical bars associated with each data point areerror bars, and represent the measurement error).
17

+x-x
+y
-y
Figure 1.4: Graph paper for plotting the equation y = 2x + 2.
18

0 2 4 6 86
5
4
3
2
Figure 1.5: The relationship between absolute visual magnitude (MV) and OrbitalPeriod for cataclysmic variable binary stars.
19

20

Name:
Lab 2
The Origin of the Seasons
2.1 Introduction
The origin of the science of Astronomy owes much to the need of ancient peoplesto have a practical system that allowed them to predict the seasons. It is criticalto plant your crops at the right time of the year—too early and the seeds may notgerminate because it is too cold, or there is insufficient moisture. Plant too late andit may become too hot and dry for a sensitive seedling to survive. In ancient Egypt,they needed to wait for the Nile to flood. The Nile river would flood every July, oncethe rains began to fall in Central Africa.
Thus, the need to keep track of the annual cycle arose with the development ofagriculture, and this required an understanding of the motion of objects in the sky.The first devices used to keep track of the seasons were large stone structures (suchas Stonehenge) that used the positions of the rising Sun or Moon to forecast thecoming seasons. The first recognizable calendars that we know about were developedin Egypt, and appear to date from about 4,200 BC. Of course, all a calendar does islet you know what time of year it is—it does not provide you with an understandingof why the seasons occur! The ancient people had a variety of models for why seasonsoccurred, but thought that everything, including the Sun and stars, orbited aroundthe Earth. Today, you will learn the real reason why there are seasons.
• Goals: To learn why the Earth has seasons.
• Materials: a meter stick, a mounted globe, an elevation angle apparatus, string,a halogen lamp, and a few other items
21

2.2 The Seasons
Before we begin today’s lab, let us first talk about the seasons. In New Mexico wehave rather mild Winters, and hot Summers. In the northern parts of the UnitedStates, however, the winters are much colder. In Hawaii, there is very little differencebetween Winter and Summer. As you are also aware, during the Winter there arefewer hours of daylight than in the Summer. In Table 2.1 we have listed seasonaldata for various locations around the world. Included in this table are the averageJanuary and July maximum temperatures, the latitude of each city, and the lengthof the daylight hours in January and July. We will use this table in Exercise #2.
Table 2.1: Season Data for Select CitiesCity Latitude January Ave. July Ave. January July
(Degrees) Max. Temp. Max. Temp. Daylight DaylightHours Hours
Fairbanks, AK 64.8N -2 72 3.7 21.8Minneapolis, MN 45.0N 22 83 9.0 15.7Las Cruces, NM 32.5N 57 96 10.1 14.2Honolulu, HI 21.3N 80 88 11.3 13.6
Quito, Ecuador 0.0 77 77 12.0 12.0Apia, Samoa 13.8S 80 78 11.1 12.7
Sydney, Australia 33.9S 78 61 14.3 10.3Ushuaia, Argentina 54.6S 57 39 17.3 7.4
In Table 2.1, the “N” following the latitude means the city is in the northern hemi-sphere of the Earth (as is all of the United States and Europe) and thus North of theequator. An “S” following the latitude means that it is in the southern hemisphere,South of the Earth’s equator. What do you think the latitude of Quito, Ecuador(0.0o) means? Yes, it is right on the equator. Remember, latitude runs from 0.0o atthe equator to ±90o at the poles. If north of the equator, we say the latitude is XXdegrees north (or sometimes “+XX degrees”), and if south of the equator we say XXdegrees south (or “−XX degrees”). We will use these terms shortly.
Now, if you were to walk into the Mesilla Valley Mall and ask a random stranger “whydo we have seasons?”, the most common answer you would get is “because we arecloser to the Sun during Summer, and further from the Sun in Winter”. This answersuggests that the general public (and most of your classmates) correctly understandthat the Earth orbits the Sun in such a way that at some times of the year it is closerto the Sun than at other times of the year. As you have (or will) learn in your lectureclass, the orbits of all planets around the Sun are ellipses. As shown in Figure 2.1 anellipse is sort of like a circle that has been squashed in one direction. For most of theplanets, however, the orbits are only very slightly elliptical, and closely approximatecircles. But let us explore this idea that the distance from the Sun causes the seasons.
22

Figure 2.1: An ellipse with the two “foci” identified. The Sun sits at one focus, whilethe other focus is empty. The Earth follows an elliptical orbit around the Sun, butnot nearly as exaggerated as that shown here!
Exercise #1. In Figure 2.1, we show the locations of the two “foci” of an ellipse(foci is the plural form of focus). We will ignore the mathematical details of whatfoci are for now, and simply note that the Sun sits at one focus, while the otherfocus is empty (see the Kepler Law lab for more information if you are interested).A planet orbits around the Sun in an elliptical orbit. So, there are times when theEarth is closest to the Sun (“perihelion”), and times when it is furthest (“aphelion”).When closest to the Sun, at perihelion, the distance from the Earth to the Sun is147,056,800 km (“147 million kilometers”). At aphelion, the distance from the Earthto the Sun is 152,143,200 km (152 million km).
With the meter stick handy, we are going to examine these distances. Obviously, ourclassroom is not big enough to use kilometers or even meters so, like a road map, wewill have to use a reduced scale: 1 cm = 1 million km. Now, stick a piece of tape onthe table and put a mark on it to set the starting point (the location of the Sun!).Carefully measure out the two distances (along the same direction) and stick downtwo more pieces of tape, one at the perihelion distance, one at the aphelion distance(put small dots/marks on the tape so you can easily see them).
1) Do you think this change in distance is big enough to cause the seasons? Explainyour logic. (3 points)
23

2) Take the ratio of the aphelion to perihelion distances: . (1 point)
Given that we know objects appear bigger when we are closer to them, let’s take alook at the two pictures of the Sun you were given as part of the materials for this lab.One image was taken on January 23rd, 1992, and one was taken on the 21st of July1992 (as the “date stamps” on the images show). Using a ruler, carefully measure thediameter of the Sun in each image:
Sun diameter in January image = mm.
Sun diameter in July image = mm.
3) Take the ratio of bigger diameter / smaller diameter, this = . (1point)
4) How does this ratio compare to the ratio you calculated in question #2? (2 points)
5) So, since an object appears bigger when we get closer to it, when is the Earthclosest to the Sun? (2 points)
6) At that time of year, what season is it in Las Cruces? What do you conclude aboutthe statement “the seasons are caused by the changing distance between the Earthand the Sun”? (4 points)
24

Exercise #2. Characterizing the nature of the seasons at different locations. Forthis exercise, we are going to be exclusively using the data contained in Table 2.1.First, let’s look at Las Cruces. Note that here in Las Cruces, our latitude is +32.5o.That is we are about one third of the way from the equator to the pole. In Januaryour average high temperature is 57oF, and in July it is 96oF. It is hotter in Summerthan in Winter (duh!). Note that there are about 10 hours of daylight in January,and about 14 hours of daylight in July.
7) Thus, for Las Cruces, the Sun is “up” longer in July than in January. Is the samething true for all cities with northern latitudes? Yes or No ? (1 point)
Ok, let’s compare Las Cruces with Fairbanks, Alaska. Answer these questions byfilling in the blanks:
8) Fairbanks is the North Pole than Las Cruces. (1 point)
9) In January, there are more daylight hours in . (1 point)
10) In July, there are more daylight hours in . (1 point)
Now let’s compare Las Cruces with Sydney, Australia. Answer these questions byfilling in the blanks:
11)While the latitudes of Las Cruces and Sydney are similar, Las Cruces isof the Equator, and Sydney is of the Equator. (2 points)
12) In January, there are more daylight hours in . (1point)
13) In July, there are more daylight hours in . (1 point)
14) Summarizing: During the Wintertime (January) in both Las Cruces and Fair-banks there are fewer daylight hours, and it is colder. During July, it is warmer in
25

both Fairbanks and Las Cruces, and there are more daylight hours. Is this also truefor Sydney?: . (1 point)
15) In fact, it is Wintertime in Sydney during , and Summertime during. (2 points)
16) From Table 2.1, I conclude that the times of the seasons in the Northern hemi-sphere are exactly to those in the Southern hemisphere. (1 point)
From Exercise #2 we learned a few simple truths, but ones that maybe you havenever thought about. As you move away from the equator (either to the north or tothe south) there are several general trends. The first is that as you go closer to thepoles it is generally cooler at all times during the year. The second is that as youget closer to the poles, the amount of daylight during the Winter decreases, but thereverse is true in the Summer.
The first of these is not always true because the local climate can be moderated bythe proximity to a large body of water, or depend on the local elevation. For example,Sydney is milder than Las Cruces, even though they have similar latitudes: Sydney ison the eastern coast of Australia (South Pacific ocean) and has a climate like that ofSan Diego, California (which has a similar latitude and is on the coast of the NorthPacific). Quito, Ecuador has a mild climate even though it sits right on the equatordue to its high elevation–it is more than 9,000 feet above sea level, similar to theelevation of Cloudcroft, New Mexico.
The second conclusion (amount of daylight) is always true—as you get closer andcloser to the poles, the amount of daylight during the Winter decreases, while theamount of daylight during the Summer increases. In fact, for all latitudes north of66.5o, the Summer Sun is up all day (24 hrs of daylight, the so called “land of themidnight Sun”) for at least one day each year, while in the Winter there are timeswhen the Sun never rises! 66.5o is a special latitude, and is given the name “ArcticCircle”. Note that Fairbanks is very close to the Arctic Circle, and the Sun is upfor just a few hours during the Winter, but is up for nearly 22 hours during theSummer! The same is true for the southern hemisphere: all latitudes south of −66.5o
experience days with 24 hours of daylight in the Summer, and 24 hours of darkness inthe Winter. −66.5o is called the “Antarctic Circle”. But note that the seasons in theSouthern Hemisphere are exactly opposite to those in the North. During NorthernWinter, the North Pole experiences 24 hours of darkness, but the South Pole has 24hours of daylight.
26

2.3 The Spinning, Revolving Earth
It is clear from the preceding section that your latitude determines both the annualvariation in the amount of daylight, and the time of the year when you experienceSpring, Summer, Autumn and Winter. To truly understand why this occurs requiresus to construct a model. One of the key insights to the nature of the motion of theEarth is shown in the long exposure photographs of the nighttime sky on the nexttwo pages.
What is going on in these photos? The easiest explanation is that the Earth isspinning, and as you keep your camera shutter open, the stars appear to move in“orbits” around the North Pole. You can duplicate this motion by sitting in a chairthat is spinning—the objects in the room appear to move in circles around you. Thefurther they are from the “axis of rotation”, the bigger arcs they make, and the fasterthey move. An object straight above you, exactly on the axis of rotation of the chair,does not move. As apparent in Figure 2.3, the “North Star” Polaris is not perfectlyon the axis of rotation at the North Celestial Pole, but it is very close (the fact thatthere is a bright star near the pole is just random chance). Polaris has been used asa navigational aid for centuries, as it allows you to determine the direction of North.
As the second photograph shows, the direction of the spin axis of the Earth does notchange during the year—it stays pointed in the same direction all of the time! If theEarth’s spin axis moved, the stars would not make perfect circular arcs, but wouldwander around in whatever pattern was being executed by the Earth’s axis.
Now, as shown back in Figure 2.1, we said the Earth orbits (“revolves” around) theSun on an ellipse. We could discuss the evidence for this, but to keep this lab brief, wewill just assume this fact. So, now we have two motions: the spinning and revolvingof the Earth. It is the combination of these that actually give rise to the seasons, asyou will find out in the next exercise.
Exercise #3: In this part of the lab, we will be using the mounted globes, a piece ofstring, a ruler, and the halogen desk lamp. Warning: while the globe used hereis made of fairly inexpensive parts, it is very time consuming to make.Please be careful with your globe, as the paint can be easily damaged.Make sure that the piece of string you have is long enough to go slightly more thanhalfway around the globe at the equator–if your string is not that long, ask your TAfor a longer piece of string. As you may have guessed, this globe is a model of theEarth. The spin axis of the Earth is actually tilted with respect to the plane of itsorbit by 23.5o.
Set up the experiment in the following way. Place the halogen lamp at one end of thetable (shining towards the closest wall so as to not affect your classmates), and setthe globe at a distance of 1.5 meters from the lamp. After your TA has dimmed theclassroom lights, turn on the halogen lamp to the highest setting (if there is a dim,
27
and a bright setting–some lights only have one brightness setting). Note these lampsget very hot, so be careful. For this lab, we will define the top of the globe as theNorthern hemisphere, and the bottom as the Southern hemisphere.
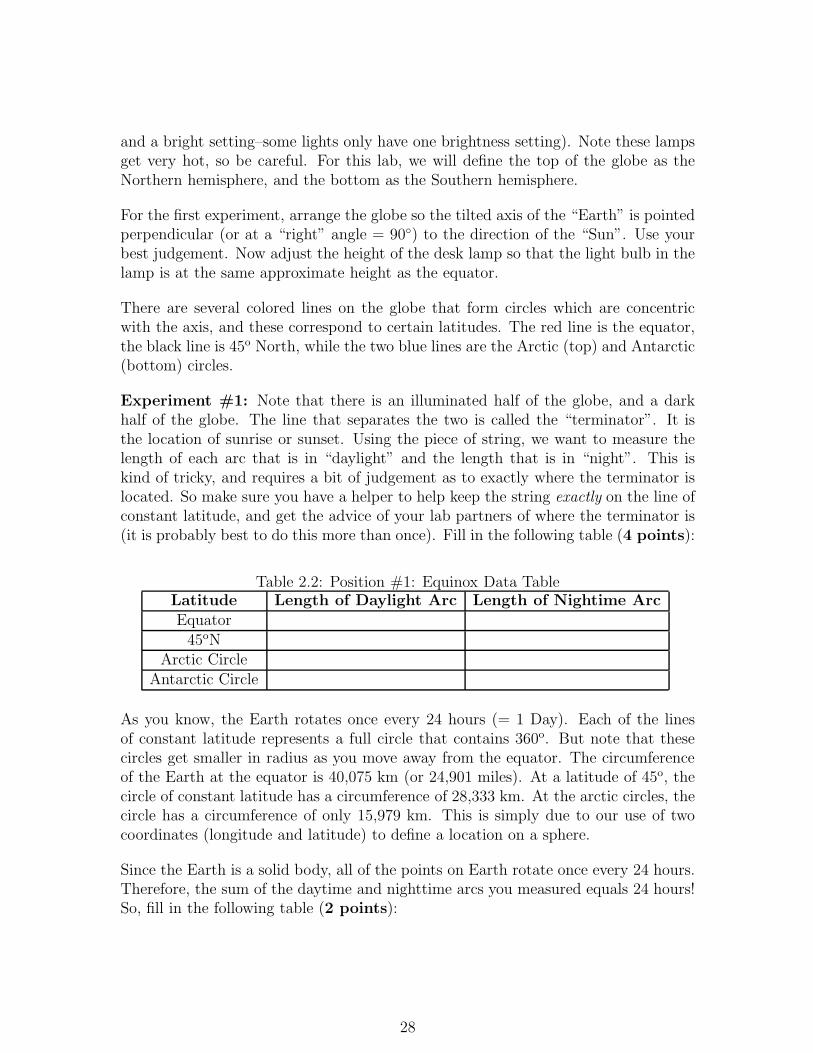
For the first experiment, arrange the globe so the tilted axis of the “Earth” is pointedperpendicular (or at a “right” angle = 90◦) to the direction of the “Sun”. Use yourbest judgement. Now adjust the height of the desk lamp so that the light bulb in thelamp is at the same approximate height as the equator.
There are several colored lines on the globe that form circles which are concentricwith the axis, and these correspond to certain latitudes. The red line is the equator,the black line is 45o North, while the two blue lines are the Arctic (top) and Antarctic(bottom) circles.
Experiment #1: Note that there is an illuminated half of the globe, and a darkhalf of the globe. The line that separates the two is called the “terminator”. It isthe location of sunrise or sunset. Using the piece of string, we want to measure thelength of each arc that is in “daylight” and the length that is in “night”. This iskind of tricky, and requires a bit of judgement as to exactly where the terminator islocated. So make sure you have a helper to help keep the string exactly on the line ofconstant latitude, and get the advice of your lab partners of where the terminator is(it is probably best to do this more than once). Fill in the following table (4 points):
Table 2.2: Position #1: Equinox Data TableLatitude Length of Daylight Arc Length of Nightime ArcEquator45oN
Arctic CircleAntarctic Circle
As you know, the Earth rotates once every 24 hours (= 1 Day). Each of the linesof constant latitude represents a full circle that contains 360o. But note that thesecircles get smaller in radius as you move away from the equator. The circumferenceof the Earth at the equator is 40,075 km (or 24,901 miles). At a latitude of 45o, thecircle of constant latitude has a circumference of 28,333 km. At the arctic circles, thecircle has a circumference of only 15,979 km. This is simply due to our use of twocoordinates (longitude and latitude) to define a location on a sphere.
Since the Earth is a solid body, all of the points on Earth rotate once every 24 hours.Therefore, the sum of the daytime and nighttime arcs you measured equals 24 hours!So, fill in the following table (2 points):
28

Figure 2.2: Pointing a camera at the North Star (Polaris, the bright dot near thecenter) and exposing for about one hour, the stars appear to move in little arcs. Thecenter of rotation is called the “North Celestial Pole”, and Polaris is very close tothis position. The dotted/dashed trails in this photograph are the blinking lights ofairplanes that passed through the sky during the exposure.
29

Figure 2.3: Here is a composite of many different exposures (each about one hourin length) of the night sky over Vienna, Austria taken throughout the year (all fourseasons). The images have been composited using a software package like Photoshopto demonstrate what would be possible if it stayed dark for 24 hrs, and you couldactually obtain a 24 hour exposure (which can only be truly done north of the Arcticcircle). Polaris is the the smallest circle at the very center.
30

Table 2.3: Position #1: Length of Night and DayLatitude Daylight Hours Nighttime HoursEquator45oN
Arctic CircleAntarctic Circle
18) The caption for Table 2.2 was “Equinox data”. The word Equinox means “equalnights”, as the length of the nighttime is the same as the daytime. While yournumbers in Table 2.3 may not be exactly perfect, what do you conclude about thelength of the nights and days for all latitudes on Earth in this experiment? Is thisresult consistent with the term Equinox? (3 points)
Experiment #2: Now we are going to re-orient the globe so that the (top) polaraxis points exactly away from the Sun and repeat the process of Experiment #1. Fillin the following two tables (4 points):
Table 2.4: Position #2: Solstice Data TableLatitude Length of Daylight Arc Length of Nightime ArcEquator45oN
Arctic CircleAntarctic Circle
Table 2.5: Position #2: Length of Night and DayLatitude Daylight Hours Nighttime HoursEquator45oN
Arctic CircleAntarctic Circle
19) Compare your results in Table 2.5 for +45o latitude with those for Minneapolisin Table 2.1. Since Minneapolis is at a latitude of +45o, what season does this orien-tation of the globe correspond to? (2 points)
31

20) What about near the poles? In this orientation what is the length of the nighttimeat the North pole, and what is the length of the daytime at the South pole? Is thisconsistent with the trends in Table 2.1, such as what is happening at Fairbanks or inUshuaia? (4 points)
Experiment #3: Now we are going to approximate the Earth-Sun orientation sixmonths after that in Experiment #2. To do this correctly, the globe and the lampshould now switch locations. Go ahead and do this if this lab is confusing you—oryou can simply rotate the globe apparatus by 180o so that the North polar axis istilted exactly towards the Sun. Try to get a good alignment by looking at the shadowof the wooden axis on the globe. Since this is six months later, it easy to guess whatseason this is, but let’s prove it! Complete the following two tables (4 points):
Table 2.6: Position #3: Solstice Data TableLatitude Length of Daylight Arc Length of Nightime ArcEquator45oN
Arctic CircleAntarctic Circle
Table 2.7: Position #3: Length of Night and DayLatitude Daylight Hours Nighttime HoursEquator45oN
Arctic CircleAntarctic Circle
21) As in question #19, compare the results found here for the length of daytime andnighttime for the +45o degree latitude with that for Minneapolis. What season doesthis appear to be? (2 points)
22) What about near the poles? In this orientation, how long is the daylight at the
32

North pole, and what is the length of the nighttime at the South pole? Is this con-sistent with the trends in Table 2.1, such as what is happening at Fairbanks or inUshuaia? (2 points)
23) Using your results for all three positions (Experiments #1, #2, and #3) can youexplain what is happening at the Equator? Does the data for Quito in Table 2.1 makesense? Why? Explain. (3 points)
We now have discovered the driver for the seasons: the Earth spins on anaxis that is inclined to the plane of its orbit (as shown in Figure 2.4). But the spinaxis always points to the same place in the sky (towards Polaris). Thus, as the Earthorbits the Sun, the amount of sunlight seen at a particular latitude varies: the amountof daylight and nighttime hours change with the seasons. In Northern HemisphereSummer (approximately June 21st) there are more daylight hours; at the start of theAutumn (∼ Sept. 20th) and Spring (∼ Mar. 21st), the days are equal to the nights.In the Winter (approximately Dec. 21st) the nights are long, and the days are short.We have also discovered that the seasons in the Northern and Southern hemispheresare exactly opposite. If it is Winter in Las Cruces, it is Summer in Sydney (and viceversa). This was clearly demonstrated in our experiments and is shown in Figure 2.4.
The length of the daylight hours is one reason why it is hotter in Summer than inWinter: the longer the Sun is above the horizon the more it can heat the air, theland and the seas. But this is not the whole story. At the North Pole, where thereis constant daylight during the Summer, the temperature barely rises above freezing!Why? We will discover the reason for this now.
33

Figure 2.4: The Earth’s spin axis always points to one spot in the sky, and it is tiltedby 23.5o to its orbit. Thus, as the Earth orbits the Sun, the illumination changes withlatitude: sometimes the North Pole is bathed in 24 hours of daylight, and sometimesin 24 hours of night. The exact opposite is occurring in the Southern Hemisphere.
2.4 Elevation Angle and the Concentration of Sun-
light
We have found out part of the answer to why it is warmer in summer than in winter:the length of the day is longer in summer. But this is only part of the story–you wouldthink that with days that are 22 hours long during the summer, it would be hot inAlaska and Canada during the summer, but it is not. The other effect caused byEarth’s tilted spin axis is the changing height that the noontime Sun attains duringthe various seasons. Before we discuss why this happens (as it takes quite a lot ofwords to describe it correctly), we want to explore what happens when the Sun ishigher in the sky. First, we need to define two new terms: “altitude”, or “elevationangle”. As shown in the diagram in Fig. 2.5.
Figure 2.5: Altitude (“Alt”) is simply the angle between the horizon, and an objectin the sky. The smallest this angle can be is 0◦, and the maximum altitude angle is90◦. Altitude is interchangeably known as elevation.
The Sun is highest in the sky at noon everyday. But how high is it? This, of course,depends on both your latitude and the time of year. For Las Cruces, the Sun has analtitude of 81◦ on June 21st. On both March 21st and September 20th, the altitude of
34

the Sun at noon is 57.5◦. On December 21st its altitude is only 34◦. Thus, the Sunis almost straight overhead at noon during near the Summer Solstice, but very lowduring the Winter Solstice. What difference can this possibly make? We now explorethis using the other apparatus, the elevation angle device, that accompanies this lab(the one with the protractor and flashlight).
Exercise #4: Using the elevation angle apparatus, we now want to measure whathappens when the Sun is at a higher or lower elevation angle. We mimic this by usinga flashlight mounted on an arm that allows you to move it to just about any elevationangle. It is difficult to exactly model the Sun using a flashlight, as the light sourceis not perfectly uniform. But here we do as well as we can. Play around with thedevice. Turn on the flashlight and move the arm to lower and higher angles. Howdoes the illumination pattern change? Does the illuminated pattern appear to changein brightness as you change angles? Explain. (2 points)
Ok, now we are ready to begin. Take a blank sheet of white paper and tape it to thebase so we have a more reflective surface. Now arrange the apparatus so the elevationangle is 90◦. The illuminated spot should look circular. Measure the diameter of thiscircle using a ruler.
The diameter of the illuminated circle is cm.
Do you remember how to calculate the area of a circle? Does the formula πR2 ring abell?
The area of the circle of light at an elevation angle of 90◦ is cm2.(1 point)
Now, as you should have noticed at the beginning of this exercise, as you move theflashlight to lower and lower elevations, the circle changes to an ellipse. Now adjustthe elevation angle to be 45◦. Ok, time to introduce you to two new terms: the major
35

axis and minor axis of an ellipse. Both are shown in Fig. 6.4. The minor axis is thesmallest diameter, while the major axis is the longest diameter of an ellipse.
Figure 2.6: An ellipse with the major and minor axes defined.
Ok, now measure the lengths of the major (“a”) and minor (“b”) axes at 45◦:
The major axis has a length of a = cm, while the minor axis has a
length of b = cm.
The area of an ellipse is simply (π × a × b)/4. So, the area of
the ellipse at an elevation angle of 45◦ is: cm2 (1 point).
So, why are we making you measure these areas? Note that the black tube restrictsthe amount of light coming from the flashlight into a cylinder. Thus, there is only acertain amount of light allowed to come out and hit the paper. Let’s say there are“one hundred units of light” emitted by the flashlight. Now let’s convert this to howmany units of light hit each square centimeter at angles of 90◦ and 45◦.
At 90◦, the amount of light per centimeter is 100 divided by the area of circle
= units of light per cm2 (1 point).
At 45◦, the amount of light per centimeter is 100 divided by the area of the ellipse
= units of light per cm2 (1 point).
Since light is a form of energy, at which elevation angle is there more energy persquare centimeter? Since the Sun is our source of light, what happens when the Sunis higher in the sky? Is its energy more concentrated, or less concentrated? How
36

about when it is low in the sky? Can you tell this by looking at how bright the ellipseappears versus the circle? (4 points)
As we have noted, the Sun never is very high in the arctic regions of the Earth. Infact, at the poles, the highest elevation angle the Sun can have is 23.5◦. Thus, thelight from the Sun is spread out, and cannot heat the ground as much as it can at apoint closer to the equator. That’s why it is always colder at the Earth’s poles thanelsewhere on the planet.
You are now finished with the in-class portion of this lab. To understand why the Sunappears at different heights at different times of the year takes a little explanation(and the following can be read at home unless you want to discuss it with your TA).Let’s go back and take a look at Fig. 2.3. Note that Polaris, the North Star, barelymoves over the course of a night or over the year—it is always visible. If you hada telescope and could point it accurately, you could see Polaris during the daytimetoo. Polaris never sets for people in the Northern Hemisphere since it is located veryclose to the spin axis of the Earth. Note that as we move away from Polaris thecircles traced by other stars get bigger and bigger. But all of the stars shown in thisphoto are always visible—they never set. We call these stars “circumpolar”. Forevery latitude on Earth, there is a set of circumpolar stars (the number decreases asyou head towards the equator).
Now let us add a new term to our vocabulary: the “Celestial Equator”. The CelestialEquator is the projection of the Earth’s Equator onto the sky. It is a great circle thatspans the night sky that is directly overhead for people who live on the Equator. Asyou have now learned, the lengths of the days and nights at the equator are nearlyalways the same: 12 hours. But we have also learned that during the Equinoxes, thelengths of the days and the nights everywhere on Earth are also twelve hours. Why?Because during the equinoxes, the Sun is on the Celestial Equator. That means it isstraight overhead (at noon) for people who live in Quito, Ecuador (and everywhereelse on the equator). Any object that is on the Celestial Equator is visible for 12hours per day from everywhere on Earth. To try to understand this, take a look
37

at Fig. 2.7. In this figure is shown the celestial geometry explicitly showing thatthe Celestial Equator is simply the Earth’s equator projected onto the sky (left handdiagram). But the Earth is large, and to us, it appears flat. Since the objects in thesky are very far away, we get a view like that shown in the right hand diagram: wesee one hemisphere of the sky, and the stars, planets, Sun and Moon rise in the east,and set in the west. But note that the Celestial Equator exactly intersects East andWest. Only objects located on the Celestial Equator rise exactly due East, and setexactly due West. All other objects rise in the northeast or southeast and set in thenorthwest or the southwest. Note that in this diagram (for a latitude of 40◦) all starsthat have latitudes (astronomers call them “Declinations”, or “dec”) above 50◦ neverset–they are circumpolar.
Figure 2.7: The Celestial Equator is the circle in the sky that is straight overhead(“the zenith”) of the Earth’s equator. In addition, there is a “North Celestial” polethat is the projection of the Earth’s North Pole into space (that almost points toPolaris). But the Earth’s spin axis is tilted by 23.5◦ to its orbit, and the Sun appearsto move above and below the Celestial Equator over the course of a year.
What happens is that during the year, the Sun appears to move above and below theCelestial Equator. On, or about, March 21st the Sun is on the Celestial Equator, andeach day after this it gets higher in the sky (for locations in the Northern Hemisphere)until June 21st. After that date it retraces its steps until it reaches the AutumnalEquinox (September 20th), after which it is then South of the Celestial Equator. It islowest in the sky on December 21st. This is simply due to the fact that the Earth’saxis is tilted with respect to its orbit, and this tilt does not change. You can see thisgeometry by going back to the illuminated globe model used in Exercise #3. If youstick a pin at some location on the globe away from the equator, turn on the halogenlamp, and slowly rotate the entire apparatus around (while keeping the pin facingthe Sun) you will notice that the shadow of the pin will increase and decrease in size.This is due to the apparent change in the elevation angle of the “Sun”.
38

2.5 Summary (35 points)
Summarize the important points covered in this lab. Questions you should answerinclude:
• Why does the Earth have seasons?
• What is the origin of the term “Equinox”?
• What is the origin of the term “Solstice”?
• Most people in the United States think the seasons are caused by the changingdistance between the Earth and the Sun. Why do you think this is?
• What type of seasons would the Earth have if its spin axis was exactly perpen-dicular to its orbital plane? Make a diagram like Fig. 2.4.
• What type of seasons would the Earth have if its spin axis was in the plane ofits orbit? (Note that this is similar to the situation for the planet Uranus.)
• What do you think would happen if the Earth’s spin axis wobbled randomlyaround on a monthly basis? Describe how we might detect this.
2.6 Possible Quiz Questions
1) What does the term “latitude” mean?2) What is meant by the term “Equator”?3) What is an ellipse?4) What are meant by the terms perihelion and aphelion?5) If it is summer in Australia, what season is it in New Mexico?
2.7 Extra Credit (ask your TA for permission be-
fore attempting, 5 points)
We have stated that the Earth’s spin axis constantly points to a single spot in thesky. This is actually not true. Look up the phrase “precession of the Earth’s spinaxis”. Describe what is happening and the time scale of this motion. Describe whathappens to the timing of the seasons due to this motion. Some scientists believe thatprecession might help cause ice ages. Describe why they believe this.
39

40
Name:
Lab 3
The Surface of the Moon
3.1 Introduction
One can learn a lot about the Moon by looking at the lunar surface. Even beforeastronauts landed on the Moon, scientists had enough data to formulate theoriesabout the formation and evolution of the Earth’s only natural satellite. However,since the Moon rotates once for every time it orbits around the Earth, we can onlysee one side of the Moon from the surface of the Earth. Until spacecraft were sent toorbit the Moon, we only knew half the story.
The type of orbit our Moon makes around the Earth is called a synchronous orbit.This phenomenon is shown graphically in Figure 3.1 below. If we imagine that there isone large mountain on the hemisphere facing the Earth (denoted by the small triangleon the Moon), then this mountain is always visible to us no matter where the Moonis in its orbit. As the Moon orbits around the Earth, it turns slightly so we alwayssee the same hemisphere.
On the Moon, there are extensive lava flows, rugged highlands, and many impactcraters of all different sizes. The overlapping of these features implies relative ages.Because of the lack of ongoing mountain building processes, or weathering by windand water, the accumulation of volcanic processes and impact cratering is readilyvisible. Thus by looking at the images of the Moon, one can trace the history of thelunar surface. Most of the images in this lab were taken by NASA spacecraft or byApollo Astronauts.
• Goals: to discuss the Moon’s terrain, craters, and the theory of relative ages;to use pictures of the Moon to deduce relative ages and formation processes of
41

Figure 3.1: The Moon’s “synchronous” orbit (not drawn to scale). Note how theMoon spins exactly once during its 27.3 day orbit around the Earth, but keeps thesame face pointing towards the Earth.
surface features
• Materials: Moon pictures, ruler, calculator
• Review: Section 1.2.2 in Lab #1
3.2 Craters and Maria
A crater is formed when a meteor from space strikes the lunar surface. The force ofthe impact obliterates the meteorite and displaces part of the Moon’s surface, pushingthe edges of the crater up higher than the surrounding rock. At the same time, moredisplaced material shoots outward from the crater, creating rays of ejecta. Theserays of material can be seen as radial streaks centered on some of the craters in someof the pictures you will be using for your lab today. As shown in Figure 3.2, some ofthe material from the blast “flows” back towards the center of the crater, creating amountain peak. Some of the craters in the photos you will examine today have these“central peaks”. Figure 3.2 also shows that the rock beneath the crater becomesfractured (full of cracks).
Soon after the Moon formed, its interior was mostly liquid. It was continually beinghit by meteors, and the energy (heat) from this period of intense cratering was enoughto liquify the Moon’s interior. Every so often, a very large meteor would strike thesurface, and crack the Moon′s crust. The over-pressured “lava” from the Moon’smolten mantle then flowed up through the cracks made by the impact. The lava filledin the crater, creating a dark, smooth “sea”. Such a sea is called a mare (plural:
42

Figure 3.2: Formation of an Impact Crater.
maria). Sometimes the amount of lava that came out could overfill the crater. Inthose cases, it spilled out over the crater’s edges and could fill in other craters as wellas cover the bases of the highlands, the rugged, rocky peaks on the surface of theMoon.
3.3 Relative Ages on the Moon
Since the Moon does not have rain or wind erosion, astronomers can determine whichfeatures on the Moon are older than others. It all comes down to counting thenumber of craters a feature has. Since there is nothing on the Moon that can erasethe presence of a crater, the more craters something has, the longer it must have beenaround to get hit. For example, if you have two large craters, and the first craterhas 10 smaller craters in it, while the second one has only 2 craters in it, we knowthat the first crater is older since it has been there long enough to have been hit 10times. If we look at the highlands, we see that they are covered with lots and lots ofcraters. This tells us that in general, the highlands are older than the maria, whichhave fewer craters. We also know that if we see a crater on top of a mare, the mare isolder. It had to be there in the first place to get hit by the meteor. Crater countingcan tell us which features on the Moon are older than other features, but it can nottell us the absolute age of the feature. To determine that, we need to use radioactivedating or some other technique.
43

3.4 Lab Stations
In this lab you will be using a 3-ring binder that has pictures organized into separatesections, or “stations”. At some stations we present data comparing the Moon to theEarth or Mars. Using your understanding of simple physical processes here on Earthand information from the class lecture and your reading, you will make observationsand draw logical conclusions in much the same way that a planetary geologist would.
You should work in groups of two to four, with one notebook for each group. Thenotebooks contain separate sections, or “stations”, with the photographs and/or im-ages for each specific exercise. Each group must go through all of the stations, andconsider and discuss each question and come to a conclusion. Remember to backup your answers with reasonable explanations, and be sure to answer all ofthe questions. While you should discuss the questions as a group, be sure to writedown one group answer for each question. The take-home questions must be done onyour own. Answers for the take-home questions that are exact duplicatesof those of other members of your group will not be acceptable.
3.4.1 The Surface of the Moon
Station 1: Our first photograph (#1) is that of the full Moon. It is obvious that theMoon has dark regions, and bright regions. The largest dark regions are the “Maria”,while the brighter regions are the “highlands”. In image #2, the largest features ofthe full Moon are labeled. The largest of the maria on the Moon is Mare Imbrium(the “Sea of Showers”), and it is easily located in the upper left quadrant of image#2. Locate Mare Imbrium. Let us take a closer look at Mare Imbrium.
Image #3 is from the Lunar Orbiter IV. Before the Apollo missions landed humanson the Moon, NASA sent several missions to the Moon to map its surface, and tomake sure we could safely land there. Lunar Orbiter IV imaged the Moon duringMay of 1967. The technology of the time was primitive compared to today, and thephotographs were built up by making small imaging scans/slices of the surface (thehorizontal striping can be seen in the images), then adding them all together to makea larger photograph. Image #3 is one of these images of Mare Imbrium seen fromalmost overhead.
Question #1: Approximately how many craters can you see inside the dark circular
44

region that defines Mare Imbrium? Compare the number of craters in Mare Imbriumto the brighter regions to the North (above) of Mare Imbrium. (2 points)
Images #4 and #5 are close-ups of small sections of Mare Imbrium. In image #4,the largest crater (in the lower left corner) is “Le Verrier” (named after the Frenchmathematician who predicted the correct position for the planet Neptune). Le Verrieris 20 km in diameter. In image #5, the two largest craters are named Piazzi Smyth(just left of center) and Kirch (below and left of Piazzi Smyth). Piazzi Smyth has adiameter of 13 km, while Kirch has a diameter of 11 km.
Question #2: Using the diameters for the large craters noted above, and a ruler,what is the approximate diameter of the smallest crater you can make out in images#4 and #5? If the NMSU campus is about 1 km in diameter, compare the smallestcrater you can see to the size of our campus. (2 points)
In image #5 there is an isolated mountain (Mons Piton) located near Piazzi Smyth.It is likely that Mons Piton is related to the range of mountains to its upper right.
Question #3: Roughly how much area (in km2) does Mons Piton cover? Compare itto the area of the Organ mountains that are located to the east of Las Cruces (estimatea width and a length, and assuming a rectangle, calculate the approximate area ofthe Organs). How do you think such an isolated mountain came to exist? [Hint: Inthe introduction to the lab exercises, the process of maria formation was described.Using this idea, how might Mons Piton become so isolated from the mountain rangeto the northeast?] (5 points)
45

Station #2: Now let’s move to the “highlands”. In image #6 (which is identical toimage #2), the crater Clavius can be seen on the bottom edge—it is the bottom-mostlabeled feature on this map. In image #7, is a close-up picture of Clavius (just belowcenter) taken from the ground through a small telescope (this is similar to what youwould see at the campus observatory). Clavius is one of the largest craters on theMoon, with a diameter of 225 km. In the upper right hand corner is one of the bestknown craters on the Moon, “Tycho”. In image #1 you can identify Tycho by thelarge number of bright “rays” that emanate from this crater. Tycho is a very youngcrater, and the ejecta blasted out of the lunar surface spread very far from the impactsite.
Question #4: Esitmate (in km) the distance from the center of the crater Claviusto the center of Tycho. Compare this to the distance between Las Cruces, andAlbuquerque (375 km). (3 points)
Images #8 and #9, are two high resolution images of Clavius and nearby regions takenby Lunar Orbiter IV (note the slightly different orientations from the ground-basedpicture).
Question #5: Compare the region around Clavius to Mare Imbrium. Scientists nowknow that the lunar highlands are older than the Maria. What evidence do you have(using these photographs) that supports this idea? [Hint: review section 2.3 of theintroduction.] (5 points)
46
Station #3: Comparing Apollo landing sites. In images #10 and #11 are close-upsof the Apollo 11 landing site in Mare Tranquillitatis (the “Sea of Tranquility”). Theactual spot where the “Eagle” landed on July 20, 1969 is marked by the small crossin image 11 (note that three small craters near the landing site have been named forthe crew of this mission: Aldrin, Armstrong and Collins). [There are also quite anumber of photographic defects in these pictures, especially the white circular blobsnear the center of the image to the North of the landing site.] The landing sites oftwo other NASA spacecraft, Ranger 8 and Surveyor 5, are also labeled in image #11.NASA made sure that this was a safe place to explore!
Images #12 and #13 show the landing site of the last Apollo mission, #17. Apollo17 landed on the Moon on December 11th, 1972. Compare the two landing sites.
Question #6: Describe the logic that NASA used in choosing the two landing sites–why did they choose the Tranquillitatis site for the first lunar landing? What do youthink led them to choose the Apollo 17 site? (5 points)
The next two sets of images show photographs taken by the astronauts while on theMoon. The first three photographs (#14, #15, and #16) are scenes from the Apollo11 site, while the next three (#17, #18, and #19) were taken at the Apollo 17 landingsite.
Question #7: Do the photographs from the actual landing sites back-up your answerto why NASA chose these two sites? How? Explain your reasoning. (5 points)
Station 4: On the northern-most edge of Mare Imbrium sits the crater Plato (labeled
47

in images #2 and #6). Photo #20 is a close-up of Plato. Do you agree with thetheory that the crater floor has been recently flooded? Is the mare that forms thefloor of this crater younger, older, or approximately the same age as the nearby regionof Mare Imbrium located just to the South (below) of Plato? Explain your reasoning.(5 points)
Station 5: Images #21 and #22 are “topographical” maps of the Earth and of theMoon. A topographical map shows the elevation of surface features. On the Earthwe set “sea level” as the zero point of elevation. Continents, like North America,are above sea level. The ocean floors are below sea level. In the topographical mapof the Earth, you can make out the United States. The Eastern part of the USis lower than the Western part. In topographical maps like these, different colorsindicate different heights. Blue and dark blue areas are below sea level, while greenareas are just above sea level. The highest mountains are colored in red (note thatGreenland and Antarctica are both colored in red–they have high elevations due tovery thick ice sheets). We can use the same technique to map elevations on the Moon.Obviously, the Moon does not have oceans to define “sea level”. Thus, the definitionof zero elevation is more arbitrary. For the Moon, sea level is defined by the averageelevation of the lunar surface.
Image #22 is a topographical map for the Moon, showing the highlands (orange, red,and pink areas), and the lowlands (green, blue, and purple). [Grey and black areashave no data.] The scale is shown at the top. The lowest points on the Moon are10 km below sea level, while the highest points are about 10 km above sea level. Onthe left hand edge (the “y axis”) is a scale showing the latitude. 0o latitude is theequator, just like on the Earth. Like the Earth, the North pole of the Moon has alatitude of +90o, and the south pole is at −90o. On the x-axis is the longitude of theMoon. Longitude runs from 0o to 360o. The point at 0o latitude and longitude of theMoon is the point on the lunar surface that is closest to the Earth.
It is hard to recognize features on the topographical map of the Moon because of thecomplex surface (when compared to the Earth’s large smooth areas). But let’s goahead and try to find the objects we have been studying. First, see if you can findPlato. The latitude of Plato is +52o N, and its longitude is 351o. You can clearly seethe outline of Plato if you look closely.
48

Question #8: Is Plato located in a high region, or a low region? Is Plato lower thanMare Imbrium (centered at 32oN, 344o)? [Remember that Plato is on the Northernedge of Mare Imbrium.](2 points)
Question #9: Apollo 11 landed at Latitude = 1.0oN, longitude = 24o. Did it landin a low area, or a high area? (2 points)
As described in the introduction, the Moon keeps the same face pointed towardsEarth at all times. We can only see the “far-side” of the Moon from a spacecraft.In image #22, the hemisphere of the Moon that we can see runs from a longitude of270o, passing through 0o, and going all the way to 90o (remember 0, 0 is located atthe center of the Moon as seen from Earth). In image #23 is a more conventionaltopographical map of the Moon, showing the two hemispheres: near side, and farside.
Question #10: Compare the average elevation of the near-side of the Moon to thatof the far-side. Are they different? Can you make-out the Maria? Compare thenumber of Maria on the far side to the number on the near side. (5 points)
Station 6: With the surface of the Moon now familiar to you, and your perceptionof the surface of the Earth in mind, compare the Earth’s surface to the surface of theMoon. Does the Earth’s surface have more craters or less craters than the surface
49

of the Moon? Discuss two differences between the Earth and the Moon that couldexplain this. (5 points)
3.4.2 The Chemical Composition of the Moon: Keys to its
Origin
Station 7: Now we want to examine the chemical composition of the Moon toreveal its history and origin. The formation of planets (and other large bodies in thesolar system like the Moon) is a violent process. Planets grow through the processof “accretion”: the gravity of the young planet pulls on nearby material, and thismaterial crashes into the young planet, heating it, and creating large craters. Inthe earliest days of the solar system, so much material was being accreted by theplanets, that they were completely molten. That is, they were in the form of liquidrock, like the lava you see flowing from some volcanoes on the Earth. Just like thecase with water, heavier objects in molten rock sink to the bottom more quicklythan lighter material. This is also true for chemical elements. Iron is one of theheaviest of the common elements, and it sinks toward the center of a planet morequickly than elements like silicon, aluminum, or magnesium. Thus, near the Earth’ssurface, rocks composed of these lighter elements dominate. In lava, however, we areseeing molten rock from deeper in the Earth coming to the surface, and thus lava andother volcanic (or “igneous”) rock, can be rich in iron, nickel, titanium, and otherhigh-density elements.
Images #24 and 25 present two unique views of the Moon obtained by the spacecraftClementine. Using special sensors, Clementine could make maps of the surface com-position of the Moon. In Image #24 is a map of the amount of iron on the surface ofthe Moon (redder colors mean more iron than bluer colors). Image #25 is the sametype of map, but for titanium.
Question #11: Compare the distribution of iron and titanium to the surface featuresof the Moon (using images #1, #2 or #6, or the topographical map in image #23).
50

Where are the highest concentrations of iron and titanium found? (4 points)
Question #12: If the heavy elements like iron and titanium sank towards the centerof the Moon soon after it formed, what does the presence of large amounts of ironand titanium in the maria suggest? [Hint: do you remember how maria are formed?](5 points)
The structure of the Earth is shown in the diagram, below. There are three mainstructures: the crust (where we live), the mantle, and the core. The crust is cool andbrittle, the mantle is hotter, and “plastic” (it flows), and the core is very hot and verydense. The density of a material is simply its mass (in grams or kilograms) divided byits volume (in centimeters or meters). Water has a density of 1 gm/cm3. The densityof the Earth’s crust is about 3 gm/cm3, while the mantle has a density of 4.5 gm/cm3.The core is very dense: 14 gm/cm3 (this is partly due to its composition, and partlydue to the great pressure exerted by the mass located above the core). The core ofthe Earth is almost pure iron, while the mantle is a mixture of magnesium, silicon,iron and oxygen. The average density of the Earth is 5.5 gm/cm3.
Before the astronauts brought back rocks from the Moon, we did not have a goodtheory about its formation. All we knew was that the Moon had an average densityof 3.34 gm/cm3. If the Moon formed from the same material as the Earth, theircompositions would be nearly identical, as would their average densities. In Table3.1, we present a comparison of the composition of the Moon to that of the Earth.The data for the Moon comes from analysis of the rocks brought back by the Apolloastronauts.
51

Figure 3.3: The internal structure of the Earth, showing the dimensions of the crust,mantle and core, as well as their composition and temperatures.
Table 3.1: Composition of the Earth & MoonElement Earth MoonIron 34.6% 3.5%
Oxygen 29.5% 60.0%Silicon 15.2% 16.5%
Magnesium 12.7% 3.5%Titanium 0.05% 1.0%
Question #13: Is the Moon composed of the same mixture of elements as theEarth? What are the biggest differences? Does this support a model where the Moonformed out of the same material as the Earth? (3 points)
As you will learn in the Astronomy 110 lectures, the inner planets in the solar sys-tem (Mercury, Venus, Earth and Mars) have higher densities than the outer planets(Jupiter, Saturn, Uranus and Neptune). One theory for the formation of the Moon isthat it formed out near Mars, and “migrated” inwards to be captured by the Earth.This theory arose because the density of Mars, 3.9 gm/cm3, is similar to that of theMoon. But Mars is rich in iron and magnesium: 17% of Mars is iron, and more than15% is magnesium.
Question #14: Given this data, do you think it is likely that the Moon formed out
52

Table 3.2: Chemical Composition of the Earth and MoonElement Earth’s Crust and Mantle MoonIron 5.0% 3.5%
Oxygen 46.6% 60.0%Silicon 27.7% 16.5%
Magnesium 2.1% 3.5%Calcium 3.6% 4.0%
near Mars? Why? (2 points)
The final theory for the formation of the Moon is called the “Giant Impact” theory.In this model, a large body (about the size of the planet Mars) collided with theEarth, and the resulting explosion sent a large amount of material into space. Thismaterial eventually collapsed (coalesced) to form the Moon. Most of the ejectedmaterial would have come from the crust and the mantle of the Earth, since it isthe material closest to the Earth’s surface. In the Table (3.2) is a comparison of thecomposition of the Earth’s crust and mantle compared to that of the Moon.
Question #15: Given the data in this table, present an argument for why the giantimpact theory is now the favorite theory for the formation of the Moon. Can youthink of a reason why the compositions might not be exactly the same? (5 points)
53

3.5 Summary
(35 points) Please summarize in a few paragraphs what you have learned in this lab.Your summary should include:
• Explain how to determine and assign relative ages of features on the Moon
• Comment on analyzing pictures for information; what sorts of things would youlook for? what can you learn from them?
• What is a mare and how is it formed?
• How does the composition of the Moon differ from the Earth, and how doesthis give us insight into the formation of the Moon?
Use complete sentences and proofread your summary before handing it in.
3.6 Possible Quiz Questions
1. What is an impact crater, and how is it formed?
2. What is a Mare?
3. Which is older the Maria or the Highlands?
4. How are the Maria formed?
5. What is synchronous rotation?
6. How can we determine the relative ages of different lunar surfaces?
3.7 Extra Credit (ask your TA for permission be-
fore attempting, 5 points)
In the past few years, there have been some new ideas about the formation of theMoon, and why the lunar farside is so different from the nearside (one such idea goesby the name “the big splat”). In addition, we have recently discovered that the in-terior of the Moon is highly fractured. Write a brief (about one page) review on thenew computer simulations and/or observations that are attempting to understandthe formation and structure of the Moon.
54
Name:
Lab 4
Shaping Surfaces in the SolarSystem: The Impacts of Cometsand Asteroids
4.1 Introduction
In the lab exercise on exploring the surface of the Moon, there is a brief discussionon how impact craters form. Note that every large body in the solar system has beenbombarded by smaller bodies throughout all of history. In fact, this is one mechanismby which planets grow in size: they collect smaller bodies that come close enough tobe captured by the planet’s gravity. If a planet or moon has a rocky surface, thesurface can still show the scars of these impact events–even if they occurred manybillions of years ago! On planets with atmospheres, like our Earth, weather canerode these impact craters away, making them difficult to identify. On planets thatare essentially large balls of gas (the “Jovian” planets), there is no solid surface torecord impacts. Many of the smaller bodies in the solar system, such as the Moon,the planet Mercury, or the satellites of the Jovian planets, do not have atmospheres,and hence, faithfully record the impact history of the solar system. Astronomershave found that when the solar system was very young, there were large numbers ofsmall bodies floating around the solar system impacting the young planets and theirsatellites. Over time, the number of small bodies in the solar system has decreased.Today we will investigate how impact craters form, and examine how they appearunder different lighting conditions. During this lab we will discuss both asteroids andcomets, and you will create your own impact craters as well as construct a “comet”.
55

• Goals: to discuss asteroids and comets; create impact craters; build a cometand test its strength and reaction to light
• Materials: A variety of items supplied by your TA
4.2 Asteroids and Comets
There are two main types of objects in the solar system that represent left overmaterial from its formation: asteroids and comets. In fact, both objects are quitesimilar, their differences arise from the fact that comets are formed from materiallocated in the most distant parts of our solar system, where it is very cold, andthus they have large quantities of frozen water and other frozen liquids and gases.Asteroids formed closer-in than comets, and are denser, being made-up of the sametypes of rocks and minerals as the terrestrial planets (Mercury, Venus, Earth, andMars). Asteroids are generally just large rocks, as shown in the figure, below.
Figure 4.1: Four large asteroids. Note that these asteroids have craters from theimpacts of even smaller asteroids!
The first asteroid, Ceres, was discovered in 1801 by the Italian astronomer Piazzi.Ceres is the largest of all asteroids, and has a diameter of 933 km (the Moon has adiameter of 3,476 km). There are now more than 40,000 asteroids that have beendiscovered, ranging in size from Ceres, all the way down to large rocks that are justa few hundred meters across. It has been estimated that there are at least 1 millionasteroids in the solar system with diameters of 1 km or more. Most asteroids areharmless, and spend all of their time in orbits between those of Mars and Jupiter(the so-called “asteroid belt”, see Figure 4.2). Some asteroids, however, are in orbits
56

Figure 4.2: The Asteroid Belt.
that take them inside that of the Earth, and could potentially collide with the Earth,causing a great catastrophe for human life. It is now believed that the impact of alarge asteroid might have been the cause for the extinction of the dinosaurs when itscollision threw up a large cloud of dust that caused the Earth’s climate to dramaticallycool. Several searches are underway to insure that we can identify future “doomsday”asteroids so that we have a chance to prepare for a collision–as the Earth will somedaybe hit by another large asteroid.
4.3 Comets
Comets represent some of the earliest material left over from the formation of the solarsystem, and are therefore of great interest to planetary astronomers. They can also bebeautiful objects to observe in the night sky, unlike their darker and less spectacularcousins, asteroids. They therefore often capture the attention of the public.
4.4 Composition and Components of a Comet
Comets are composed of ices (water ice and other kinds of ices), gases (carbon dioxide,carbon monoxide, hydrogen, hydroxyl, oxygen, and so on), and dust particles (carbonand silicon). The dust particles are smaller than the particles in cigarette smoke. Ingeneral, the model for a comet’s composition is that of a “dirty snowball.”
Comets have several components that vary greatly in composition, size, and bright-ness. These components are the following:
57

• nucleus: made of ice and rock, roughly 5-10 km across
• coma: the “head” of a comet, a large cloud of gas and dust, roughly 100,000km in diameter
• gas tail: straight and wispy; gas in the coma becomes ionized by sunlight, andgets carried away by the solar wind to form a straight blueish “ion” tail. Theshape of the gas tail is influenced by the magnetic field in the solar wind. Gastails are pointed in the direction directly opposite the sun, and can extend 108
km.
• dust tail: dust is pushed outward by the pressure of sunlight and forms a long,curving tail that has a much more uniform appearance than the gas tail. Thedust tail is pointed in the direction directly opposite the comet’s direction ofmotion, and can also extend 108 km from the nucleus.
These various components of a comet are shown in the diagram, below.
Figure 4.3: The main components of a comet.
4.5 Types of Comets
Comets originate from two primary locations in the solar system. One class of comets,called the long-period comets, have long orbits around the sun with periods of >200 years. Their orbits are random in shape and inclination, with long-period cometsentering the inner solar system from all different directions. These comets are thoughtto originate in the Oort cloud, a spherical cloud of icy bodies that extends from ∼20,000 – 150,000 AU from the Sun. Some of these objects might experience only one
58

close approach to the Sun and then leave the solar system (and the Sun’s gravitationalinfluence) completely.
Figure 4.4: The Oort cloud.
In contrast, the short-period comets have periods less than 200 years, and theirorbits are all roughly in the plane of the solar system. Comet Halley has a 76-yearperiod, and therefore is considered a short-period comet. Comets with orbital periods< 100 years do not get much beyond Pluto’s orbit at their farthest distance from theSun. Short-period comets cannot survive many orbits around the Sun before theirices are all melted away. It is thought that these comets originate in the KuiperBelt, a belt of small icy bodies beyond the large gas giant planets and in the planeof the solar system. Quite a few large Kuiper Belt objects have now been discovered,including one (Eris) that is about the same size as Pluto.
Figure 4.5: The Kuiper Belt.
59

4.6 The Impacts of Asteroids and Comets
Objects orbiting the Sun in our solar system do so at a variety of speeds that directlydepends on how far they are from the Sun. For example, the Earth’s orbital velocityis 30 km/s (65,000 mph!). Objects further from the Sun than the Earth move moreslowly, objects closer to the Sun than the Earth move more quickly. Note that aster-oids and comets near the Earth will have space velocities similar to the Earth, butin (mostly) random directions, thus a collision could occur with a relative speed ofimpact of nearly 60 km/s! How fast is this? Note that the highest muzzle velocityof any handheld rifle is 1,220 m/s = 1.2 km/s. Thus, the impact of any solar systembody with another is a true high speed collision that releases a large amount of energy.For example, an asteroid the size of a football field that collides with the Earth witha velocity of 30 km/s releases as much energy as one thousand atomic bombs the sizeof that dropped on Japan during World War II (the Hiroshima bomb had a “yield”of 13 kilotons of TNT). Since the equation for kinetic energy (the energy of motion)is K.E. = 1/2(mv2), the energy scales directly as the mass, and mass goes as the cubeof the radius (mass = density × Volume = density × R3). A moving object with tentimes the radius of another traveling at the same velocity has 1,000 times the kineticenergy. It is this kinetic energy that is released during a collision.
4.7 Exercise #1: Creating Impact Craters
To create impact craters, we will be dropping steel ball bearings into a containerfilled with ordinary baking flour. There are two sizes of balls, one that is twice asmassive as the other. You will drop both of these balls from three different heights(0.5 meters, 1 meters, and 2 meters), and then measure the size of the impact craterthat they produce. Then on graph paper, you will plot the size of the impact craterversus the speed of the impacting ball.
1. Have one member of your lab group take the meter stick, while another takesthe smaller ball bearing.
2. Take the plastic tub that is filled with flour, and place it on the floor.
3. Make sure the flour is uniformly level (shake or comb the flour smooth)
4. Carefully hold the meter stick so that it is just touching the top surface of theflour.
5. The person with the ball bearing now holds the ball bearing so that it is locatedexactly one half meter (50 cm) above the surface of the flour.
6. Drop the ball bearing into the center of the flour-filled tub.
60

7. Use the magnet to carefully extract the ball bearing from the flour so as tocause the least disturbance.
8. Carefully measure the diameter of the crater caused by this impact, and placeit in the data table, below.
9. Repeat the experiment for heights of 1 meter and 2 meters using the smaller ballbearing (note that someone with good balance might have to carefully stand ona chair or table to get to a height of two meters!).
10. Now repeat the entire experiment using the larger ball bearing. Record all ofthe data in the data table.
Height Crater diameter Crater diameter Impact velocity(meters) (cm) Ball #1 (cm) Ball #2 (m/s)0.51.02.0
Now it is time to fill in that last column: Impact velocity (m/s). How can wedetermine the impact velocity? The reason the ball falls in the first place is because ofthe pull of the Earth’s gravity. This force pulls objects toward the center of the Earth.In the absence of the Earth’s atmosphere, an object dropped from a great height abovethe Earth’s surface continues to accelerate to higher, and higher velocities as it falls.We call this the “acceleration” of gravity. Just like the accelerator on your car makesyour car go faster the more you push down on it, the force of gravity acceleratesbodies downwards (until they collide with the surface!).
We will not derive the equation here, but we can calculate the velocity of a fallingbody in the Earth’s gravitational field from the equation v = (2ay)1/2. In this equa-tion, “y” is the height above the Earth’s surface (in the case of this lab, it is 0.5, 1,and 2 meters). The constant “a” is the acceleration of gravity, and equals 9.80 m/s2.The exponent of 1/2 means that you take the square root of the quantity inside theparentheses. For example, if y = 3 meters, then v = (2 × 9.8 × 3)1/2, or v = (58.8)1/2
= 7.7 m/s.
1. Now plot the data you have just collected on graph paper. Put the impact velocityon the x axis, and the crater diameter on the y axis. (10 points)
61

4.7.1 Impact crater questions
1. Describe your graph, can the three points for each ball be approximated by a singlestraight line? How do your results for the larger ball compare to that for the smallerball? (3 points)
2. If you could drop both balls from a height of 4 meters, how big would their cratersbe?(2 points)
3. What is happening here? How does the mass/size of the impacting body effectyour results. How does the speed of the impacting body effect your results? Whathave you just proven? (5 points)
4.8 Crater Illumination
Now, after your TA has dimmed the room lights, have someone take the flashlightout and turn it on. If you still have a crater in your tub, great, if not create one (anyheight more than 1 meter is fine). Extract the ball bearing.
1. Now, shine the flashlight on the crater from straight over top of the crater. Describe
62

what you see. (2 points)
2. Now, hold the flashlight so that it is just barely above the lip of the tub, so thatthe light shines at a very oblique angle (like that of the setting Sun!). Now, what doyou see?(2 points)
3. When is the best time to see fine surface detail on a cratered body, when it is noon(the Sun is almost straight overhead), or when it is near “sunset”? [Confirm this atthe observatory sometime this semester!] (1 point)
4.9 Exercise #2: Building a Comet
In this portion of the lab, you will actually build a comet out of household materials.These include water, ammonia, potting soil, and dry ice (CO2 ice). Be sure to dis-tribute the work evenly among all members of your group. Follow these directions:(12 points)
1. Use a freezer bag to line the bottom of your bucket.
2. Place 1 cup of water in the bag/bucket.
3. Add 2 spoonfuls of sand, stirring well. (NOTE: Do not stir so hard that yourip the freezer bag lining!!)
4. Add a dash of ammonia.
63

5. Add a dash of organic material (potting soil). Stir until well-mixed.
6. Your TA will place a block or chunk of dry ice inside a towel and crush theblock with the mallet and give you some crushed dry ice.
7. Add 1 cup of crushed dry ice to the bucket, while stirring vigorously. (NOTE:Do not stir so hard that you rip the freezer bag!!)
8. Continue stirring until mixture is almost frozen.
9. Lift the comet out of the bucket using the plastic liner and shape it for a fewseconds as if you were building a snowball (use gloves!).
10. Add 1/2 cup water and wait until mixture is frozen.
11. Unwrap the comet once it is frozen enough to hold its shape.
4.9.1 Comets and Light
Observe the comet as it is sitting on a desk. Make note of some of its physicalcharacteristics, for example:
• shape
• color
• smell
Now bring the comet over to the light source (overhead projector) and place it ontop. Observe what happens to the comet.
4.9.2 Comet Strength
Comets, like all objects in the solar system, are held together by their internalstrength. If they pass too close to a large body, such as Jupiter, their internal strengthis not large enough to compete with the powerful gravity of the massive body. In suchencounters, a comet can be broken apart into smaller pieces. In 1994, we saw evidenceof this when Comet Shoemaker-Levy/9 impacted into Jupiter. In 1992, that cometpassed very close to Jupiter and was fragmented into pieces. Two years later, morethan 21 cometary fragments crashed into Jupiter’s atmosphere, creating spectacular(but temporary) “scars” on Jupiter’s cloud deck.
64

Figure 4.6: The Impact of ”Fragment K” of Comet Shoemaker-Levy/9 with Jupiter.
Question: Do you think comets have more or less internal strength than asteroids,which are composed primarily of rock? [Hint: If you are playing outside with yourfriends in a snow storm, would you rather be hit with a snowball or a rock?]
Exercise: After everyone in your group has carefully examined your comet, it is timeto say goodbye. Take a sample rock and your comet, go outside, and drop them bothon the sidewalk. What happened to each object? (2 points)
65

4.9.3 Comet Questions
1. Draw a comet and label all of its components. Be sure to indicate the directionthe Sun is in, and the comet’s direction of motion. (8 points)
2. What are some differences between long-period and short-period comets? Doesit make sense that they are two distinct classes of objects? Why or why not?(5 points)
3. List some properties of the comet you built. In particular, describe its shape,color, smell and weight relative to other common objects (e.g. tennis ball,regular snow ball, etc.). (4 points)
4. Describe what happened when you put your comet near the light source. Werethere localized regions of activity, or did things happen uniformly to the entire
66

comet? (3 points)
5. If a comet is far away from the Sun and then it draws nearer as it orbits theSun, what would you expect to happen? (3 points)
6. Which object do you think has more internal strength, an asteroid or a comet,and why? (3 points)
67

4.10 Summary
(35 points) Summarize the important ideas covered in this lab. Questions you maywant to consider are:
• How does the mass of an impacting asteroid or comet affect the size of an impactcrater?
• How does the speed of an impacting asteroid or comet affect the size of animpact crater?
• Why are comets important to planetary astronomers?
• What can they tell us about the solar system?
• What are some components of comets and how are they affected by the Sun?
• How are comets different from asteroids?
Use complete sentences, and proofread your summary before handing in the lab.
4.11 Possible Quiz Questions
1. What is the main difference between comets and asteroids, and why are theydifferent?
2. What is the Oort cloud and the Kuiper belt?
3. What happens when a comet or asteroid collides with the Moon?
4. How does weather effect impact features on the Earth?
5. How does the speed of the impacting body effect the energy of the collision?
4.12 Extra Credit (ask your TA for permission be-
fore attempting, 5 points)
On the 15th of February, 2013, a huge meteorite exploded in the skies over Chelyabinsk,Russia. Write-up a small report about this event, including what might have hap-pened if instead of a grazing, or “shallow”, entry into our atmosphere, the meteorhad plowed straight down to the surface.
68

Name:
Lab 5
Introduction to the Geology of theTerrestrial Planets
5.1 Introduction
There are two main families of planets in our solar system: the Terrestrial planets(Earth, Mercury, Venus, and Mars), and the Jovian Planets (Jupiter, Saturn, Uranus,and Neptune). The terrestrial planets are rocky planets that have properties similarto that of the Earth. In contrast, the Jovian planets are giant balls of gas. Table5.1 summarizes the main properties of the planets in our solar system (Pluto is anoddball planet that does not fall into either categories, sharing many properties withthe “Kuiper belt” objects discussed in Lab #3).
It is clear from Table 5.1 that the nine planets in our solar system span a considerablerange in sizes and masses. For example, the Earth has 18 times the mass of Mercury,while Jupiter has 318 times the mass of the Earth. But the separation of the planetsinto Terrestrial and Jovian is not based on their masses or physical sizes, it is basedon their densities (the last column in the table). What is density? Density is simplythe mass of an object divided by its volume: M/V. In the metric system, the densityof water is set to 1.00 gm/cm3. Densities for some materials you are familiar withcan be found in Table 5.2.
If we examine the first table we see that the terrestrial planets all have higher densitiesthan the Jovian planets. Mercury, Venus and Earth have densities above 5 gm/cm3,while Mars has a slightly lower density (∼ 4 gm/cm3). The Jovian planets have
69

Table 5.1: The Properties of the Planets
Planet Mass Radius Density(Earth Masses) (Earth Radii) gm/cm3
Mercury 0.055 0.38 5.5Venus 0.815 0.95 5.2Earth 1.000 1.00 5.5Mars 0.107 0.53 3.9Jupiter 318 10.8 1.4Saturn 95 9.0 0.7Uranus 14.5 3.93 1.3Neptune 17.2 3.87 1.6Pluto 0.002 0.178 2.1
Table 5.2: The Densities of Common Materials
Element or Density Element DensityMolecule gm/cm3 gm/cm3
Water 1.0 Carbon 2.3Aluminum 2.7 Silicon 2.3
Iron 7.9 Lead 11.3Gold 19.3 Uranium 19.1
densities very close to that of water–in fact, the mean density of Saturn is lower thanthat of water! The density of a planet gives us clues about its composition. If we lookat the table of densities for common materials, we see that the mean densities of theterrestrial planets are about halfway between those of silicon and iron. Both of theseelements are highly abundant throughout the Earth, and thus we can postulate thatthe terrestrial planets are mostly composed of iron, silicon, with additional elementslike carbon, oxygen, aluminum and magnesium. The Jovian planets, however, mustbe mostly composed of lighter elements, such as hydrogen and helium. In fact, theJovian planets have similar densities to that of the Sun: 1.4 gm/cm3. The Sun is70% hydrogen, and 28% helium. Except for small, rocky cores, the Jovian planetsare almost nothing but hydrogen and helium.The terrestrial planets share other properties, for example they all rotate much more
slowly than the Jovian planets. They also have much thinner atmospheres than theJovian planets (which are almost all atmosphere!). Today we want to investigate thegeologies of the terrestrial planets to see if we can find other similarities, or identifyinteresting differences.
70

5.2 Topographic Map Projections
In the first part of this lab we will take a look at images and maps of the surfaces ofthe terrestrial planets for comparison. But before we do so, we must talk about whatyou will be viewing, and how these maps/images were produced. As you probablyknow, 75% of the Earth’s surface is covered by oceans, thus a picture of the Earthfrom space does not show very much of the actual rocky surface (the “crust” of theEarth). With modern techniques (sonar, radar, etc.) it is possible to reconstructthe true shape and structure of a planet’s rocky surface, whether it is covered inwater, or by very thick clouds (as is the case for Venus). Such maps of the “relief”of the surface of a planet are called topographic maps. These maps usually colorcode, or have contours, showing the highs and lows of the surface elevations. Regionsof constant elevation above (or below) sea level all will have the same color. Thisway, large structures such as mountain ranges, or ocean basins, stand out very clearly.
There are several ways to present topographic maps, and you will see two versions to-day. One type of map is an attempt at a 3D visualization that keeps the relative sizesof the continents in correct proportion (see Figure 5.1, below). But such maps onlyallow you to see a small part of a spherical planet in any one plot. More commonly,the entire surface of the planet is presented as a rectangular map as shown in Figure5.2. Because the surface of a sphere cannot be properly represented as a rectangle,the regions near the north and south poles of a planet end up being highly distortedin this kind of map. So keep this in mind as you work through the exercises in this lab.
Figure 5.1: A topographic map showing one hemisphere of Earth centered on NorthAmerica. In this 3D representation the continents are correctly rendered.
71

Figure 5.2: A topographic map showing the entire surface of the Earth. In this 2Drepresentation, the continents are incorrectly rendered. Note that Antarctica (theland mass that spans the bottom border of this map) is 50% smaller than NorthAmerica, but here appears massive. You might also be able to compare the size ofGreenland on this map, to that of the previous map.
5.3 Global Comparisons
In the first part of this lab exercise, you will look at the planets in a global sense, bycomparing the largest structures on the terrestrial planets.
Exercise #1: At station #1 you will find images of Mercury, Venus, the Earth, theMoon, and Mars. The images for Mercury, Venus and the Earth and Moon are in“false colors” to help emphasize different features, including different types of rocksor large-scale structures. The image of Mars, however, is in “true color”.
Impact craters can come in a variety of sizes, from tiny little holes, all the way up tothe large “maria” seen on the Moon. Impact craters are usually round.
1. On which of the five objects are large meteorite impact craters obvious? (1point)
2. Does Venus or the Earth show any signs of large, round maria (like those seen onMercury or the Moon)? (1 point)
72

3. Which planet seems to have the most impact craters? (1 point)
4. Compare the surface of Mercury to the Moon. Are they similar? (3 points)
Mercury is the planet closest to the Sun, so it is the terrestrial planet that gets hitby comets, asteroids and meteoroids more often than the other planets because theSun’s gravity tends to collect small bodies like comets and asteroids. The closer youare to the Sun, the more of these objects there are in the neighborhood. Over time,most of the largest asteroids on orbits that intersect those of the other planets haveeither collided with a planet, or have been broken into smaller pieces by the gravityof a close approach to a large planet. Thus, only smaller debris is left over to causeimpact craters.
5. Using the above information, make an educated guess on why Mercury does nothave as many large maria as the Moon, even though both objects have been aroundfor the same amount of time. [Hint: Maria are caused by the impacts of largebodies.] (3 points)
Mercury and the Moon do not have atmospheres, while Mars has a thin atmosphere.Venus has the densest atmosphere of the terrestrial planets.
6. Does the presence of an atmosphere appear to reduce the number of impactcraters? Justify your answer. (3 points)
73

Exercise #2: Topography of Mercury, Venus, Earth, and Mars. At station #2 youwill find topographic maps of Mercury, Venus, the Earth, and Mars. The data forMercury has not been fully published, so we only have topographic maps for about25% of its surface. These maps are color-coded to help you determine the highestand lowest parts of each planet. You can determine the elevation of a color-codedfeature on these maps by using the scale found on each map. [Note that for theEarth and Mars, the scales of these maps are in meters, for Mercury it is in km (=1,000 meters), while for Venus it is in planetary radius! But the scale for Venus isthe same as for Mars, so you can use the scale on the Mars map to examine Venus.]
7. Which planet seems to have the least amount of relief (relief = high and lowspots/features)? (2 points)
8. Which planet seems to have the deepest/lowest regions? (2 points)
9. Which planet seems to have the highest mountains? (2 points)
On both the Venus and Mars topographic maps, the polar regions are plotted asseparate circular maps so as to reduce distortion.
10. Looking at these polar plots, Mars appears to be a very strange planet.Compare the elevations of the northern and southern hemispheres of Mars. If Marshad an abundance of surface water (oceans), what would the planet look like? (3points)
74
5.4 Detailed Comparison of the Surfaces of the
Terrestrial Planets
In this section we will compare some of the smaller surface features of the terrestrialplanets using a variety of close-up images. In the following, the images of features onVenus have been made using radar (because the atmosphere of Venus is so cloudy,we cannot see its surface). While these images look similar to the pictures for theother planets, they differ in one major way: in radar, smooth objects reflect the radiowaves differently than rough objects. In the radar images of Venus, the rough areasare “brighter” (whiter) than smooth areas.
In the Moon lab, we discussed how impact craters form. For large impacts, the centerof the crater may “rebound” and produce a central mountain (or several small peaks).Sometimes an impact is large enough to crack the surface of the planet, and lava flowsinto the crater filling it up, and making the floor of the crater smooth. On the Earth,water can also collect in a crater, while on Mars it might collect large quantities ofdust.
Exercise #3: Impact craters on the terrestrial planets. At station #3 you will findclose-up pictures of the surfaces of the terrestrial planets showing impact craters.
11. Compare the impact craters seen on Mercury, Venus, Earth, and Mars. How arethey alike, how are they different? Are central mountain peaks common to craterson all planets? Of the sets of craters shown, does one planet seem to have morelava-filled craters than the others? (4 points)
75

12. Which planet has the sharpest, roughest, most detailed and complex craters?[Hint: details include ripples in the nearby surface caused by the crater formation,as well as numerous small craters caused by large boulders thrown out of the biggercrater. Also commonly seen are “ejecta blankets” caused by material thrown out ofthe crater that settles near its outer edges.] (2 points)
13. Which planet has the smoothest, and least detailed craters? (2 points)
14. What is the main difference between the planet you identified in question #12and that in question #13? [Hint: what processes help erode craters?] (2 points)
You have just examined four different craters found on the Earth: Berringer, WolfeCreek, Mistastin Lake, and Manicouagan. Because we can visit these craters we canaccurately determine when they were formed. Berringer is the youngest crater withan age of 49,000 years. Wolf Creek is the second youngest at 300,000 years. MistastinLake formed 38 million years ago, while Manicouagan is the oldest, easily identifiedcrater on the surface of the Earth at 200 million years old.
76

15. Describe the differences between young and old craters on the Earth. Whathappens to these craters over time? (4 points)
5.5 Erosion Processes and Evidence for Water
Geological erosion is the process of the breaking down, or the wearing-away of surfacefeatures due to a variety of processes. Here we will be concerned with the two mainerosion processes due to the presence of an atmosphere: wind erosion, and watererosion. With daytime temperatures above 700oF, both Mercury and Venus are toohot to have liquid water on their surfaces. In addition, Mercury has no atmosphereto sustain water or a wind. Interestingly, Venus has a very dense atmosphere, but asfar as we can tell, very little wind erosion occurs at the surface. This is probably dueto the incredible pressure at the surface of Venus due to its dense atmosphere: theatmospheric pressure at the surface of Venus is 90 times that at the surface of theEarth–it is like being 1 km below the surface of an Earth ocean! Thus, it is probablyhard for strong winds to blow near the surface, and there are probably only gentlewinds found there, and these do not seriously erode surface features. This is not truefor the Earth or Mars.
On the surface of the Earth it is easy to see the effects of erosion by wind. Forresidents of New Mexico, we often have dust storms in the spring. During theseevents, dust is carried by the wind, and it can erode (“sandblast”) any surface itencounters, including rocks, boulders and mountains. Dust can also collect in cracks,arroyos, valleys, craters, or other low, protected regions. In some places, such asat the White Sands National Monument, large fields of sand dunes are created bywind-blown dust and sand. On the Earth, most large dunefields are located in aridregions.
Exercise #4: Evidence for wind blown sand and dust on Earth and Mars. Atstation #4 you will find some pictures of the Earth and Mars highlighting dunefields.
16. Do the sand dunes of Earth and Mars appear to be very different? Do you thinkyou could tell them apart in black and white photos? Given that the atmosphere ofMars is only 1% of the Earth’s, what does the presence of sand dunes tell you aboutthe winds on Mars? (3 points)
77

Exercise #5: Looking for evidence of water on Mars. In this exercise, we willclosely examine geological features on Earth caused by the erosion action of water.We will then compare these to similar features found on Mars. The photos arefound at Station #5.
As you know, water tries to flow “down hill”, constantly seeking the lowestelevation. On Earth most rivers eventually flow into one of the oceans. In aridregions, however, sometimes the river dries up before reaching the ocean, or it endsin a shallow lake that has no outlet to the sea. In the process of flowing down hill,water carves channels that have fairly unique shapes. A large river usually has anextensive, and complex drainage pattern.
17. The drainage pattern for streams and rivers on Earth has been termed“dendritic”, which means “tree-like”. In the first photo at this station (#23) is adendritic drainage pattern for a region in Yemen. Why was the term dendritic usedto describe such drainage patterns? Describe how this pattern is formed. (3 points)
18. The next photo (#24) is a picture of a sediment-rich river (note the brownwater) entering a rather broad and flat region where it becomes shallow and spreadsout. Describe the shapes of the “islands” formed by this river. (3 points)
In the next photo (#25) is a picture of the northern part of the Nile river as itpasses through Egypt. The Nile is 4,184 miles from its source to its mouth on the
78

Mediterranean sea. It is formed in the highlands of Uganda and flows North, downhill to the Mediterranean. Most of Egypt is a very dry country, and there are nomajor rivers that flow into the Nile, thus there is no dendritic-like pattern to the Nilein Egypt. [Note that in this image of the Nile, there are several obvious dams thathave created lakes and reservoirs.]
19. Describe what you see in this image from Mars (Photo #26). (2 points)
20. What is going on in this photo (#27)? How were these features formed? Whydo the small craters not show the same sort of “teardrop” shapes? (2 points)
21. Here are some additional images of features on Mars. The second one (Photo#29) is a close-up of the region delineated by the white box seen in Photo #28.Compare these to the Nile. (2 points)
22. While Mars is dry now, what do you conclude about its past? Justify youranswer. What technique can we use to determine when water might have flowed in
79

Mars’ past? [Hint: see your answer for #20.] (4 points)
5.6 Volcanoes and Tectonic Activity
While water and wind-driven erosion is important in shaping the surface of a planet,there are other important events that can act to change the appearance of a planet’ssurface: volcanoes, earthquakes, and plate tectonics. The majority of the volcanicand earthquake activity on Earth occurs near the boundaries of large slabs of rockcalled “plates”. As shown in Figure 5.3, the center of the Earth is very hot, and thisheat flows from hot to cold, or from the center of the Earth to its surface (and intospace). This heat transfer sets up a boiling motion in the semi-molten mantle of theEarth.
As shown in the next figure (Fig. 5.4), in places where the heat rises, we get anup-welling of material that creates a ridge that forces the plates apart. We also getvolcanoes at these boundaries. In other places, the crust of the Earth is pulled downinto the mantle in what is called a subduction zone. Volcanoes and earthquakes arealso common along subduction zone boundaries. There are other sources of earth-quakes and volcanoes which are not directly associated with plate tectonic activity.For example, the Hawaiian islands are all volcanoes that have erupted in the mid-dle of the Pacific plate. The crust of the Pacific plate is thin enough, and there issufficiently hot material below, to have caused the volcanic activity which createdthe chain of islands called Hawaii. In the next exercise we will examine the otherterrestrial planets for evidence of volcanic and plate tectonic activity.
80

Figure 5.3: A cut-away diagram of the structure of the Earth showing the hot core,the mantle, and the crust. The core of the Earth is very hot, and is composed ofboth liquid and solid iron. The mantle is a zone where the rocks are partially melted(“plastic-like”). The crust is the cold, outer skin of the Earth, and is very thin.
81

Figure 5.4: The escape of the heat from the Earth’s core sets-up a boiling motionin the mantle. Where material rises to the surface it pushes apart the plates andvolcanoes, and mountain chains are common. Where the material is cooling, it flowsdownwards (subsides) back into the mantle pulling down on the plates (“slab-pull’).This is how the large crustal plates move around on the Earth’s surface.
Exercise #6: Using the topographical maps from station #2, we will see if youcan identify evidence for plate tectonics on the Earth. Note that plates have fairlydistinct boundaries, usually long chains of mountains are present where two plateseither are separating (forming long chains of volcanoes), or where two plates runinto each other creating mountain ranges. Sometimes plates fracture, creating fairlystraight lines (sometimes several parallel features are created). The remaining photoscan be found at Station #6.
23. Identify and describe several apparent tectonic features on the topographic mapof the Earth. [Hint: North and South America are moving away from Europe andAfrica]. (2 points)
24. Now, examine the topographic maps for Mars and Venus (ignoring the grey
82

areas that are due to a lack of spacecraft data). Do you see any evidence for largescale tectonic activity on either Mars or Venus?(3 points)
The fact that there is little large-scale tectonic activity present on the surfaces of eitherMars or Venus today does not mean that they never had any geological activity. Letus examine the volcanoes found on Venus, Earth and Mars. The first set of imagescontain views of a number of volcanoes on Earth. Several of these were producedusing space-based radar systems carried aboard the Space Shuttle. In this way, theybetter match the data for Venus. There are a variety of types of volcanoes on Earth,but there are two main classes of large volcanoes: “shield” and “composite”. Shieldvolcanoes are large, and have very gentle slopes. They are caused by low-viscosity lavathat flows easily. They usually are rather flat on top, and often have a large “caldera”(summit crater). Composite volcanoes are more explosive, smaller, and have steepersides (and “pointier” tops). Mount St. Helens is one example of a composite volcano,and is the first picture (Photo #31) at this station (note that the apparent craterat the top of St. Helens is due to the 1980 eruption that caused the North side ofthe volcano to collapse, and the field of devastation that emanates from there). Thenext two pictures are also of composite volcanoes while the last three are of the shieldvolcanoes Hawaii, Isabela and Miakijima (the last two in 3D).
25. Here are some images of Martian volcanoes (Photos #37 to #41). What onetype of volcano does Mars have? How did you arrive at this answer? (3 points)
26. In the next set (Photos #42 to #44) are some false-color images of Venusianvolcanoes. Among these are both overhead shots, and 3D images. Because Venus
83

was mapped using radar, we can reconstruct the data to create images as if we werelocated on, or near, the surface of Venus. Note, however, that the vertical elevationdetail has been exaggerated by a factor of ten! It might be hard to tell, but Venus isalso dominated by one main type of Volcano, what is it? (3 points)
84

5.7 Summary (35 points)
As we have seen, many of the geological features common to the Earth can be foundon the other terrestrial planets. Each planet, however, has its own peculiar geology.For example, Venus has the greatest number of volcanoes of any of the terrestrialplanets, while Mars has the biggest volcanoes. Only the Earth seems to have activeplate tectonics. Mercury appears to have had the least amount of geological activityin the solar system and, in this way, is quite similar to the Moon. Mars and theEarth share something that none of the other planets in our solar system do: erosionfeatures due to liquid water. This, of course, is why there continues to be interest insearching for life (either alive or extinct) on Mars.
• Describe the surfaces of each of the terrestrial planets, and the most importantgeological forces that have shaped their surfaces.
• Of the four terrestrial planets, which one seems to be the least interesting? Canyou think of one or more reasons why this planet is so inactive?
• If you were in charge of searching for life on Mars, where would you want tobegin your search?
5.8 Possible Quiz Questions
1. What are the main differences between Terrestrial and Jovian planets?2. What is density?3. How are impact craters formed?4. What is a topographic map?
5.9 Extra Credit (ask your TA for permission be-
fore attempting, 5 points)
Since Mars currently has no large bodies of water, what is probably the most impor-tant erosion process there? How can we tell? What is the best way to observe ormonitor this type of erosion? Researching the images from the several small landersand some of the orbiting missions, is there strong evidence for this type of erosion?What is that evidence?
85

86

Name:
Lab 6
Kepler’s Laws and Gravitation
6.1 Introduction
Throughout human history, the motion of the planets in the sky was a mystery: whydid some planets move quickly across the sky, while other planets moved very slowly?Even two thousand years ago it was apparent that the motion of the planets was verycomplex. For example, Mercury and Venus never strayed very far from the Sun, whilethe Sun, the Moon, Mars, Jupiter and Saturn generally moved from the west to theeast against the background stars (at this point in history, both the Moon and theSun were considered “planets”). The Sun appeared to take one year to go aroundthe Earth, while the Moon only took about 30 days. The other planets moved muchmore slowly. In addition to this rather slow movement against the background starswas, of course, the daily rising and setting of these objects. How could all of thesemotions occur? Because these objects were important to the cultures of the time,even foretelling the future using astrology, being able to predict their motion wasconsidered vital.
The ancient Greeks had developed a model for the Universe in which all of the planetsand the stars were each embedded in perfect crystalline spheres that revolved aroundthe Earth at uniform, but slightly different speeds. This is the “geocentric”, or Earth-centered model. But this model did not work very well–the speed of the planet acrossthe sky changed. Sometimes, a planet even moved backwards! It was left to theEgyptian astronomer Ptolemy (85 − 165 AD) to develop a model for the motion ofthe planets (you can read more about the details of the Ptolemaic model in yourtextbook). Ptolemy developed a complicated system to explain the motion of theplanets, including “epicycles” and “equants”, that in the end worked so well, that noother models for the motions of the planets were considered for 1500 years! While
87

Ptolemy’s model worked well, the philosophers of the time did not like this model–their Universe was perfect, and Ptolemy’s model suggested that the planets moved inpeculiar, imperfect ways.
In the 1540’s Nicholas Copernicus (1473 − 1543) published his work suggesting thatit was much easier to explain the complicated motion of the planets if the Earthrevolved around the Sun, and that the orbits of the planets were circular. WhileCopernicus was not the first person to suggest this idea, the timing of his publicationcoincided with attempts to revise the calendar and to fix a large number of errorsin Ptolemy’s model that had shown up over the 1500 years since the model was firstintroduced. But the “heliocentric” (Sun-centered) model of Copernicus was slow towin acceptance, since it did not work as well as the geocentric model of Ptolemy.
Johannes Kepler (1571 − 1630) was the first person to truly understand how theplanets in our solar system moved. Using the highly precise observations by TychoBrahe (1546 − 1601) of the motions of the planets against the background stars,Kepler was able to formulate three laws that described how the planets moved. Withthese laws, he was able to predict the future motion of these planets to a higherprecision than was previously possible. Many credit Kepler with the origin of modernphysics, as his discoveries were what led Isaac Newton (1643 − 1727) to formulatethe law of gravity. Today we will investigate Kepler’s laws and the law of gravity.
6.2 Gravity
Gravity is the fundamental force governing the motions of astronomical objects. Noother force is as strong over as great a distance. Gravity influences your everyday life(ever drop a glass?), and keeps the planets, moons, and satellites orbiting smoothly.Gravity affects everything in the Universe including the largest structures like superclusters of galaxies down to the smallest atoms and molecules. Experimenting withgravity is difficult to do. You can’t just go around in space making extremely massiveobjects and throwing them together from great distances. But you can model avariety of interesting systems very easily using a computer. By using a computerto model the interactions of massive objects like planets, stars and galaxies, we canstudy what would happen in just about any situation. All we have to know are theequations which predict the gravitational interactions of the objects.
The orbits of the planets are governed by a single equation formulated by Newton:
Fgravity =GM1M2
R2(6.1)
A diagram detailing the quantities in this equation is shown in Fig. 6.1. Here Fgravity
is the gravitational attractive force between two objects whose masses are M1 and M2.
88
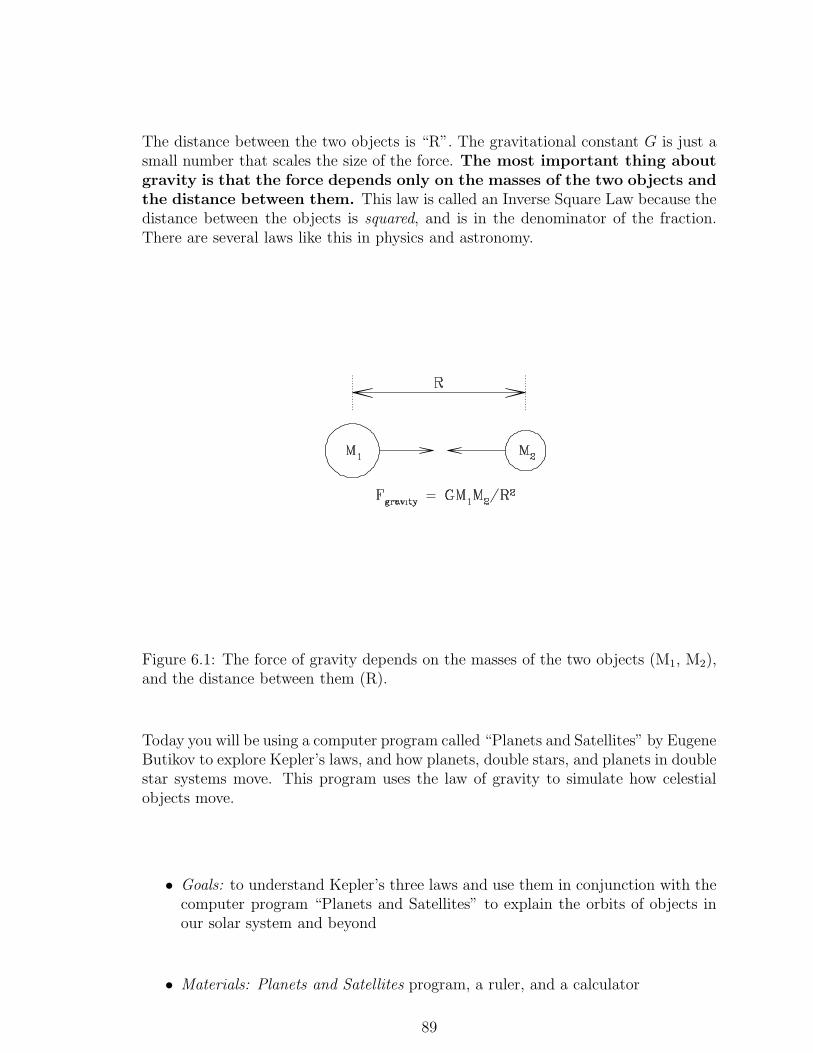
The distance between the two objects is “R”. The gravitational constant G is just asmall number that scales the size of the force. The most important thing aboutgravity is that the force depends only on the masses of the two objects andthe distance between them. This law is called an Inverse Square Law because thedistance between the objects is squared, and is in the denominator of the fraction.There are several laws like this in physics and astronomy.
Figure 6.1: The force of gravity depends on the masses of the two objects (M1, M2),and the distance between them (R).
Today you will be using a computer program called “Planets and Satellites” by EugeneButikov to explore Kepler’s laws, and how planets, double stars, and planets in doublestar systems move. This program uses the law of gravity to simulate how celestialobjects move.
• Goals: to understand Kepler’s three laws and use them in conjunction with thecomputer program “Planets and Satellites” to explain the orbits of objects inour solar system and beyond
• Materials: Planets and Satellites program, a ruler, and a calculator
89

6.3 Kepler’s Laws
Before you begin the lab, it is important to recall Kepler’s three laws, the basic de-scription of how the planets in our Solar System move. Kepler formulated his threelaws in the early 1600’s, when he finally solved the mystery of how planets moved inour Solar System. These three (empirical) laws are:
I. “The orbits of the planets are ellipses with the Sun at one focus.”
II. “A line from the planet to the Sun sweeps out equal areas in equal intervalsof time.”
III. “A planet’s orbital period squared is proportional to its average distance fromthe Sun cubed: P2 ∝ a3”
Let’s look at the first law, and talk about the nature of an ellipse. What is an ellipse?An ellipse is one of the special curves called a “conic section”. If we slice a planethrough a cone, four different types of curves can be made: circles, ellipses, parabolas,and hyperbolas. This process, and how these curves are created is shown in Fig. 6.2.
Figure 6.2: Four types of curves can be generated by slicing a cone with a plane: acircle, an ellipse, a parabola, and a hyperbola. Strangely, these four curves are alsothe allowed shapes of the orbits of planets, asteroids, comets and satellites!
Before we describe an ellipse, let’s examine a circle, as it is a simple form of anellipse. As you are aware, the circumference of a circle is simply 2πR. The radius, R,is the distance between the center of the circle and any point on the circle itself. Inmathematical terms, the center of the circle is called the “focus”. An ellipse, as shownin Fig. 6.3, is like a flattened circle, with one large diameter (the “major” axis) and
90

Figure 6.3: An ellipse with the major and minor axes identified.
one small diameter (the “minor” axis). A circle is simply an ellipse that has identicalmajor and minor axes. Inside of an ellipse, there are two special locations, called“foci” (foci is the plural of focus, it is pronounced “fo-sigh”). The foci are specialin that the sum of the distances between the foci and any points on the ellipse arealways equal. Fig. 6.4 is an ellipse with the two foci identified, “F1” and “F2”.
Exercise #1: On the ellipse in Fig. 6.4 are two X’s. Confirm that that sum ofthe distances between the two foci to any point on the ellipse is always the sameby measuring the distances between the foci, and the two spots identified with X’s.Show your work. (2 points)
Exercise #2: In the ellipse shown in Fig. 6.5, two points (“P1” and “P2”) areidentified that are not located at the true positions of the foci. Repeat exercise #1,but confirm that P1 and P2 are not the foci of this ellipse. (2 points)
Figure 6.4: An ellipse with the two foci identified.
91

Figure 6.5: An ellipse with two non-foci points identified.
Now we will use the Planets and Satellites program to examine Kepler’s laws. It ispossible that the program will already be running when you get to your computer.If not, however, you will have to start it up. If your TA gave you a CDROM, thenyou need to insert the CDROM into the CDROM drive on your computer, and openthat device. On that CDROM will be an icon with the program name. It is alsopossible that Planets and Satellites has been installed on the computer you are using.Look on the desktop for an icon, or use the start menu. Start-up the program, andyou should see a title page window, with four boxes/buttons (“Getting Started”,“Tutorial”, “Simulations”, and “Exit”). Click on the “Simulations” button. We willbe returning to this level of the program to change simulations. Note that there arehelp screens and other sources of information about each of the simulations we willbe running–do not hesitate to explore those options.
Exercise #3: Kepler’s first law. Click on the “Kepler’s Law button” and then the“First Law” button inside the Kepler’s Law box. A window with two panels opensup. The panel on the left will trace the motion of the planet around the Sun, whilethe panel on the right sums the distances of the planet from the foci. Remember,Kepler’s first law states “the orbit of a planet is an ellipse with the Sun at one focus”.The Sun in this simulation sits at one focus, while the other focus is empty (butwhose location will be obvious once the simulation is run!).
At the top of the panel is the program control bar. For now, simply hit the “Go”button. You can clear and restart the simulation by hitting “Restart” (do this asoften as you wish). After hitting Go, note that the planet executes an orbit along theellipse. The program draws the “vectors” from each focus to 25 different positionsof the planet in its orbit. It draws a blue vector from the Sun to the planet, and ayellow vector from the other focus to the planet. The right hand panel sums the blueand yellow vectors. [Note: if your computer runs the simulation too quickly, or tooslowly, simply adjust the “Slow down/Speed Up” slider for a better speed.]
92

Describe the results that are displayed in the right hand panel for this first simulation.(2 points).
Now we want to explore another ellipse. In the extreme left hand side of the controlbar is a slider to control the “Initial Velocity”. At start-up it is set to “1.2”. Slide itup to the maximum value of 1.35 and hit Go.
Describe what the ellipse looks like at 1.35 vs. that at 1.2. Does the sum of thevectors (right hand panel) still add up to a constant? (3 points)
Now let’s put the Initial Velocity down to a value of 1.0. Run the simulation. Whatis happening here? The orbit is now a circle. Where are the two foci located? In thiscase, what is the distance between the focus and the orbit equivalent to? (4 points)
93

The point in the orbit where the planet is closest to the Sun is called “perihelion”,and that point where the planet is furthest from the Sun is called “aphelion”. For acircular orbit, the aphelion is the same as the perihelion, and can be defined to beanywhere! Exit this simulation (click on “File” and “Exit”).
Exercise #4: Kepler’s Second Law: “A line from a planet to the Sun sweeps outequal areas in equal intervals of time.” From the simulation window, click on the“Second Law” after entering the Kepler’s Law window. Move the Initial Velocityslide bar to a value of 1.2. Hit Go.
Describe what is happening here. Does this confirm Kepler’s second law? How?When the planet is at perihelion, is it moving slowly or quickly? Why do you thinkthis happens? (4 points)
Look back to the equation for the force of gravity. You know from personal experiencethat the harder you hit a ball, the faster it moves. The act of hitting a ball is the actof applying a force to the ball. The larger the force, the faster the ball moves (and,generally, the farther it travels). In the equation for the force of gravity, the amountof force generated depends on the masses of the two objects, and the distance betweenthem. But note that it depends on one over the square of the distance: 1/R2. Let’sexplore this “inverse square law” with some calculations.
• If R = 1, what does 1/R2 = ?
94

• If R = 2, what does 1/R2 = ?
• If R = 4, what does 1/R2 = ?
What is happening here? As R gets bigger, what happens to 1/R2? Does 1/R2
decrease/increase quickly or slowly? (2 points)
The equation for the force of gravity has a 1/R2 in it, so as R increases (that is, thetwo objects get further apart), does the force of gravity felt by the body get larger, orsmaller? Is the force of gravity stronger at perihelion, or aphelion? Newton showedthat the speed of a planet in its orbit depends on the force of gravity through thisequation:
V =√
(G(Msun +Mplanet)(2/r − 1/a)) (6.2)
where “r” is the radial distance of the planet from the Sun, and “a” is the meanorbital radius (the semi-major axis). Do you think the planet will move faster, orslower when it is closest to the Sun? Test this by assuming that r = 0.5a at perihelion,and r = 1.5a at aphelion, and that a=1! [Hint, simply set G(Msun + Mplanet) = 1 tomake this comparison very easy!] Does this explain Kepler’s second law? (4 points)
95

What do you think the motion of a planet in a circular orbit looks like? Is there adefinable perihelion and aphelion? Make a prediction for what the motion is going tolook like–how are the triangular areas seen for elliptical orbits going to change as theplanet orbits the Sun in a circular orbit? Why? (3 points)
Now let’s run a simulation for a circular orbit by setting the Initial Velocity to 1.0.What happened? Were your predictions correct? (3 points)
Exit out of the Second Law, and start-up the Third Law simulation.
Exercise 4: Kepler’s Third Law: “A planet’s orbital period squared is proportionalto its average distance from the Sun cubed: P2 ∝ a3”. As we have just learned, thelaw of gravity states that the further away an object is, the weaker the force. We havealready found that at aphelion, when the planet is far from the Sun, it moves moreslowly than at perihelion. Kepler’s third law is merely a reflection of this fact–thefurther a planet is from the Sun (“a”), the more slowly it will move. The more slowlyit moves, the longer it takes to go around the Sun (“P”). The relation is P2 ∝ a3,where P is the orbital period in years, while a is the average distance of the planetfrom the Sun, and the mathematical symbol for proportional is represented by “∝”.To turn the proportion sign into an equal sign requires the multiplication of the a3
side of the equation by a constant: P2 = C × a3. But we can get rid of this constant,“C”, by making a ratio. We will do this below.
96

In the next simulation, there will be two planets: one in a smaller orbit, which willrepresent the Earth (and has a = 1), and a planet in a larger orbit (where a isadjustable). Start-up the Third Law simulation and hit Go. You will see that theinner planet moves around more quickly, while the planet in the larger ellipse movesmore slowly. Let’s set-up the math to better understand Kepler’s Third Law. Webegin by constructing the ratio of of the Third Law equation (P2 = C × a3) for anarbitrary planet divided by the Third Law equation for the Earth:
P 2P
P 2E
=C × a3PC × a3E
(6.3)
In this equation, the planet’s orbital period and average distance are denoted by PP
and aP , while the orbital period of the Earth and its average distance from the Sunare PE and aE . As you know from from your high school math, any quantity thatappears on both the top and bottom of a fraction can be canceled out. So, we canget rid of the pesky constant “C”, and Kepler’s Third Law equation becomes:
P 2P
P 2E
=a3Pa3E
(6.4)
But we can make this equation even simpler by noting that if we use years for theorbital period (PE = 1), and Astronomical Units for the average distance of the Earthto the Sun (aE = 1), we get:
P 2P
1=
a3P1
or P 2P = a3P (6.5)
(Remember that the cube of 1, and the square of 1 are both 1!)
Let’s use equation (6.5) to make some predictions. If the average distance of Jupiterfrom the Sun is about 5 AU, what is its orbital period? Set-up the equation:
P 2J = a3J = 53 = 5× 5× 5 = 125 (6.6)
So, for Jupiter, P 2 = 125. How do we figure out what P is? We have to take thesquare root of both sides of the equation:
√P 2 = P =
√125 = 11.2 years (6.7)
The orbital period of Jupiter is approximately 11.2 years. Your turn:
97

If an asteroid has an average distance from the Sun of 4 AU, what is its orbital period?Show your work. (2 points)
In the Third Law simulation, there is a slide bar to set the average distance from theSun for any hypothetical solar system body. At start-up, it is set to 4 AU. Run thesimulation, and confirm the answer you just calculated. Note that for each orbit ofthe inner planet, a small red circle is drawn on the outer planet’s orbit. Count upthese red circles to figure out how many times the Earth revolved around the Sunduring a single orbit of the asteroid. Did your calculation agree with the simulation?Describe your results. (2 points)
If you were observant, you noticed that the program calculated the number of orbitsthat the Earth executed for you (in the “Time” window), and you do not actuallyhave to count up the little red circles. Let’s now explore the orbits of the nine planetsin our solar system. In the following table are the semi-major axes of the nine planets.Note that the “average distance to the Sun” (a) that we have been using above isactually a quantity astronomers call the “semi-major axis” of a planet. a is simplyone half the major axis of the orbit ellipse. Fill in the missing orbital periods of theplanets by running the Third Law simulator for each of them. (3 points)
Notice that the further the planet is from the Sun, the slower it moves, and the longerit takes to complete one orbit around the Sun (its “year”). Neptune was discoveredin 1846, and Pluto was discovered in 1930 (by Clyde Tombaugh, a former professor
98

Table 6.1: The Orbital Periods of the Planets
Planet a (AU) P (yr)Mercury 0.387 0.24Venus 0.72Earth 1.000 1.000Mars 1.52Jupiter 5.20Saturn 9.54 29.5Uranus 19.22 84.3Neptune 30.06 164.8Pluto 39.5 248.3
at NMSU). How many orbits (or what fraction of an orbit) have Neptune and Plutocompleted since their discovery? (3 points)
6.4 Going Beyond the Solar System
One of the basic tenets of physics is that all natural laws, such as gravity, are the sameeverywhere in the Universe. Thus, when Newton used Kepler’s laws to figure out howgravity worked in the solar system, we suddenly had the tools to understand how starsinteract, and how galaxies, which are large groups of billions of stars, behave: thelaw of gravity works the same way for a planet orbiting a star that is billions of lightyears from Earth, as it does for the planets in our solar system. Therefore, we canuse the law of gravity to construct simulations for all types of situations—even howthe Universe itself evolves with time! For the remainder of the lab we will investigatebinary stars, and planets in binary star systems.
First, what is a binary star? Astronomers believe that about one half of all starsthat form, end up in binary star systems. That is, instead of a single star like theSun, being orbited by planets, a pair of stars are formed that orbit around each other.
99

Binary stars come in a great variety of sizes and shapes. Some stars orbit around eachother very slowly, with periods exceeding a million years, while there is one binarysystem containing two white dwarfs (a white dwarf is the end product of the life of astar like the Sun) that has an orbital period of 5 minutes!
To get to the simulations for this part of the lab, exit the Third Law simulation (if youhaven’t already done so), and click on button “7”, the “Two-Body and Many-Body”simulations. We will start with the “Double Star” simulation. Click Go.
In this simulation there are two stars in orbit around each other, a massive one (theblue one) and a less massive one (the red one). Note how the two stars move. Noticethat the line connecting them at each point in the orbit passes through one spot–thisis the location of something called the “center of mass”. In Fig. 6.6 is a diagramexplaining the center of mass. If you think of a teeter-totter, or a simple balance,the center of mass is the point where the balance between both sides occurs. Ifboth objects have the same mass, this point is halfway between them. If one is moremassive than the other, the center of mass/balance point is closer to the more massiveobject.
Figure 6.6: A diagram of the definition of the center of mass. Here, object one (M1)is twice as massive as object two (M2). Therefore, M1 is closer to the center of massthan is M2. In the case shown here, X2 = 2X1.
Most binary star systems have stars with similar masses (M1 ≈ M2), but this is notalways the case. In the first (default) binary star simulation, M1 = 2M2. The “massratio” (“q”) in this case is 0.5, where mass ratio is defined to be q = M2/M1. Here,M2 = 1, and M1 = 2, so q = M2/M1 = 1/2 = 0.5. This is the number that appearsin the “Mass Ratio” window of the simulation.
100

Exercise 5: Binary Star systems. We now want to set-up some special binarystar orbits to help you visualize how gravity works. This requires us to access the“Input” window on the control bar of the simulation window to enter in data for eachsimulation. Clicking on Input brings up a menu with the following parameters: MassRatio, “Transverse Velocity”, “Velocity (magnitude)”, and “Direction”. Use the slidebars (or type in the numbers) to set Transverse Velocity = 1.0, Velocity (magnitude)= 0.0, and Direction = 0.0. For now, we simply want to play with the mass ratio.
Use the slide bar so that Mass Ratio = 1.0. Click “Ok”. This now sets up your newsimulation. Click Run. Describe the simulation. What are the shapes of the twoorbits? Where is the center of mass located relative to the orbits? What does q =1.0 mean? Describe what is going on here. (4 points)
Ok, now we want to run a simulation where only the mass ratio is going to be changed.Go back to Input and enter in the correct mass ratio for a binary star system withM1 = 4.0, and M2 = 1.0. Run the simulation. Describe what is happening in thissimulation. How are the stars located with respect to the center of mass? Why?[Hint: see Fig. 6.6.] (4 points)
101
Finally, we want to move away from circular orbits, and make the orbit as elliptical aspossible. You may have noticed from the Kepler’s law simulations that the TransverseVelocity affected whether the orbit was round or elliptical. When the TransverseVelocity = 1.0, the orbit is a circle. Transverse Velocity is simply how fast the planetin an elliptical orbit is moving at perihelion relative to a planet in a circular orbit ofthe same orbital period. The maximum this number can be is about 1.3. If it goesmuch faster, the ellipse then extends to infinity and the orbit becomes a parabola.Go back to Input and now set the Transverse Velocity = 1.3. Run the simulation.Describe what is happening. When do the stars move the fastest? The slowest? Doesthis make sense? Why/why not? (4 points)
The final exercise explores what it would be like to live on a planet in a binarystar system–not so fun! In the “Two-Body and Many-Body” simulations window,click on the “Dbl. Star and a Planet” button. Here we simulate the motion of aplanet going around the less massive star in a binary system. Click Go. Describethe simulation—what happened to the planet? Why do you think this happened? (4points)
102

In this simulation, two more windows opened up to the right of the main one. Theseare what the simulation looks like if you were to sit on the surface of the two stars inthe binary. For a while the planet orbits one star, and then goes away to orbit theother one, and then returns. So, sitting on these stars gives you a different viewpointthan sitting high above the orbit. Let’s see if you can keep the planet from wanderingaway from its parent star. Click on the “Settings” window. As you can tell, nowthat we have three bodies in the system, there are lots of parameters to play with.But let’s confine ourselves to two of them: “Ratio of Stars Masses” and “Planet–StarDistance”. The first of these is simply the q we encountered above, while the secondchanges the size of the planet’s orbit. The default values of both at the start-up areq = 0.5, and Planet–Star Distance = 0.24. Run simulations with q = 0.4 and 0.6.Compare them to the simulations with q = 0.5. What happens as q gets larger, andlarger? What is increasing? How does this increase affect the force of gravity betweenthe star and its planet? (4 points)
See if you can find the value of q at which larger values cause the planet to “stayhome”, while smaller values cause it to (eventually) crash into one of the stars (step-ping up/down by 0.01 should be adequate). (2 points)
103

Ok, reset q = 0.5, and now let’s adjust the Planet–Star Distance. In the Settingswindow, set the Planet–Star Distance = 0.1 and run a simulation. Note the outcomeof this simulation. Now set Planet–Star Distance = 0.3. Run a simulation. Whathappened? Did the planet wander away from its parent star? Are you surprised? (4points)
Astronomers call orbits where the planet stays home, “stable orbits”. Obviously,when the Planet–Star Distance = 0.24, the orbit is unstable. The orbital parametersare just right that the gravity of the parent star is not able to hold on to the planet.But some orbits, even though the parent’s hold on the planet is weaker, are stable–theforce of gravity exerted by the two stars is balanced just right, and the planet canhappily orbit around its parent and never leave. Over time, objects in unstable orbitsare swept up by one of the two stars in the binary. This can even happen in the solarsystem. If you have done the comet lab, then you saw some images where a cometran into Jupiter (see Figure 4.6). The orbits of comets are very long ellipses, andwhen they come close to the Sun, their orbits can get changed by passing close to amajor planet. The gravitational pull of the planet changes the shape of the comet’sorbit, it speeds up, or slows down the comet. This can cause the comet to crash intothe Sun, or into a planet, or cause it to be ejected completely out of the solar system.(You can see an example of the latter process by changing the Planet–Star Distance= 0.4 in the current simulation.)
104

6.5 Summary (35 points)
Please summarize the important concepts of this lab. Your summary should include:
• Describe the Law of Gravity and what happens to the gravitational force as a)as the masses increase, and b) the distance between the two objects increases
• Describe Kepler’s three laws in your own words, and describe how you testedeach one of them.
• Mention some of the things which you have learned from this lab
• Astronomers think that finding life on planets in binary systems is unlikely. Whydo they think that? Use your simulation results to strengthen your argument.
Use complete sentences, and proofread your summary before handing in the lab.
6.6 Possible Quiz Questions
1) Briefly describe the contributions of the following people to understandingplanetary motion: Tycho Brahe, Johannes Kepler, Isaac Newton.2) What is an ellipse?3) What is a “focus”?4) What is a binary star?5) Describe what is meant by an “inverse square law”.6) What is the definition of “semi-major axis”?
6.7 Extra Credit (ask your TA for permission be-
fore attempting, 5 points)
Derive Kepler’s third law (P2 = C × a3) for a circular orbit. First, what is the circum-ference of a circle of radius a? If a planet moves at a constant speed “v” in its orbit,how long does it take to go once around the circumference of a circular orbit of radiusa? [This is simply the orbital period “P”.] Write down the relationship that exists be-tween the orbital period “P”, and “a” and “v”. Now, if we only knew what the velocity(v) for an orbiting planet was, we would have Kepler’s third law. In fact, deriving thevelocity of a planet in an orbit is quite simple with just a tiny bit of physics (go to thispage to see how it is done: http://www.go.ednet.ns.ca/∼larry/orbits/kepler.html).Here we will simply tell you that the speed of a planet in its orbit is v = (GM/a)1/2,
105

where “G” is the gravitational constant mentioned earlier, “M” is the mass of theSun, and a is the radius of the orbit. Rewrite your orbital period equation, substi-tuting for v. Now, one side of this equation has a square root in it–get rid of this bysquaring both sides of the equation and then simplifying the result. Did you get P2
= C × a3? What does the constant “C” have to equal to get Kepler’s third law?
106
Name:
Lab 7
The Orbit of Mercury
7.1 Introduction
Of the five planets known since ancient times (Mercury, Venus, Mars, Jupiter, andSaturn), Mercury is the most difficult to see. In fact, of the 7 billion people on theplanet Earth it is likely that fewer than 1,000,000 (0.0002%) have knowingly seenthe planet Mercury. The reason for this is that Mercury orbits very close to theSun, about one third of the Earth’s average distance. Therefore it is always locatedvery near the Sun, and can only be seen for short intervals soon after sunset, or justbefore sunrise. It is a testament to how carefully the ancient peoples watched thesky that Mercury was known at least as far back as 3,000 BC. In Roman mythologyMercury was a son of Jupiter, and was the god of trade and commerce. He was alsothe messenger of the gods, being “fleet of foot”, and commonly depicted as havingwinged sandals. Why this god was associated with the planet Mercury is obvious:Mercury moves very quickly in its orbit around the Sun, and is only visible for avery short time during each orbit. In fact, Mercury has the shortest orbital period(“year”) of any of the planets. You will determine Mercury’s orbital period in thislab. [Note: it is very helpful for this lab exercise to review Lab #1, section 1.3.]
• Goals: to learn about planetary orbits
• Materials: a protractor, a straight edge, a pencil and calculator
Mercury and Venus are called “inferior” planets because their orbits are interior tothat of the Earth. While the planets Mars, Jupiter, Saturn, Uranus, Neptune, andPluto are called “superior” planets, as their orbits lie outside that of the Earth.
107

Because the orbits of Mercury and Venus are smaller than the Earth’s, these planetscan never be located very far from the Sun as seen from the Earth. As discovered byGalileo in 1610 (see Fig. 7.1), the planet Venus shows phases that look just like thoseof the Moon. Mercury also shows these same phases. As can be envisioned from Figure7.1, when Mercury or Venus are on the far side of the Sun from Earth (a configurationcalled “superior” conjunction), these two planets are seen as “full”. Note, however,that it is almost impossible to see a “full” Mercury or Venus because at this time theplanet is very close to, or behind the Sun. When Mercury or Venus are closest to theEarth, a time when they pass between the Earth and the Sun (a configuration termed“inferior” conjunction), we would see a “new” phase. During their new phases, it isalso very difficult to see Mercury or Venus because their illuminated hemispheres arepointed away from us, and they are again located very close to the Sun in the sky.
Figure 7.1: A diagram of the phases of Venus as it orbits around the Sun. The planetMercury exhibits the same set of phases as it too is an “inferior” planet like Venus.
The best time to see Mercury is near the time of “greatest elongation”. At the timeof greatest elongation, the planet Mercury has its largest angular separation from theSun as seen from the Earth. There are six or seven greatest elongations of Mercuryeach year. At the time of greatest elongation, Mercury can be located up to 28◦ fromthe Sun, and sets (or rises) about two hours after (or before) the Sun. In Figure 7.2,we show a diagram for the greatest elongation of Mercury that occurred on August14, 2003. In this diagram, we plot the positions of Mercury and the Sun at thetime of sunset (actually just a few minutes before sunset!). As this diagram shows,if we started our observations on July 24th, Mercury would be located close to theSun at sunset. But as the weeks passed, the angle between Mercury and the Sunwould increase until it reached its maximum value on August 14th. After this date,the separation between the Sun and Mercury quickly decreases as it heads towardsinferior conjunction on September 11th.
108

You can see from Figure 7.2 that Mercury is following an orbit around the Sun: itwas “behind” the Sun (superior conjunction) on July 5th, and quickly races aroundits orbit until the time of greatest elongation, and then passes between the Earthand the Sun on September 11th. If we used a telescope and made careful drawingsof Mercury throughout this time, we would see the phases shown in Figure 7.3. Onthe first date in Figure 7.2 (July 24th), Mercury was still on the far side of the Sunfrom the Earth, and almost had a full phase (which it only truly has at the time ofsuperior conjunction). The disk of Mercury on July 24th is very small because theplanet is far away from the Earth. As time passes, however, the apparent size of thedisk of Mercury grows in size, while the illuminated portion of the disk decreases. OnAugust 14th, Mercury reaches greatest elongation, and the disk is half-illuminated.At this time it looks just like the first quarter Moon! As it continues to catch upwith the Earth, the distance between the two planets shrinks, so the apparent size ofMercury continues to grow. As the angular separation between Mercury and the Sunshrinks, so does the amount of the illuminated hemisphere that we can see. EventuallyMercury becomes a crescent, and at inferior conjunction it becomes a “new” Mercury.
Figure 7.2: The eastern elongation of August, 2003. Mercury was at superior con-junction on July 5th, and quickly moved around its orbit increasing the angular sep-aration between it and the Sun. By July 24th, Mercury could be seen just above theSun shortly after sunset. As time passed, the angular separation between the Sun andMercury increased, reaching its maximum value on August 14th, the time of greatestEastern elongation. As Mercury continued in its orbit it comes closer to the Earth,but the angular separation between it and the Sun shrinks. Eventually, on September11th, the time of inferior conjunction, Mercury passed directly between the Earth andthe Sun.
109

Figure 7.3: A diagram showing the actual appearance of Mercury during the August2003 apparition. As Mercury comes around its orbit from superior conjunction (whereit was “full”), it is far away from the Earth, so it appears small (as on July 24th).As it approaches greatest elongation (August 14th) it gets closer to the Earth, so itsapparent size grows, but its phase declines to half (like a first quarter moon). Mercurycontinues to close its distance with the Earth so it continues to grow in size–but notethat the illuminated portion of its disk shrinks, becoming a thin crescent on August30th. As Mercury passes between the Earth and Sun it is in its “new” phase, and isinvisible.
7.1.1 Eastern and Western Elongations
The greatest elongation that occurred on August 14, 2003 was a “greatest Easternelongation”. Why? As you know, the Sun sets in the West each evening. WhenMercury is visible after sunset it is located to the East of the Sun. It then sets in theWest after the Sun has set. As you can imagine, however, the same type of geometrycan occur in the morning sky. As Mercury passed through inferior conjunction onSeptember 11th, it moved into the morning sky. Its angular separation from the Sunincreased until it reached “greatest Western elongation” on September 27th, 2003.During this time, the phase of Mercury changed from “new” to “last quarter” (half).After September 27th the angular separation between the Sun and Mercury shrinks,as does the apparent size of the disk of Mercury, as it reverses the sequence shownin Figure 7.3. A diagram showing the geometry of eastern and western elongations isshown in Figure 7.4. [Another way of thinking about what each of these means, andan analogy that might come in useful when you begin plotting the orbit of Mercury,is to think about where Mercury is relative to the Sun at Noon. At Noon, the Sunis due south, and when facing the Sun, East is to the left, and West is to the right.Thus, during an Eastern elongation Mercury is to the left of the Sun, and during
110

a Western elongation Mercury is to the right of the Sun (as seen in the NorthernHemisphere).]
Figure 7.4: A diagram showing the geometry of greatest Western elongations (leftside), and greatest Eastern elongations (right side). If you see Mercury–or any otherstar or planet–above the Western horizon after sunset, that object is located to theEast of the Sun. The maximum angular separation between Mercury and the Sunat this time is called the greatest Eastern elongation. A greatest Western elongationoccurs when Mercury is seen in the East before sunrise.
7.1.2 Why Greatest Elongations are Special
We have just spent a lot of time describing the greatest elongations of Mercury. Wedid this because the time of greatest elongation is very special: it is the only timewhen we know where an inferior planet is in its orbit (except in the rare cases wherethe planet “transits” across the face of the Sun!). We show why this is true in thenext figure. In this figure, we have represented the orbits of Mercury and the Earth astwo circles (only about one fourth of the orbits are plotted). We have also plotted thepositions of the Earth, the Sun, and Mercury. At the time of greatest elongation, the
111

angle between the Earth, Mercury and the Sun is a right angle. If you were to plotMercury at some other position in its orbit, the angle between the Earth, Mercury andthe Sun would not be a right angle. Therefore, the times of greatest elongation arespecial, because at this time we know the exact angle between the Earth, Mercury,and the Sun. [You can also figure out from this diagram why Mercury has onlyone-half of its disk illuminated (a phase of “first quarter”).]
Of course, plotting only one elongation is not sufficient to figure out the orbit ofMercury–you need to plot many elongations. In today’s lab exercise, you will plotthirteen greatest elongations of Mercury, and trace-out its orbit. There are a lot ofangles in this lab, so you need to get comfortable with using a protractor. Your TAwill help you figure this out. But the most critical aspect is to not confuse easternand western elongations. Look at Figure 7.5 again. What kind of elongation is this?Well, as seen from the Earth, Mercury is to the left of the Sun. As described earlier(in the square brackets at the end of section 6.1.1), if Mercury is to the left of theSun, it is an eastern elongation.
Figure 7.5: A diagram showing the orbital geometry of the Earth and Mercury duringa greatest Eastern elongation. The orbits of the Earth and Mercury are the two largecircles. The line of sight to Mercury at the time of greatest elongation is indicated.Note that at this time the angle between the Earth, Mercury, and the Sun is a rightangle. The direction of motion of the two planets is shown by the arrows on theorbits.
112

7.2 The Orbits of Earth and Mercury
As shown in the previous diagram, both the Earth and Mercury are orbiting theSun. That means that every single day they are at a different position in their orbits.Before we can begin this lab, we must talk about how we can account for this motion!A year on Earth, the time it takes the Earth to complete one orbit around the Sun,is 365 days. If we assume that the Earth’s orbit is a perfect circle, then the Earthmoves on that circle by about 1 degree per day. Remember that a circle contains 360degrees (360◦). If it takes 365 days to go 360◦, the Earth moves 360◦/365 = 0.986degrees per day (◦/day). For this lab, we will assume that the Earth moves exactlyone degree per day which, you can see, is very close to the truth. How far does theEarth move in 90 days? 90 degrees! How about 165 days?
7.2.1 The Data
In Table 7.1, we have listed the thirteen dates of the greatest elongations of Mercury,as well as the angle of each greatest elongation. Note that the elongations areeither East or West! In the third column, we have listed something called theJulian date. Over long time intervals, our common calendar is very hard to useto figure out how much time has elapsed. For example, how many days are therebetween March 13th, 2001 and December 17th 2004? Remember that 2004 is a leapyear! This is difficult to do in your head. To avoid such calculations, astronomershave used a calendar that simply counts the days that have passed since some distantday #1. The system used by astronomers sets Julian date 1 to January 1st, 4713 BC(an arbitrary date chosen in the sixteenth century). Using this calendar, March 13th,2001 has a Julian date of 2451981. While December 17th 2004 has a Julian date of2453356. Taking the difference of these two numbers (2453356 − 2451981) we findthat there are 1,375 days between March 13th, 2001 and December 17th 2004.
Exercise #1: Fill-in the Data Table.
The fourth and fifth columns of the table are blank, and must be filled-in by you. Thefourth column is the number of days that have elapsed between elongations in thistable (that is, simply subtract the Julian date of the previous elongation from thefollowing elongation). We have worked the first one of these for you as an example.The last column lists how far the Earth has moved in degrees. This is simply thenumber of days times the number 1.0! As the Earth moves one degree per day. (Ifyou wish, instead of using 1.0, you could multiply this number by 0.986 to be moreaccurate. You will get better results doing it that way.) So, if there are 42 daysbetween elongations, the Earth moves 42 degrees in its orbit (or 41.4 degrees usingthe correct value of 0.986 ◦/day). (10 points)
113

Table 7.1: Elongation Data For Mercury
# Date Elongation Angle Julian Date Days Degrees#1 Sep. 1, 2002 27.2 degrees east 2452518 − −#2 Oct. 13, 2002 18.1 degrees west 2452560 42 42#3 Dec. 26, 2002 19.9 degrees east 2452634#4 Feb. 4, 2003 25.4 degrees west 2452674#5 Apr. 16, 2003 19.8 degrees east 2452745#6 Jun. 3, 2003 24.4 degrees west 2452793#7 Aug. 14, 2003 27.4 degrees east 2452865#8 Sep. 27, 2003 17.9 degrees west 2452909#9 Dec. 09, 2003 20.9 degrees east 2452982#10 Jan. 17, 2004 23.9 degrees west 2453021#11 Mar. 29, 2004 18.8 degrees east 2453093#12 May 14, 2004 26.0 degrees west 2453139#13 Jul. 27, 2004 27.1 degrees east 2453213
Exercise #2: Plotting your data.
Before we describe the plotting process, go back and review Figure 7.5. Unlike thatdiagram, you do not know what the orbit of Mercury looks like–this is what you aregoing to figure out during this lab! But we do know two things: the first is that theEarth’s orbit is nearly a perfect circle, and two, that the Sun sits at the exact centerof this circle. On the next page is a figure containing a large circle with a dot drawnat the center to represent the Sun. At one position on the large circle we have put alittle “X” as a reference point. The large circle here is meant to represent the Earth’sorbit, and the “X” is simply a good starting point.
To plot the first elongation of Mercury from our data table, using a pencil, draw aline connecting the X, and the Sun using a straight edge (ruler or protractor). Thefirst elongation in the table (September 1, 2002) is 27.2 degrees East. Using yourprotractor, put the “X” that marks the Earth’s location at the center hole/dot onyour protractor. Looking back to Figure 7.5, that elongation was also an easternelongation. So, using that diagram as a guide, measure an angle of 27.2 degrees onyour protractor and put a small mark on the worksheet. Now, draw a line from theEarth’s location through this mark just like the “line of sight” arrow in Figure 7.5.Now, rotate your protractor so that the 90 degree mark is on this line and towardsthe position of the Earth, while the reference hole/dot is on the same line. Slide theprotractor along the line until the 0◦ (or 180◦) reference line intersects the center ofthe Sun. Mark this spot with a dark circle. This is the position of Mercury!
114

115

This is the procedure that you will use for all of the elongations, so if this is confusingto you, have your TA come over and clarify the technique for you so that you don’tget lost and waste time doing this incorrectly.
Ok, now things become slightly more difficult—the Earth moves! Looking back toFigure 7.5, note the arrows on the orbits of Earth and Mercury. This is the directionthat both planets are moving in their orbits. For the second elongation, the Earthhas moved 42 degrees. We have to locate where the Earth is in its orbit before we canplot the next elongation. So, now put the center hole/dot of your protractor on theSun. Line up the 0/180 degree mark with the first line that connected the Earth andSun. Measure an angle of 42 degrees (in the correct direction) and put a small mark.Draw a line through this mark that intersects the position of the Sun, the mark, andthe orbit of the Earth. Put an X where this line intersects the Earth’s orbit. This isthe spot from where you will plot the next elongation of Mercury.
Now, repeat the process for plotting this next elongation angle. Note, however, thatthis elongation is a western elongation, so that the line of sight arrow this time willbe to the right of the Sun. It is extremely important to remember that on easternelongations the line of sight arrow to Mercury goes to the left of the Sun, while duringwestern elongations it goes to the right of the Sun.
[Hints: It is helpful to label each one of the X’s you place on the Earth’s orbit withthe elongation number from Table 7.1. This will allow you to go back and fix anyproblems you might find. Note that you will have a large number of lines drawnin this plot by the time you get finished. Use a sharp pencil so that you can erasesome/all/pieces of these lines to help clean-up the plot and reduce congestion. Youmight also find it helpful to simply put a “left” or a “right” each time you encounterEast and West in Table 7.1 to insure you plot your data correctly.]
Plot all of your data (28 points).
Exercise #3: Connecting the dots.
Note that planets move on smooth, almost circular paths around the Sun. So try toconnect the various positions of Mercury with a smooth arc. Do all of your points fiton this closed curve? If not, identify the bad points and go back and see what youdid wrong. Correct any bad elongations.
1) Is Mercury’s orbit circular? Describe its shape. (5 points)
116

Exercise #4: Finding the semi-major axis of Mercury’s orbit.
Using a ruler, find the position on Mercury’s orbit that is closest to the Sun (“peri-helion”) and mark this spot with an “X”. Now find the point on the orbit of Mercurythat is furthest from the Sun (“aphelion”) and mark it with an “X”. Draw a line thatgoes through the Sun that comes closest to connecting these two positions–note thatit is likely that these two points will not lie on a line that intercepts the Sun. Justattempt to draw the best possible line connecting these two points that passes throughthe Sun.
2) Measure the length of this line. Astronomers call this line the major axis of theplanet’s orbit. Divide the length you have just measured by two, to get the “semi-major” axis of Mercury’s orbit: (mm). Measure the diameter of theEarth’s orbit and divide that number by two to get the Earth’s semi-major axis:
(mm).
Divide the semi-major axis of Mercury by that of the Earth: AU. Sincethe semi-major axis of the Earth’s orbit is defined to be “one astronomical unit”, thisratio tells us the size of Mercury’s semi-major axis in astronomical units (AU). (5points)
3) As you have probably heard in class, the fact that the orbits of the planet’s areellipses, and not circles, was discovered by Kepler in about 1614. Mercury and Plutohave the most unusual orbits in the solar system in that they are the most non-circular.Going back to the line you drew that went through the Sun and that connected thepoints of perihelion and aphelion, measure the lengths of the two line segments:
Perihelion (p) = mm. Aphelion (q) = mm.
Astronomers use the term eccentricity (“e”) to measure how out-of-round a planet’sorbit is, and the eccentricity is defined by the equation:
e = (q − p)/(p + q) =
Plug your values into this equation and calculate the eccentricity of Mercury’s orbit.(5 points)
117

4) The eccentricity for the Earth’s orbit is e = 0.017. How does your value of theeccentricity for Mercury compare to that of the Earth? Does the fact that we used acircle for the Earth’s orbit now seem justifiable? (5 points)
Exercise #5: The orbital period of Mercury.
Looking at the positions of Mercury at elongation #1, and its position at elongation#2, approximately how far around the orbit did Mercury move in these 42 days?Estimate how long you think it would take Mercury to complete one orbit around theSun: days. (2 points)
Using Kepler’s laws, we can estimate the orbital period of a planet (for a review ofKepler’s laws, see lab #5). Kepler’s third law says that the orbital period squared(P2) is proportional to the cube of the semi-major axis (a3): P2 ∝ a3. This is a typeof equation you might not remember how to solve (if you have not done so already,review Lab #1, section 1.3). But let’s take it in pieces:
a3 = a× a× a =
Plug-in your value of a for Mercury and find its cube.
To find the period of Mercury’s orbit, we now need to take the square root of thenumber you just calculated (see your TA if you do not know whether your calculatorcan perform this operation). (3 points)
P =√a3 = . (7.1)
Now, the number you just calculated probably means nothing to you. But what youhave done is calculate Mercury’s orbital period as a fraction of the Earth’s orbitalperiod (that is because we have been working in AU, a unit that is defined by theEarth-Sun distance). Since the Earth’s orbital period is exactly 365.25 days, find
118

Mercury’s orbital period by multiplying the number you just calculated for Mercuryby 365.25:
Porb(Mercury) = days.
5) How does the orbital period you just calculated using Kepler’s laws compare tothe one you estimated from your plot at the beginning of this exercise? (2 points)
119

7.3 Summary (35 points)
Before you leave lab, your TA will give you the real orbital period of Mercury, as wellas its true semi-major axis (in AU) and its orbital eccentricity.
• Compare the precisely known values for Mercury’s orbit with the ones youderived. How well did you do?
• What would be required to enable you to do a better job?
• Describe how you might go about making the observations on your own so thatyou could create a data table like the one in this lab. Do you think this couldbe done with just the naked eye and some sort of instrument that measuredangular separation? What else might be necessary?
7.4 Possible Quiz Questions
• What does the term “inferior planet” mean?
• What is meant by elongation angle?
• Why do Mercury and Venus show phases like the Moon?
7.5 Extra Credit (ask your TA for permission be-
fore attempting, 5 points)
In this lab you have measured three of the five quantities that completely define aplanet’s orbit. The other two quantities are the orbital inclination, and the longitudeof perihelion. Determining the orbital inclination, the tilt of the plane of Mercury’sorbit with respect to the Earth’s orbit, is not possible using the data in this lab. Butit is possible to determine the longitude of perihelion. Astronomers define the zeropoint of solar system longitude as the point in the Earth’s orbit at the time of theVernal Equinox (the beginning of Spring in the northern hemisphere). In 2004, theVernal Equinox occurred on March 20. If you notice, one of the elongations in thetable (#11) occurs close to this date. Thus, you can figure out the true location of theVernal Equinox by moving back from position #11 by the right number of degrees.The longitude of Mercury’s perihelion is just the angle measured counterclockwisefrom the Earth’s vernal equinox. You should find that your angle is larger than 180degrees. Subtract off 180 degrees. How does your value compare with the precisevalue of 77◦?
120

Name:
Lab 8
Measuring Distances UsingParallax
8.1 Introduction
How do astronomers know how far away a star or galaxy is? Determining the distancesto the objects they study is one of the the most difficult tasks facing astronomers.Since astronomers cannot simply take out a ruler and measure the distance to anyobject, they have to use other methods. Inside the solar system, astronomers cansimply bounce a radar signal off of a planet, asteroid or comet to directly measurethe distance to that object (since radar is an electromagnetic wave, it travels at thespeed of light, so you know how fast the signal travels–you just have to count howlong it takes to return and you can measure the object’s distance). But, as you willfind out in your lecture sessions, some stars are hundreds, thousands or even tens ofthousands of “light years” away. A light year is how far light travels in a single year(about 9.5 trillion kilometers). To bounce a radar signal of a star that is 100 lightyears away would require you to wait 200 years to get a signal back (remember thesignal has to go out, bounce off the target, and come back). Obviously, radar is nota feasible method for determining how far away stars are.
In fact, there is one, and only one direct method to measure the distance to a star:“parallax”. Parallax is the angle that something appears to move when the observerlooking at that object changes their position. By observing the size of this angleand knowing how far the observer has moved, one can determine the distance to theobject. Today you will experiment with parallax, and appreciate the small anglesthat astronomers must measure to determine the distances to stars.
121

To introduce you to parallax, perform the following simple experiment:
Hold your thumb out in front of you at arm’s length and look at it with your lefteye closed. Now look at it with your right eye closed. As you look at your thumb,alternate which eye you close several times. You should see your thumb move relativeto things in the background. Your thumb is not moving but your point of view ismoving, so your thumb appears to move.
• Goals: to discuss the theory and practice of using parallax to find the distancesto nearby stars, and use it to measure the distance to objects in the classroom
• Materials: classroom “ruler”, worksheets, ruler, protractor, calculator, smallobject
8.1.1 Parallax in the classroom
The “classroom parallax ruler” will be installed/projected on one side of the class-room. For the first part of this lab you will be measuring motions against this ruler.
Now work in groups: have one person stand at one wall and have the others standsomewhere in between along the line that goes straight to the other wall, and holdup a skewer or a pencil at the right height so the observer (person against the wall)can see it against the background ruler. The observer should blink his/her eyes andmeasure the number of lines on the background ruler against which the object appearsto move. Note that you can estimate the motion measurement to a fractionof tick mark, e.g., your measurement might be 2 1/2 tick marks). Do thisfor three different distances, with the closest being within a few feet of the observer,and the furthest being at most half the classroom away. Leave the object (or a mark)where the object was located each of the three times, so you can go back later andmeasure the distances. Switch places and do it again. Each person should estimatethe motion for each of the three distances.
How many tick marks did the object move at the closest distance? (2 points):
How many tick marks did the object move at the middle distance? (2 points):
How many tick marks did the object move at the farthest distance? (2 points):
122
What is your estimate of the uncertainty in your measurement of the apparent mo-tion? For example, do you think your recorded measurements could be off by half atick mark? a quarter of a tick mark? You might wish to make the measurement sev-eral times to get some estimate of the reliability of your measurements. (2 points)
The apparent motion of the person against the background ruler is what we are callingparallax. It is caused by looking at an object from two different vantage points, inthis case, the difference in the location of your two eyes. Qualitatively, what do yousee? As the object gets farther away, is the apparent motion smaller or larger?
What if the vantage points are further apart? For example, imagine you had a hugehead and your eyes were a foot apart rather than several inches apart. What wouldyou predict for the apparent motion? Try the experiment again, this time using theobject at one of the distances used above, but now measuring the apparent motionby using just one eye, but moving your whole head a few feet from side to side to getmore widely separated vantage points.
How many tick marks did the person move from the more widely separated vantagepoints?
For an object at a fixed distance, how does the apparent motion change as you observefrom more widely separated vantage points?
123

8.1.2 Measuring distances using parallax
We have seen that the apparent motion depends on both the distance to an object andalso on the separation of the two vantage points. We can then turn this around: if wecan measure the apparent motion and also the separation of the two vantage points,we should be able to infer the distance to an object. This is very handy: it providesa way of measuring a distance without actually having to go to an object. Since wecan’t travel to them, this provides the only direct measurement of the distances tostars.
We will now see how parallax can be used to determine the distances to theobjects you looked at just based on your measurements of their apparent motionsand a measurement of the separation of your two vantage points (your two eyes).
Angular motion of an object
How can we measure the apparent motion of an object? As with our backgroundruler, we can measure the motion as it appears against a background object. Butwhat are the appropriate units to use for such a measurement? Although we canmeasure how far apart the lines are on our background ruler, the apparent motionis not really properly measured in a unit of length; if we had put our parallax rulerfurther away, the apparent motion would have been the same, but the number of tickmarks it moved would have been larger.
The apparent motion is really an angular motion. As such, it can be measured indegrees, with 360 degrees in a circle.
Figure out the angular separation of the tick marks on the ruler as seen from theopposite side of the classroom. Do this by putting one eye at the origin of one of thetripod-mounted protractors and measuring the angle from one end of the backgroundruler to the other end of the ruler. You might lay a pencil from your eye at the originof the protractor toward each end and use this to measure the the total angle. Dividethis angle by the total number of tick marks to figure out the angle for each tickmark.
Number of degrees for the entire background ruler: Num-
ber of tick marks in the whole ruler:
Number of degrees in each tick mark:
124

Convert your measurements of apparent motion in tick marks above to angular mea-surements by multiplying the number of tick marks by the number of degrees per tickmark:
How many degrees did the object appear to move at the closest distance? (2 points):
How many degrees did the object appear to move at the middle distance? (2 points):
How many degrees did the object appear to move at the farthest distance? (2points):
Based on your estimate of the uncertainty in the number of tick marks each objectmoved, what is your estimate of the uncertainty in the number of degrees that eachobject moved? (2 points)
Distance between the vantage points
Now you need to measure the distance between the two different vantage points, inthis case, the distance between your two eyes. Have your partner measure this witha ruler. Since you see out of the pupil part of your eyes, you want to measure thedistance between the centers of your two pupils.
What is the distance between your eyes? (2 points)
Using parallax measurements to determine the distance to an object
To determine the distance to an object for which you have a parallax measurement,you can construct an imaginary triangle between the two different vantage points and
125

the object, as shown in Figure 8.1.
α
d
b
Object
Left eye Right eye
Figure 8.1: Parallax triangle
The angles you have measured correspond to the angle α on the diagram, and thedistance between the vantage points (your pupils) corresponds to the distance b onthe diagram. The distance to the object, which is what you want to figure out, is d.
The three quantities b, d, and α are related by a trigonometric function called thetangent. Now, you may have never heard of a tangent, if so don’t worry–we will showyou how to do this using another easy (but less accurate) way! But for those of youwho are familiar with a little basic trigonometry, here is how you find the distanceto an object using parallax: If you split your triangle in half (dotted line), then thetangent of (α/2) is equal to the quantity (b/2)/d:
tan(
α
2
)
=(b/2)
d
Rearranging the equation gives:
d =(b/2)
tan (α/2)
You can determine the tangent of an angle using your calculator by entering the angleand then hitting the button marked tan. There are several other units for measuringangles besides degrees (for example, radians), so you have to make sure that yourcalculator is set up to use degrees for angles before you use the tangent function.
126

The “Non-Tangent” way to figure out distances from angles
Because the angles in astronomical parallax measurement are very small, astronomersdo not have to use the tangent function to determine distances from angles–they usesomething called the “small angle approximation formula”:
θ
57.3=
(b/2)
d
In this equation, we have defined θ = α/2, where α is the same angle as in the earlierequations (and in Fig. 8.1). Rearranging the equation gives:
d =57.3× (b/2)
θ
To use this equation your parallax angle “θ” has to be in degrees. (If you are interestedin where this equation comes from, talk to your TA, or look up the definition of“radian” and “small angle formula” on the web.) Now you can proceed to the nextstep!
Combine your measurements of angular distances and the distance between the van-tage points to determine the three different distances to your partner. The units ofthe distances which you determine will be the same as the units you used to measurethe distance between your eyes; if you measured that in inches, then the deriveddistances will be in inches.
Distance when object was at closest distance: (2 points)
Distance when object was at middle distance: (2 points)
Distance when object was at farthest distance: (2 points)
Based on your estimate of the uncertainty in the angular measurements and also onthe uncertainty of your measurement of the separation of your eyes, estimate theuncertainty in your measurements of the distances to the objects. To do so, youmight wish to redo the calculation allowing each of your measurements to change byyour estimated errors. (2 points)
127

Now go and measure the actual distances to the locations of the objects using a yard-stick, meterstick, or tape measure. How well did the parallax distances work? Are thedifferences between the actual measurements and your parallax measurements withinyour estimated errors? If not, can you think of any reasons why your measurementsmight have some additional error in them? (5 points)
8.1.3 Using Parallax to measure distances on Earth, andwithin the Solar System
We just demonstrated how parallax works in the classroom, now lets move to a largerscale then the classroom. Using the small angle formula, and your eyes, what wouldbe the parallax angle (in degrees) for Organ Summit, the highest peak in the Organmountains, if the Organ Summit is located 12 miles (or 20 km) from this classroom?[Hint: there are 5280 feet in a mile, and 12 inches in a foot. There are 1,000 metersin a km.]: (2 points)
You should have gotten a tiny angle! The smallest angle that the best human eyescan resolve is about 0.02 degrees. Obviously, our eyes provide an inadequate baselinefor measuring this large of a distance. How can we get a bigger baseline? Wellsurveyors use a “transit” to carefully measure angles to a distant object. A transit isbasically a small telescope mounted on a (fancy!) protractor. By locating the transitat two different spots separated by 100 yards (and carefully measuring this baseline!),they can get a much larger parallax angle, and thus it is fairly easy to measure thedistances to faraway trees, mountains, buildings or other large objects.
128

How about an object in the Solar System? We will use Mars, the planet that comesclosest to Earth. At favorable oppositions, Mars gets to within about 0.4 AU ofthe Earth. Remember, 1 AU is the average distance between the Earth and Sun:149,600,000 km. Calculate the parallax angle for Mars (using the small angle approx-imation) using a baseline of 1000 km. (2 points)
Ouch! Also a very small angle.
8.1.4 Distances to stars using parallax, and the “Parsec”
Because stars are very far away, the parallax motion will be very small. For example,the nearest star is about 1.9 × 10¹³ miles or 1.2 × 1018 inches away! At such atremendous distance, the apparent angular motion is very small. Considering the twovantage points of your two eyes, the angular motion of the nearest star correspondsto the apparent diameter of a human hair seen at the distance of the Sun! This is atruly tiny angle and totally unmeasurable by your eye.
Like a surveyor, we can improve our situation by using two more widely separatedvantage points. The two points farthest apart we can use from Earth is to use twoopposite points in the Earth’s orbit about the Sun. In other words, we need to observea star at two different times separated by six months. The distance between our twovantage points, b, will then be twice the distance between the Earth and the Sun: “2AU”. Figure 8.2 shows the idea.
Using 299.2 million km as the distance b, we find that the apparent angular motion(α) of even the nearest star is only about 0.0004 degrees. This is also unobservableusing your naked eye, which is why we cannot directly observe parallax by lookingat stars with our naked eye. However, this angle is relatively easy to measure usingmodern telescopes and instruments.
Time to talk about a new distance unit, the “Parsec”. Before we do so, we have toreview the idea of smaller angles than degrees. Your TA or professor might alreadyhave mentioned that a degree can be broken into 60 arcminutes. Thus, instead ofsaying the parallax angle is 0.02 degrees, we can say it is 1.2 arcminutes. But note thatthe nearest star only has a parallax angle of 0.024 arcminutes. We need to switch to asmaller unit to keep from having to use scientific notation: the arcsecond. There are60 arcseconds in an arcminute, thus the parallax angle (α) for the nearest star is 1.44arcseconds. To denote arcseconds astronomers append a single quotation mark (”) atthe end of the parallax angle, thus α = 1.44” for the nearest star. But remember, inconverting an angle into a distance (using the tangent or small angle approximation)we used the angle α/2. So when astronomers talk about the parallax of a star they
129

α
d
b
STAR
EarthEarth SUN
Figure 8.2: Parallax Method for Distance to a Star
use this angle, α/2, which we called “θ” in the small angle approximation equation.
How far away is a star that has a parallax angle of θ = 1”? The answer is 3.26 lightyears, and this distance is defined to be “1 Parsec”. The word Parsec comes fromParallax Second. An object at 1 Parsec has a parallax of 1”. An object at 10 Parsecshas a parallax angle of 0.1”. Remember, the further away an object is, the smaller theparallax angle. The nearest star (Alpha Centauri) has a parallax of θ = 0.78”, andis thus at a distance of 1/θ = 1/0.78 = 1.3 Parsecs. Depending on your professor,you might hear the words Parsec, kiloparsec, Megaparsec and even Gigaparsec inyour lecture classes. These are just shorthand methods of talking about distances inastronomy. A kiloparsec is 1,000 Parsecs, or 3,260 light years. A Megaparsec is onemillion parsecs, and a Gigaparsec is one billion parsecs. To convert to light years, yousimply have to multiply by 3.26. The Parsec is a strange unit, but you have alreadyencountered other strange units this semester!
Let’s work some examples:
• If a star has a parallax angle of θ = 0.25”, what is its distance in Parsecs? (1
130

point)
• If a star is at a distance of 5 Parsecs, what is its parallax angle? (1 point)
• If a star is at a distance of 5 Parsecs, how many light years away is it? (1point)
8.2 Questions
1. How does the parallax angle change as an object is moved further away? Giventhat you can usually only measure an angular motion to some accuracy, wouldit be easier to measure the distance to a nearby star or a more distant star?Why? (4 points)
2. Relate the experiment you did in lab to the way parallax is used to measure thedistances to nearby stars in astronomy. Describe the process an astronomer hasto go through in order to determine the distance to a star using the parallaxmethod. What do your two eyes represent in that experiment? (5 points)
131

3. Imagine that you observe a star field twice one year, separated by six monthsand observe the configurations of stars shown in Figure 8.3:
BA BAP P
Figure 8.3: Star field seen at two times of year six months apart.
The star marked P appears to move between your two observations because ofparallax. So you can consider the two pictures to be like our lab experimentwhere the left picture is what is seen by one eye and the right picture whatis seen by the other eye. All the stars except star P do not appear to changeposition; they correspond to the background ruler in our lab experiment. Ifthe angular distance between stars A and B is 0.5 arcminutes (remember, 60arcminutes = 1 degree), then how far away would you estimate that star P is?Proceed by estimating the amount that star P moves between the two picturesrelative to the distance between stars A and B. This gives you the apparentangular motion. You also know the distance between the two vantage points(which is the Earth at two opposite sides of its orbit) from the number given inSection 8.1.4. You can then use the parallax equation to estimate the distanceto star P . (11 points)
132

4. Imagine that you did the classroom experiment by putting your partner all theway against the far wall. How big would the apparent motion be relative to thetick marks? What would you infer about the distance to your partner? Whydo you think this estimate is incorrect? What can you infer about where thebackground objects in a parallax experiment need to be located? (7 points)
133

8.3 Summary (35 points)
Please summarize the important concepts discussed in this lab. Your summary shouldinclude:
• A brief description on the basic principles of parallax and how astronomers canuse parallax to determine the distance to nearby stars
Also think about and answer the following questions:
• Does the parallax method work for all stars we can see in our Galaxy and why?
• Why do you think it is important for astronomers to determine the distancesto the stars which they study?
Use complete sentences, and proofread your summary before handing in the lab.
8.4 Possible Quiz Questions
1) How do astronomers measure distances to stars?2) How can astronomers measure distances inside the Solar System?3) What is an Astronomical Unit?4) What is an arcminute?5) What is a Parsec?
8.5 Extra Credit (ask your TA for permission be-
fore attempting, 5 points )
Use the web to find out about the planned GAIA Mission. What are the goals ofGAIA? How accurately can it measure a parallax? Discuss the units of milliarcseconds(“mas”) and microarcseconds. How much better is GAIA than the best ground-basedparallax measurement programs?
134

Name:
Lab 9
Optics
9.1 Introduction
Unlike other scientists, astronomers are far away from the objects they want to exam-ine. Therefore astronomers learn everything about an object by studying the light itemits. Since objects of astronomical interest are far away, they appear very dim andsmall to us. Thus astronomers must depend upon telescopes to gather more informa-tion. Lenses and mirrors are used in telescopes which are the instruments astronomersuse to observe celestial objects. Therefore it is important for us to have a basic un-derstanding of optics in order to optimize telescopes and interpret the informationwe receive from them.
The basic idea of optics is that mirrors or lenses can be used to change the directionwhich light travels. Mirrors change the direction of light by reflecting the light, whilelenses redirect light by refracting, or bending the light.
The theory of optics is an important part of astronomy, but it is also very useful inother fields. Biologists use microscopes with multiple lenses to see very small objects.People in the telecommunications field use fiber optic cables to carry information atthe speed of light. Many people benefit from optics by having their vision correctedwith eyeglasses or contact lenses.
This lab will teach you some of the basic principles of optics which will allow you tobe able to predict what mirrors and lenses will do to the light which is incident onthem. At the observatory you use real telescopes, so the basic skills you learn in thislab will help you understand telescopes better.
135

• Goals: to discuss the properties of mirrors and lenses, and demonstrate themusing optics; build a telescope
• Materials: optical bench, ray trace worksheet, meterstick
9.2 Discussion
The behavior of light depends on how it strikes the surface of an object. All anglesare measured with respect to the normal direction. The normal direction is definedas a line which is perpendicular to the surface of the object. The angle between thenormal direction and the surface of the object is 90◦. Some important definitions aregiven below. Pay special attention to the pictures in Figure 9.1 since they relate tothe reflective (mirrors) and refractive (lenses) optics which will be discussed in thislab.
Figure 9.1: The definition of the “normal” direction n, and other angles found inoptics.
• n = line which is always perpendicular to the surface; also called the normal
• θI = angle of incidence; the angle between the incoming light ray and the normalto the surface
• θR = angle of reflection; the angle between the outgoing light ray and the normalto the surface
• αR = angle of refraction; the angle between the transmitted light ray and thenormal direction
136

9.3 Reflective Optics: Mirrors
How do mirrors work? Let’s experiment by reflecting light off of a simple flat mirror.
As part of the equipment for this lab you have been given a device that has a largewooden protractor mounted in a stand that also has a flat mirror. Along with thisset-up comes a “Laser Straight” laser alignment tool. Inside the Laser Straight is asmall laser. There is a small black switch which turns the laser on and off. Keep it off,except when performing the following exercise (always be careful around lasers–theycan damage your eyes if you stare into them!).
With this set-up, we can explore how light is reflected off of a flat mirror. Turn on theLaser Straight, place it on the wooden part of the apparatus outside the edge of theprotractor so that the laser beam crosses across the protractor scale and interceptsthe mirror. Align the laser at some angle on the protractor, making sure the laserbeam passes through the vertex of the protractor. Note how the “incident” laser beamis reflected. Make a sketch of what you observe in the space below.
Now experiment using different angles of incidence by rotating the Laser Straightaround the edge of the protractor, always insuring the laser hits the mirror exactlyat the vertex of the protractor. Note that an angle of incidence of 90o correspondsto the “normal” defined above (see Fig. 9.1.a). Fill in the following table of angle ofincidence vs. angle of reflection. (3 pts)
137

Table 9.1: Data Table
Angle of Incidence Angle of Reflection20o
30o
45o
60o
75o
90o
What do you conclude about how light is reflected from a mirror? (2 pts)
The law governing the behavior of light when it strikes a mirror is known as the Lawof Reflection:
angle of incidence = angle of reflectionθI = θR
OK, now what happens if you make the mirror curved? First let’s consider a con-cave mirror, one which is curved away from the light source. Try to think about thecurved mirror as being made up of lots of small sections of flat mirrors, and make aprediction for what you will see if you put a curved mirror in the light path. Youmight try to make a drawing in the space below:
At the front of the classroom is in fact just such a device: A curved wooden base towhich are glued a large number of flat mirrors, along with a metal stand that hasthree lasers mounted in it, and the “disco5000” smoke machine. Have your TA turnon the lasers, align them onto the multi-mirror apparatus, and spew some smoke!
138

Was your prediction correct?
Also at the front of the room are two large curved mirrors. There are two types ofcurved mirrors, “convex” and “concave”. In a convex mirror, the mirror is curvedoutwards, in a concave mirror, the mirror is curved inwards (“caved” in). Light thatis reflected from these two types of mirrors behaves in different ways. In this sectionof the lab, you will investigate how light behaves when encountering a curved mirror.
1) Have your TA place the laser apparatus in front of the convex mirror, and spewsome more smoke. BE CAREFUL NOT TO LET THE LASER LIGHT HITYOUR EYE. What happens to the laser beams when they are reflected off of theconvex mirror? Make a drawing of how the light is reflected (using the attached worksheet, the diagram labeled “Convex Mirror” in Figure 9.4. (5 pts)
2) Now have your TA replace the convex mirror with the concave mirror. Now whathappens to the laser beams? Draw a diagram of what happens (using the sameworksheet, in the space labeled “Concave Mirror”). (5 pts)
Note that there are three laser beams. Using a piece of paper, your hand, or someother small opaque item, block out the top laser beam on the stand. Which of thereflected beams disappeared? What happens to the images of the laser beams uponreflection? Draw this result (5 pts):
The point where the converging laser beams cross is called the “focus”. From theseexperiments, we can draw the conclusion that concave mirrors focus light, convex
139

mirrors diverge light. Both of the mirrors are 61 cm in diameter. Using a meter stick,how far from the mirror is the convergent point of the reflected light (“where is thebest focus achieved”)? (3 pts)
This distance is called the “focal length”. For concave mirrors the focal length isone half of the “radius of curvature” of the mirror. If you could imagine a sphericalmirror, cut the sphere in half. Now you have a hemispherical mirror. The radius ofthe hemisphere is the same as the radius of the sphere. Now, imagine cutting a smallcap off of the hemisphere–now you have a concave mirror, but it is a piece of a spherethat has the same radius as before!
What is the radius of curvature of the big concave mirror? (1 pt)
Ok, with the lasers off, look into the concave mirror, is your face larger or smaller?Does a concave mirror appear to magnify, or demagnify your image. How about theconvex mirror, does it appear to magnify, or demagnify? (1 pt):
9.4 Refractive Optics: Lenses
OK, how about lenses? Do they work in a similar way?
For this section of the lab, we will be using an “optical bench” that has a light sourceon one end, and a projection (imaging) screen on the other end. To start with, therewill be three lenses attached mounted on the optical bench. Loosen the (horizontal)thumbscrews and remove the three lenses from the optical bench. Two of the lenseshave the same diameter, and one lens is larger. Holding one of the lenses by the steelshaft, examine whether this lens can be used as a “magnifying glass”, that is whenyou look through it, do objects appear bigger, or smaller? You will find that two ofthe lenses are “positive” lenses in that they magnify objects, and one is a “negative”lens that acts to “de-magnify” objects. Note how easy it is to decide which lenses arepositive and which one is the negative lens.
Now we are going to attempt to measure the “focal lengths” of these lenses. First,
140

remount the smaller positive lens back on the optical bench. Turn on the light bysimply connecting the light source to the battery or transformer using the alligatorclips (be careful not to let the alligator clips touch each other or else the transformerwill be damaged). Take the smaller positive lens move it to the middle of the opticalbench (tightening or loosing the vertical clamping screw to allow you to slide it backand forth). At the one end of the optical bench mount the white plastic viewingscreen. It is best to mount this at a convenient measurement spot–let’s choose toalign the plastic screen so that it is right at the 10 cm position on the meter stick.Now slowly move the lens closer to the screen. As you do so, you should see a circleof light that decreases in size until you reach “focus” (for this to work, however, yourlight source and lens have to be at the same height above the meter stick!). Measurethe distance between the lens and the plastic screen. Write down this number, wewill call it “a”.
The distance “a” = cm (1 pt)
Now measure the distance between the lens and the front end of the light source.Write down this number, we will call it “b”:
The distance “b” = cm (1 pt)
To determine the focal length of a lens (“F”), there is a formula called “the lensmaker’s formula”:
1
F=
1
a+
1
b(9.1)
Calculate the focal length of the small positive lens (2 pts): F = cm
Now replace the positive lens with the small negative lens. Repeat the process. Canyou find a focus with this lens? What appears to be happening? (4 pts)
141

How does the behavior of these two lenses compare with the behavior of mirrors?Draw how light behaves when encountering the two types of lenses using Figure 9.5.Note some similarities and differences between what you have drawn in Fig. 9.4, andwhat you drew in Fig. 9.5 and write them in the space below. (5 pts)
Ok, now let’s go back and mount the larger lens on the optical bench. This lens has avery long focal length. Remove the light source from the optical bench. Now mountthe big lens exactly 80 cm from the white screen. Holding the light source “out inspace”, move it back and forth until you can get the best focus (Note that this focuswill not be a point, but will be a focused image of the filament in the light bulb andshow-up as a small, bright line segment. This is a much higher power lens, so theimage is not squished down like occured with the smaller positive lens). Using thewooden meter stick, have your lab partners measure the distance between the lightsource and the lens. This is hard to do, but you should get a number that is close to80 cm. Assuming that a = b = 80 cm, use the lens maker’s formula to calculate F:
The focal length of the large lens is F = cm (2 pts)
Making a Telescope
As you have learned in class, Galileo is given credit as the first person to point atelescope at objects in the night sky. You are now going to make a telescope just likethat used by Galileo. Remove the white screen (and light source) from the opticalbench and mount (and lock) the large positive lens at the 10 cm mark on the yard-stick scale. Now mount the small negative lens about 40 cm away from the big lens.Looking at the furthest “eyechart” mounted in the lab room (maybe go to the backof the room if you are up front–you want to be as far from the eyechart as possible),focus the telescope by moving the little lens backwards or forwards. Once you achievefocus, let your lab partners look through the telescope too. Given that everyone’seyes are different, they may need to re-focus the little lens. Write down the distance“N” between the two lenses:
142

The distance between the two lenses is N = cm (2 pts)
Describe what you see when you look through the telescope: What does the im-age look like? Is it distorted? Are there strange colors? What is the smallest set ofletters you can read? Is the image right side up? Any other interesting observations?(5 pts):
This is exactly the kind of telescope that Galileo used. Shortly after Galileo’s ob-servations became famous, Johannes Kepler built his own telescopes, and describedhow they worked. Kepler suggested that you could make a better telescope using twopositive lenses. Let’s do that. Remove the small negative lens and replace it withthe small positive lens. Like before, focus your telescope on the eyechart, and leteveryone in your group do the same. Write down the distance “P” between the twolenses after achieving best focus:
The distance between the two lenses is P = cm (2 pts)
Describe what you see: What does the image look like? Is it distorted? Are therestrange colors? What is the smallest set of letters you can read? Is the image rightside up? Any other interesting observations? (5 pts):
143

Compare the two telescopes. Which is better? What makes it better? Note thatKepler’s version of the telescope did not become popular until many years later.Why do you think that is? (5 pts):
The Magnifying and Light Collecting Power of a Telescope
Telescopes do two important things: they collect light, and magnify objects. Astro-nomical objects are very far away, and thus you must magnify the objects to actuallysee any detail. Telescopes also collect light, allowing you to see fainter objects thancan be seen by your eye. It is easy to envision this latter function as two different sizebuckets sitting out in the rain. The bigger diameter bucket will collect more waterthan the smaller bucket. In fact, the amount of water collected goes as the area ofthe top of the bucket. If we have circular buckets, than given that the area of a circleis πR2, a bucket that is twice the radius, has four times the area, and thus collectsfour times the rain. The same relationship is at work for your eye and a telescope.The radius of a typical human pupil is 4 mm, while the big lens you have been usinghas a radius of 20 mm. Thus, the telescopes that you built collect 25 times as muchlight as your eyes.
Determining the magnification of a telescope is also very simple:
M =F
f(9.2)
Where “M” is the magnification, “F” is the focal length of the “objective” lens (thebigger of the two lenses), and “f” is the focal length of the “eyepiece” (the smallerof the two lenses). You have calculated both “F” and “f” in the preceeding for thetwo positive lenses, and thus can calculate themagnification of the “Kepler” telescope:
The magnification of the Kepler telescope is M = times. (1 pt)
Ok, how about the magnification of the Galileo telescope? The magnification for theGalileo telescope is calculated the same way:
144

M =F
f(9.3)
But remember, we could not measure a focal length (f) for the negative lens. Howcan this be done? With specialized optical equipment it is rather easy to measure thefocal length of a negative lens. But since we do not have that equipment, we haveto use another technique. In the following two figures we show a “ray diagram” forboth the Kepler and Galileo telescopes.
Figure 9.2: The ray diagram for Galileo’s telescope.
Figure 9.3: The ray diagram for Kepler’s telescope.
Earlier, we had you make various measurements of the lenses, and measure separationsof the lenses in both telescopes once they were focused. If you look at Figure 9.2 andFigure 9.3, you will see that there is a large “F”. This is the focal length of the large,positive lens (the “objective”). In Kepler’s telescope, when it is focused, you seethat the separation between the two lenses is the sum of the focal lengths of the twolenses. We called this distance “P”, above. You should confirm that the “P” youmeasured above is in fact equal (or fairly close) to the sum of the focal lengths ofthe two positive lenses: P = f + F (where little “f” is the focal length of the smallerpositive lens).
Ok, now look at Figure 9.2. Note that when this telescope is focused, the separationbetween the two lenses in the Galileo telescope is N = F − f (where F and f have thesame definition as before).
145

Find “f” for the Galileo telescope that you built, and determine the magnification ofthis telescope (3 pts):
Compare the magnification of your Galileo telescope to that you calculated for theKepler telescope (2 pts):
What do you think of the quality of images that these simple telescopes produce?Note how hard it is to point these telescopes. It was hard work for Galileo, and theobservers that followed him, to unravel what they were seeing with these telescopes.You should also know that the lenses you have used in this class, even though they arenot very expensive, are far superior to those that could be made in the 17th century.Thus, the simple telescopes you have constructed today are much better than whatGalileo used!
146

9.5 Summary (35 points)
Please summarize the important concepts of this lab.
• Describe the properties of the different types of lenses and mirrors discussed inthis lab
• What are some of the differences between mirrors and lenses?
• Why is the study of optics important in astronomy?
Use complete sentences, and proofread your lab before handing it in.
9.6 Possible Quiz Questions
1) What is a “normal”?2) What is a concave mirror?3) What is a convex lens?4) Why do astronomers need to use telescopes?
9.7 Extra Credit (ask your TA for permission be-
fore attempting, 5 points )
Astronomers constantly are striving for larger and larger optics so that they cancollect more light, and see fainter objects. Galileo’s first telescope had a simplelens that was 1” in diameter. The largest telescopes on Earth are the Keck 10 mtelescopes (10 m = 400 inches!). Just about all telescopes use mirrors. The reasonis that lenses have to be supported from their edges, while mirrors can be supportedfrom behind. But, eventually, a single mirror gets too big to construct. For thisextra credit exercise look up what kind of mirrors the 8 m Gemini telescopes have(at http://www.gemini.edu) versus the mirror system used by the Keck telescopes(http://keckobservatory.org/about/the observatory). Try to find out how they weremade using links from those sites. Write-up a description of the mirrors used in thesetwo telescopes. How do you think the next generation of 30 or 100 m telescopes willbe built, like Gemini, or Keck? Why?
147

Figure 9.4: The worksheet needed in section 9.2
148

Figure 9.5: The worksheet needed in section 9.3. The positive lenses used in this labare “double convex” lenses, while the negative lens is a “double concave” lens.
149

150

Name:
Lab 10
The Power of Light:Understanding Spectroscopy
10.1 Introduction
For most celestial objects, light is the astronomer’s only subject for study. Light fromcelestial objects is packed with amazingly large amounts of information. Studyingthe distribution of brightness for each wavelength (color) which makes up the lightprovides the temperature of a source. A simple example of this comes from flamecolor comparison. Think of the color of a flame from a candle (yellow) and a flamefrom a chemistry class Bunson burner (blue). Which is hotter? The flame from theBunson burner is hotter. By observing which color is dominant in the flame, we candetermine which flame is hotter or cooler. The same is true for stars; by observingthe color of stars, we can determine which stars are hot and which stars are cool.If we know the temperature of a star, and how far away it is (see the “MeasuringDistances Using Parallax” lab), we can determine how big a star is.
We can also use a device, called a spectroscope, to break-up the light from an objectinto smaller segments and explore the chemical composition of the source of light.For example, if you light a match, you know that the predominant color of the lightfrom the match is yellow. This is partly due to the temperature of the match flame,but it is also due to very strong emission lines from sodium. When the sodium atomsare excited (heated in the flame) they emit yellow light.
In this lab, you will learn how astronomers can use the light from celestial objectsto discover their nature. You will see just how much information can be packed intolight! The close-up study of light is called spectroscopy.
151

This lab is split into three main parts:
• Experimentation with actual blackbody light sources to learn about the quali-tative behavior of blackbody radiation.
• Computer simulations of the quantitative behavior of blackbody radiation.
• Experimentation with emission line sources to show you how the spectra of eachelement is unique, just like the fingerprints of human beings.
Thus there are three main components to this lab, and they can be performed in anyorder. So one third of the groups can work on the computers, while the other groupswork with the spectrographs and various light sources.
• Goals: to discuss the properties of blackbody radiation, filters, and see therelationship between temperature and color by observing light bulbs and thespectra of elements by looking at emission line sources through a spectrograph.Using a computer to simulate blackbody. radiation
• Materials: spectrograph, adjustable light source, gas tubes and power source,computers, calculators
10.2 Blackbody Radiation
Blackbody radiation (light) is produced by any hot, dense object. By “hot” we meanany object with a temperature above absolute zero. All things in the Universe emitradiation, since all things in the Universe have temperatures above absolute zero.Astronomers idealize a perfect absorber and perfect emitter of radiation and call ita “blackbody”. This does not mean it is black in color, simply that it absorbs andemits light at all wavelengths, so no light is reflected. A blackbody is an object whichis a perfect absorber (absorbs at all wavelengths) and a perfect emitter (emits at allwavelengths) and does not reflect any light from its surface. Astronomical objects arenot perfect blackbodies, but some, in particular, stars, are fairly well approximatedby blackbodies.
The light emitted by a blackbody object is called blackbody radiation. This radiationis characterized simply by the temperature of the blackbody object. Thus, if we canstudy the blackbody radiation from an object, we can determine the temperature ofthe object.
To study light, astronomers often split the light up into a spectrum. A spectrumshows the distribution of brightness at many different wavelengths. Thus, a spectrum
152

can be shown using a graph of brightness vs. wavelength. A simple example of thisis if you were to look at a rainbow and record how bright each of the separate colorswere. Figure 10.1 shows what the brightness of the colors in a hot flame or hot starmight look like. At each separate color, a brightness is measured. By fitting a curve tothe data points, and finding the peak in the curve, we can determine the temperatureof the blackbody source.
Figure 10.1: Astronomers measure the amount of light at a number of different wave-lengths (or colors) to determine the temperature of a blackbody source. Every black-body has the same shape, but the peak moves to the violet/blue for hot sources, andto the red for cool sources. Thus we can determine the temperature of a blackbodysource by figuring out where the most light is emitted.
153

10.3 Absorption and Emission Lines
One question which you may have considered is: how do astronomers know whatelements and molecules make up astronomical objects? How do they know that theUniverse is made up mostly of hydrogen with a little bit of helium and a tiny bit ofall the other elements we have discovered on Earth? How do astronomers know thechemical make up of the planets in our Solar System? They do this by examining theabsorption or emission lines in the spectra of astronomical sources. [Note that theplural of spectrum is spectra.]
10.3.1 The Bohr Model of the Atom
In the early part of the last century, a group of physicists developed the QuantumTheory of the Atom. Among these scientists was a Danish physicist named NielsBohr. His model of the atom, shown in the figure below, is the easiest to understand.In the Bohr model, we have a nucleus at the center of the atom, which is really much,much smaller relative to the electron orbits than is illustrated in our figure. Almostall of the atom’s mass is located in the nucleus. For Hydrogen, the simplest elementknown, the nucleus consists of just one proton. A proton has an atomic mass unitof 1 and a positive electric charge. In Helium, the nucleus has two protons and twoother particles called neutrons which do not have any charge but do have mass. Anelectron cloud surrounds the nucleus. For Hydrogen there is only one electron. ForHelium there are two electrons and in a larger atom like Oxygen, there are 8. Theelectron has about 1
2000the mass of the proton but an equal and opposite electric
charge. So protons have positive charge and electrons have negative charge. Becauseof this, the electron is attracted to the nucleus and will thus stay as close to thenucleus as possible.
In the Bohr model, the electron is allowed to exist only at certain distances from thenucleus. This also means the electron is allowed to have only certain orbital energies.Often the terms orbits, levels, and energies are used interchangeably so try not to getconfused. They all mean the same thing and all refer to the electrons in the Bohrmodel of the atom.
Now that our model is set up let’s look at some situations of interest. When scientistsstudied simple atoms in their normal, or average state, they found that the electronwas found in the lowest level. They named this level the ground level. When an atomis exposed to conditions other than average, say for example, putting it in a verystrong electric field, or by increasing its temperature, the electron will jump from innerlevels toward outer levels. Once the abnormal conditions are taken away, the electronjumps downward towards the ground level and emits some light as it does so. Theinteresting thing about this light is that it comes out at only particular wavelengths.It does not come out in a continuous spectrum, but at solitary wavelengths. What
154

has happened here?
After much study, the physicists found out that the atom had taken-in energy fromthe collision or from the surrounding environment and that as it jumps downwardin levels, it re-emits the energy as light. The light is a particular color because theelectron really is allowed only to be in certain discrete levels or orbits. It cannot behalfway in between two energy levels. This is not the same situation for large scaleobjects like ourselves. Picture a person in an elevator moving up and down betweenfloors in a building. The person can use the emergency stop button to stop in betweenany floor if they want to. An electron cannot. It can only exist in certain energylevels around a nucleus.
Now, since each element has a different number of protons and neutrons in its nucleusand a different number of electrons, you may think that studying “electron gymnas-tics” would get very complicated. Actually, nature has been kind to us because at anyone time, only a single electron in a given atom jumps around. This means that eachelement, when it is excited, gives off certain colors or wavelengths. This allows scien-tists to develop a color fingerprint for each element. This even works for molecules.These fingerprints are sometimes referred to as spectral lines. The light coming fromthese atoms does not take the shape of lines. Rather, each atom produces its own
155

set of distinct colors. Scientists then use lenses and slits to produce an image in theshape of a line so that they can measure the exact wavelength accurately. This is whyspectral lines get their name, because they are generally studied in a linear shape,but they are actually just different wavelengths of light.
10.3.2 Kirchoff’s Laws
Continuous spectra are the same as blackbody spectra, and now you know aboutspectral lines. But there are two types of spectral lines: absorption lines and emissionlines. Emission lines occur when the electron is moving down to a lower level, andemits some light in the process. An electron can also move up to a higher levelby absorbing the right wavelength of light. If the atom is exposed to a continuousspectrum, it will absorb only the right wavelength of light to move the electron up.Think about how that would affect the continuous spectrum. One wavelength of lightwould be absorbed, but nothing would happen to the other colors. If you looked at thesource of the continuous spectrum (light bulb, core of a star) through a spectrograph,it would have the familiar Blackbody spectrum, with a dark line where the light hadbeen absorbed. This is an absorption line.
The absorption process is basically the reverse of the emission process. The electronmust acquire energy (by absorbing some light) to move to a higher level, and it mustget rid of energy (by emitting some light) to move to a lower level. If you’re havinga hard time keeping all this straight, don’t worry. Gustav Kirchoff made it simplein 1860, when he came up with three laws describing the processes behind the threetypes of spectra. The laws are usually stated as follows:
156

• I. A dense object will produce a continuous spectrum when heated.
• II. A low-density, gas that is excited (meaning that the atoms have electronsin higher levels than normal) will produce an emission-line spectrum.
• III. If a source emitting a continuous spectrum is observed through a cooler,low-density gas, an absorption-line spectrum will result.
A blackbody produces a continuous spectrum. This is in agreement with Kirchoff’sfirst law. When the light from this blackbody passes through a cloud of cooler gas,certain wavelengths are absorbed by the atoms in that gas. This produces an absorp-tion spectrum according to Kirchoff’s third law. However, if you observe the cloudof gas from a different angle, so you cannot see the blackbody, you will see the lightemitted from the atoms when the excited electrons move to lower levels. This is theemission spectrum described by Kirchoff’s second law.
Kirchoff’s laws describe the conditions that produce each type of spectrum, and theyare a helpful way to remember them, but a real understanding of what is happeningcomes from the Bohr model.
In the second half of this lab you will be observing the spectral lines produced byseveral different elements when their gaseous forms are heated. The goal of thissection of the lab is to observe these emission lines and to understand their formationprocess.
10.4 Creating a Spectrum
Light which has been split up to create a spectrum is called dispersed light. Bydispersing light, one can see how pure white light is really made up of all possiblecolors. If we disperse light from astronomical sources, we can learn a lot about thatobject. To split up the light so you can see the spectrum, one has to have some kindof tool which disperses the light. In the case of the rainbow mentioned above, thedispersing element is actually the raindrops which are in the sky. Another commondispersing element is a prism.
We will be using an optical element called a diffraction grating to split a source ofwhite light into its component colors. A diffraction grating is a bunch of really,really, small rectangular openings called slits packed close together on a single sheetof material (usually plastic or glass). They are usually made by first etching a piece ofglass with a diamond and a computer driven etching machine and then taking eithercasts of the original or a picture of the original.
157

The diffraction grating we will be using is located at the optical entrance of aninstrument called a spectroscope. The image screen inside the spectroscope is wherethe dispersed light ends up. Instead of having all the colors land on the same spot,they are dispersed across the screen when the light is split up into its componentwavelengths. The resultant dispersed light image is called a spectrum.
10.5 Observing Blackbody Sources with the Spec-
trograph
In part one of this lab, we will study a common blackbody in everyday use: a simplewhite light bulb. Your Lab TA will show you a regular light bulb at two differentbrightnesses (which correspond to two different temperatures). The light bulb emitsat all wavelengths, even ones that we can’t see with our human eyes. You will alsouse a spectroscope to observe emission line sources
1. First, get a spectroscope from your lab instructor. Study Figure 10.2 figure outwhich way the entrance slit should line up with the light source. DO NOTTOUCH THE ENTRANCE SLIT OR DIFFRACTION GRATING!Touching the plastic ends degrades the effectiveness and quality of the spectro-scope.
2. Observe the light source at the brighter (hotter) setting.
3. Do you see light at all different wavelengths/colors or only a few discrete wave-lengths? (2 points)
4. Of all of the colors which you see in the spectrographs, which color appears thebrightest?(3 points)
5. Now let us observe the light source at a cooler setting. Do you see light at alldifferent wavelengths/colors or only a few discrete wavelengths? Of all of the
158

Figure 10.2:
colors which you see in the spectrographs, which color appears the brightest?(3 points)
6. Describe the changes between the two light bulb observations. What happenedto the spectrum as the brightness and temperature of the light bulb increased?Specifically, what happened to the relative amount of light at different wave-lengths?(5 points)
7. Betelgeuse is a Red Giant Star found in the constellation Orion. Sirius, thebrightest star in the sky, is much hotter and brighter than Betelgeuse. Describe
159

how you might expect the colors of these two stars to differ. (4 points)
10.6 Quantitative Behavior of Blackbody Radia-
tion
This section, which your TA may make optional (or done as one big group), shouldbe done outside of class on a computer with network access, we will investigate howchanging the temperature of a source changes the characteristics of the radiationwhich is emitted by the source. We will see how the measurement of the color ofan object can be used to determine the object’s temperature. We will also see howchanging the temperature of a source also affects the source’s brightness.
To do this, we will use an online computer program which simulates the spectrum forobjects at a given temperature. This program is located here:
http://www.mhhe.com/physsci/astronomy/applets/Blackbody/
applet_files/BlackBody.html
The program just produces a graph of wavelength on the x-axis vs. brightness on they-axis; you are looking at the relative brightness of this source at different wavelengths.
The program is simple to use. There is a sliding bar on the bottom of the “applet”that allows you to set the temperature of the star. Play around with it a bit to getthe idea. Be aware that the y-axis scale of the plot will change to make sure thatnone of the spectrum goes off the top of the plot; thus if you are looking at objectsof different temperature, the y-scale can be different.
Note that the temperature of the objects are measured in units called degrees Kelvin(K). These are very similar to degrees Centigrade/Celsius (C); the only difference isthat: K = C + 273. So if the outdoor temperature is about 20 C (68 Fahrenheit),then it is 293 K. Temperatures of stars are measured in thousands of degrees Kelvin;they are much hotter than it is on Earth!
1. Set the object to a temperature of around 6000 degrees, which is the temperature
160
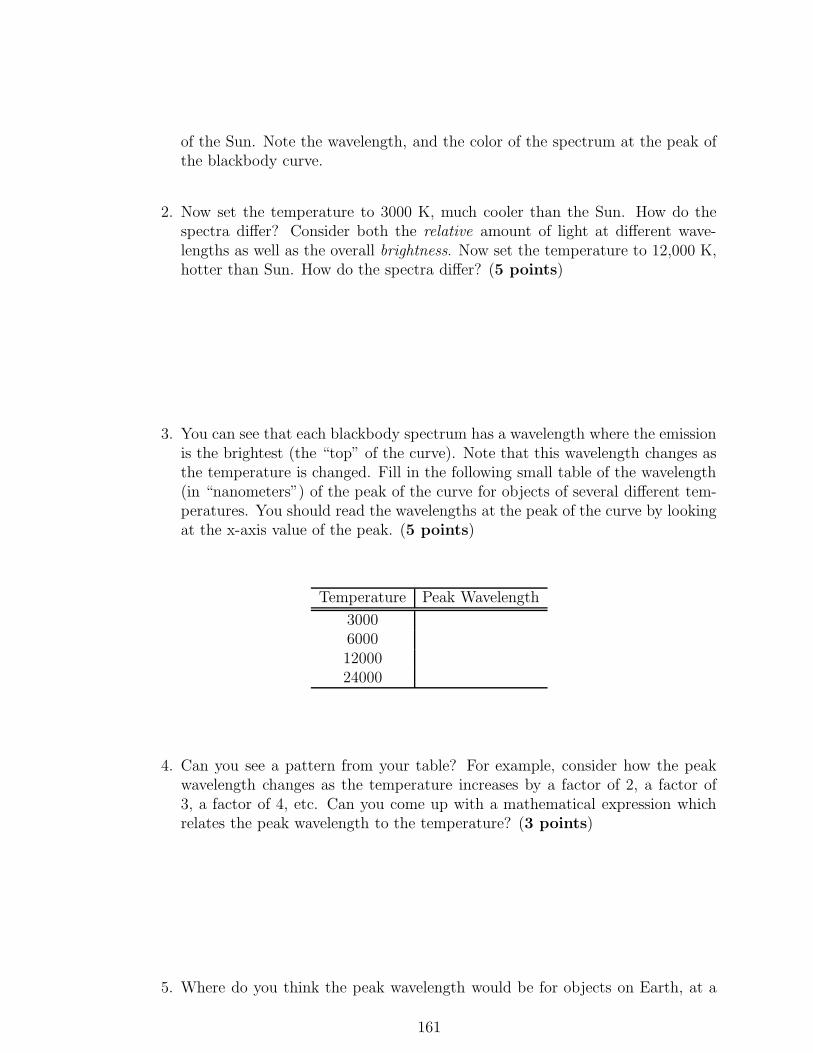
of the Sun. Note the wavelength, and the color of the spectrum at the peak ofthe blackbody curve.
2. Now set the temperature to 3000 K, much cooler than the Sun. How do thespectra differ? Consider both the relative amount of light at different wave-lengths as well as the overall brightness. Now set the temperature to 12,000 K,hotter than Sun. How do the spectra differ? (5 points)
3. You can see that each blackbody spectrum has a wavelength where the emissionis the brightest (the “top” of the curve). Note that this wavelength changes asthe temperature is changed. Fill in the following small table of the wavelength(in “nanometers”) of the peak of the curve for objects of several different tem-peratures. You should read the wavelengths at the peak of the curve by lookingat the x-axis value of the peak. (5 points)
Temperature Peak Wavelength
300060001200024000
4. Can you see a pattern from your table? For example, consider how the peakwavelength changes as the temperature increases by a factor of 2, a factor of3, a factor of 4, etc. Can you come up with a mathematical expression whichrelates the peak wavelength to the temperature? (3 points)
5. Where do you think the peak wavelength would be for objects on Earth, at a
161

temperature of about 300 degrees K? (2 points)
10.7 Spectral Lines Experiment
10.7.1 Spark Tubes
In space, atoms in a gas can get excited when light from a continuous source heatsthe gas. We cannot do this easily because it requires extreme temperatures, but wedo have special equipment which allows us to excite the atoms in a gas in anotherway. When two atoms collide they can exchange kinetic energy (energy of motion)and one of the atoms can become excited. This same process can occur if an atomcollides with a high speed electron. We can generate high speed electrons simply -it’s called electricity! Thus we can excite the atoms in a gas by running electricitythrough the gas.
The instrument we will be using is called a spark tube. It is very similar to theequipment used to make neon signs. Each tube is filled with gas of a particularelement. The tube is placed in a circuit and electricity is run through the circuit.When the electrons pass through the gas they collide with the atoms causing themto become excited. So the electrons in the atoms jump to higher levels. When theseexcited electrons cascade back down to the lower levels, they emit light which we canrecord as a spectrum.
10.7.2 Emission-line Spectra Experiment
For the third, and final section of this lab you will be using the spectrographs to lookat the spark tubes that are emission line sources.
• The TA will first show you the emission from hot Hydrogen gas. Notice howsimple this spectrum is. On the attached graphs, make a drawing of the linesyou see in the spectrum of hydrogen. Be sure to label the graph so you rememberwhich element the spectrum corresponds to. (4 points)
• Next the TA will show you Helium. Notice that this spectrum is more compli-cated. Draw its spectrum on the attached sheet.(4 points)
162

• Depending on which tubes are available, the TA will show you at least 3 moreelements. Draw and label these spectra on your sheet as well.(4 points)
10.7.3 The Unknown Element
Now your TA will show you one of the elements again, but won’t tell you which one.This time you will be using a higher quality spectroscope (the large gray instrument)to try to identify which element it is by comparing the wavelengths of the spectrallines with those in a data table. The gray, table-mounted spectrograph is identicalin nature to the handheld spectrographs, except it is heavier, and has a more stablewavelength calibration. When you look through the gray spectroscope you will seethat there is a number scale at the bottom of the spectrum. These are the wavelengthsof the light in “nanometers” (1 nm = 10−9 meter). Look through this spectrographat the unknown element and write down the wavelengths of the spectral lines thatyou can see in the table below, and note their color.
Table 10.1: Unknown Emission Line Source
Observed Wavelength (nm) Color of Line
Now, compare the wavelengths of the lines in your data table to each of the threeelements listed below. In this next table we list the wavelengths (in nanometers) ofthe brightest emission lines for hydrogen, helium and argon. Note that most humanscannot see light with a wavelength shorter than 400 nm or with a wavelength longerthan 700 nm.
Which element is the unknown element? (5 points)
10.8 Questions
1. Describe in detail why the emission or absorption from a particular electronwould produce lines only at specific wavelengths rather than at all wavelengthslike a blackbody. (Use the Bohr model to help you answer this question.) (5
163

Table 10.2: Emission Line Wavelengths
Hydrogen Helium Argon656.3 728.1 714.7486.1 667.8 687.1434.0 587.5 675.2410.2 501.5 560.6397.0 492.1 557.2388.9 471.3 549.5
points)
2. What causes a spectrum to have more lines than another spectrum (for example,Helium has more lines than Hydrogen)? (4 points)
3. Referring to Fig. 10.3, does the electron transition in the atom labeled “A”
164

cause the emission of light, or require the absorption of light? (2 points)
4. Referring to Fig. 10.3, does the electron transition in the atom labeled “B”cause the emission of light, or require the absorption of light? (2 points)
5. Comparing the atom labeled “C” to the atom labeled “D”, which transition(that occurring in C, or D) releases the largest amount of energy? (3 points)
Figure 10.3: Electron transitions in an atom (the electrons are the small dots, thenucleus the large black dots, and the circles are possible orbits.
165

10.9 Summary (35 points)
Summarize the important ideas covered in this lab. Some questions to answer are:
• What information you can learn about a celestial object just by measuring thepeak of its blackbody spectrum?
• What does a blackbody spectrum look like?
• How does the peak wavelength change as the temperature of a blackbodychanges?
• How can you quantitatively measure the color of an object?
• Do the color of items you see around you on Earth (e.g. a red and blue shirt)tell you something about the temperature of the object? Why or why not?
• What information can you learn about an astronomical object from its spec-trum?
• Explain how you would get this information from a spectrum.
Use complete sentences, and proofread your summary before handing in the lab.
10.10 Possible Quiz Questions
1. What is meant by the term “blackbody”?
2. What type of sources emit a blackbody spectrum?
3. How is an emission line spectrum produced?
4. How is an absorption line spectrum produced?
5. What type of instrument is used to produce a spectrum?
10.11 Extra Credit (ask your TA for permission
before attempting, 5 points)
Research how astronomers use the spectra of binary stars to determine their masses.Write a one page paper describing this technique, including a figure detailing what ishappening.
166

167

168

Name:
Lab 11
Our Sun
11.1 Introduction
The Sun is a very important object for all life on Earth. The nuclear reactionswhich occur in its core produce the energy which plants and animals need to survive.We schedule our lives around the rising and setting of the Sun in the sky. Duringthe summer, the Sun is higher in the sky and thus warms us more than during thewinter, when the Sun stays low in the sky. But the Sun’s effect on Earth is even morecomplicated than these simple examples.
The Sun is the nearest star to us, which is both an advantage and a disadvantage forastronomers who study stars. Since the Sun is very close, and very bright, we knowmuch more about the Sun than we know about other distant stars. This complicatesthe picture quite a bit since we need to better understand the physics going in the Sunin order to comprehend all our detailed observations. This difference makes the job ofsolar astronomers in some ways more difficult than the job of stellar astronomers, andin some ways easier! It’s a case of having lots of incredibly detailed data. But all ofthe phenomena associated with the Sun are occurring on other stars, so understandingthe Sun’s behavior provides insights to how other stars might behave.
• Goals: to discuss the layers of the Sun and solar phenomena; to use theseconcepts in conjunction with pictures to deduce characteristics of solar flares,prominences, sunspots, and solar rotation
• Materials: You will be given a Sun image notebook, a bar magnet with ironfilings and a plastic tray. You will need paper to write on, a ruler, and acalculator
169

Figure 11.1: A diagram of the various layers/components of the Sun, as well as theappearance and location of other prominent solar features.
11.2 Layers of the Sun
One of the things we know best about the Sun is its overall structure. Figure 11.1 is aschematic of the layers of the Sun’s interior and atmosphere. The interior of the Sunis made up of three distinct regions: the core, the radiative zone, and the convectivezone. The core of the Sun is very hot and dense. This is the only place in the Sunwhere the temperature and pressure are high enough to support nuclear reactions.The radiative zone is the region of the sun where the energy is transported throughthe process of radiation. Basically, the photons generated by the core are absorbedand emitted by the atoms found in the radiative zone like cars in stop and go traffic.This is a very slow process. The convective zone is the region of the Sun where energyis transported by rising “bubbles” of material. This is the same phenomenon thattakes place when you boil a pot of water. The hot bubbles rise to the top, cool, andfall back down. This gives the the surface of the Sun a granular look. Granules arebright regions surrounded by darker narrow regions. These granules cover the entiresurface of the Sun.
The atmosphere of the Sun is also comprised of three layers: the photosphere, thechromosphere, and the corona. The photosphere is a thin layer that forms the visiblesurface of the Sun. This layer acts as a kind of insulation, and helps the Sun retainsome of its heat and slow its consumption of fuel in the core. The chromosphere isthe Sun’s lower atmosphere. This layer can only be seen during a solar eclipse sincethe photosphere is so bright. The corona is the outer atmosphere of the Sun. It isvery hot, but has a very low density, so this layer can only be seen during a solareclipse (or using specialized telescopes). More information on the layers of the Suncan be found in your textbook.
170

11.3 Sunspots
Sunspots appear as dark spots on the photosphere (surface) of the Sun (see Figure11.2). They last from a few days to over a month. Their average size is about the sizeof the Earth, although some can grow to many times the size of the Earth! Sunspotsare commonly found in pairs. How do these spots form?
Figure 11.2: A large, complicated group of Sunspots.
The formation of sunspots is attributed to the Sun’s differential rotation. The Sun isa ball of gas, and therefore does not rotate like the Earth or any other solid object.The Sun’s equator rotates faster than its poles. It takes roughly 25 days for materialto travel once around the equator, but about 35 days for it to travel once aroundnear the north or south poles. This differential rotation acts to twist up the magneticfield lines inside the Sun. At times, the lines can get so twisted that they pop outof the photosphere. Figure 11.3 illustrates this concept. When a magnetic field looppops out, the places where it leaves and re-enters the photosphere are cooler than therest of the Sun’s surface. These cool places appear darker, and therefore are called“sunspots”.
The number of sunspots rises and falls over an 11 year period. This is the amount oftime it takes for the magnetic lines to tangle up and then become untangled again.
171

Figure 11.3: Sunspots are a result of the Sun’s differential rotation.
This is called the Solar Cycle. Look in your textbook for more information onsunspots and the solar cycle.
11.4 Solar Phenomenon
The Sun is a very exciting place. All sorts of activity and eruptions take place in itand around it. We will now briefly discuss a few of these interesting phenomena. Youwill be analyzing pictures of prominences during this lab.
Prominences are huge loops of glowing gas protruding from the chromosphere. Chargedparticles spiral around the magnetic field lines that loop out over the surface of theSun, and therefore we see bright loops above the Sun’s surface. Very energetic promi-nences can break free from the magnetic field lines and shoot out into space.
Flares are brief but bright eruptions of hot gas in the Sun’s atmosphere. Theseeruptions occur near sunspot groups and are associated with the Sun’s intertwinedmagnetic field lines. A large flare can release as much energy as 10 billion megatonsof TNT! The charged particles that flares emit can disrupt communication systemshere on Earth.
Another result of charged particles bombarding the Earth is the Northern Lights.When the particles reach the Earth, they latch on to the Earth’s magnetic field lines.These lines enter the Earth’s atmosphere near the poles. The charged particles fromthe Sun then excite the molecules in Earth’s atmosphere and cause them to glow.Your textbook will have more fascinating information about these solar phenomena.
172

11.5 Lab Exercises
There are three main exercises in this lab. The first part consists of a series of“stations” in a three ring binder where you examine some pictures of the Sun andanswer some questions about the images that you see. Use the information thatyou have learned from lectures and your book to give explanations for the differentphenomena that you see at each station. In the second exercise you will learn aboutmagnetic fields using a bar magnet and some iron filings. Finally, for those labs thatoccur during daylight hours (i.e., starting before 5 pm!), you will actually look atthe Sun using a special telescope to see some of the phenomena that were detailedin the images in the first exercise of this lab (for those students in nighttime labs,arrangements might be made so as to observe the Sun during one of your lecturesections). During this lab you will use your own insight and knowledge of basicphysics and astronomy to obtain important information about the phenomena thatwe see on the Sun, just as solar astronomers do. As with all of the other exercisesin this lab manual, if there is not sufficient room to write in your answers into thislab, do not hesitate to use additional sheets of paper. Do not try to squeeze youranswers into the tiny blank spaces in this lab description if you need more space thenprovided! Don’t forget to SHOW ALL OF YOUR WORK.
One note of caution about the images that you see: the colors of the pictures (es-pecially those taken by SOHO) are not true colors, but are simply colors used bythe observatories’ image processing teams to best enhance the features shown in theimage.
11.5.1 Exercise #1: Getting familiar with the Size and Ap-pearance of the Sun
Station 1: In this first station we simply present some images of the Sun to familiarizeyourself with what you will be seeing during the remainder of this lab. Note thatthis station has no questions that you have to answer, but you still should take timeto familiarize yourself with the various features visible on/near the Sun, and getcomfortable with the specialized, filtered image shown here.
• The first image in this station is a simple “white light” picture of the Sunas it would appear to you if you were to look at it in a telescope that wasdesigned for viewing the Sun. Note the dark spots on the surface of the Sun.These are “sunspots”, and are dark because they are cooler than the rest of thephotosphere.
• When we take a very close-up view of the Sun’s photosphere we see that it isbroken up into much smaller “cells”. This is the “solar granulation”, and is
173

shown in picture #2. Note the size of these granules. These convection cellsare about the size of New Mexico!
• To explore what is happening on the Sun more fully requires special tools. If youhave had the spectroscopy lab, you will have seen the spectral lines of elements.By choosing the right element, we can actually probe different regions in theSun’s atmosphere. In our first example, we look at the Sun in the light of thehydrogen atom (“H-alpha”). This is the red line in the spectrum of hydrogen.If you have a daytime lab, and the weather is good, you will get to see the Sunjust like it appears in picture #3. The dark regions in this image is where coolgas is present (the dark spot at the center is a sunspot). The dark linear, andcurved features are “prominences”, and are due to gas caught in the magneticfield lines of the underlying sunspots. They are above the surface of the Sun,so they are a little bit cooler than the photosphere, and therefore darker.
• Picture #4 shows a “loop’ prominence located at the edge (or “limb”) of theSun (the disk of the Sun has been blocked out using a special telescope called a“coronograph” to allow us to see activity near its limb). If the Sun cooperates,you may be able to see several of these prominences with the solar telescope.You will be returning to this image in Exercise #2.
Station 2: Here are two images of the Sun taken by the SOHO satellite several daysapart (the exact times are at the top of the image). (8 points)
• Look at the sunspot group just below center of the Sun in image 1, and thennote that it has rotated to the western (right-hand) limb of the Sun in image2. Since the sunspot group has moved from center to limb, you then know thatthe Sun has rotated by one quarter of a turn (90◦).
• Determine the precise time difference between the images. Use this informationplus the fact that the Sun has turned by 90 degrees in that time to determinethe rotation rate of the Sun. If the Sun turns by 90 degrees in time t, it wouldcomplete one revolution of 360 degrees in how much time?
174

• Does this match the rotation rate given in your textbook or in lecture? Showyour work.
In the second photograph of this station are two different images of the Sun: the oneon the left is a photo of the Sun taken in the near-infrared at Kitt Peak NationalObservatory, and the one on the right is a “magnetogram” (a picture of the magneticfield distribution on the surface of the Sun) taken at about the same time. (Note thatblack and white areas represent regions with different polarities, like the north andsouth poles of the bar magnet used in the second part of this lab.) (7 points)
• What do you notice about the location of sunspots in the photo and the locationof the strongest magnetic fields, shown by the brightest or darkest colors in themagnetogram?
• Based on this answer, what do you think causes sunspots to form? Why arethey dark?
Station 3: Here is a picture of the corona of the Sun, taken by the SOHO satellite inthe extreme ultraviolet. (An image of the Sun has been superimposed at the centerof the picture. The black ring surrounding it is a result of image processing and isnot real.) (10 points)
175

• Determine the diameter of the Sun, then measure the minimum extent of thecorona (diagonally from upper left to lower right).
• If the photospheric diameter of the Sun is 1.4 million kilometers (1.4 x 10⁶ km),how big is the corona? (HINT: use unit conversion!)
• How many times larger than the Earth is the corona? (Earth diameter=12,500km)
Station 4: This image shows a time-series of exposures by the SOHO satellite show-ing an eruptive prominence. (15 points)
• As in station 3, measure the diameter of the Sun and then measure the distanceof the top of the prominence from the edge of the Sun in the first (earliest)image. Then measure the distance of the top of the prominence from the edgeof the Sun in the last image.
176

• Convert these values into real distances based on the linear scale of the images.Remember the diameter of the Sun is 1.4 x 10⁶ kilometers.
• The velocity of an object is the distance it travels in a certain amount of time(vel=dist/time). Find the velocity of the prominence by subtracting the twodistances and dividing the answer by the amount of time between the twoimages.
• In the most severe of solar storms, those that cause flares, and “coronal massejections” (and can disrupt communications on Earth), the material ejected inthe prominence (or flare) can reach velocities of 2,000 kilometers per second. Ifthe Earth is 150 x 106 kilometers from the Sun, how long (hours or days) wouldit take for this ejected material to reach the Earth?
Station 5: This is a plot of where sunspots tend to occur on the Sun as a function oflatitude (top plot) and time (bottom plot). What do you notice about the distributionsunspots? How long does it take the pattern to repeat? What does this length oftime correspond to? (3 points)
177

11.5.2 Exercise #2: Exploring Magnetic Fields
The magnetic field of the Sun drives most of the solar activity. In this section wecompare the magnetic field of sunspots to that of a bar magnet (and an optionalexercise that shows that a magnetic field is generated by an electric current). Duringthis exercise you will be using a plastic tray in which you will sprinkle iron filings(small bits of iron) to trace the magnetic field of a bar magnet. This can be messy,so be careful as we only have a finite supply of these iron filings, and the other labsections will need to re-use the ones supplied to you.
• First, let’s explore the behavior of a compass in the presence of a magnetic field.Grab the bar magnet and wave the “north pole” (the red end of the bar magnetwith the large “N”) of the magnet by the compass. Which end of the compassneedle (or arrow) seems to be attracted by the north pole of the magnet? (1point)
• Ok, reverse the bar magnet so the south pole (white end) is the one closest tothe compass. Which end of the compass needle is attracted to the south poleof the bar magnet? (1 point)
• The compass needle itself is a little magnet, and the pointy, arrow end of thecompass needle is the north pole of this little magnet. Knowing this, what doesthis say about magnets? Which pole is attracted to which pole (and vice versa)?(1 point)
• As you know, a compass can be used to find your way if you are lost becausethe needle always points towards the North Pole of the Earth. The Earth hasits own magnetic field generated deep in its molten iron core. This field actsjust like that of a bar magnet. But given your answer to the last question, andthe fact that the “north pole” of the compass needle points to the North Pole ofthe Earth, what is the actual “polarity” of the Earth’s “magnetic North” pole?(1 point)
178

We have just demonstrated the power of attraction of a magnetic field. What does amagnetic field look like? In this section we use some iron filings, a plastic tray, andthe bar magnet to explore the appearance of a magnetic field, and compare that towhat we see on the Sun.
• Place the bar magnet on the table, and center the plastic tray on top of the barmagnet. Gently sprinkle the iron filings on to the plastic tray so that a thincoating covers the entire tray. Sketch the pattern traced-out by the magneticfilings below, and describe this pattern. (2 points)
179

• The iron filings trace the magnetic field lines of the bar magnet. The field linessurround the magnet in all dimensions (though we can only easily show themin two dimensions). Your TA will show you a device that has a bar magnetinside a plastic case to demonstrate the three dimensional nature of the field.Compare the pattern of the iron filings around the bar magnet to the pictureof the sunspot shown in Figure 11.4. They are similar! What does this implyabout sunspots? (3 points)
Figure 11.4: The darker region of this double sunspot is called the “umbra”, whilethe less dark, filamentary region is called the “penumbra”.
• Now, lets imagine what a fully three dimensional magnetic field looks like. Thepattern of the iron filings around the bar magnet would also exist into the space
180

above the bar magnet, but we cannot suspend the iron filings above the magnet.Complete Figure 11.5 by drawing-in what you imagine the magnetic field lineslook like above the bar magnet. (3 points)
Figure 11.5: Draw in the field lines above this bar magnet.
• Compare your drawing, above, to the image of the loop prominence seen instation #1 of Exercise #1. What are their similarities—imagine if the magneticfield lines emitted light, what would you expect to see? (2 points)
If a sunspot pair is like a little bar magnet on the surface of the Sun, the field extendsup into the atmosphere, and along the magnetic field charged particles can collect,and we see light emitted by these moving particles (mostly ionized hydrogen). Notethat we do not always see the complete set of field lines in prominences because ofthe lack of material high in the Sun’s atmosphere—but the bases of the prominencesare visible, and are located just above the sunspot.
*************If the weather is clear, and your TA is ready, you can proceed toExercise #3 to look at the Sun with a special solar telescope.************
181

Optional Exercise: Generating a magnetic field with an electric current
If yours is a nighttime lab, or the weather is poor, you may not be able to completeexercise #3. If this is the case, we offer this alternative exercise on how magneticfields are created.
How are magnetic fields generated? There are two general categories of magnetism,one is due to intrinsically magnetic materials such as the bar magnet you have beenplaying with, and the other are magnetic fields generated by electric currents. Themechanism for why some materials are magnetic is complicated, and requires anunderstanding of the atomic/molecular structure of materials, and is beyond thescope of this class. The second type of magnetism, that caused by electric currents,is more relevant for understanding solar activity.
Electricity and magnetism are intimately related, in fact, scientists talk about thetheory of “Electromagnetism”. An electric current, which is (usually) composed ofmoving electrons, generates a magnetic field. A moving magnetic field, can generatean electric current. The magnetic fields of both the Earth and the Sun are generatedbecause they have regions deep inside them that act as electromagnetic fluids. Inthe Earth’s core, it is very hot, and the iron there is molten. Due to the rotationof the Earth, this molten iron fluid is rotating very quickly. Thus, the liquid ironcore acts like a current flowing around a wire and can generate a magnetic field. Asimilar process occurs in the Sun. The gas in the interior of the Sun is “ionized”(the electrons are no longer bound to the protons), and thus the rotation of the Sunspins this ionized gas around generating an electric current that, in turn, generates amagnetic field.
In this exercise you will be using a voltage source (either a battery or low voltagetransformer) to generate an electric current to produce a magnetic field. For our“electromagnet” we will simply use a bolt wound with wire. The current flows throughthe wire, which generates a magnetic field that is carried by the nail. (Warning:the wire and/or bolt can get fairly hot if you leave the current on too long,so be careful!)
• Take the two ends of the wire that is wound around the bolt and hook themto the terminals of the lantern battery (or 6V transformer). You now have anelectromagnet. Move the compass slowly around the electromagnet. Describe
182

its behavior, does it act like the bar magnet? (2 points)
• Using the experience gained from Exercise #2, which end of the nail is the“North” pole of the electromagnet? Switch the wire leads so that they wiresare connected in an opposite way. What happens? (2 points).
• Just as you did for the bar magnet, place the white plastic tray on top of theelectromagnet and gently sprinkle the iron filings into the tray (sprinkle themvery lightly, and gently tap the white tray to get them to align–your electro-magnet is not quite as strong as the bar magnet). Draw the resulting patternbelow. (2 points)
183

• Does the pattern you have just drawn resemble the one generated by the mag-netic field? Describe your results. (2 points)
11.5.3 Exercise #3: Looking at the Sun
The Sun is very bright, and looking at it with either the naked eye or any opticaldevice is dangerous—special precautions are necessary to enable you to actually lookat the Sun. To make the viewing safe, we must eliminate 99.999% of the light fromthe Sun to reduce it to safe levels. In this exercise you will be using a very specialtelescope designed for viewing the Sun. This telescope is equipped with a hydrogenlight filter. It only allows a tiny amount of light through, isolating a single emissionline from hydrogen (“H-alpha”). In your lecture session you will learn about theemission spectrum of hydrogen, and in the spectroscopy lab you get to see this red lineof hydrogen using a spectroscope. Several of the pictures in Exercise #1 were actuallyobtained using a similar filter system. This filter system gives us a unique view ofthe Sun that allows us to better see certain types of solar phenomena, especially the“prominences” you encountered in Exercise #1.
• In the “Solar Observation Worksheet” below, draw what you see on and nearthe Sun as seen through the special solar telescope. (8 points)
Note: Kitt Peak Vacuum Telescope images are courtesy of KPNO/NOAO. SOHO Ex-
treme Ultraviolet Imaging Telescope images courtesy of the SOHO/EIT consortium. SOHO
Michelson Doppler Imager images courtesy of the SOHO/MDI consortium. SOHO is a
project of international cooperation between the European Space Agency (ESA) and NASA.
184

185

11.6 Summary (35 points)
Please summarize the important concepts discussed in this lab.
• Discuss the different types of phenomena and structures you looked at in thelab
• Explain how you can understand what causes a phenomenon to occur by lookingat the right kind of data
• List the six layers of the Sun (in order) and give their temperatures.
• What causes the Northern (and Southern) Lights, also known as “Aurorae”?
Use complete sentences and, proofread your summary before turning it in.
Possible Quiz Questions1) What are sunspots, and what leads to their formation?2) Name the three interior regions of the Sun.3) What is differential rotation?4) What is the “photosphere”?5) What are solar flares?
11.7 Extra Credit (ask your TA for permission be-
fore attempting, 5 points)
Look-up a plot of the number of sunspots versus time that spans the last four hundredyears. For about 50 years, centered around 1670, the Sun was unusually “quiet”, inthat sunspots were rarely seen. This event was called the “Maunder minimum” (afterthe discoverer). At the same time as this lack of sunspots, the climate in the northernhemisphere was much colder than normal. The direct link between sunspots and theEarth’s climate has not been fully established, but there must be some connectionbetween these two events. Near 1800 another brief period of few sunspots, the “Daltonminimum” was observed. Looking at recent sunspot numbers, some solar physicistshave suggested the Sun may be entering another period like the Dalton minimum.Search for the information these scientists have used to make this prediction. Describethe climate in the northern hemisphere during the last Dalton minimum. Are thereany good ideas on the link between sunspot number and climate that you can find?
186

Name:
Lab 12
The Hertzsprung-Russell Diagram
12.1 Introduction
As you may have learned in class, the Hertzsprung-Russell Diagram, or the “HR dia-gram”, is one of the most important tools used by astronomers: it helps us determineboth the ages of star clusters and their distances. In your Astronomy 110 textbooksthe type of HR diagram that you will normally encounter plots the Luminosity of astar (in solar luminosity units, LSun) versus its temperature (or spectral type). Anexample is shown here:
The positions of the various main types of stars are labeled in this HR diagram. TheSun has a temperature of 5,800 K, and a luminosity of 1 LSun. The Sun is a mainsequence “G” star. All stars cooler than the Sun are plotted to the right of the Sun in
187

this diagram. Cool main sequence stars (with spectral types of K and M) are plottedto the lower right of the Sun. Hotter main sequence stars (O, B, A, and F stars) areplotted to the upper left of the Sun’s position. As the Sun runs out of hydrogen fuelin its center, it will become a red giant star–a star that is cooler than the Sun, but100× more luminous. Red giants are plotted to the upper right of the Sun’s position.As the Sun runs out of all of its fuel, it sheds its atmosphere and ends its days as awhite dwarf. White dwarfs are hotter, and much less luminous than the Sun, so theyare plotted to the lower left of the Sun’s position in the HR diagram.
The HR diagrams for clusters can be very different depending on their ages. In thefollowing examples, we show the HR diagram of a hypothetical cluster of stars at avariety of different ages. When the star cluster is very young, only the hottest starshave made it to the main sequence. In the HR diagram below, the G, K, and M stars(stars that have temperatures below 6,000 K) are still not on the main sequence, whilethose stars hotter than 7,000 K (O, B, A, and F stars) are already fusing hydrogeninto helium at their cores:
In the next HR diagram, we see a much older cluster of stars (100 million years =100 Myr). In this older cluster, some of the hottest and most massive stars (the Oand B stars) have evolved into red supergiants. The position of the “main sequenceturn off” allows us to estimate the age of a cluster.
In the final HR diagram we have a much older cluster (10 billion years old = 10 Gyr),now stars with one solar mass are becoming red giants, and we say the main sequenceturn-off is at spectral type G (T = 5,500 K).
Some white dwarfs (produced by evolved A and F stars) now exist in the cluster.Thus, the HR diagram for a cluster of stars is useful for determining its age.
188

12.2 Magnitudes and Color Index
While the HR diagrams presented in your class lectures or textbook allow us to providea very nice description of the evolution of stars and star clusters, astronomers do notactually directly measure either the temperatures or luminosities of stars. Rememberthat luminosity is a measure the total amount of energy that a star emits. For the Sunit is 1026 Watts. But how much energy appears to be coming from an object dependson how far away that object is. Thus, to determine a star’s luminosity requires youto know its distance. For example, the two brightest stars in the constellation Orion(see the “Constellation Highlight” for February in the back of this lab book), thered supergiant Betelgeuse and the blue supergiant Rigel, appear to have about thesame brightness. But Rigel is six more times luminous than Betelgeuse–Rigel justhappens to be further away, so it appears to have the same brightness even though itis pumping out much more energy than Betelgeuse. The “Dog star” Sirius, locatedto the southeast of Orion, is the brightest star in the sky and appears to be about 5
189

times brighter than either Betelgeuse or Rigel. But in fact, Sirius is a nearby star, andactually only emits 22× the luminosity of the Sun, or about 1/2000th the luminosityof Rigel!
Therefore, without a distance, it is impossible to determine a star’s luminosity–andremember that it is very difficult to measure the distance to a star. We can, however,measure the relative luminosity of two (or more) stars if they are at the same distance:for example if they are both in a cluster of stars. If two stars are at the samedistance, then the difference in their apparent brightness is a measurement of thetrue differences in their luminosities. To measure the apparent brightness of a star,astronomers use the ancient unit of “magnitude”. This system was first developed bythe Greek astronomer Hipparcos (ca. 190 to 120 BC). Hipparcos called the brighteststars “stars of the first magnitude”. The next brightest were called “stars of thesecond magnitude”. His system progressed all the way down to “stars of the sixthmagnitude”, the faintest stars you can see with the naked eye from a dark location.
Astronomers adopted this system and made it more rigorous by defining a five mag-nitude difference to be exactly equal to a factor of 100 in brightness. That is, a firstmagnitude star is 100X brighter than a sixth magnitude star. If you are good withmathematics, you will find that a difference of one magnitude turns out to be a factorof 2.5 (2.5 × 2.5 × 2.5 × 2.5 × 2.5 = 100, we say that the fifth root of 100 = 1001/5 =2.5). Besides this peculiar step size, it is also important to note that the magnitudesystem is upside down: usually when we talk about something being bigger, faster,or heavier, the quantity being measured increases with size (a car going 100 mph isgoing faster than one going 50 mph, etc.). In the magnitude system, the brighter theobject, the smaller its magnitude! For example, Rigel has an apparent magnitude of0.2, while the star Sirius (which appears to be 4.5 times brighter than Rigel) has amagnitude of −1.43.
Even though they are a bit screwy, and cause much confusion among Astronomy 110students, astronomers use magnitudes because of their long history and tradition.So, when astronomers measure the brightness of a star, they measure its apparentmagnitude. How bright that star appears to be on the magnitude scale. Usually,astronomers will measure the brightness of a star in a variety of different color filtersto allow them to determine its temperature. This technique, called “multi-wavelengthphotometry”, is simply the measurement of how much light is detected on Earth ata specific set of wavelengths from a star of interest. Most astronomers use a systemof five filters, one each for the ultraviolet region (the “U filter”), the blue region (the“B filter”), the visual (“V”, or green) region, the yellow-red region (“R”), and thenear-infrared region (“I”). Generally, when doing real research, astronomers measurethe apparent magnitude of a star in more than one filter. [Note: because the nameof the filter can some times get confused with spectral types, filter names will beitalicized to eliminate any possible confusion.]
To determine the temperature of a star, measurements of the apparent brightness in
190

Table 12.1: The (B − V ) Color Index for Main Sequence StarsSpectra Type (B − V ) Spectral Type (B − V )O and B Stars −0.40 to −0.06 G Stars 0.59 to 0.76
A Stars 0.00 to 0.20 K Stars 0.82 to 1.32F Stars 0.31 to 0.54 M Stars 1.41 to 2.00
at least two filters is necessary. The difference between these two measurements iscalled the “color index”. For example, the apparent magnitude in the B filter minusthe apparent magnitude in the V filter, (B−V ), is one example of a color index (it isalso the main color index used by astronomers to measure the temperature of stars,but any two of the standard filters can be used to construct a color index). Let ustake Polaris (the “North Star”) as an example. Its apparent B magnitude is 2.59, andits apparent V magnitude is 2.00, so the color index for Polaris is (B − V ) = 2.59 −2.00 = 0.59. In Table 12.1, we list the (B − V ) color index for main sequence stars.We see that Polaris has the color of a G star.
In Table 12.1, we see that O and B stars have negative (B − V ) color indices. Wesay that O and B stars are “Blue”, because they emit more light in the B filter thanin the V filter. We say that K and M stars are very red, as they emit much more Vlight than B light (and even more light in the R and I filters!). A-stars emit the sameamount of light at B and V, while F and G stars emit slightly more light at V thanat B . With this type of information, we can now figure out the spectral types, andhence temperatures of stars by using photometry.
12.3 The Color-Magnitude HR Diagram
To construct HR diagrams of star clusters, astronomers measure the apparent bright-ness of stars in two different color filters, and then plot the data into a “Color-Magnitude” diagram, plotting the apparent V magnitude versus the color index(B − V ) as shown below. This following figure shows a color-magnitude diagramfor a globular cluster. You might remember from class (or will soon be told!) thatglobular clusters are old, and that the low mass stars are evolving off the main se-quence and becoming red giants. The main sequence turnoff for this globular clusteris at a color index of about (B−V ) = 0.4, the color of F stars. An F star has a massof about 1.5 MSun, thus stars with masses near 1.5 MSun are evolving off the mainsequence to become red giants, so this globular cluster is about 7 billion years old.
191

12.4 The Color-Magnitude Diagram for the Pleiades
In today’s lab, you and your lab partners will construct a color magnitude diagramfor the Pleiades star cluster. The Pleiades, sometimes known as the “Seven Sisters”(see the constellation highlight for January at the back of this lab manual), is a starcluster located in the wintertime constellation of Taurus, and can be seen with thenaked eye. A wide-angle photograph of the Pleiades is shown below. Many peopleconfuse the Pleiades with the Little Dipper because the brightest stars form a smalldipper-like shape.
As you will find out, the Pleiades is a relatively young group of stars. We will beusing photographs of the Pleiades taken using two different color filters to construct aColor-Magnitude diagram. If you look closely at the photograph of the Pleiades, youwill notice that the brighter stars are larger in size than the fainter stars. Note: youare not seeing the actual disks of the stars in these photographs. Brighter stars appear
192

bigger on photographs because more light from them is detected by the photograph.As the light from the stars accumulates, it spreads out. Think of a pile of sand. Asyou add sand to a pile, it develops a conical, pyramid shape. The addition of moresand to the pile raises the height of the sand pile, but the base of the sand pile hasto spread more to support this height. The same thing happens on a photograph.The more light there is, the larger the spread in the image of the star. In reality,all of the stars in the sky are much to far away to be seen as little disks (like thosewe see for the planets in our solar system) when viewed/imaged through any existingtelescope. We would need to have a space-based telescope with a mirror 1.5 milesacross to actually be able to see the stars in the Pleiades as little, resolved disks![However, there are some special techniques astronomers have developed to actuallymeasure the diameters of stars. Ask your TA about them if you are curious.]
Thus, we can use the sizes of the stars on a photograph to figure out how bright theyare, we simply have to measure their diameters! A special tool, called a “dynameter”,is used to measure sizes of circles. You will be given a clear plastic dynameter in class.A replica of this dynameter is shown here:
As demonstrated, a dynameter allows you to measure the diameter of a star image bysimply sliding the dynameter along until the edges of the star just touch the lines. Inthe example above, the star image is 2.8 mm in diameter. On the following two pagesare digitized scans of two photographs of the Pleiades taken through B and V filters.These photographs were digitized to allow us to put in an X-Y scale so that you cankeep track of which star is which in the two different photographs. You should beable to compare the digitized photographs with the actual photo shown above andsee that most of the brighter stars are on all three images.
193

100 200 300 400
600
700
800
900
Figure 12.1: This is not the right figure for use in this lab–manually insert the correctone here.
194

100 200 300 400
600
700
800
900
Figure 12.2: This is not the right figure for use in this lab–manually insert correctone here.
195

12.4.1 Procedure
The first task for this lab is to collect your data. What you need to do for this labis to measure the diameters of ten of the 63 stars on both digitized photographs. Atthe end of this lab there is a data table that has the final data for 53 of the 63 stars.It is missing the information for ten of the stars (#’s 7, 8, 13, 18, 30, 39, 53, 55, 61,and 63). You must collect the data for these ten stars.
Task #1: First, identify the stars with the missing data on both of the digitized pho-tographs (use their X,Y positions to do this). Then measure their diameters of theseten stars on both photographs using the dynameter. Write the V and B diametersinto the appropriate spaces within the data table. [Note: You will probably not beable to measure the diameters to the same precision as shown for the other stars inthe data table. Those diameters were measured using a computer. Do the best youcan—make several measurements of each star and average the results.] (15 points)
12.4.2 Converting Diameters to Magnitudes
Obviously, the diameter you measure of a star on a photograph has no obvious linkto its actual magnitude. For example, we could blow the photograph up, or shrinkit down. The diameters of the stars would change, but the relative change in sizebetween stars of different brightnesses would stay the same. To turn diameters intomagnitudes requires us to “calibrate” the two photographs. For example, the brighteststar in the Pleiades, “Alcyone” (star #35), has a V magnitude of 2.92, and has a Vdiameter of 4.4 mm. We have used this star to calibrate our data. Once you havecompleted measuring the diameters of the stars, you must convert those diameters(in millimeters) into V magnitudes and (B − V ) color index. To do so, requires youto use the following two equations:
V(mag) = −2.95×(V mm) + 15.9 (Eq. # 1)
and
(B − V ) = −1.0×(B mm − V mm) + 0.1 (Eq. #2)
These equations might seem confusing to you because of the negative number in frontof the diameters. But if you remember, the brighter the star, the smaller its mag-nitude. Brighter stars appear bigger, so bigger diameters mean smaller magnitudes!That is why there is a negative sign. Using the example of Alcyone, its V diameteris 4.4 mm and it has a B diameter of 4.7 mm. Putting the V diameter into equation#1 gives: V (mag) = −2.95×(4.4 mm) + 15.9 = −13.0 + 15.9 = 2.9. So, the V
196

magnitude of Alcyone is correct: V = 2.9, and we have calibrated the photograph.Its color index can be found using Eq. #2: (B − V ) = − 1.0×(4.7 − 4.4) + 0.1 =−1.0×(0.4) + 0.1 = −0.20. Alcyone is a B star!
Task #2: Convert all of the B and V diameters into V magnitudes and (B − V )color index, entering them into the proper column in your data table. Use any of theother stars in the table to see how it is done. Make sure all students in your grouphave complete tables with all of the data entered. (15 points)
12.4.3 Constructing a Color-Magnitude Diagram
The collection of the data is now complete. In this lab you are getting exactly thesame kind of experience in “reducing data” that real astronomers do. Aren’t you gladyou didn’t have to measure the diameters of all 63 stars? Obtaining and reducing datacan be very tedious, tiring, or even boring. But it is an essential part of the scientificprocess. Because of the possibility of mis-measurement of the star diameters, a realastronomer doing this lab would probably measure all of the star diameters at leastthree times to insure that they had not made any errors. Today, we will assume youdid everything exactly right, but we will provide a check shortly.
Now we want to finally get to the goal of the lab: constructing a Color-Magnitudediagram. In this portion of the lab, we will be plotting the V magnitudes vs. the(B − V ) color index. On the following page is a blank grid that has V magnitude onthe Y axis, and the (B − V ) color index on the X axis. Now we want to plot yourdata onto this blank Color-Magnitude diagram to closely examine what kind of starsare in the Pleiades.
Task #3: For each star in your table, plot its position where the (B − V ) colorindex is the X coordinate, and the V magnitude is the Y coordinate. Note that somestars will have very similar magnitudes and colors because they are the same typesof star. When this happens, simply plot them as close together as possible, makingsure they are slightly separated for clarity. All students must complete their ownColor-Magnitude diagram. (15 points)
Error checking: All of your stars should fit within the boundaries of the Color-Magnitude diagram! If not, go back and re-measure the problem star(s) to see if youhave made an error in the B or V diameter or in the calculations.
197
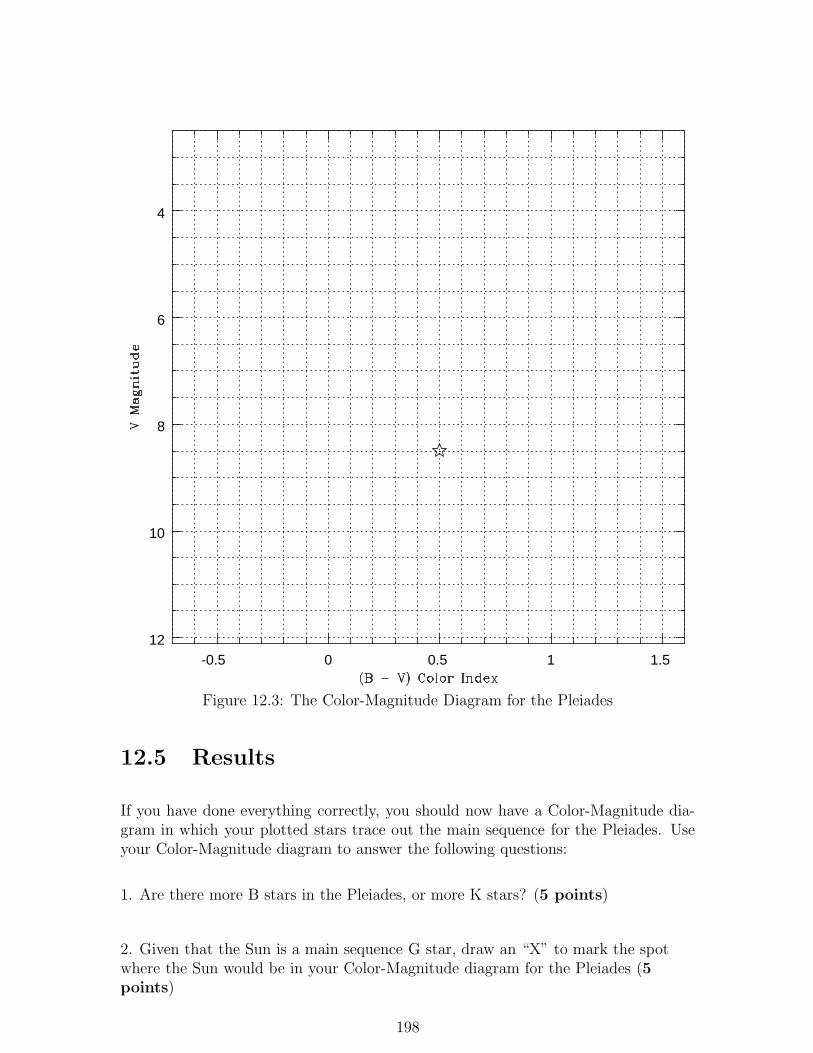
-0.5 0 0.5 1 1.512
10
8
6
4
Figure 12.3: The Color-Magnitude Diagram for the Pleiades
12.5 Results
If you have done everything correctly, you should now have a Color-Magnitude dia-gram in which your plotted stars trace out the main sequence for the Pleiades. Useyour Color-Magnitude diagram to answer the following questions:
1. Are there more B stars in the Pleiades, or more K stars? (5 points)
2. Given that the Sun is a main sequence G star, draw an “X” to mark the spotwhere the Sun would be in your Color-Magnitude diagram for the Pleiades (5points)
198

3. The faintest stars that the human eye can see on a clear, dark night is V = 6.0. Ifthe Sun was located in the Pleiades, could you see it with the naked eye? (5 points)
4. Are there any red giants or supergiants in the Pleiades? What does this tell youabout the age of the Pleiades? (5 points)
199

12.6 Summary (35 points)
Please summarize the important concepts of this lab.
• Describe how an HR diagram is constructed.
• If you have plotted your HR Diagram for the Pleiades correctly, you will noticethat the faint, red stars seem to have a spread when compared to the brighter,bluer stars. Why do you think this occurs? How might you change your ob-serving or measuring procedure to fix this problem? [Hint: is it harder or easierto measure big diameters vs. small diameters?]
• Why are HR diagrams important to astronomers?
Use complete sentences, and proofread your lab before handing it in.
12.7 Possible Quiz Questions
1. What is a magnitude? Which star is brighter, a star with V = -2.0, or one withV = 7.0?
2. In an HR Diagram, what are the two quantities that are plotted?
3. What are the properties of a white dwarf?
4. What are the properties of a red giant?
5. What is a Color Index, and what does it tell you about a star?
12.8 Extra Credit (ask your TA for permission
before attempting, 5 points)
White dwarfs are 100× less luminous than the Sun, but are hot, and have anegative color index (B − V ) = −0.2. Given that a factor of 100 = 5 magnitudes, isit possible to plot the positions of white dwarfs on your Color-Magnitude diagramfor the Pleiades?
200

Table 12.2: Data Table# X Y V(mm) B(mm) V(mag) (B − V )01 157.00 832.00 3.10 2.89 6.76 0.3102 157.61 832.20 2.49 2.00 8.50 0.5903 178.33 821.70 2.37 1.70 8.91 0.7704 183.40 830.51 2.32 1.60 9.06 0.8205 190.53 818.94 2.24 1.52 9.29 0.8206 190.62 834.99 2.23 1.52 9.32 0.8107 192.98 865.4408 197.37 754.5009 202.78 696.35 2.23 1.46 9.32 0.8710 203.87 810.57 2.36 1.72 8.94 0.7411 210.57 789.29 2.32 1.62 9.06 0.8012 212.22 693.49 2.48 1.97 8.58 0.6113 233.44 830.4014 234.34 759.27 2.35 1.57 8.97 0.8815 235.50 751.74 2.40 1.85 8.82 0.6516 246.00 807.00 3.26 3.07 6.28 0.2917 252.95 795.24 2.75 2.35 7.78 0.5018 254.95 688.0219 259.60 730.54 2.39 1.74 8.85 0.7520 260.00 795.00 2.35 1.77 8.97 0.6821 265.00 792.00 2.24 1.48 9.29 0.8622 265.00 831.00 2.95 2.65 7.20 0.4023 266.66 831.82 2.20 1.36 9.41 0.9424 269.27 731.47 2.18 1.33 9.47 0.9525 270.00 789.00 2.31 1.62 9.09 0.7926 274.00 790.00 2.32 1.70 9.06 0.7227 276.28 836.35 2.50 1.98 8.53 0.6228 277.19 811.96 2.22 1.55 9.35 0.7729 283.00 792.00 2.35 1.75 8.97 0.7030 285.00 774.0031 288.00 786.00 2.20 1.42 9.41 0.8832 289.50 852.50 2.18 1.54 9.47 0.7433 291.00 822.00 4.24 4.46 3.39 −0.1234 297.00 822.00 3.46 3.38 5.69 0.1835 298.00 793.00 4.40 4.70 2.92 −0.2036 299.00 749.00 4.09 4.23 3.83 −0.0437 304.00 773.00 2.39 1.79 8.85 0.7038 308.00 777.00 2.31 1.67 9.09 0.7439 310.00 794.0440 312.00 748.00 3.35 3.20 6.02 0.25
201

Table 12.3: Data Table (cont.)# X Y V(mm) B(mm) V(mag) (B − V )41 316.46 832.35 2.52 2.01 8.47 0.6142 317.00 766.00 3.93 4.00 4.31 0.0343 319.14 731.31 2.38 1.81 8.88 0.6744 320.29 742.55 2.17 1.46 9.50 0.8145 322.43 819.50 2.17 1.52 9.50 0.7546 325.00 756.00 3.62 3.57 5.22 0.1547 327.00 787.00 2.20 1.47 9.41 0.8348 327.80 841.25 2.34 1.68 8.99 0.7649 329.00 771.00 2.87 2.52 7.43 0.4550 332.00 794.00 2.62 2.14 8.17 0.5851 335.13 732.56 2.28 1.54 9.17 0.8452 347.41 654.23 2.15 1.43 9.55 0.8253 352.00 756.0054 359.05 685.95 2.35 1.70 8.97 0.7555 361.00 807.0056 368.31 692.12 2.35 1.69 8.96 0.7657 375.90 729.41 2.20 1.50 9.41 0.8058 375.90 729.41 2.36 1.73 8.94 0.7359 386.00 813.00 2.37 1.72 8.91 0.7560 387.50 683.69 2.20 1.54 9.41 0.7661 397.48 769.1162 410.49 839.98 2.34 1.62 8.99 0.8263 420.52 720.04
202

Name:
Lab 13
Mapping the Galaxy
13.1 Introduction
When we look up at the night sky we see many different kinds of objects. Objectsyou can see with the naked eye are mostly stars and planets, although in the South-ern Hemisphere, two nearby galaxies are visible. With a small telescope, one cansee “globular clusters”, “open clusters”, “gaseous nebulae” and “galaxies”. One veryprominent feature which can be seen without the use of a telescope (in a dark loca-tion), is a swath of light that sweeps across the sky in a broad arc, the Milky Way.We know the Milky Way is a vast collection of stars that orbit about the center ofour Galaxy in a flattened distribution resembling a plate or disk. This disk is oftencalled the Milky Way or the Milky Way disk. It is but one of the components thatmake up our Galaxy.
In this lab, we will try to determine the shape of the Milky Way and our location init based on observations of the distribution of several different types of objects in thesky.
• Goals: to determine the shape of our Galaxy and our place in it by observingpatterns in the distributions of star clusters and nebulae
• Materials: Galaxy map, colored pencils or markers, scissors, tape, skewer
203

13.2 Getting used to the ideas
We are trying to determine the shape of our galaxy and our location in it. Since theGalaxy is so large, we cannot go outside of it and see what it looks like; instead, wehave to infer what it looks like from our vantage point within the Galaxy.
The situation is even more complicated because, when we look at astronomical objectsfrom the Earth, we cannot easily distinguish how far away the objects are. We onlysee in what direction they appear, but two objects which appear in the same directionare not necessarily at the same distance.
13.2.1 Map Projections
A hard aspect for some students to grasp is the idea of map projections. If you havecompleted the “Terrestrial Planets” lab, we discussed the idea of how a sphericalobject (such as the Earth) can be represented on a flat sheet of paper. In Figure 13.1is a standard map of the Earth called a “Mercator Projection”. Near the equatorialregions, this type of projection is not too bad, but as you move to the poles, theprojection is terrible! Antarctica appears to have more land then all of the othercontinents combined, but in reality is much smaller than North America. This isbecause you cannot perfectly plot a sphere on a rectangular grid.
Figure 13.1: A “Mercator” projection of the Earth.
Map makers have come up with a variety of ways to make better maps that more cor-rectly represent the actual sizes of objects on a sphere. For example, the “Mollweide”projection seen in Figure 13.2 uses a complex formula to do a better job at renderingthe sizes and shapes of the Earth’s continents, though it also fails really close to thepoles.
204

Figure 13.2: A “Mollweide” projection of the Earth.
A clever way to make a map of a globe is to mentally start with a spherical globeof paper, and then peel off segments of that sphere (like peeling an orange) so thatwe end up with a ragged, but more accurate representation of the Earth’s surface.An example is shown in Figure 13.3. Here it is slightly more difficult to make outthe continents, but we could cut out this map with scissors and tape the pieces backtogether to construct a spherical globe!
Figure 13.3: A map of the Earth made by “peeling” a sphere apart and plotting theresult on a flat sheet of paper.
On such a map, objects on the far left are actually very near to objects on the farright. This is the type of map we will use in this exercise. Sitting on the Earth’ssurface, the sky appears to be a spherical entity that surrounds us–it is like a globesurrounding the globe of the Earth (ask your TA to show you the “celestial sphere”
205

we have in the back room if they haven’t brought it out for you to look at).
To develop your intuition about this sort of map, let’s each make a map of thedirections of all of your fellow students. Let’s imagine that we are each standinginside of a globe and you can see all the other students in different directions. Let’sall agree that “north” should be up towards the ceiling, that the left-most panel inthe map is looking towards the front of the classroom, and that panels to the rightmove in a clockwise fashion around the classroom (so the right most panel is almostall the way back to the front again). Remember that we are imagining that you don’tknow anything about the distance to each student, only what direction they are seenin.
Now let’s compare the maps. How do the maps differ for students in the middle ofthe classroom from those of students at the edge of the classroom?
206

Now let’s imagine we can reconfigure the students so they are distributed uniformlythroughout the room. This means there are students above and below you as well asaround you! However, there may be more students in some directions than in others,depending on where you are located in the classroom. Again, make a map of thedirections of your fellow students.
Again, let’s compare the maps. How do the maps differ for students in the middle ofthe classroom from those of students at the edge of the classroom?
207

Let’s summarize by drawing maps for four different idealized situations:
You are at the center of a uniform distribution of objects.
You are at the edge of a uniform distribution of objects.
208

You are at the center of a flattened distribution of objects.
You are at the edge of a flattened distribution of objects.
One final thing to consider for the flattened distribution of objects: how does theappearance of objects on the map depend on the choice of where you put the NorthPole?
209

13.3 The Contents of Our Milky Way Galaxy
Before we begin this lab, we should briefly introduce (or re-introduce) you to thevarious types of objects we will be plotting on our map. The band of light we callthe Milky Way is in fact the sum of the light from billions of faint, and distant stars.Stars, and objects containing stars, are what we see with our eye, and those are thetypes of objects we will be plotting today. As you have/will find out in your lecturesessions, the Milky Way and other galaxies like it contain a number of objects that arenot stars (such as molecular gas clouds), but these do not emit light that the humaneye can detect (though we can infer their presence since they can absorb light!), andwe will not be plotting those types of objects. Besides the band of light called theMilky Way, there are four types of objects we will plot today: Open clusters, Gaseousnebulae, Globular clusters and Galaxies. The first three of these all belong to ourMilky Way galaxy, while galaxies are “Milky Ways” in their own rite, and are locatedfar beyond the boundaries of the Milky Way.
Depending on which labs your professor has chosen, you might have already encoun-tered an “Open” cluster: the HR Diagram lab deals with the Pleiades, a well knownOpen cluster. A picture of the Pleiades is shown in Figure 13.4. The Pleiades consistsof about 250 stars that are about 100 million years old. All of the stars in the MilkyWay form in clusters. This is because they condense-out of cold molecular gas thatis found in large clouds. Sometimes the gas cloud is small and produces a handful ofstars, sometimes the gas cloud is large (> 106 MSun) and produces thousands of stars.Eventually, however, such a cluster will slowly fall apart, and the stars will wanderoff and circle the galaxy with unique orbits (when in a cluster, however, all of thestars orbit around the galaxy together as a single unit). This is why astronomers callthem “Open”, they eventually fall apart. If the were “Closed”, they would not fallapart. Why do they fall apart? Because the gravity from very massive objects (suchas molecular clouds) can pull Open clusters apart because they have relatively small(< 5,000 MSun) total masses.
In contrast, “Globular clusters” are “Closed”. Globular star clusters do not fall apart.An example is M15 shown in Figure 13.5. Globular star clusters contain 100,000 starsor more, and thus have large masses, and the gravity from all of these stars keepsthem “bound”: Even as they pass by very massive objects, they cannot be pulledapart. Globular clusters are made up of some of the oldest stars found in our galaxy–in fact, most astronomers believe that Globular clusters were the first objects thatformed as the large gas cloud that was the “proto-Milky Way” collapsed.
“Gaseous nebulae” are closely related to Open clusters. When a cluster of stars firstforms, much of the gas left over from the formation of stars is still present. The hotterstars in the cluster can “ionize” this gas (see the Spectroscopy lab), and cause it toglow. We see this gas as glowing knots and wisps of material surrounding the stars.The “Lagoon” Nebula, shown in Figure 13.6, is where several hundred young stars
210

Figure 13.4: The Pleiades, an “Open Cluster” of relatively young stars.
Figure 13.5: M15, a “Globular Cluster” which contains about 100,000 very old stars.
211

Figure 13.6: The Lagoon nebula, a gaseous nebula that contains several hundredyoung stars, some of which are so hot they ionize the hydrogen gas, causing it toglow.
are being born. There is a lot of gas and dust that surrounds the very young opencluster at the center of the Lagoon, and such regions have complex structures.
As noted earlier, galaxies are large collections of objects mostly composed of stars,star clusters, gas, and dust. They are the hosts of Open clusters, Globular clustersand Gaseous nebulae (as well as molecular clouds, and some other objects we havenot mentioned). To see some pretty pictures of galaxies, skip ahead to the “GalaxyMorphology” lab (the next lab in this manual), where images of several different typesof galaxies are presented.
13.4 Exercises
Now we will create maps which show the distribution of different types of celestialobjects in the sky. In Table 13.1 is a list of constellations within which bright objectscan be observed using a small telescope. The list is separated into four sections, onefor each type of object: globular clusters, open cluster, gaseous nebulae and galaxies.For each object type we have listed names of constellations and the number of objectsof each type which can be found within the constellations.
Figure 13.7 has a blank map of the sky with the boundaries of all the constellationsmarked on it. This map is a bit like a map of the world that shows the bordersbetween countries but nothing else. Remember however, when we are looking at thesky we are looking up at the inside of a sphere that completely surrounds us, notdown onto the outside of the Earth. The continuous band of stars already marked on
212

Table 13.1: Location of different objects in the skyConstellation Name Number of Number of Number of Number of
Globular Clusters Galaxies Open Clusters Gaseous NebulaeCepheus 3 6Pegasus 4 2Aquarius 1Capricornus 4Grus 2Draco 5Cygnus 7 6Vulpecula 4Aquila 3 2Sagittarius 20 2 3Telescopium 8Hercules 4Ophiuchus 8Scorpius 6Lupus 2 1Norma 4Ursa Majoris 16Canes Venatici 10Bootes 2Coma Bernaices 3 12Virgo 2 11Centaurus 2 5 1 4Leo 8Hydra 1 2Camelopardalis 4Monoceros 8Canis Major 6 3Puppis 5 1Perseus 4 5Taurus 3 3Orion 3 6Eriadanus 8Dorado 3 4Cassiopeia 8 7Andromeda 4Triangulus 7Pisces 3Cetus 7Fornax 2Sculptor 1 5
213

the map is the Milky Way.
For each type of object, your group will construct a separate celestial sphere. In theend, you should have four celestial spheres, each with one type of object marked on it.
Complete the following steps to construct each sphere:
1. Mark the location of each object in your set on the celestial sphere map. Asan approximation, just place the marks near the center of the constellation theobjects are in. The marks should be dark and large enough so that you can seethe marks on the other side of the sheet.
2. Use a different color for each type of object. This will help you distinguish thedifferent types of celestial spheres. (Remember that each sphere will have onlyone type of object marked on it.)
3. Cut out the map by cutting along the outside bold-face lines. Be sure it NOTto cut off the tabs at the top and bottom of each of the map sections. Theseare essential for the proper construction of the globes.
4. A celestial sphere can be constructed using tape and skewers (be careful!). YourTA will give you more detailed instructions. Be sure that the skewers go throughthe small circles on the tabs at the top and bottom of each of the sections ofthe map.
5. Be sure to construct your celestial sphere inside out because the Earth is reallyat the center of this “globe”. The objects we see are above and around us sowhen we construct these spheres, the marks should be on the inside surface ofthe sphere.
Describe the distribution of each type of object. Work as a group with each celestialglobe and describe the distribution you observe for each type of object. Be as detailedas possible and make references to the plane of the Milky Way which has already beenmarked on each map and also the center of the Milky Way Galaxy which is towardthe constellation Sagittarius. This information will be used to complete the questionsso make sure you take good notes! (20 points)
Milky Way:
Open Clusters:
214

Gaseous Nebulae:
Globular Clusters:
Galaxies:
13.5 Questions
The following questions are intended to help you reconstruct the shape of our galaxybased on the exercises done in the lab. Be sure to answer all parts of the questionsand use complete sentences as always.
1. Do any of the descriptions of the idealized distributions of objects discussed insection 13.2 (i.e. center of flattened distribution, edge of flattened distribution,center of uniform distribution, edge of uniform distribution) match the descrip-tions of the distributions of the celestial objects? If so, which ones? Explainyour reasoning. (10 points)
2. Considering the answer to the previous question, where do you think we arelocated with respect to the system of globular clusters? open clusters? gaseous
215

nebulae? Explain your reasoning. (10 points)
3. Draw a sketch of the Galaxy based on your answers to Questions 1 and 2. Drawyour picture showing our location relative to the distributions of the four typesof objects. Be sure to include all four types of objects and label them. (15points)
4. What do you think the distribution of galaxies, as compared with the distri-butions of the other objects, tells you about where galaxies are located? (10points)
216

13.6 Summary (35 points)
Please summarize the concepts you learned from this lab. You might wish to discuss:
• Describe each of the 4 types of objects discussed in the lab.
• When you look up into the sky and see a band of stars, what does that tell youabout the structure of the Galaxy you live in?
• Describe the difference (in terms of the 4 objects discussed in lab) in what youwould see if you were a) standing in the center of our Galaxy, and b) standingat the edge of our Galaxy.
• What conclusions can you draw about the distribution of objects in our galaxyand beyond?
Use complete sentences, and proofread your summary before handing in the lab.
13.7 Possible Quiz Questions
1. What is an open cluster?
2. What is an HII region?
3. What is a map projection?
4. Why are map projections used?
13.8 Extra Credit (ask your TA for permission be-
fore attempting, 5 points)
In this lab we have plotted objects that are in the Milky Way galaxy. What wouldthe plot look like if we plotted external galaxies? Make sure to research this topic sothat you have confidence in what you are plotting, and make a rough sketch of thedistribution of external galaxies (or photocopy one of the “orange peel” diagrams andplot your galaxies on that)
217

Figure 13.7:
218

Name:
Lab 14
Galaxy Morphology
14.1 Introduction
Galaxies are enormous, “gravitationally bound” collections of billions, upon billionsof stars. In addition to these stars, galaxies also contain varying amounts of gas anddust from which stars form, or from which they have formed. In the centers of somegalaxies live enormous black holes that are sucking-in, and ripping apart stars andclouds of atomic and molecular gas. Galaxies come in a variety of shapes and sizes.Some galaxies have large numbers of young stars, and star forming regions, whileothers are more quiescent, mostly composed of very old, red stars. In today’s lab youwill be looking at pictures of galaxies to become familiar with the appearances, or“morphology”, of the various types of galaxies, and learn how to classify galaxies intoone of the three main categories of galaxy type. We will also use photographs/imagesof galaxies obtained using different colors of light to learn how the appearances ofgalaxies depend on the wavelength of light used to examine them.
• Goals: to learn about galaxies
• Materials: a pen to write with, a ruler, a calculator, and one of the notebooksof galaxy pictures
14.2 Our Home: The Milky Way Galaxy
During the summertime, if you happen to be far from the city lights, take a lookat the night sky. During the summer, you will see a faint band of light that bisects
219

the sky. In July, this band of light runs from the Northeast down to the Southwesthorizon (see Fig. 14.1). This band of light is called the Milky Way, our home galaxy.Because we are located within the Milky Way galaxy, it is actually very hard to figureout its exact shape: we cannot see the forest for the trees! Thus, it is informative tolook at other galaxies to attempt to compare them to ours to help us understand theMilky Way’s structure.
Figure 14.1: A fisheye lens view of the summertime sky showing the band of lightcalled the Milky Way. This faint band of light is composed of the light from thousandsand thousands of very faint stars. The Milky Way spans a complete circle across thecelestial sphere because our solar system is located within the “disk” of the galaxy.
Galaxies are collections of stars, and clouds of gas and dust that are bound togetherby their mutual gravity. That is, the mass of all of the stars, gas and dust pull oneach other through the force of gravity so that they “stick together”. Just like theplanets in our Solar System orbit the Sun, the stars (and everything else) in a galaxyorbit around the central point of the galaxy. The central point in a galaxy is referredto as the “nucleus”. In some galaxies, there are enormous black holes that sit right atthe center. These black holes can have a mass that is a billion times that of the Sun(109 M⊙)! But not all galaxies have these ferocious beasts at their cores, some merelyhave large clusters of young stars, while others have a nucleus that is dominated bylarge numbers of old stars. The Sun orbits around the nucleus of our Milky Waygalaxy (Fig. 14.2) in a similar fashion to the way the Earth orbits around the Sun.While it only takes one year for the Earth to go around the Sun, it takes the Sunmore than 200 million years to make one trip around our galaxy!
Note that the central region (“bulge” and nucleus) of the Milky Way has a higherdensity of stars than in the outer regions. In the neighborhood of the Sun, out in the“disk”, the mass density is only 0.002 M⊙/ly
3 (remember that density is simply themass divided by the volume: M/V, here the Mass is solar masses: M⊙, and Volumeis in cubic light years: ly3). In the central regions of our Milky Way galaxy (within
220

Figure 14.2: A diagram of the size and scale of our “Milky Way” galaxy. The mainregions of our galaxy, the “bulge”, “disk”, and “halo” are labeled. Our Milky Way isa spiral galaxy, with the Sun located in a spiral arm 28,000 ly from the nucleus. Notethat the disk of the Milky Way galaxy spans 100,000 ly, but is only about 1,000 lythick. While the disk and spiral arms of the Milky Way are filled with young stars,and star forming regions, the bulge of the Milky Way is composed of old, red stars.
300 ly of the center), however, the mass density is 100 times higher: 0.200 M⊙/ly3.
What does this mean? The nearest star to the Sun is Alpha Centauri at 4.26 ly. Ifwe were near the nucleus of our Milky Way galaxy, there would be 200 stars within4.26 ly of the Sun. Our sky would be ablaze with dozens of stars as bright as Venus,with some as bright as the full moon! It would be a spectacular sight.
Our Milky Way galaxy is a spiral galaxy that contains more than 100 billion stars.While the Milky Way is a fairly large galaxy, there are much larger galaxies outthere, some with 100 times the mass of the Milky Way. But there are an even largernumber of very small “dwarf” galaxies. Just like the case for stars, nature prefers toproduce lots of little galaxies, and many fewer large galaxies. The smallest galaxiescan contain only a few million stars, and they are thousands of times smaller thanthe Milky Way.
14.3 Galaxy Types: Spirals Ellipticals, and Irreg-
ulars
Shortly after the telescope was invented, astronomers started scanning the sky to seewhat was out there. Among the stars, these first astronomers would occasionally comeacross a faint, fuzzy patch of light. Many of these “nebulae” (Latin for cloud-like)
221

appeared similar to comets, but did not move. Others of these nebulae were resolvedinto clusters of stars as bigger telescopes were constructed, and used to examine them.Some of these fuzzy nebulae, however, did not break-up into stars no matter how biga telescope was used to look at them. While many of these nebulae are clouds ofglowing hydrogen gas within the Milky Way galaxy (HII regions), others (some ofwhich resembled pinwheels) were true galaxies–similar to the Milky Way in size andstructure, but millions of light years from us. It was not until the 1920’s that theactual nature of galaxies was confirmed–they were true “Island Universes”, collectionsof millions and billions of stars. As you will find out in your lecture sessions, the spacebetween galaxies is truly empty, and thus most of the matter in the Universe residesinside of galaxies: They are islands of matter in an ocean of vacuum.
Like biologists or other scientists, astronomers attempt to associate similar types ofobjects into groups or classes. One example is the spectral classification sequence(OBAFGKM) for stars. The same is true for galaxies–we classify galaxies by theirobserved properties. It was quickly noticed that there were two main types of galaxies,those with pinwheel shapes, “spiral galaxies”, and smooth, mostly round or ovalgalaxies, “elliptical” galaxies. While most galaxies could be classified as spirals orellipticals, some galaxies shared properties of both types, or were irregular in shape.Thus, the classification of “irregular”. This final category is a catch-all for any galaxythat cannot be easily classified as a spiral or elliptical. Most irregular galaxies aresmall, messy, unorganized clumps of gas and stars (though some irregular galaxiesresult from the violent collisions of spiral and/or elliptical galaxies).
14.3.1 Spiral Galaxies
The feature that gives spiral galaxies their shape, and leads to their classification aretheir spiral arms. An example of a beautiful spiral is M81 shown in Fig. 14.3. Aspiral galaxy like M81 resembles a whirlpool, or pinwheel: arms of stars, gas and dustthat radiate in curving arcs from the central “bulge”.
Other spiral galaxies, like M51 shown in Fig. 14.4, have less tightly wound spiralarms, and much smaller bulges. Finally, there are spiral galaxies with very tightlywound spiral arms that are dominated by their bulge, like the Andromeda galaxy(M31) shown in Fig. 14.5. The arms are so tightly wound, that it is hard to tellwhere one ends and the other begins. These types of galaxies also have much lessstar formation.
Spiral galaxies are classified by how tightly their arms are wound, and how large theircentral bulges are. There are three main types of spirals: Sa, Sb, and Sc. Sa spiralshave large bulges and tightly wound arms, while Sc’s have very loosely wound arms,and small bulges. Sb’s are intermediate between Sa’s and Sc’s (of course, like M31,there are galaxies that fall halfway between two classes, and they are given nameslike Sab, or Sbc). The spiral classification sequence is shown in Fig. 14.6.
222

Figure 14.3: The Sb spiral galaxy M81. Notice the nice, uniform spiral arms that arewound tightly around the large, central bulge. Inside the spiral arms, there are largeregions of glowing gas called HII regions–where stars are being born. These standout as knots or clumps in the spiral arms. The dark spots, lanes, and arcs are due todust clouds that are associated with these star forming regions.
Figure 14.4: The Sc spiral galaxy M51. Notice the large, clumpy spiral arms that areloosely wound around the small, central bulge. Inside the spiral arms of M51 thereare very many large HII regions–M51 has many young star forming regions. Noticethat there is also a lot more dust in M51 than in M81.
223

Figure 14.5: The Sab spiral galaxy M31. Notice the very large bulge, and very tightlywound spiral arms. Like the Milky Way, the Andromeda Galaxy has several smallgalaxies in orbit around it (just like planets orbit the Sun, some small galaxies canbe found orbiting around large galaxies). Two of these galaxies can be seen as theround/elliptical blobs above and below the disk of the Andromeda galaxy shown here.Both are elliptical galaxies, discussed in the next section.
Figure 14.6: The classification sequence for spirals. S0 spirals are galaxies that showa small disk that is composed of only old, red stars, and have no gas, little dustand no star forming regions. They are mostly a large bulge with a weak disk, withdifficult-to-detect spiral arms. They actually share many properties with ellipticalgalaxies. Sa galaxies have large bulges, and tightly wound spiral arms. Sb’s have lesstightly wound arms, while Sc’s have very loosely wound arms, and have tiny bulges.
224

14.3.2 Elliptical Galaxies
Elliptical galaxies do not have as much structure as spiral galaxies, and are thus lessvisually interesting. They are smooth, round to elliptical collections of stars that arehighly condensed in their centers, that slowly fade out at their edges. Unlike spiralgalaxies, where all of the stars in the disk rotate in the same direction, the starsin elliptical galaxies do not have organized rotation: the individual stars orbit thenucleus of an elliptical galaxy like an individual bee does in a swarm. While theyhave random directions, all of the billions of stars have well-defined orbits aroundthe center of the galaxy, and take many millions of years to complete an orbit. Anexample of an elliptical galaxy is shown in Fig. 14.7.
Figure 14.7: A typical elliptical galaxy, NGC205, one of the small elliptical galaxies inorbit around the Andromeda galaxy shown in Fig. 14.5. Most elliptical galaxies havea small, bright core, where millions of stars cluster around the nucleus. Just like theMilky Way, the density of stars increases dramatically as you get near the nucleusof an elliptical galaxy. Many elliptical galaxies have black holes at their centers.NGC205 is classified as an E5.
Elliptical galaxies can appear to be perfectly round, or highly elongated. There areeight categories, ranging from round ones (E0) to more football-shaped ones (E7).This classification scheme is diagrammed in Fig. 14.8.
Figure 14.8: The classification scheme for elliptical galaxies. Elliptical galaxies rangefrom round (E0), to football shaped (E7).
225

It is actually much easier to classify an elliptical galaxy, as the type of ellipticalgalaxy can be determined by measuring the major and minor axes of the ellipse. Thedefinitions of the major and minor axes of an ellipse are shown in Fig. 14.9. Todetermine which type of an elliptical galaxy you are looking at, you simply measurethe major axis (“a”) and the minor axis (“b”), and calculate: 10×(a − b)/a. Youwill do this for several elliptical galaxies, below.
Figure 14.9: The definition of the major (“a”) and minor (“b”) axes of an ellipse.
14.3.3 Irregular Galaxies
As noted above, the classification of a galaxy as an “irregular” usually stems from thefact that it cannot be conclusively categorized as either a spiral or elliptical. Mostirregular galaxies, like the LMC shown in Fig. 14.10, are small, and filled with youngstars, and star forming regions. Others, however, result when two galaxies collide, asshown in Fig. 14.11.
Figure 14.10: The Large Magellanic Cloud (LMC). The LMC is a small, irregulargalaxy that orbits around the Milky Way galaxy. The LMC (and its smaller cousin,the SMC) were discovered during Magellan’s voyage, and appear as faint patches oflight that look like detached pieces of the Milky Way to the naked eye. The LMCand SMC can only be clearly seen from the southern hemisphere.
226

Figure 14.11: An irregular galaxy that is the result of the collision between twogalaxies. The larger galaxy appears to have once been a normal spiral galaxy. Butanother galaxy (visible in the bottom right corner) ran into the bigger galaxy, anddestroyed the symmetry typically found in a spiral galaxy. Galaxy collisions are quitefrequent, and can generate a large amount of star formation as the gas and dustclouds are compressed as they run into each other. Some day, the Milky Way andAndromeda galaxies are going to collide—it will be a major disruption to our galaxy,but the star density is so low, that very few stars will actually run into each other!
14.3.4 Galaxy Classification Issues
We have just described how galaxies are classified, and the three main types of galax-ies. Superficially, the technique seems straightforward: you look at a picture of agalaxy, note its main characteristics, and render a classification. But there are a fewcomplications that make the process more difficult. In the case of elliptical galaxies,we can never be sure whether a galaxy is truly a round E0 galaxy, or an E7 galaxyseen from an angle. For example, think of a football. If we look at the football fromone angle it is long, and pointed at both ends. But if we rotate it by 90o, it appearsto be round. This is a “projection effect”, and one that we can never remove sincewe cannot go out and look at elliptical galaxies from some other angle.
As we will find out, spiral galaxies suffer from a different classification issue. Whenthe Sa/Sb/Sc classification scheme was first devised, only photographs sensitive toblue light were used. If you actually look at spiral galaxies at other wavelengths,for example in the red or infrared, the appearance of the galaxy is quite different.
227

Thus it is important to be consistent with what kind of photograph is used to makea galaxy classification. We will soon learn that the use of galaxy images at otherwavelengths besides the visual that our eyes are sensitive to, results in much additionalinformation.
14.4 Lab Exercises
For this lab, each group will be getting a notebook containing pictures of galaxies.These notebooks are divided into five different sections. Below, there are five sectionswith exercises that correspond to each of the five sections in the notebook. Make sureto answer all of the questions fully, and to the best of your ability.
Section #1: Classification of Spiral GalaxiesIn this section we look at black and white photographs of spiral galaxies. First youwill see three standard spiral galaxies that define the Sa, Sb, and Sc subtypes, followedby more classification exercises.
Exercise #1: In pictures 1 through 3 are standard spiral galaxies of types Sa, Sb,Sc. Using the discussion above, and Figures 14.3 to 14.6, classify each of the spiralgalaxies in these three pictures and describe what properties led you to decide whichsubclass each spiral galaxy fell into. (3 points)
Exercise #2: The pictures of the galaxies that you have seen so far in this lab are“positive” images, just like you would see if you looked at those galaxies through
228

a large telescope—white means more light, black means less light. But workingwith the negative images is much more common, as it is much easier to see finedetail when presented as dark against a light background versus bright against a darkbackground. For example, Picture #4 is the negative image for Picture #1. Detailthat is overlooked in a positive image can be seen in a negative image. For most ofthe rest of this lab, we will look at negative images like those shown in Picture #4.
Classify the spiral galaxies in Pictures #5, 6, 7 and 8. In each case, describe whatled you to these classifications. (4 points)
Exercise #3: So far, we have looked at spiral galaxies that have favorable orienta-tions for classification. That is, we have seen these galaxies from a direction that isalmost perpendicular to the disk of the galaxy. But since the orientation of galaxiesto our line of sight is random, many times we see galaxies from the side view. In thisexercise, you will look at some spiral galaxies from a less favorable viewing angle.
In pictures #9, 10, and 11 are three more spiral galaxies. Try to classify them. Usethe same techniques as before, but try to visualize how each subtype of spiral galaxywould change if viewed from the side. (Remember that in a negative image, brightwhite means no light, and dark means lots of light–so dusty regions show up as white!)(3 points)
229

Section #2: Elliptical Galaxies As described earlier, elliptical galaxies do notshow very much detail–they are all brighter in the center, and fade away at theedges. The only difference is in how elliptical they are, ranging from round (E0) tofootball-shaped (E7). In this section will learn how to classify elliptical galaxies.
Exercise #4: In pictures #12, 13, 14, and 15 are some elliptical galaxies. UsingFigure 14.8 as a guide, classify each of these four galaxies as either E0, E1, E2, E3,E4, E5, E6, or E7. Describe how you made each classification. (4 points)
Exercise #5: In our discussion about elliptical galaxy classification, we mentionedthat there was a quantitative method to classify elliptical galaxies: you use the equa-tion 10×(a − b)/a to derive the subclass number. In this equation “a” is the major
230

axis (long diameter) and “b” is the minor axis (the short diameter). Go back to Fig-ure 14.9 to see the definition of these two axes. For example, if you measured a valueof a = 40 mm, and b = 20 mm, than the subclass is 10×(40 − 20)/40 = 10×(20/40)= 10×(0.5) = 5. So that this particular elliptical galaxy is an E5.
If the measurements for an elliptical galaxy are a = 30 mm and b= 20 mm, whatsubclass is that galaxy? (Round to the nearest integer.) (2 points)
Measure the major and minor axes for each of the galaxies in pictures #12, 13, 14,and 15, and calculate their subtypes. Note: it can sometimes be hard to determinewhere the “edge” of the galaxy is–try to be consistent and measure to the same levelof brightness. (4 points)
It is pretty hard to measure the major and minor axes of elliptical galaxies on blackand white photographs! Usually, astronomers use digital images, and then use somesort of image processing to make the task easier. Picture #16 is a digitized versionof picture #15, processed so that similar light levels have the same color. As youcan see, this process makes it much easier to define the major and minor axes of anelliptical galaxy.
Exercise #6: Measure the major and minor axes of the two elliptical galaxies shownin Pictures #16 and #17, and classify them using the same equation/technique as
231

before. (2 points)
Section #3: Irregular Galaxies While most large galaxies in our Universe areeither spirals or ellipticals, there are a large number of very strange looking galaxies.If we cannot easily classify a galaxy as a spiral or elliptical, we call it an Irregulargalaxy. Some irregular galaxies appear to show some characteristics of spirals and/orellipticals, others are completely amorphous blobs. Many of the most unusual lookinggalaxies are the result of the interactions between two galaxies (such as a collision).Sometimes the two galaxies merge together, other times they simply pass througheach other (see Fig. 14.11). Pictures 18 through 22 are of irregular galaxies.
Exercise #7: The peculiar shapes and features of the irregular galaxies shown inPictures #18, 19 and 20 are believed to be caused by galaxy collisions or galaxy-galaxy interactions (that is, a close approach, but not a direct collision). Why do youthink astronomers reached such a conclusion for these three galaxies? (4 points)
Exercise #8: In Pictures #21 and 22 are images of two “dwarf” irregular galaxies.Note the general lack of any structure in these two galaxies. Unlike the collision-
232

caused irregular galaxies, these objects truly have no organized structures. It is likelythat there are hundreds of dwarf galaxies like these in our Universe for every singlelarge spiral galaxy like the Milky Way. So, while these dwarf irregular galaxies onlyhave a few million stars (compared to the Milky Way’s 100+ billion), they are asignificant component of all of the normal (“baryonic”) mass in our Universe. Onecommon feature of dwarf irregular galaxies is their abundance of young, hot stars. Infact, more young stars are produced each year in some of these small galaxies thanin our Milky Way, even though the Milky Way is 10,000 times more massive! Whythis occurs is still not fully understood.
In the two dwarf irregular galaxies shown in Pictures #21 and 22, the large numbersof blue stars, and the high number of bright red supergiants (especially in NGC 1705)indicate a high star formation rate–that is lots of new, young stars. Why are largenumbers of hot, luminous blue stars, and red supergiants linked to young stars? [Hint:If you have learned about the HR diagram, try to remember how long hot, blue Oand B stars live. As their internal supply of hydrogen runs out, they turn into redsupergiants.] (4 points)
Section #4: Full Color Images of GalaxiesAs we have just shown, color images of galaxies let us look at the kinds of starsthat are present in them. A blue color indicates hot, young O and B stars, while apredominantly red, or yellow color indicates old, cool stars (mostly red giants). Inthis section we explore the kinds of stars that comprise spiral and elliptical galaxies.
Exercise #9: Comparison of Spirals and EllipticalsIn Pictures #23 through 27 we show some color pictures of elliptical and spiral galax-
233

ies. Describe the average color of an elliptical galaxy (i.e., #23 & #24) compared tothe colors of spiral galaxies (#25 to #27). (3 points)
Now, let’s look more closely at spirals and ellipticals. When examining the color pic-tures of the spiral galaxies you should have noticed that the spiral arms are generallybluer in color than their bulges. Hot young stars are present in spiral arms! Thatis where all of the young stars are. But in the bulges of spirals, the color is muchredder—the bulge is made up of mostly old, red stars. In fact, the bulges of spiralgalaxies look similar to elliptical galaxies. Compare the large bulge of the Sombrerogalaxy (Picture #27) to the giant E0 galaxy M87 (Picture #23). (3 points)
234

If the bulges of spiral galaxies are made-up of old, red giant stars, what does this sayabout elliptical galaxies? (3 points)
It is likely that you have learned about the emission of light by hydrogen atoms inyour lecture sessions (or during the spectroscopy lab). Hydrogen is the dominantelement in the Universe, and can be found everywhere. The brightest emission line inthe visual spectrum of hydrogen is a red line at 656 nm. This gives glowing hydrogengas a pinkish color. When we take pictures of glowing clouds of hydrogen gas theyare dominated by this pink light. During the course of this semester, you will alsohear about ‘HII” regions (such as the “Orion Nebula”, see the monthly skycharts forFebruary found in the back of this lab manual). HII regions form when hot O andB stars are born. These stars are so hot that they ionize the nearby hydrogen gas,causing it to glow. When we look at other spiral galaxies, we see many HII regionsin them, just like those found in our Milky Way.
Of the spiral galaxies shown in Pictures 25 to 27, which has the most HII regions?Which appears to have the least? What does this imply about M51? (3 points)
Section #5: Multi-wavelength Views of GalaxiesWe now want to explore what galaxies look like at ultraviolet and infrared wave-lengths. “Multi-wavelength” data provides insights that cannot be directly gleanedfrom visual images.
235

We have just finished looking at some color images of galaxies. Those color pictureswere actually made by taking several images, each through a different color filter,and then combining them to form a true-color image. Generally astronomers takepictures through a red, green, and blue filter to generate an “RGB” color picture.Many computer programs, such as Adobe Photoshop, allow you to perform this typeof processing. Sometimes, however, it is best not to combine several single-colorimages into a color picture–subtle detail is often lost. Also, astronomers can takepictures of galaxies in the ultraviolet and infrared (or even X-ray and radio!), lightwhich your eye cannot detect. There is no meaningful way to represent the truecolors of a galaxy in an ultraviolet or infrared picture. Why would astronomers wantto look at galaxies in the ultraviolet or infrared? Because different types of stars havedifferent colors, decomposing the light of galaxies into its component colors allows usto determine how such stars are distributed (as well as gas and dust). In Pictures#28 and 29 we present blue and red images of the spiral galaxy M81. As you havejust learned, the bulges of spiral galaxies are red, and the spiral arms (and disks) ofspiral galaxies are blue. Note how the red image highlights the bulge region, whilethe blue image highlights the disk. Hot stars emit blue light, so if we want to see howmany blue stars there are in a galaxy, it is best to use blue, or even ultraviolet light.
In this part of the lab, we will look at some multi-wavelength data. Let’s remindourselves first about the optical part of the electromagnetic spectrum. It runs fromultraviolet (“U”, 330 nm), to blue (“B”, 450 nm), through green/visual (“V”, 550nm), to yellow, red (“R” 600 nm) and infrared (“I”, 760 nm and longer). The highenergy photons have shorter wavelengths and are ultraviolet/blue, while the low en-ergy photons have longer wavelengths and are red/infrared. If we go to shorter wave-lengths than those that can penetrate our atmosphere, we enter the true ultraviolet(wavelengths of 90 to 300 nm). These are designated by UV or FUV (FUV means“far” ultraviolet, below 110 nm). We will now see what galaxies look like at thesewavelengths–but note that we will switch back to black and white photos.
Exercise #10: Comparison of Optical and Ultraviolet Images of GalaxiesIn Picture #30 are three separate images of two spiral galaxies. In the left handcolumn are FUV, U and I images of the Sc galaxy NGC 1365, and in the righthand column are FUV, U and R images of the Sa galaxy NGC 2841. Rememberthat images in the FUV, UV, U and B filters look at hot stars, while images in V,R, and I look at cooler stars. The ultraviolet really only sees hot stars! Comparethe number of hot stars in NGC 1365 with NGC 2841. Describe the spiral arms ofNGC 2841. What do you think is happening in the nucleus of NGC 2841? (4 points)
236

In Picture #31 are FUV, U and R images of two more galaxies: the Sc galaxy NGC2403, and the irregular galaxy IC 2574. Compare the number of red and blue starsin these two galaxies–are they similar? What is the main difference? (3 points)
In Picture #32 is a similar set of images for two elliptical galaxies, NGC 5253 andNGC 3115 (which can also be seen in Pictures #15 and 16) Compare these twogalaxies. While NGC 3115 is a normal elliptical galaxy, NGC 5253 seems to havesomething interesting going on near its nucleus. Why do we believe that? Describehow we might arrive at this conclusion? (3 points)
Exercise #11: Comparison of Optical and Infrared Images of GalaxiesOk, now let’s switch to the infrared. Remember that cool stars emit most of theirenergy in the red, and infrared portions of the electromagnetic spectrum. So if we
237

want to trace where the cool, red (and old) stars are, we use red or infrared images.Another benefit of infrared light is its power to penetrate through dust, allowing usto see through dusty molecular gas clouds.
In Pictures #33 through #35 are blue (“B”, 450 nm) and infrared (“H”, 1650 nm)images of spiral galaxies. In Picture #33 we have Sa galaxies, in #34 we have Sbgalaxies, and in #35 we have Sc galaxies. Compare how easy/hard it is to see thespiral arms in the B images versus the H images. Where are the blue stars? Whereare the red stars? Note that while the hot O and B stars are super-luminous (1 milliontimes the Sun’s luminosity), they are very rare. For each O star in the Milky Waygalaxy there are millions of G, K, and M stars! Thus, while an O star may have 60times the Sun’s mass, they are tiny component of the total mass of a spiral galaxy.Thus, what does the infrared light trace? (5 points)
Finally, let’s take a look at the Milky Way galaxy. As we mentioned in the intro-duction, we are embedded in the disk of the Milky Way galaxy, and thus it is hardto figure out the exact shape and structure of our galaxy. In Picture #36 is anoptical picture that spans the entire sky–we see that our Milky Way galaxy has awell-defined disk. But in the optical photograph, it is difficult to ascertain the bulgeof the Milky Way, or the symmetry of our galaxy–there is just too much dust in theway! Picture #37 is an infrared view that is identical to the previous optical image.What a difference! We can now see through all of that dust, and clearly make out
238

the bulge–note how small it is. We think that the Milky Way is an Sc galaxy. Makean argument in support of this claim, compare it to the photographs of other tiltedspiral galaxies from Exercise #3. [Note: both of these images are special “projec-tions” of the celestial sphere onto a two-dimensional piece of paper. This “Aitoff”projection makes sure the sizes and shapes of features are not badly distorted. Forproper viewing, the right hand edge of these pictures should be wrapped around sothat it touches the left hand edge, and you would have to be viewing the picture frominside to get a proper perspective. It is hard to take a three dimensional picture of thesky and represent it in two dimensions! A similar problem is encountered when us-ing a rectangle to make a map of our globe (see the Terrestrial planet lab.) (8 points)
239

14.5 Summary (35 points)
Summarize the important concepts of this lab, including the following topics.
• Describe the process for classifying a spiral galaxy.
• Describe the process for classifying an elliptical galaxy.
• What are the main difficulties in classifying these two main types of galaxies(they may not be the same issues!).
• What kind of information does multi-wavelength data (images) on galaxies pro-vide? How is it useful? What does it tell us?
• What types of stars are found in spiral galaxies? In ellipticals? What does thistell us about elliptical galaxies?
• What types of stars are found in dwarf irregular galaxies?
14.6 Possible Quiz Questions
1) What are the three main types of galaxies?2) What are the major components of the Milky Way and other Spiral galaxies?3) How big is the Milky Way, and how many stars does it contain?4) What are O and B stars like? How long do they live? What are red supergiants?5) What are HII regions?6) Draw the electromagnetic spectrum and identify the visual, infrared andultraviolet regions.
14.7 Extra Credit (ask your TA for permission be-
fore attempting, 5 points)
In the introduction we mentioned that many galaxies (including the Milky Way) havelarge black holes at their centers. These black holes rip apart stars and suck in thegas. As the gas falls in, it gets very hot, and emits a lot of X-rays, ultraviolet andblue light. Compared to the galaxy, this hot gas region is tiny, and shows up as asmall bright spot at the nucleus of the galaxy in the ultraviolet. Go back to Pictures30 to 32 and list which of the galaxies appear to have black holes at their centers.How did you reach your conclusion?
240

Name:
Lab 15
How Many Galaxies Are There inthe Universe?
15.1 Introduction
Measurements, calculations, physical principles and estimations (or educated guesses)lie at the heart of all scientific endeavors. Measurements allow the scientist to quantifynatural events, conditions, and characteristics. However, measurements can be hardto make for practical reasons. We will investigate some of the issues with takingmeasurements in this lab.
In addition, an important part about the measurement of something is an under-standing about the uncertainty in that measurement. No one, including scientists,ever make measurements with perfect accuracy, and estimating the degree to which aresult is uncertain is a fundamental part of science. Using a result to prove or disprovesome theory can only be done after a careful consideration of the uncertainty of theresult.
• Goals: to discuss the concepts of estimation, measurement and measurementerror, and to use these, along with some data from the Hubble Space Telescope,to estimate the number of observable galaxies in the Universe
• Materials: Hubble Deep Field image
241

15.2 Exercise Section
15.2.1 Direct Measurement, Measurement Error
We will start out by counting objects much closer to home than galaxies!
How many chairs do you think there are in your classroom? You have one minute!
How did you determine this?
How does your number compare with that of other groups? What does this say aboutthe uncertainty in the results?
Now do an exact count of the number of chairs - you have three minutes. Note theadvantage of working with a group! By comparing results from different groups, whatis the uncertainty in the result?
15.2.2 Estimation
Now we extend our measurement to a larger system where practical considerationslimit us from doing a direct count.
242

How many chairs do you think there are in the entire University? You might wish toconsider the campus map shown in Figure 15.1.
How did you determine your number?
How accurate do you think your number is?
How might you estimate the uncertainty in your number?
243

Figure 15.1: A map of the NMSU campus from the NMSU WWW site
244
15.2.3 How many galaxies are there in the Universe?
Considering how you estimated the number of chairs in the classroom and on campus,consider and write down several alternative ways of estimating the number of galaxiesin the Universe.
Let’s consider the issue by looking at a picture of the sky taken with the Hubble SpaceTelescope. This telescope is the most capable of existing telescopes for viewing veryfaint objects. In an effort to observe the faintest galaxies, astronomers decided tospend 10 entire days training this telescope on one small region of the sky to observethe faintest galaxies and learn about them. The image that was obtained is shown inFigure 15.2.
First, let’s figure out how long it would take for the Space Telescope to take pictureslike this over the entire sky.
To do this, we need to talk about how we measure distances and areas on the sky,concepts that we will need in some of our other labs as well. When one measures, forexample, the distance between two stars as seen from Earth, one measures what isknown as an angular distance. A standard unit of this angular distance is the familiarunit of the degree; there are 360 degrees in a full circle. As an example, the distancebetween an object which is straight overhead and one which is on the horizon is 90degrees. However, when one makes astronomical observations with big telescopes,one usually sees an area which is only a small fraction of a degree on a side. To makethings easier to write, astronomers sometimes use units known as arcminutes andarcseconds. There are 60 arcminutes in a degree, and 60 arcseconds in an arcminute.
1. We can now use this information to calculate how many pictures the SpaceTelescope would have to make to cover the entire sky. The picture from theSpace Telescope covers a region that is about 1 arcminute on a side. Our firstconversion is from arcminutes to degrees (this has been partially done for you):(3 points)
245

CBA
1
2
3
Figure 15.2: A reproduction of the Hubble Deep Field image.
246

1 arcminute×1 degree
60 arcminutes= degrees (15.1)
2. The area of the entire picture is measured in square degrees, so we take thenumber of degrees found in question 1 and square it to get: (3 points)
3. Now there are 4.13 × 10⁴ square degrees in the sky. From this you can figure outhow many pictures you would need to take to cover the whole sky: (5 points)
4. Finally if it takes 10 days for each picture, we can figure out how long it wouldtake to cover the whole sky with similar pictures: (4 points)
5. With a unit conversion of 365 days/year, we can determine the number of yearsit would take: (4 points)
Clearly, this is a very long time! This is an interesting point to note: as-tronomers can only take deep pictures of a small fraction of the sky. So it isnot practical to count galaxies by taking pictures of the entire sky.
So how can we proceed to figure out how many total galaxies there are? Wecan make an estimate by guessing that the number of galaxies in any particular
247

picture will be the same regardless of where we point. We can then estimate thetotal number of galaxies in the sky by counting the number of galaxies in thisone picture, and multiplying it by the number of pictures that it would take tocover the whole sky.
6. Take a look at the image of the Hubble Deep Field given to you by your TA.Almost every one of the objects you see in this picture is a distant galaxy. Countup all the galaxies in each section then add them up to get an estimate of thenumber of galaxies in this one field. Again, you can proceed quicker by takingadvantage of the multiple members of your group; however, you might wish tohave everyone in the group count one region independently to get some idea ofthe measurement uncertainty. (10 points)
Region A1:
Region A2:
Region A3:
Region B1:
Region B2:
Region B3:
Region C1:
Region C2:
Region C3:
There are a total of galaxies in Hubble Deep Field.
7. Now estimate the total number of galaxies in the whole sky, using our calculationof the number of pictures it takes to cover the sky which we did above. (7points)
This is a pretty amazingly large number. Consider that each galaxy has billionsof stars, and think just for minute about how many total stars there are in theUniverse! It makes you feel pretty small.... but, on the other hand, think howcool it is that humans have evolved to the point where they can even make suchan estimation!
8. As we’ve discussed, an estimate of the uncertainty in a result is often as im-portant as the result itself. Discuss several reasons why your result may not be
248

especially accurate. You may wish to compare the number of galaxies in anygiven region which you counted with the number counted by other groups, orconsider the variation in the number of galaxies from one region to another.Also, remember a fundamental assumption that we made for getting our esti-mate, namely, that the number of galaxies we would see in some other portionof the sky is the same as that which we see in this Hubble deep field. (8 points)
9. Finally, there’s one more caveat to our calculated total number of galaxies. Tomake our estimate, we assumed that the 10 day exposure sees every singlegalaxy in this portion of the sky. With this in mind, how would the calculationyou just conducted compare to the real number of galaxies in the Universe?Back up your answer with a short explanation. (8 points)
15.3 The Mass and Density of the Universe (Con-
tained in Galaxies)
In the preceding we have estimated the number of galaxies in the Universe. In thefinal section of this lab, we now want to explore the implications of this calculation
249
by making an estimate of the matter density of the Universe. In your lecture sections,and some of the earlier labs (like the Terrestrial Planet lab, esp. Table 4.2) you haveprobably encountered the concept of density: density = Mass/Volume. Astronomersusually use the unit of gm/cm3 for density. We can now make an estimate for thedensity of matter contained in all of the galaxies in our Universe. We will start withvery large numbers, and end up with an extremely tiny number. It is quite likelythat your calculator cannot handle such numbers. To make this calculation easier,we will use some round numbers so that you can do the calculation by hand usingthe techniques outlined in Lab 1 (if you get stuck with how to multiply numbers withexponents, refer back to section 1.4). This is a challenging exercise, but one thatgives you an answer that you might not expect!
10. In question 7 above, you estimated the total number of galaxies in the sky.If we assume that these galaxies are similar to (though probably somewhatsmaller than) our Milky Way galaxy, we can calculate the total mass of all ofthe galaxies in the Universe. Over the course of this semester you will learn thatthe Milky Way has about 100 billion stars, and most of these stars are aboutthe mass of the Sun, or somewhat smaller. The mass of the Sun is 2 × 1033
gm. Let’s assume that the average galaxy in the Universe has 1/2 the numberof stars that the Milky Way has: 50 billion. Fifty billion in scientific notationis 5 x 10¹⁰. To calculate the mass (in gm) of all of the galaxies in the Universe,we need to solve this equation:
Mass of Galaxies in Universe = (# of Galaxies)×(Average Mass of a Galaxy)
You calculated the # of Galaxies in question 7. We need to multiply thatnumber by the Average Mass of a Galaxy. The Average Mass of a Galaxy (ingm) is simply:
Average Mass of a Galaxy = (# of stars in a galaxy)×(average mass of a star)
If the number of stars in a galaxy is 5 x 10¹⁰, and the average mass of a star is2 X 1033 gm, what is the average mass of a galaxy? (2 points)
Average Mass of a Galaxy = ( )×( )
= gm
With this number, you can now calculate the total mass of all of the galaxiesin the Universe (2 points):
Mass of Universe = ( )×( ) =
gm
250

11. We have just calculated the total mass of galaxies in the Universe, and arehalfway to our goal of figuring out the density of galactic matter in the Universe.Since density = M/V, and we now have M, we have to figure out V, the Volumeof the Universe. This is a little more difficult than getting M, so make sure youare confident of your answer to each of the following steps before proceedingto the next. We are going to make some assumptions that will simplify thecalculation of V. First off, we will assume that the Universe is a sphere. Thevolume of a sphere is simply four thirds “pi” R cubed: Vsphere = 4πR3/3. Tofigure out the volume of the Universe we need to calculate “R”, the radius ofthe Universe.
So, how can we estimate R? In your lecture class you will find out that the mostdistant parts of the Universe are moving away from us at nearly the speed oflight (the observed expansion of the Universe is covered in the Hubble’s Lawlab). Let’s assume that the largest distance an object can have in our Universeis given by the speed of light × the age of the Universe. Remember, if a cartravels at 50 mph for one hour it will cover 50 miles: Distance = velocity ×time. We can use this equation to estimate the radius of the Universe: RUniverse
= velocity × time = (speed of light) × (age of Universe).
The speed of light is a very large number: 3 X 1010 cm/s, and the age of theUniverse is also large: 13 billion years. To calculate the radius of the Universein cm, we must convert the age of the Universe in years to an age in seconds(s). First, how many seconds are there in a year? Let’s do the calculation:
Seconds in year = (seconds in day) × (days in year) = (60 × 60 × 24) × 365 =
s/yr
Since this is only estimate, feel free to round off any decimals to whole numbers.Now that we have the number of seconds in a year, we can convert the age ofthe Universe from years to seconds:
Age of Universe in seconds = (Age of Universe in Years) × (seconds in a year)
= (13 × 109 yr) × s/yr = s.
Ok, we now have the “time” part of the equation distance = velocity × time.And we have already set the velocity to the speed of light: 3 × 1010 cm/s. Nowwe can figure out the Radius of the Universe (3 points):
Radius of Universe (in cm) = (speed of light) × (Age of Universe in seconds) =
(3 × 1010 cm/s) × s =
cm.
251

In these calculations, notice how the units cancel. The units on a distanceor radius is length, and astronomers generally use centimeters (cm) to measurelengths. Velocities have units of length per time, like cm/s. So when calculatinga radius in cm, we multiply a velocity with units of cm/s × a time measured inseconds, and the units of seconds cancels, leaving a length unit (cm).
We are now ready to calculate the Volume of the Universe, V = 4πR3/3. Itmay be easier for you to break this into two parts, multiplying out 4/3 × π,and then taking R3, and then multiplying those two numbers. [Remember, π= 3.14.]
Volume of Universe = 4/3 ×π × R3 =
× =
cm3
12. Tying it all together: figuring out the average density of the Universe (at leastthat contained within galaxies–astronomers believe there is more “dark” matterin the Universe than the regular matter that we can see contained in galaxies!).We have just calculated the Volume of the Universe, and we have already calcu-lated the Mass of all of the galaxies in the Universe. Now we take the final step,and calculate the Average Galactic Matter Density of the Universe (3 points):
Average Density of the Universe = MUniverse/VUniverse =
( gm)/( cm3) =
gm/cm3
13. The mass of a single hydrogen atom is 1.7 x 10⁻²⁴ gm. Compare your answerfor the average density of the Universe to the mass of a single hydrogen atom.[Hint: the average amount of mass (in gm) of 1 cm3 of the Universe is simplythe density you just calculated, but you drop the cm3 of the units on density toget gm.] Are they similar? What does this imply about the Universe, is it fullof stuff, or mostly empty? (3 points)
252

15.4 Summary (35 points)
Please summarize the important concepts discussed in this lab. Your summary shouldinclude a brief discussion of
• direct measurement vs. estimation
• error estimates in both direct measurement and estimation
• Consider the importance of the galaxy counting results discussed in lab. Sincethe Hubble Deep Field was taken in a presumably empty part of the sky, whatis the significance of finding so many galaxies in this picture?
• Use the concepts discussed in this lab to estimate the total number of stars thatyou can see in the night sky by going out at night and doing some counting andestimating. Describe your method as well as the number you get and providesome estimate of your uncertainty in the number.
• Think back to a time before you did this lab, would you have expected theanswer to question #13? Our Universe has many surprises!
Use complete sentences, and proofread your summary before handing in the lab.
15.5 Possible Quiz Questions
1. What is meant by the term “estimation”?
2. Why do scientists use estimation201d
3. How many degrees are in a circle?
4. What is an “arcminute”?
5. What is the “Hubble Deep Field”?
15.6 Extra Credit (ask your TA for permission be-
fore attempting, 5 points)
In question #7, you estimated the number of galaxies in the Universe. In question#10 you found that a typical galaxy contains 50 billion stars. Thus, you can nowestimate how many stars there are in the Universe. Recently, some mathematicians
253

have estimated that there are between 7 × 10¹⁹ and 7 × 10²² grains of sand on all ofthe Earth’s beaches–that is every single beach on every single island and continenton the Earth. Obviously, this is a difficult estimate to make, and thus their estimateis quite uncertain. How would you begin to estimate the number of sand grains onthe Earth’s beaches? What factors need to be taken into account?
Compare the number of stars in the Universe, with the number of grains of sand onthe planet Earth. How do they compare? We still do not know the average numberof planets that are found around an average star. It is probably safe to assume that10% of all stars have at least one planet orbiting them. If so, how many planets arethere in the Universe?
254

Name:
Lab 16
Hubble’s Law: Finding the Age ofthe Universe
16.1 Introduction
In your lecture sessions (or the lab on spectroscopy), you will find out that an object’sspectrum can be used to determine the temperature and chemical composition of thatobject. A spectrum can also be used to find out how fast an object is moving bymeasuring the Doppler shift. In this lab you will learn how the velocity of an objectcan be found from its spectrum, and how Hubble’s Law uses the Doppler shift todetermine the distance scale of the Universe.
• Goals: to discuss Doppler Shift and Hubble’s Law, and to use these concepts todetermine the age of the Universe
• Materials: galaxy spectra, ruler, calculator
16.2 Doppler Shift
You have probably noticed that when an ambulance passes by you, the sound of itssiren changes. As it approaches, you hear a high, whining sound which switches toa deeper sound as it passes by. This change in pitch is referred to as the Dopplershift. To understand what is happening, let’s consider a water bug treading water ina pond.
255

The bug’s kicking legs are making waves in the water. The bug is moving forwardrelative to the water, so the waves in front of him get compressed, and the wavesbehind him get stretched out. In other words, the frequency of waves increases infront of him, and decreases behind him. In wavelength terms, the wavelength isshorter in front of him, and longer behind him. Sound also travels in waves, so whenthe ambulance is approaching you, the frequency is shifted higher, so the pitch (notthe volume) is higher. After it has passed you, the frequency is Doppler shifted toa lower pitch as the ambulance moves away from you. You hear the pitch changebecause to your point of view the relative motion of the ambulance has changed.First it was moving toward you, then away from you. The ambulance driver won’thear any change in pitch, because for her the relative motion of the ambulance hasn’tchanged.
The same thing applies to light waves. When a light source is moving away from you,its wavelength is longer, or the color of the light moves toward the red end of the spec-trum. A light source moving toward you shows a (color)shift.
This means that we can tell if an object is moving toward or away from us by lookingat the change in its spectrum. In astronomy we do this by measuring the wavelengthsof spectral lines. We’ve already learned how each element has a unique fingerprint ofspectral lines, so if we look for this fingerprint and notice it is displaced slightly fromwhere we expect it to be, we know that the source must be moving to produce thisdisplacement. We can find out how fast the object is moving by using the Dopplershift formula:
∆λ
λo=
v
c
256

where ∆λ is the wavelength shift you measure, λo is the rest wavelength1 (the oneyou’d expect to find if the source wasn’t moving), v is the radial velocity (velocitytoward or away from us), and c is the speed of light (3× 10⁵ km/s).
In order to do this, you just take the spectrum of your object and compare thewavelengths of the lines you see with the rest wavelengths of lines that you knowshould be there. For example, we would expect to see lines associated with hydrogenso we might use this set of lines to determine the motion of an object. Here is anexample:
Exercise 1. 10 points
If we look at the spectrum of a star, we know that there will probably be hydrogenlines. We also know that one hydrogen line always appears at 6563A, but we find theline in the star’s spectrum at 6570A. Let’s calculate the Doppler shift:
a) First, is the spectrum of the star redshifted or blueshifted (do we observe a longeror shorter wavelength than we would expect)?
b) Calculate the wavelength shift: ∆λ = (6570A− 6563A)
∆λ = A
c) What is its radial velocity? Use the Doppler shift formula:
∆λ
λo=
v
c
v = km/s
1For this lab we will be measuring wavelengths in Angstroms. 1.0 A= 1.0 × 10⁻¹⁰ m.
257
A way to check your answer is to look at the sign of the velocity. Positive meansredshift, and negative means blueshift.
Einstein told us that nothing can go faster than the speed of light. If you have a veryhigh velocity object moving at close to the speed of light, this formula would giveyou a velocity faster than light! Consequently, this formula is not always correct. Forvery high velocities you need to use a different formula, the relativistic Doppler shiftformula, but in this lab we won’t need it.
16.3 Hubble’s Law
In the 1920’s Hubble and Slipher found that there is a relationship between theredshifts of galaxies and how far away they are (don’t confuse this with the ways wefind distances to stars, which are much closer). This means that the further away agalaxy is, the faster it is moving away from us. This seems like a strange idea, but itmakes sense if the Universe is expanding.
The relation between redshift and distance turns out to be very fortunate for as-tronomers, because it provides a way to find the distances to far away galaxies. Theformula we use is known as Hubble’s Law:
v = H × d
where v is the radial velocity, d is the distance (in Mpc), and H is called the Hubbleconstant and is expressed in units of km/(s × Mpc). Hubble’s constant is basicallythe expansion rate of the Universe.
The problem with this formula is that the precise value of H isn’t known! If wetake galaxies of known distance and try to find H , the values range from 50 to 100km/(s × Mpc). By using the incredible power of the Hubble Space Telescope, thecurrent value of the H is near 75 km/(s × Mpc). Let’s do an example illustratinghow astronomers are trying to determine H .
Exercise 2. (15 points)
In this exercise you will determine a value of the Hubble constant based on directmeasurements. The figure at the end of this lab has spectra from five different galaxyclusters. At the top of this figure is the spectrum of the Sun for comparison. Foreach cluster, the spectrum of the brightest galaxy in the cluster is shown to the rightof the image of the cluster (usually dominated by a single, bright galaxy). Aboveand below these spectra, you’ll note five, short vertical lines that look like bar codesyou might find on groceries. These are comparison spectra, the spectral lines which
258

are produced for elements here on earth. If you look closely at the galaxy spectra,you can see that there are several dark lines going through each of them. The left-most pair of lines correspond to the “H and K” lines from calcium (for the Sun andfor Virgo = Cluster #1, these can be found on the left edge of the spectrum). Arethese absorption or emission lines? (Hint: How are they appearing in the galaxies’spectra?)
Now we’ll use the shift in the calcium lines to determine the recession velocities of thefive galaxies. We do this by measuring the change in position of a line in the galaxyspectrum with respect to that of the comparison spectral lines above and below eachgalaxy spectrum. For this lab, measure the shift in the “K” line of calcium (the leftone of the pair) and write your results in the table below (Column B). At this pointyou’ve figured out the shift of the galaxies’ lines as they appear in the picture. Couldwe use this alone to determine the recession velocity? No, we need to determine whatshift this corresponds to for actual light. In Column C, convert your measured shiftsinto Angstroms by using the conversion factor 19.7 A/mm (this factor is called the“plate scale”, and is similar to the scale on a map that allows you to convert distancesfrom inches to miles).
Earlier in the lab we learned the formula for the Doppler shift. Your results in ColumnC represent the values of ∆λ. We expect to find the center of the calcium K line atλo = 3933.0 A. Thus, this is our value of λ. Using the formula for the Doppler shiftalong with your figures in Column C, determine the recession velocity for each galaxy.The speed of light is, c = 3 × 10⁵ km/sec. Write your results in Column D. Foreach galaxy, divide the velocity (Column D) by the distances provided in Column E.Enter your results in Column F.
The first galaxy cluster, Virgo, has been done for you. Go through the calculations forVirgo to check and make sure you understand how to proceed for the other galaxies.Show all of your work on a separate piece of paper and turn in that paperwith your lab.
A B C D E FGalaxy Cluster Measured shift Redshift Velocity Distance Value of H
(mm) (Angstroms) (km/s) (Mpc) (km/s/Mpc)1. Virgo 0.9 17.7 1,352 20 67.62. Ursa Major 1103. Corona Borealis 1804. Bootes 3005. Hydra 490
Now we have five galaxies from which to determine the Hubble constant, H . Are yourvalues for the Hubble constant somewhere between 50 and 100 km/(s × Mpc)? Whydo you think that all of your values are not the same? The answer is simple: humanerror. It is only possible to measure the shift in each picture to a certain accuracy.
259

For Virgo the shift is only about 1 mm, but it is difficult with a ruler and naked eye tomeasure such a small length to a high precision. A perfect measurement would givethe “correct” answer (but note that there is always another source of uncertainty:the accuracy of the distances used in this calculation!).
16.4 The Age of the Universe
The expansion of the Universe is a result of the Big Bang. Since everything is flyingapart, it stands to reason that in the past everything was much closer together. Withthis idea, we can use the expansion rate to determine how long things have beenexpanding - in other words, the age of the Universe. As an example, suppose yougot in your car and started driving up to Albuquerque. Somewhere around T or C,you look at your watch and wonder what time you left Las Cruces. You know you’vedriven about 75 miles and have been going 75 miles per hour, so you easily determineyou must have left about an hour ago. For the age of the Universe, we essentiallydo the same thing to figure out how long ago the Universe started. This is assumingthat the expansion rate has always been the same, which is probably not true (byanalogy, maybe you weren’t always driving at 75 mph on your way to T or C). Thegravitational force of the galaxies in the Universe pulling on each other would slowthe expansion down. However, we can still use this method to get a rough estimateof the age of the Universe.
Exercise 3. (15 points)
The Hubble constant is expressed in units of km/(s × Mpc). Since km and Mpcare both units of distance, we can cancel them out and express H in terms of 1/sec.Simply convert the Mpc into km, and cancel the units of distance. The conversionfactor is 1 Mpc = 3.086×10¹⁹ km.
a) Add up the five values for the Hubble constant written in the table of Exercise 2,and divide the result by five. This represents the average value of the Hubble constant
260

you have determined.
H = kms×Mpc
b) Convert your value of H into units of 1/s:
H = 1s
c) Now convert this into seconds by inverting it (1/H from part b):
Age of the Universe = s
d) How many years is this? (convert from seconds to years by knowing there are 60seconds in a minute, 60 minutes in an hour, etc.)
Age of the Universe= yrs
16.5 How Do we Measure Distances to Galaxies
and Galaxy Clusters?
In exercise #2, we made it easy for you by listing the distances to each of the galaxyclusters. If you know the distance to a galaxy, and its redshift, finding the Hubbleconstant is easy. But how do astronomers find these distances? In fact, it is a verydifficult problem. Why? Because the further away an object is from us, the fainterit appears to be. For example, if we were to move the Sun out to a distance of 20 pc,it would no longer be visible to the naked eye! Note that the closest galaxy clusteris at a distance of 20 Mpc, a million times further than this! Even with the largesttelescopes in the world, we could not see the Sun at such a great distance (and Virgois the closest big cluster of galaxies).
Think about this question: Why do objects appear to get dimmer with distance?What is actually happening? Answer: The light from a source spreads out as ittravels. This is shown in Fig. 16.1. If you draw (concentric) spheres around a lightsource, the amount of energy passing through a square meter drops with distance as1/R2. Why? The area of a sphere is 4πR2. The innermost sphere in Fig. 16.1 has aradius of “1” m, its area is therefore 4π m2. If the radius of the next sphere out is
261

“2” m, then its area is 16π m2. It has 4× the area of the inner sphere. Since all ofthe light from the light bulb passes through both spheres, its intensity (energy/area)must drop. The higher the intensity, the brighter an object appears to our eyes. Thelower the intensity, the fainter it appears. Again, refer to Fig. 16.1, as shown there,the amount of energy passing through 1 square of the inner sphere passes through 4squares for the next sphere out, and 9 squares (for R = 3) for the outermost sphere.The light from the light bulb spreads out as it travels, and the intensity drops as1/R2.
Figure 16.1: If you draw concentric spheres around a light source (we have cut thespheres in half for clarity), you can see how light spreads out as it travels. The lightpassing through one square on the inner sphere passes through four squares for asphere that has twice the radius, and nine squares for a sphere that has three timesthe radius of the innermost sphere. This is because the area of a sphere is 4πR2.
Exercise 4.
If the apparent brightness (or intensity) of an object is proportional to 1/R2 (whereR = distance), how much brighter is an object in the Virgo cluster, compared to asimilar object in Hydra? [Hint: how many times further is Hydra than Virgo?] (2points)
An object in Hydra is hundreds of times fainter than the same object in Virgo!Obviously, astronomers need to find an object that is very luminous if they are goingto measure distances to galaxies that are as far, or even further away than the Hydracluster. You have probably heard of a supernova. Supernovae (supernovae is theplural of supernova) are tremendous explosions that rip stars apart. There are two
262
types of supernova, Type I is due to the collapse of a white dwarf into neutron star,while a Type II is the explosion of a massive star that often produces a black hole.Astronomers use Type I supernovae to measure distances since their explosions alwaysrelease the same amount of energy. Type I supernovae have more than one billiontimes the Sun’s luminosity when they explode! Thus, we can see them a long way.
Let’s work an example. In 1885 a supernova erupted in the nearby Andromeda galaxy.Andromeda is a spiral galaxy that is similar in size to our Milky Way located at adistance of about 1 Mpc. The 1885 supernova was just barely visible to the nakedeye, but would have been easy to see with a small telescope (or even binoculars).Astronomers use telescopes to collect light, and see fainter objects better. The largesttelescopes in the world are the Keck telescopes in Hawaii. These telescopes havediameters of 10 meters, and collect 6 million times as much light as the naked eye(thus, if you used an eyepiece on a Keck telescope, you could “see” objects that are6 million times fainter than those visible to your naked eye).
Using the fact that brightness decreases as 1/R2, how far away (in Mpc) could theKeck telescope see a supernova like the one that blew up in the Andromeda galaxy?(2 points). [Hint: here we reverse the equation. You are given the brightness ratio,6 million, and must solve for the distance ratio, remembering that Andromeda has adistance of 1 Mpc!]
Could the Keck telescopes see a supernova in Hydra? (1 point)
263
16.6 Questions
1. Explain how the Doppler shift works. (5 points)
2. In the water bug analogy, we know what happens to waves in front of andbehind the bug, but what happens to the waves directly on his left and right(hint: is the bug’s motion compressing these waves, stretching them out, or notaffecting them at all)? With this in mind, what can the Doppler shift tell usabout the motion of a star which is moving only at a right angle to our line ofsight? (5 points)
3. Why did we use an average value for the Hubble constant, determined from fiveseparate galaxies, in our age of the Universe calculation? What other importantfactor in our determination of the age of the Universe did we overlook? (Hint:
264

It was mentioned in the lab.) (5 points)
4. Does the age of the Universe seem reasonable? Check your textbook or theWorld Wide Web for the ages estimated for globular clusters, some of the oldestknown objects in the Universe. How does our result compare? Can any objectin the Universe be older than the Universe itself? (5 points)
265

16.7 Summary (35 points)
Summarize what you learned from this lab. Your summary should include:
• An explanation of how light is used to find the distance to a galaxy
• From the knowledge you have gained from the last several labs, list and explainall of the information that can be found in an object’s spectrum.
Use complete sentences, and proofread your summary before handing in the lab.
Possible Quiz Questions1) What is a spectrum, and what is meant by wavelength?2) What is a redshift?3) What is the Hubble expansion law?
16.8 Extra Credit (ask your TA for permission be-
fore attempting, 5 points)
Recently, it has been discovered that the rate of expansion of the Universe appearsto be accelerating. This means that the Hubble “constant” is not really constant!Using the world wide web, or recent magazine articles, read about the future of theUniverse if this acceleration is truly occurring. Write a short essay summarizing thefate of stars and galaxies in an accelerating Universe.
266

The Spectrum of the Sun
Galaxy Cluster #1
Galaxy Cluster #2
Galaxy Cluster #3
Galaxy Cluster #4
Galaxy Cluster #5
267

268

Name:
Lab 17
World-Wide Web(Extra-credit/Make-up) Exercise
This extra credit project is intended to introduce you to the World Web while at thesame time teaching you some interesting facts about astronomy and allowing you tosee beautiful astronomy pictures which you might not otherwise see in your textbookor in class. This lab is worth half a lab grade. You should make sure your TA knowsthat you are planning on doing this lab and turn in this sheet in order for him/herto keep track of extra credit points.
Please allow yourself two hours to complete this extra credit exercise. The computerlab on campus in Jacobs Hall has Macintosh computers available with all of the ap-propriate software. Those more comfortable using PC’s are welcome to use Explorer.We will assume that you are familiar with web surfing, and you do not need assistance.All web browsers work in a similar fashion–there is a box to enter a web address. Tostart this exercise type in the following address:
http://astronomy.nmsu.edu/astr110/www110.html
This will bring you to the Astronomy 110 World Wide Web (WWW) exercise. Onceyou are here, you may click on the underlined boldface titles called links (”Picture ofthe Day”, ”NSSDC Photo Gallery”, etc.) and explore these sites, then return to the110 exercise page by hitting the ”Back” button. Note that you may have to do thisa few times before you are returned to the Astro 110 WWW page. Some of the linksmay open up a separate Netscape window, so if the back button doesn’t work, justlook to see if your original window is behind the one you are looking at. Once you’veexplored a page, answer the question related to that page in the box provided. Use
269

the mouse to click in the box; this makes the box active and anything you type willappear in this box. Make sure that when you click in a box you see the cursor appearand that when you type you are able to see the text. If this is not so, double checkthat you have clicked in the box you are typing in. Otherwise you may be typing ina previously active box. You may also want to write your answers down on a pieceof paper in case the answers you typed for earlier questions gets erased. This shouldnot happen, but if it does, just answer the questions on a piece of paper, and thentype them all in at the end.
When you are finished with the six sections, type your name, professor’s name, andyour TA’s name in the appropriate boxes (to go from one box to another, either click inthe new one with the mouse, or simply hit the “Tab” key). We would also appreciateany comments and/or suggestions you may have on this exercise and homepage. Onceyou are all done, print out the entire lab and hand it in to your TA.
We have also provided you with some fun and/or useful links for your own browsing.If you enjoy the project and want to see more, click on the ”What’s New” and ”What’sCool” boxes in the second row of buttons. There is a lot of information out there onthe internet - now it’s at your fingertips!
Once you’ve completed the exercise, a print out of your answers must be turned-into your TA in the Astronomy Department. It’s best to hand this sheet into your TAwhen you’ve finished the project. Your TA will look at your answers and give youextra credit points based on these answers.
If you have problems with this exercise, don’t hesitate to ask the Jacobs ComputerLab personnel for help. They are well versed in the use of web, and if you explain tothem that it’s for a class, they will be more than willing to help. On the other hand,try to figure things out for yourself first - this is your project, not theirs!
270

Appendix A
Fundamental Quantities
There are various ways to describe the world in which we live. Some are qualitativeand others are quantitative. Qualitative descriptions describe aspects of objects orevents such as texture, and use words like ‘rough’, ‘smooth’, ‘flat’ etc. Qualitativedescriptions cannot be described numerically. One would not say that you lookedtired with a value of 3.0 unless someone had first set up some kind of numericalscale to measure just how tired you were; tiredness is not something we measurequantitatively. On the other hand, length is a dimension that can be described eitherqualitatively or quantitatively; one can qualitatively describe an object as long, orone can quantitatively describe it as 10 feet in length.
All quantitative measurements are made in some kind of unit. Length, for example,can be measured in units of meters, feet, miles, etc. Other fundamental metricunits are the kilogram (a measure of mass) and the second (a unit of time). Otherunits of measurement are combinations of these fundamental units. An example of acombination is velocity, expressed in units of meters per second (m/s) which measureshow far something has moved in a given direction over a given period of time.
In astronomical studies, one sometimes uses units which express rather large valuesin the fundamental metric units. An example of this would be the Solar Mass unit(notated as M⊙). The mass of our Sun is, by definition, one Solar Mass or about1,900,000,000,000,000,000,000,000,000,000 kilograms. A star with 10 times as muchmass can be written as 10 M⊙; this is clearly more convenient to write than a numberwith all those zeros! Other units used in astronomy are the light year (ly), parsec (pc),and the astronomical unit (A.U.), all of which are units of distance. The unit youchoose to use depends on the situation, and personal preferences. When describingdistances in the solar system the astronomical unit is typically used since it is theaverage distance from the Sun to the Earth. In describing distances to stars theparsec or light year is usually used.
As described in the introductory lab, the metric system allows easy expression of
271

large multiples of the fundamental units via prefixes. For example, 1,000 meters iscalled a kilometer and is usually written as 1km.
As described in section 1.4 scientists also use a notation system called scientific nota-tion for representing very large or very small numbers without having to write lots ofdigits. As an example of how large numbers can get in science let’s look at the mass ofMars. Using Kepler’s laws of motion to study Mars’ moons, astronomers have deter-mined that Mars has a mass approximately equal to 640,000,000,000,000,000,000,000kilograms. Now you can see that it is rather inconvenient to write down all thosezeroes, and it is confusing to use the prefixes above. Imagine how much more massthere is in the Galaxy and you can see that we need an easy way to write very big(or very small) numbers. This leads us to the concept of Scientific Notation.
272

Appendix B
Accuracy and Significant Digits
The number of significant digits in a number is the number of non-zero digits in thenumber. For example, the number 12.735 has five significant digits; the number 100has 1. When computing numbers, people today often use calculators since they giveus precise answers quickly. Unfortunately, many times they give us answers that areunnecessarily and sometimes unrealistically precise. In other words, they give us asmany significant digits as can fit on the calculator screen. In most cases, you willnot know the numbers you are plugging in to the calculator to this precise of a value,and therefore will get an answer that has too many significant digits to be correct.This will be the case for your astronomy labs this semester. In general, you shouldonly report the accuracy of a calculation with the number of significant digits of theleast certain (smallest number of significant digits) of any of the numbers which werethe input into the calculation. For example, if you are dividing 13.2 by 6.8, althoughyour calculator gives 1.94117647, you should only report two significant figures (i.e.1.9), since that is the number of significant figures in the input number 6.8.
273

Appendix C
Unit Conversions
Very often, scientists convert numbers from one set of units to another. In fact, notonly do scientists do this, but you do it as well! For example, if someone asks youhow tall you are, you could tell them your height in feet or even in inches. If someonesaid they are 72 inches tall, and 12 inches equals 1 foot, then you know they are 6feet tall! This is nothing more than a simple conversion from units of inches to unitsof feet. Another everyday unit conversion is from minutes to hours, and vice versa.If it takes you 30 minutes to drive from Las Cruces to Anthony, then it takes you 0.5hours. We know this because 60 minutes are equal to 1 hour. However, how can wewrite these unit conversions, with all the steps, so that we are sure we are convertingunits correctly (especially when the units are foreign to us (i.e. parsecs, AU, etc.))?
Let us begin with our everyday conversion of inches to feet. Say a person informsyou that they are 72 inches tall and you want to know how many feet tall they are.First, we need to know the unit conversion from inches to feet (12 inches = 1 foot).We then write the following equation:
72 inches×1 foot
12 inches= 6 feet (C.1)
Note how the inches units cancel (one in the numerator and one in the denominator)and the units which remain are feet. As for the mathematics, simply use normal rulesof division (72/12 = 6) and you wind up with the correct result.
The second example, minutes to hours, can be performed using the method above,but what if someone asked you how many days there are in 30 minutes? You willneed to use 2 unit conversions to do this (60 minutes = 1 hours, 24 hours = 1 day).Here is how you may perform the unit conversion:
274
30 minutes×1 hour
60 minutes×
1 day
24 hours≈ 0.0208 days = 2.08× 10⁻² days (C.2)
Again, note that the minute units have cancelled as well as the hour units, leavingonly days.
You have now seen how to perform single and multiple unit conversions. The key toperforming these correctly is to 1) make sure you have all the conversion factors youneed, 2) write out all of the steps and make sure the units cancel, and 3) think aboutyour final result and ask whether the final result makes sense (is 30 minutes a smallfraction of a day? Does 72 inches equal 6 feet?).
275

Appendix D
Uncertainties and Errors
A very important concept in science is the idea of uncertainties and errors. Whenevermeasurements are made, they are never made absolutely perfectly. For example, whenyou measure your height, you probably measure it only to roughly the nearest tenthof an inch or so. No one says they are exactly 71.56789123 inches tall, for example,because they don’t make the measurement this accurately. Similarly, if someone saysthey are 71 inches tall, we don’t really know that they are exactly 71 inches tall;they may, for example, be 71.002 inches tall, but their measurement wasn’t accurateenough to draw this distinction.
In astronomy, since the objects we study are so far away, measurements can be veryhard to make. As a result, the uncertainties of the measurements can be quite large.For example, astronomers are still trying to refine measurements of the distance to thenearest galaxy. At the current time, we think the distance is about 160,000 light years,but the uncertainty in this measurement is something like 20,000 light years, so thetrue distance may be as little as 140,000 light years or as much as 180,000 light years.When you do science, you have to always assess the errors on your measurements.
276

Observing Projects
During the semester you may be required to make observations from your home whilecompleting one or more of the projects described below. Your TA will tell you whichones (if any) you must complete. Note that not all of the projects listed here canbe completed during every semester due to the changing positions of the planets.Everyone, however, will have to complete the “Observatory Notebook” section whichrequires you to attend two observing sessions conducted out at the campus observa-tory.
The goal of this semester-long project is to get you outside observing the night sky.This includes tracking the phases of the Moon, identifying and observing the planetsand tracking their motions, and finding constellations. To perform this lab properly,you will have to record your work in an observing notebook, and learn how to use thestar charts at the back of the lab manual. So, obtain a small spiral notebook, or someother set-up that allows you to write down your observations and keep them organized(having a bound notebook is useful due to the windy conditions that frequently occurin Las Cruces). This project is worth two regular lab grades, and should be takenvery seriously! Your TA will tell you which exercises to do, and how many pointseach one is worth. Note that all of the observing projects must be started as soon aspossible to insure that bad weather does not eliminate the possibility of making yourobservations. This is especially true of Exercise #3, since you need to track a planetfor the entire semester to insure you detect its motion.
Warning: Due to the fact that sky is constantly changing, and astronomicalevents/objects can only be seen at certain times, it is impossible to cheaton these observing projects! We will know whether you actually observedwhat you said you observed. So, do not even think about risking the failureof this project (and possibly this course!) by faking your observations, orplagiarizing your friends or any other sources of information.
Setting Up Your “Observatory”
To enable you to complete the assigned exercises in this lab, you must find a sitefrom which you can conduct your observations. This maybe your backyard, nearyour dorm, or somewhere else of your choosing. The key requirements for a goodobserving site are clear views of the southern and western horizons (it would also benice to have a clear view to the East, but it is not always possible to find such a perfectlocation). You also must not have any bright lights at this site-no streetlights, etc.To conduct your observations it must be as dark as possible. One excellent locationon campus to perform these observations is on the activity fields above the track,near the campus observatories. Mark your chosen location (mentally or otherwise) sothat you can return to the same spot each time you observe.
277

After choosing the site for your observatory, you must then find the directions ofthe cardinal points (North, South, East and West). To find the direction of Westis probably the easiest: simply note the point of sunset on one evening early inthe semester. This is West. If you face due West, and stick out your left handhorizontally, it will be pointing South. North is directly opposite South, and Eastis directly opposite West. Note these directions so that you can orient yourself eachtime you observe. You then need to have a watch, a flashlight, a pencil and yournotebook for all of your observing projects.
278

Observing Project #1: The Ever-Changing Moon
The goal of the first project is to get you familiar with the motion of the Moon, andthe changing phases of the Moon. Using a calendar, or asking your TA, find the datesof the next New and Full moons. For this exercise, you will track the phases of theMoon as it progresses from New to Full. This exercise will require you to go outside oneight different nights over a two week period, one time during the semester–DO NOTLEAVE THIS PROJECT UNTIL THE LAST MONTH OF THE SEMESTER!!! Ifso, you might not have good enough weather or time to allow you to complete thisexercise. You need to conduct this project from your observatory site.
Step #1: Find the date of the next New Moon. As you have found out in yourlecture class, during New Moon, the Sun, the Earth and the Moon are all on astraight line. At the time of New Moon, the un-illuminated side of the Moon isfacing us, and the Moon is located close to the Sun in the sky. Thus we cannot seethe Moon during its New phase (unless there is a solar eclipse!). It is usually notpossible to see the Moon until two full days after New. Among amateurastronomers, there are contests on who can be the first to see the Moon after a NewMoon. The record is 12.1 hours after New Moon. For most people though, it isdifficult to see the Moon much less than 24 hours after New Moon. For people inthe Northern Hemisphere, however, the days following the New Moons in Februaryand March offer the best chances for seeing a “young Moon” because the tilt of theEarth’s axis with respect to its orbit places the Moon vertically above the point ofsunset during these months. Given a clear western horizon, and a pair of binoculars,you might be able to see a very young Moon yourself.
Step #2: Beginning (one or) two days after the chosen New Moon, go out about20 minutes after sunset and look for a very thin crescent Moon near the westernhorizon. Can you find the Moon? Either way, note the time of your observation inyour logbook, and whether you were successful at seeing the Moon. If you saw theMoon, draw a sketch of its appearance. [For this sketch, it might be handy to find acan, a bottle, or drinking glass that is about 2 to 4 inches in diameter and use thisto make a perfect circle for the Moon, and then shade in the part you cannot see torender a drawing of the phase of the Moon. Use the same circle-maker for the entireexercise.] In your notebook note the time and date of this observation along withyour drawing. Note whether there are any bright stars or planets near the Moon.
Step #3: You must attempt to observe the Moon three days after the time of NewMoon. Make a drawing of the phase of the Moon and note the time and date.Observe the Moon about 30 minutes after sunset so that it is fairly dark (the timeof sunset can be found in the newspaper or on one of the evening weather forecasts).Besides the bright crescent, can you see the other parts of the Moon glowingfaintly? Within a few days after New Moon, it is often quite easy to see the “dark”portion of the Moon (the part not directly illuminated by the Sun). This
279

phenomenon is called “Earthshine”, or “the old Moon in the New Moon’s arms”.For step #3, you need to research the nature of Earthshine. You can use the web(for example enter “Moon and Earthshine” on Google or another search engine) orlook in a book to find out the cause of Earthshine. Write-up a paragraph or two inyour observatory logbook describing the phenomenon of Earthshine, with adrawing/diagram showing how it arises.
Step #4: Continue to observe the Moon every other day until the Full Phase, andmake sure you observe on the night of the Full Moon! Note the time and dates ofyour observations, and make drawings of the appearance of the Moon. Note thelocations of any nearby bright stars or planets. Use the online star charts athttp://astronomy.nmsu.edu/tharriso/skycharts.html to see if you can
identify which constellations the Moon happens to be passing through. Note thatthe star charts are different for each month, and that the positions of theconstellations change throughout the night and month!
Step #5: Describe/summarize your observations of the Moon. When did theMoon reach a phase of “First Quarter” (when was exactly one half of the Moonilluminated)? Was it possible for you to tell on which date the Moon was perfectlyFull, or did it look Full to you for several days? Which direction did the Moon moveover the course of this two week period? Did it come close to any planets? Anyother interesting observations?
280

Turn in your drawings and log book, including the write-ups to any of the questionsasked above.
Observing Project #2: Locating the Naked-Eye Planets
There are five naked eye planets: Mercury, Venus, Mars, Jupiter, and Saturn. Allfive of these can be easily seen (even in bright city lighting) if they are well placed inthe nighttime sky. Your goal is to observe as many of them as possible. Due to themotions of the planets, not all five planets can be seen at any one time. For example,the planet could be located on the other side of the Sun from Earth, and be invisibleto us. Usually, however, one or more planets is visible in the evening sky (if not, theyare visible in the morning sky!). Your TA will tell you which planets are visible thissemester.
Note that Mercury will just about always be the hardest of the planets to observe.It is only easily seen near the times of greatest elongation (see the “Orbit of Mer-cury” lab for further details). Even then, you have to observe right before sunrise(greatest western elongations), or right after sunset (greatest eastern elongations).Mercury is fairly bright at these times, so it can be seen easily with the naked eye,but you must have a clear horizon to have any chance of seeing it. There are sev-eral methods to identifying the planets. Perhaps the easiest is to have one of theTA’s at the observatory session point them out to you. But we would like you tobe able to search for and find them on your own. One way is to use the sky chartsat http://astronomy.nmsu.edu/tharriso/skycharts.html . Read about how touse those charts, and then orient yourself by identifying some of the constellations inthe nighttime sky using the sky charts. So, if you are told that “Saturn is in Virgo”,you can go out, find Virgo, and see that there is a big, bright star there that is noton the sky chart.
But there are two other good sources: online, or in a magazine. “Sky & Telescope”and “Astronomy” are magazines for the amateur astronomy community. Sky & Tele-scope is a more advanced magazine than Astronomy. Both magazines can be foundin our library, or at a book store (such as that in the mall). Inside these magazinesare monthly columns that talk about which planets are visible, and where they canbe found (including sky charts). In addition, however, both magazines have websites(www.astronomy.com and www.skyandtelescope.com). Both websites have interac-tive sky charts that show where the planets are in the sky. At the Sky & Telescopewebsite, hit the “Interactive Sky Chart” link. At the Astronomy magazine website,after you register (its free), you can access the skychart by clicking on the link “TheSky Online for Beginners” found on the lefthand side of the main webpage (note thatit reads your zipcode to figure out your latitude to make a chart just for you!). Theyellow line that runs across the resulting skymap is the “ecliptic” (the plane of theEarth’s orbit), and all of the planets will be found close to this line. Note wherethese planets are with respect to the stars, and find the same constellations on your
281

skycharts and make a little note on the chart so that you can find the planet whenyou go observing.
Step #1: During the semester identify as many planets in the night time sky aspossible. Write down the details of the time and date of your observations, andconstellation in which you found the planet. Mark the location of the planet on theappropriate sky chart (make sure to turn-in this chart, or a photocopy/handmadeversion of this chart, with the rest of your materials at the end of the semester).Note that the planets are just about always the brightest “stars” in eachconstellation, and thus are very hard to miss! You should conduct this exercise fromyour observing site (unless your western horizon is not good enough to allow you tosee Mercury-if so, you can observe Mercury from the campus observatory, or someother site with a good western horizon).
282

Observing Project #3: Tracking the Motion of a Planet Over theSemester
For this exercise you will be plotting the position of either Venus, Mars, Jupiter orSaturn about once per week during the entire semester. You need to make at leastten observations of the chosen planet spread out over the entire semester-you muststart this by the second or third week of lab to insure that you have enough time andobservations to complete this exercise. Your TA will tell you which planet you are toobserve, and possibly hand out a worksheet on which to record your results (for someplanets, such as Mars, the skycharts at:http://astronomy.nmsu.edu/tharriso/skycharts.html
are sufficient for this project). This is the hardest of the observing exercises. If youneed some help, ask your TA, or one of the TAs at the observatory. You can conductthis exercise from any location that works best for you.
Step #1: Identify the constellation where your TA says the planet is located. Forall of the planets except Venus, go out after about 9 or 10 pm early in the semester(dress warmly!!). As the semester progresses your planet will rise earlier, andearlier, and near the end of it semester will be visible right after sunset. If thechosen planet is Venus, you will need to go out about 20 minutes after sunset to findVenus. Venus is the brightest star-like object in the entire sky (only the Sun andMoon are brighter). Note in your logbook the time and date when you finallyidentified the constellation containing your planet (it is quite possible that theplanet will actually move from one constellation to another during the semester).
Step #2: Identify the chosen planet. This is easy-in fact, it might be easier for youto first find your planet AND then identify the constellation it is in! Normally, theplanet chosen for this exercise will be the brightest object in the nighttime sky afterthe Moon. Sometimes, however, Mars and Saturn can be fainter than some of thebrightest nighttime stars. Note the time and date when you first found your planet.
Step #3: Marking the position of your planet on the star chart. This is thehardest part of the lab. It is likely that you will require a better star map than theonline skycharts to properly keep track of your planet. If so, your TA will give you ahandout with a blown-up version of the constellation/sky region containing yourplanet. Use this star chart in concert with those online to identify the names/lettersof the brightest stars closest to your planet. Note that the brightest star in aconstellation was usually given the designation α (= “Alpha”)), the first letter inthe Greek alphabet. This progresses all the way to the last Greek letter Omega (ω)[For more on the Greek letters, see the little table on cover page for the sky charts.]After that, the fainter stars were given numbers. If you have too many bright lightsnear your observatory site, you might not be able to see very many of the starsmarked on the close-up chart, and might have to conduct this exercise at a locationwhere the sky is a bit darker. If you are still having trouble seeing many stars, see if
283

you can borrow a pair of binoculars to help you better identify the stars near yourplanet.
Step #4: Tracking the motion of the planet by plotting it on the chart/mapdesignated by your TA. Usually the planet will spend the entire semester on thischart. For some fast moving planets (Mars and Venus), you might need to use morethan one chart. If you are given a worksheet, it is likely that there is a dotted linethat goes from one side of the chart to the other: this line dilineates the ecliptic, theapparent path of the Sun through the sky (the projection of the Earth’s orbitalplane). Most planets are found close to the ecliptic. Use this worksheet for plottingthe position of the planet. Using the skychart from the back of the lab manual,and/or the worksheet, locate the position of the planet in the sky. Mark its positionon the star chart with the date of observation. Note in your logbook the time of thisobservation. Every week or ten days, go out and observe the planet, and plot itsposition on your worksheet. You should have ten observations spanning nearly theentire semester to complete this project.
Step #5: Summarize the motion of your planet during the semester. How far didthe planet move? To do this, note that the little squares formed by the grid lines inthe close-up sky chart are exactly one degree on a side. How many degrees did yourplanet move? Given that there are 360 degrees in a circle, how many months will ittake your planet to move completely around the sky? Which direction did it moveduring the semester? Did it follow the ecliptic, or did it move north/south of theecliptic? Why do you think it did this?
Write up your results and turn them in with your other observing materials.
284

Observing Project #4: Discovering a Constellation and its Mythology,and Creating One of Your Own
The goal of this project is very simple: use the online star charts identify a constella-tion in the night sky. You then have to research the origin of this constellation and itsmythology and write it up and turn it in. In addition, you are required to go out andcreate your own constellation using the stars in this, or in any other constellations.You then must create a mythology for your new constellation and write it up andturn it in.
Step 1: Look at the various star charts for the different months that occur duringthis semester. Find a constellation that intrigues you [unless your TA gives youpermission to do so, please do not choose any of the constellations “highlighted” inthe online sky charts!]. Remember, not every constellation found on those charts isgoing to be visible to you. Sometimes a nearby building, tree, or mountain mayblock your view of a particular constellation. Note that over the course of thesemester some constellations will disappear from view in the West, while others willappear in the East. This ever-changing sky is due to the Earth’s motion around theSun. After you have decided on a constellation, find out the best time to observe it(note that if you stay up late, the constellations seen in the later months of thesemester can be seen near midnight at the beginning of the semester). Go out andfind your constellation! Write-up a description of how you found it. What was thetime and date that you first found your constellation? Was it in the West, straightoverhead or in the Southeast, etc. ?
Step 2: Use the internet or a book from the library to research the mythology ofyour chosen constellation. Note that some constellations are modern creations, anddo not have a mythology associated with them. If you chose one of these lessinteresting star patterns, why not go back and choose another (generally larger!)constellation. Most of our constellation names and their mythologies come from theGreeks and Romans. But just about all of the major cultures on our planet havecreated constellation mythologies. See if you can find one of these alternative storiesfor the stars of your chosen constellation (one example is the constellation Oriondescribed in the constellation highlight for February). Are there any interesting orfamous objects located in your constellation (star clusters, planets, galaxies)? Doany of the stars have interesting or unusual names with their own stories? Yourmythology write-up should be one page singlespaced, two pages doublespaced.Please list the references/websites you used to learn the constellation’s mythology.
Step 3: Creating your own constellation. Without using a star map, just sitback/lay down one evening and stare at the stars. Do you see any familiar patternsamongst the stars? As you have probably noticed, many of the classicalconstellations do not resemble the objects they are suppose to represent. They werecreated to honor an important character that occurred in one of that culture’s
285

stories (and sometimes history). So, your constellation doesn’t have to be a perfectrepresentation of the object it is suppose to represent.Now, use the appropriate star chart and draw lines to connect the stars that makeup your constellation. Turn this chart in with the rest of your observing projectmaterials.
Step 4: Creating and writing-up your constellation’s mythology. The final step isto create a mythology to go with your new constellation. Name the brightest starsin your constellation (for example, maybe your constellation represents the 2007New England Patriots, and its brightest star is Tom Brady). Your mythologywrite-up should be at least a page long.
Turn in all of the materials from these four steps.
286

Observatory Notebook(Check Lab Syllabus for Due Dates)
Introduction
Observations are the fundamental tool of the astronomer. Astronomers cannot go outand collect objects of study as a biologist, chemist, or geologist might. They mustsit on Earth and study images or pictures of astronomical objects and learn whatthey can from these images. This may seem like a difficult task, trying to learn frompictures, but light holds a vast amount of information. By studying objects in thesky at different wavelengths, we may learn a great deal about what is happening atgreat distances.
Before the invention of photographic film, astronomers made images of the sky bysitting in front of a telescope and carefully drawing what they saw. Many fantasticdiscoveries were made this way. The discovery that the Horsehead Nebula changedshape over several years was made by comparing two accurate drawings made overa span of a few decades. Galileo observed the motions of Jupiter’s moons whichconfirmed the Copernican model of the solar system. Galileo also observed and drewsunspots proving that the Sun was not a pristine perfect object, but was in fact activeand changing all of the time.
Your task over the course of the semester will be to keep an Observatory Notebook.In this notebook you will draw pictures and give descriptions of many different typesof objects you will see in the sky with the help of the telescopes at the campusobservatory.
Instructions
You are REQUIRED to go to the campus observatory twice during each semester. Ateach visit you are required to see a specific number of objects. If you are unable tocomplete the necessary number of objects in one visit, make sure you return as manytimes as necessary to complete the required number of objects. Your observationswill be due at the halfway point of the semester, and at the end of the semester(your TA will give you the exact dates). Because the skies change over the courseof the semester, objects which are visible one month may not be visible the nextmonth. For this reason you must complete all required observations within each (halfsemester) observing window. If you observe less than the required number of objectsfor the first half, you cannot make up the missed points during the second half. Pleasekeep this in mind when you attend the observatory sessions. It is usually possible toobtain all of your observations in one night, especially if it is not too crowded, andthe weather is clear. Hint: GO TO THE CAMPUS OBSERVATORY NEAR
287

THE BEGINNING OF OBSERVING PERIOD TO AVOID THE LASTWEEK RUSH!! Also remember that even if it is cloudy the entire last week of eachobserving period, you are still responsible for the required number of observations ifthe weather has been clear enough earlier in each observing period!
The following sheets are the observation notebook worksheets; TAKE THESEWITH YOU TO THE OBSERVATORY and fill out one of these sheets foreach object you observe. When you attend the observatory sessions, a TA will bepresent to assist you with the telescope and give you some important informationabout the objects you will be viewing. After you look at the object through the tele-scope, take some time to draw a sketch of what you saw. In the appropriate spaces,write down the date, time, description of the object, observing conditions, which ofthe telescopes was used, and any other details you think are important. Have the TAinitial/stamp each sheet as proof of your attendance to the observatory session thatnight. Before turning in your notebook each month, you should also look up someinformation about each of the objects and write it down under the description sectionof the corresponding notebook page.
288

289

290

291

292

293

294

295

296

297

298

299

300

301

302

303

304

305

306

307

308