laboratory investigation of fatigue endurance limits in
TRANSCRIPT

University of New MexicoUNM Digital Repository
Civil Engineering ETDs Engineering ETDs
7-3-2012
Laboratory investigation of fatigue endurance limitsin asphalt concreteDamien Bateman
Follow this and additional works at: https://digitalrepository.unm.edu/ce_etds
This Dissertation is brought to you for free and open access by the Engineering ETDs at UNM Digital Repository. It has been accepted for inclusion inCivil Engineering ETDs by an authorized administrator of UNM Digital Repository. For more information, please contact [email protected].
Recommended CitationBateman, Damien. "Laboratory investigation of fatigue endurance limits in asphalt concrete." (2012).https://digitalrepository.unm.edu/ce_etds/5

Damien Bateman Candidate
Civil Engineering
Department
This dissertation is approved, and it is acceptable in quality and form for
publication:
Approved by the Dissertation Committee:
Dr. Rafiqul Tarefder , Chairperson
Dr. John Stormont
Dr. Arup Maji
Dr. Percy Ng
Dr. Yu-Lin Shen

LABORATORY INVESTIGATION
OF FATIGUE ENDURANCE LIMITS
IN ASPHALT CONCRETE
by
DAMIEN BATEMAN
B.S., Civil Engineering
&
M.S., Civil (Geotechnical) Engineering
McNeese State University, Lake Charles, Louisiana
DISSERTATION
Submitted in Partial Fulfillment of the
Requirements for the Degree of
Doctor of Philosophy
Engineering
The University of New Mexico
Albuquerque, New Mexico
May 2012

iii
©2012, Damien Bateman

iv
DEDICATION
This work is dedicated to my parents and to my friend Yi Huang.

v
ACKNOWLEDGMENTS
First and foremost, I want to thank my parents for their unconditional support and
encouragement throughout my time in the US. I would like to thank my
supervisor Dr. Rafiqul Tarefder for his guidance, opinion, and support throughout
this study. I would like to express my sincere thanks to my committee members:
Professors Arup Maji, John Stormont, Percy Ng, and Yu-Lin Shen for their
valuable time and advice. I would like to thank New Mexico State Department of
Transportation for their support in this study; Jeff Mann (Head of Pavement
Design, NMDOT), Bob Meyers (Geotechnical Section Manager, NMDOT),
Robert McCoy (Head of Pavement Exploration, NMDOT), Parveez Anwar (State
Asphalt Engineer, NMDOT), Scott McClure (Research Bureau Chief), and Virgil
Valdez (Research Bureau, NMDOT) for their valuable suggestions and
continuous support during the entire duration of the project. Special thanks to Mr.
John Galvin of LaFarge Construction Materials for providing me with asphalt
concrete mixtures. I wish to thank Dr. Aravind Swamy for allowing use of his
viscoelastic model and Mesbah Ahmed for his help in developing a viscoelastic
model using Matlab. I also wish to thank Mekdim Weldegiorgis, Rashadul Islam,
and Ghazanfar Barlas for their laboratory assistance on many tasks. Finally, I am
thankful to my colleagues and friends at the Civil Engineering Department who
have helped me through good times and bad, to eventually get to this point; I will
be forever grateful.

vi
Laboratory Investigation of Fatigue Endurance Limits
in Asphalt Concrete
BY
DAMIEN BATEMAN
B.S., Civil Engineering, McNeese State University.
Louisiana, 2005
M.S., Civil (Geotechnical) Engineering, McNeese State University,
Louisiana, 2007
PhD., Engineering, University of New Mexico, Albuquerque,
New Mexico, 2012
ABSTRACT
It is believed that Hot Mix Asphalt (HMA) mixtures used in long-lasting
pavements contain a threshold of strain value below which no fatigue damage
occurs. This concept is known as the fatigue endurance limit (FEL). Although
previous studies have shown that an endurance limit does exist for HMA
mixtures, an established value is yet to be determined, with values varying from
70-400 microstrain (με) based on mixture variability. Traditional FEL

vii
identification is based on the phenomenological approach, which relates the
number of loading cycles to fatigue failure with applied tensile strain and initial
stiffness of material. This study determined the FEL of two HMA mixtures, SP-II
(coarse mix) and SP-III (fine mix), using the phenomenological approach as well
as a fundamental energy based approach, the dissipated energy concept. Results
show that the dissipated energy approach estimates higher FEL values for both
mix types than those estimated using the phenomenological approach. The FEL
values for the SP-II and SP-III mixtures are estimated to be approximately 200
and 300 με respectively.
Furthermore, laboratory fatigue failure criterion is defined as the number of
loading cycles at which the stiffness of a material reduces by 50%. This study
evaluated stiffness-based failure criteria for laboratory fatigue testing using the
viscoelastic continuum damage mechanics (VCDM) approach. Results show that
fatigue failure criterion of the VCDM approach correlates well with the stiffness-
based fatigue failure criterion. In addition, the effect of polymer-modified binder
on the FEL of HMA materials is investigated. The addition of modified binder to
the SP-II mixture reduced the estimated FEL by 27%. On the other hand, the
addition of modified binder to the SP-III mixture improved its estimated FEL
value by 30%.

viii
TABLE OF CONTENTS
LIST OF TABLES ............................................................................................... xiii
LIST OF FIGURES .............................................................................................. xv
CHAPTER I
INTRODUCTION .................................................................................................. 1
1.1 Problem Statement .......................................................................................... 1
1.2 Hypotheses ...................................................................................................... 4
1.2.1 Hypotheses One .......................................................................................... 4
1.2.2 Hypotheses Two.......................................................................................... 4
1.3 Objectives and Scope ...................................................................................... 5
CHAPTER II
LITERATURE REVIEW ....................................................................................... 6
2.1 Introduction ..................................................................................................... 6
2.2 Current Fatigue Design and Analysis Approaches ......................................... 6
2.2.1 Laboratory Fatigue Test Methods ............................................................... 7
Four Point Bending Test ......................................................................................... 8
Uniaxial Tension Test ............................................................................................. 9
2.2.2 Fatigue Failure Criteria ............................................................................... 9
Flexural Stiffness Reduction ................................................................................... 9
Energy Ratio ......................................................................................................... 12
Traditional FEL Criteria ....................................................................................... 13
2.2.3 Fatigue Analysis Approaches ................................................................... 14

ix
RDEC Approach ................................................................................................... 15
Pseudo Strain Approach ........................................................................................ 18
2.2.4 Extrapolation Techniques ......................................................................... 21
Weibull Single-Stage Function ............................................................................. 22
2.3 Factors Affecting the FEL of Asphalt Concrete ........................................... 25
2.3.1 Effects of Rest Periods .............................................................................. 25
2.3.2 Effect of Applied Strains .......................................................................... 28
2.3.3 Effect of Multiple Temperatures ............................................................... 29
2.3.4 Effects of Aging ........................................................................................ 30
2.3.5 Effects of Binder Content and Mixture Variables .................................... 31
2.4 Correlating Laboratory Testing to Field Performances ................................ 34
2.5 FEL in Current Flexible Pavement Design ................................................... 35
2.5.1 MEPDG..................................................................................................... 36
2.5.2 Illi-Pave ..................................................................................................... 36
2.5.3 PerRoad ..................................................................................................... 37
CHAPTER III
EXPERIMENTAL WORK ................................................................................... 49
3.1 General .......................................................................................................... 49
3.2 Experimental Plan ......................................................................................... 49
3.2.1 HMA Mixture Gradation .......................................................................... 50
3.2.2 Selected Binder Grades and Binder Contents ........................................... 51
3.3 Sample Preparation ....................................................................................... 51
3.4 HMA Sample Cutting ................................................................................... 53

x
3.5 Specimen Volumetric Proportions ................................................................ 53
3.6 Sample Conditioning .................................................................................... 54
3.7 Four Point Bending Beam Fatigue Test ........................................................ 54
3.8 Selected Mode of Cyclic Loading................................................................. 55
3.9 Data Acquisition and Analysis...................................................................... 56
CHAPTER IV
FATIGUE TEST RESULTS AND ANALYSIS .................................................. 68
4.1 Introduction ................................................................................................... 68
4.2 Objective ....................................................................................................... 69
4.3 Test Matrix .................................................................................................... 69
4.4 Laboratory Fatigue Test Results ................................................................... 70
4.5 Analysis of Laboratory Data ......................................................................... 71
4.6 Extrapolation of Fatigue Life ........................................................................ 73
4.6.1 The Effect of Applied Strain on Fatigue Life ........................................... 74
4.7 Fatigue Endurance Limit Prediction ............................................................. 75
4.7.1 FEL Prediction Using the ε-Nf Method .................................................... 76
4.7.2 FEL Prediction Using the RDEC .............................................................. 77
4.8 The Effect of Polymer-Modified Binder on the FEL of HMA Mixtures ..... 80
4.9 Laboratory vs. Field Mixture ........................................................................ 81
4.9.1 Fatigue Performance ................................................................................. 81
4.9.2 Predicted FEL ........................................................................................... 82
4.10 Statistical Analysis ........................................................................................ 83
4.10.1 Flexural Stiffness Data .......................................................................... 84

xi
4.10.2 Fatigue Life Data .................................................................................. 85
4.10.3 Fatigue Results Using Nf50 and ER Criteria .......................................... 85
4.11 Conclusions ................................................................................................... 86
CHAPTER V
COMPARISON OF DIFFERENT FAILURE CRITERA FOR FATIGUE
TESTING ................................................................................................ 120
5.1 Introduction ................................................................................................. 120
5.2 Background on Current Fatigue Failure Criteria ........................................ 122
5.3 Laboratory Testing ...................................................................................... 125
5.4 Analysis procedure...................................................................................... 126
5.5 Results ......................................................................................................... 129
5.6 Comparison of Parameters at Maximum Stiffness Ratio ............................ 129
5.7 Comparison of CD Method with Traditional Method ................................ 130
5.8 Effect of Strain Amplitude .......................................................................... 130
5.9 Summary ..................................................................................................... 131
CHAPTER VI
FATIGUE CRACK PROPAGATION IN HMA MIXTURES .......................... 145
6.1 Introduction ................................................................................................. 145
6.2 Background ................................................................................................. 146
6.3 Fatigue Test Results .................................................................................... 148
6.3.1 SP-II Mixture .......................................................................................... 148
6.3.2 SP-III Mixture ......................................................................................... 151

xii
6.4 Conclusions ................................................................................................. 153
CHAPTER VII
CONCLUSIONS AND RECOMMENDATIONS ............................................. 167
7.1 Summary ..................................................................................................... 167
7.2 Conclusions ................................................................................................. 171
7.3 Recommendations for Future Work............................................................ 173
REFERENCES ................................................................................................... 177
APPENDICES .................................................................................................... 189
APPENDIX A1
DESIGN OF OPTIMAL PERPETUAL PAVEMENT....................................... 190
APPENDIX B
DYNAMIC MODULUS TEST DATA .............................................................. 258

xiii
LIST OF TABLES
Table 2.1 Control Sieves for Various Asphalt Mixes ........................................... 39
Table 3.1 Aggregate Gradation for SP-II Mixture ................................................ 57
Table 3.2 Aggregate Gradation for SP-III Mixture .............................................. 58
Table 3.3 Asphalt Binder Content for NMDOT SP-II and SP-III Mixtures ......... 59
Table 3.4 Theoretical Maximum Specific Gravity of SP-II and SP-III Mixtures 60
Table 4.1 Test Matrix for Laboratory Fatigue Testing of SP-II and SP-III
Mixtures .................................................................................................... 89
Table 4.2 Laboratory Fatigue Test Results for Field SP-II and SP-III Mixtures .. 90
Table 4.3 Fatigue Test Results of Laboratory Prepared SP-II and SP-III Mixtures
................................................................................................................... 91
Table 4.4 Extrapolated Fatigue Test Results for Field SP-II and SP-III Mixtures 92
Table 4.5 Control Sieves for Various Asphalt Mixes ........................................... 93
Table 4.6 Plateau Value Results for Field SP-II and SP-III Mixtures .................. 94
Table 4.7 Plateau Values Results for Laboratory SP-II and SP-III Mixtures ....... 95
Table 4.8 Predicted FEL Values for SP-II and SP-III Mixes ............................... 96
Table 4.9 Summary of FEL Performance of SP-II and SP-III Mixtures .............. 97
Table 4.10 Test Parameters and Results of SP-II (PG 64-22) Mixture ................ 98
Table 6.1 Flexural Fatigue Test Results for SP-II Mixture Samples .................. 155
Table 6.2 Crack Lengths in Failed SP-II Samples .............................................. 156
Table 6.3 Flexural Fatigue Test Results for SP-III Mixture Samples ................. 157

xiv
Table 6.4 Crack Lengths in Failed SP-III Samples ............................................. 158
Table 7.1 Summary of FEL Performance of SP-II and SP-III Mixtures ............ 175

xv
LIST OF FIGURES
Figure 2.1. Typical S-N Diagram for Laboratory Fatigue Tests: ......................... 40
Figure 2.2. Typical Flexural Stiffness Reduction Curve Fatigue Test ................. 41
Figure 2.3 Schematic of Four-Point Beam Fatigue Test....................................... 42
Figure 2.4. Energy Ratio (Rowe) vs. number of cycles to failure ........................ 43
Figure 2.5. Typical Dissipated Energy Ratio Plot Showing Three Stages of
Fatigue....................................................................................................... 44
Figure 2.6 Typical Fatigue Curves for SP-II Mixture using Single-Stage Weibull
Fuction ...................................................................................................... 45
Figure 2.7 Dissipated Energy vs. Number of Cycles to Failure for SP-II Sample 46
Figure 2.8 Fatigue Life Prediction of SP-II Sample using RDEC Approach ....... 47
Figure 2.9. Effect of Rest Period on Fatigue Life ................................................. 48
Figure 3.1 Aggregate Gradations for Superpave SP-II and SP-III Mixtures ........ 61
Figure 3.3 Loading Frame and Sample Mold for Beam Compaction................... 62
Figure 3.4 PMW Linear Kneading Asphalt Compactor ....................................... 63
Figure 3.5 HMA Beam Samples Compacted by Linear Kneading Compactor .... 64
Figure 3.6 Stone Cutting Saw with Modified Clamp ........................................... 65
Figure 3.7 Environmental Chamber and Beam Fatigue Apparatus ...................... 66
Figure 3.8 Beam Fatigue Apparatus ..................................................................... 67
Figure 4.1 Variation of Stiffness Ratio and Energy Ratio with Number of Loading
Cycles of SP-II-N1 Sample ....................................................................... 99
Figure 4.2. Stiffness Ratio Reduction Curves of Replicate SP-II Samples ........ 100

xvi
Figure 4.3(a) Comparison of Fatigue Life between Field and Laboratory SP-II
Mixtures .................................................................................................. 101
Figure 4.3(b) Comparison of Fatigue Life between Field and Laboratory SP-III
Mixtures .................................................................................................. 102
Figure 4.4 Fatigue Curve for SP-II Sample (L2) using Weibull Fuction ........... 103
Figure 4.5 Comparison of Extrapolated and Tested Fatigue Life Results of Field
SP-II Mixtures ......................................................................................... 104
Figure 4.6 Comparison of Extrapolated and Tested Fatigue Results of Field SP-III
Mixtures .................................................................................................. 105
Figure 4.7(a) Flexural Stiffness vs. Loading Cycles for Field SP-II Mixtures ... 106
Figure 4.7(b) Flexural Stiffness vs. Loading Cycles for Field SP-III Mixtures . 107
Figure 4.8 ε-Nf Curve for Field SP-II Mixtures ................................................. 108
Figure 4.9 ε-Nf Curve for Field SP-III Mixtures ................................................ 110
Figure 4.10 Plateau Value vs. Strain Amplitude for Field SP-II and SP-III
Mixtures .................................................................................................. 110
Figure 4.11 Plateau Value vs. Cycles to Failure for Field SP-II and SP-III
Mixtures .................................................................................................. 111
Figure 4.12 Comparison between PV from Model with PV from Test Results for
Field Mixtures ......................................................................................... 112
Figure 4.13 ε-Nf Curves for Laboratory SP-II Mixtures .................................... 113
Figure 4.14 ε-Nf Curve for Laboratory SP-III Mixtures .................................... 114
Figure 4.15 ε-PV Curves for Laboratory SP-II and SP-III Mixtures from
Laboratory Fatigue Testing ..................................................................... 115

xvii
Figure 5.1 Variation of Normalized Pseudo Stiffness and Stiffness Ratio with
Number of Repetitions ............................................................................ 133
Figure 5.2 Damage Characteristic Curve for SP-II-K2 Specimen ...................... 134
Figure 5.3 Damage Characteristic Curves for SP-II Mixture ............................. 135
Figure 5.4 Damage Characteristic Curves for SP-III Mixture ............................ 136
Figure 5.5 Comparison of number of cycles at maximum energy ratio and number
of cycles for 50% stiffness reduction for SP II mixture.......................... 137
Figure 5.6 Comparison of Number of Cycles at Maximum Energy Ratio and
Number of Cycles for 50% Stiffness Reduction for SP-III Mixture ...... 138
Figure 5.7 Comparison of Number of Cycles at Inflection Point and Number of
Cycles at Maximum Energy Ratio for SP-II Mixture ............................. 139
Figure 5.8 Comparison of Number of Cycles at Inflection Point and Number of
Cycles at Maximum Energy Ratio for SP-III Mixture............................ 140
Figure 5.9 Comparison of Number of Cycles at Inflection Point and Number of
Cycles for 50% Stiffness Reduction for SP-II Mixture .......................... 141
Figure 5.10 Comparison of Number of Cycles at Inflection Point and Number of
Cycles for 50% Stiffness Reduction for SP-III Mixture ......................... 142
Figure 5.11 Effect of Strain Amplitude on Failure Criteria for SP-II Mixture ... 143
Figure 5.12 Effect of Strain Amplitude on Failure Criteria for SP-III Mixture . 144
Figure 6.1 Fatigue Cracking in HMA Beam Sample SP-II-A1 .......................... 159
Figure 6.3 Fatigue Cracking in HMA Beam Sample SP-II-M2 ......................... 161
Figure 6.4 Fatigue Cracking in HMA Beam Sample SP-II-N2 .......................... 162
Figure 6.5 Fatigue Cracking in HMA Beam Sample SP-III-F2 ......................... 163

xviii
Figure 6.6 Fatigue Crack Propagating Upwards in HMA Beam Sample SP-III-F2
................................................................................................................. 164
Figure 6.7 Fatigue Cracking in HMA Beam Sample SP-III-J1 .......................... 165
Figure 6.8 Fatigue Cracking in HMA Beam Sample SP-III-M2 ........................ 166
Figure 7.1 Comparison of Predicted FEL Values for SP-II and SP-III Mixtures 176

1
CHAPTER I
INTRODUCTION
1.1 Problem Statement
The predominant use of Hot Mix Asphalt (HMA) in pavement structures within
the United States and worldwide has brought about a significant change in the
way pavements are built today. Pavement design standards are continuously
changing as researchers develop new ways to analyze and predict the behavior of
HMA, which significantly improves design reliability for pavement design
projects. Not for the first time, researchers can look to the past as a way to
improve flexible pavement design. Records have shown that some asphalt
concrete pavements have been performing for 40 years or more without exhibiting
any fatigue damage (Romanoschi et al. 2008, Tarefder and Bateman 2010). It is
believed that the HMA mixtures used in these long-lasting pavements contain an
endurance limit below which no fatigue damage occurs. This concept is known as
the Fatigue Endurance Limit (FEL). Determining the FEL of HMA mixtures is
directly related to the design and construction of long-life or perpetual pavements.
The inclusion of FELs in current pavement design guides is only now being
considered and is still a long way from being implemented on a project-to-project
basis. However, the existence of a FEL in HMA is still relatively new and the
purported value has yet to be established.

2
HMA mixtures are designed primarily to resist rutting and fatigue cracking. In
saying this, HMA mixtures are still vulnerable to fatigue cracking, if not designed
to meet specific traffic loads. Bottom-up fatigue cracking initiates at the base
HMA layer of a pavement due to tensile strains induced from repeated traffic
loading. If the applied tensile strain is greater than the endurance strain of the
HMA material, cracking initiates and propagates toward the surface. Once the
cracks are visible from the surface of the pavement, the only solution is complete
reconstruction. This problem can be avoided by implementing two different
design approaches; (1) build a pavement thick enough so that the tensile strains
experienced at the base of the pavement are negligible, and (2) use a rich-bottom
base layer (RBL) that is flexible enough to withstand the tensile strains caused by
repeated traffic loading. The first option is a conservative approach and is
expensive. The other alternative is much more appealing because a thinner
pavement containing a flexible base layer will provide the same performance as
the thicker pavement, for less cost. However, the binder rich layer creates a ‘bath-
tub’ effect due to its lower permeability, and moisture becomes trapped within the
asphalt layers above which can lead to extensive moisture damage to the mixture.
At any rate, the endurance strain of the HMA mixture used in this flexible layer
must be known in order to prevent fatigue cracking. In summary, identifying the
FEL, if it exists, will improve current design guides for both conventional and
perpetual pavements.

3
Up until now, the fatigue endurance limit of HMA mixtures is determined by
conducting laboratory fatigue testing whereby the number of loading cycles to
failure is related to applied tensile strain and initial stiffness of material. This is
called the phenomenological approach because the relationship is purely
empirical and does not explain the fundamentals of fatigue failure. Laboratory
fatigue testing of HMA mixtures is generally done either by repeated load flexure
or by direct tension tests. From the literature search, the FEL of HMA mixtures
may vary from 70-200 microstrain, depending on mixture properties (Monismith
et al. 1970, Tayebali et al. 1992). In the state of New Mexico, the FEL of local
HMA mixtures is unknown. Determining the FEL of HMA mixtures can provide
valuable data for current pavement design methods and provide significant
economic contribution to the state of New Mexico.
Due to significant design and economic benefits, research in this area is gaining
popularity. A nationwide study is currently being done by the National
Cooperative Highway Research Project (NCHRP 9-44), with the specific goal of
validating the existence of FELs in HMA. In addition to this, the NCHRP intends
to incorporate the use of a FEL in current pavement design guidelines. However,
there is still a need to establish the same design criteria for state highway
agencies. By determining the FEL for local HMA mixtures, improved designs for
longer-lasting pavements can be implemented on a site-specific basis.

4
1.2 Hypotheses
1.2.1 Hypotheses One
Although fatigue endurance limit is well defined in several materials such as steel,
polymer, it is only in recent years that this concept has become an important
factor in asphalt pavement design. Previous studies have shown that some asphalt
concrete does have a FEL, though its exact value varies due to the varying factors
within asphalt mix design. This is to be hypothesized that the FEL of two HMA
mixtures can be determined through laboratory fatigue testing using four-point
bending method and application of analytical models.
Studies have shown that the fatigue life HMA mixtures is affected by mixture
variables such as aggregate gradation, binder content, percent air voids, etc.
However, there are few studies which have described the relationship between the
Performance Grade (PG) binder and the FEL. Therefore, it is hypothesized that
the effects of polymer-modified binder on the FEL of HMA mixtures can be
determined through the use of dissipated energy method as well as using the
empirical strain-fatigue life relationship.
1.2.2 Hypotheses Two
Traditional stiffness-based fatigue failure criteria for HMA materials are not well
defined and often ignore viscoelastic effects. It is also hypothesized that the
application of a viscoelastic damage mechanics approach can identify fatigue

5
failure in HMA materials, as well as evaluate traditional stiffness-based failure
criteria.
1.3 Objectives and Scope
The primary objectives of this study are;
To determine the FEL of four New Mexico HMA mixtures using two
analytical approaches and two stiffness-based fatigue failure criteria.
Four-point beam fatigue testing using controlled strain is performed on
laboratory aged HMA samples. The Plateau Value approach and the
strain-fatigue life relationship are applied to test data to determine the
FEL.
To identify fatigue failure in HMA materials through the use of the
Plateau Value, Energy Ratio, and Pseudostrain approaches and to
determine the effects of crack propagation paths on the fatigue life of
HMA materials. Dynamic modulus testing is done to determine the
linear viscoelastic range where dynamic modulus master curves are
used in Pseudostrain approach.
To evaluate and recommend the use of FEL in designing both
conventional and perpetual pavements using the MEPDG and life-
cycle cost analysis (LCCA).

6
CHAPTER II
LITERATURE REVIEW
2.1 Introduction
A comprehensive literature review is conducted to gather information on current
fatigue design and analysis approaches, related laboratory tests, corresponding
standards, and methodologies used to obtain fatigue endurance limits of HMA
mixtures. Factors that affect HMA mixture fatigue performance are also reviewed
and the literature found is summarized and documented.
2.2 Current Fatigue Design and Analysis Approaches
The FEL is commonly found in metallic materials. However, not all metals have a
well defined FEL, aluminum being a prime example (Hibbeler 2005). Figure 2.1
presents such a case where Figure 2.1(a) describes the increasing fatigue life of a
material as the stress is decreased. Figure 2.1(b) shows the fatigue life of another
material increasing until a limit is reached where the fatigue life becomes
indefinite.
There are limited studies on the FEL of HMA mixes. Early work by Carl
Monismith at the University of California, Berkley, suggested that an endurance
limit does exist for HMA (Monismith et al. 1970). Monismith performed
laboratory fatigue testing of local California HMA mixtures using both controlled
stress and controlled strain modes of loading. No indication is given from the

7
literature if rest periods are included in the testing or if it is continuous loading.
The results suggested that a FEL of 70 με exists for the HMA mixtures. Further
research done by the University of Illinois presented HMA endurance limits
ranging from 70-100 μ taken from 120 different HMA mixes (Carpenter et al.
2003, Shen and Carpenter 2005). However, due to limited research, an established
FEL value has not been confirmed.
Identifying the FEL of HMA mixtures can greatly improve the current design of
perpetual pavements. Conventional pavements are typically designed for 20-30
years. A perpetual pavement is designed to last more than 50 years with minimal
rehabilitation. More on perpetual pavement design is presented in Appendix A.
Considering FEL in perpetual pavement design can greatly reduce total HMA
layer thickness, which would provide significant economic benefits.
In summary, there is sufficient evidence to suggest that a FEL does exist for
HMA. The following sections present different test methods and analytical
models which are currently being used to prove the existence of a FEL in HMA
materials.
2.2.1 Laboratory Fatigue Test Methods
Traditional mechanistic-empirical approaches for predicting fatigue of HMA
mixtures require controlled stress (strain) laboratory testing, usually dictated by a
single temperature over a range of applied stress (strain) levels. The number of

8
cycles to failure is then recorded along with the critical stress (strain) level and
this determines the fatigue life of a HMA mixture. Measured fatigue life in the
field can also be incorporated to validate this approach.
Four Point Bending Test
Four-point bending is the most commonly used HMA fatigue test. The standards
for this bending beam fatigue test (BBFT) are AASHTO T321 and ASTM D7460.
Cyclic loading is applied to an asphalt beam until fracture or failure occurs.
Prowell et al. applied this test method as part of the NCHRP 9-38 project to
validate the existence of a FEL in HMA mixtures (Prowell et al. 2008). HMA
beam samples are tested (380 mm long by 50 mm thick by 63 mm wide) under
constant strain mode using sinusoidal loading at 10 Hz. Testing is conducted
using six different strain levels; 800, 400, 200, 100, 70, 50 μ , and the test is
terminated once a 50 percent reduction in initial flexural stiffness (E0*) is
reached. The study concluded that a FEL for HMA does exist and can be
reasonably extrapolated from 10-12 million cycles using the Weibull function.
However, the major drawback of this study is the time required to run 12 million
cycles, which may take as long as 14 days. Another major shortcoming is the
absence of rest periods during testing where the beneficial effects of healing are
not accounted for. The concept of healing in asphalt concrete is discussed in
greater detail in the Section 2.5.1.

9
Uniaxial Tension Test
Direct tension testing has been used by some researchers to determine the FEL of
HMA mixtures. Fatigue testing on sample cores (3 in. diameter, 6 in. tall)
consisted of haversine load pulses. Fatigue damage required increasing blocks of
constant strain (each block = 10,000 cycles), where each block had greater
amplitude than the previous one. Steel plates are glued to the ends of the samples
with plastic epoxy glue and the specimens are aligned vertically. Testing is
conducted until failure. The crosshead displacement is computer-controlled and
test results are recorded using a data acquisition system. Linear Variable
Differential Transducers (LVDT) are attached to the specimen and a data
acquisition system is set up to record the deformation (strain) of the specimen.
This test method is favorable among many researchers as it more simplified than
traditional fatigue test methods. This is because direct tension testing does not
require the production of HMA beam samples and uses HMA core samples
instead. In addition to uniaxial testing, the development of a viscoelastic
continuum damage mechanics (VCDM) model enabled FEL identification. The
application of VCDM models in determining the FEL is discussed in greater
details in the next section.
2.2.2 Fatigue Failure Criteria
Flexural Stiffness Reduction
Figure 2.2 describes the different stages in a typical fatigue test of HMA. The
stiffness reduction process is characterized by three phases of degradation. The

10
first phase results from internal heating caused by dissipated energy generation
due to the materials viscous properties (Di Benedetto et al. 1997). This occurs at
the beginning of the test when the beam sample is repeatedly flexed and the
sample reaches a new thermal equilibrium (T + ΔTheat). According to Di
Benedetto et al (1997), this increase in temperature has a significant effect on the
stiffness reduction and can be identified as the initial portion of the fatigue curve
where the slope is steep. Samples tested at higher strains generate more heat and
therefore experience a higher rate of stiffness reduction. As the cyclic loading
continues, two major stages are illustrated; formation of micro-cracks which
reduce the stiffness by 25%, and crack formation which further reduces the
stiffness by 35-40%. Failure of the specimen is expected once these two stages are
identified. However, it must be noted that traditional controlled stress (strain)
fatigue tests (failure pronounced at 50% stiffness reduction) do not account for
internal heating of a HMA specimen. A correction factor can be applied here to
account for the internal heating, but testing within a temperature controlled
chamber can reduce the effect of internal heating.
Four point beam fatigue testing of HMA materials is usually performed according
to AASHTO T 321 Standards (2007). Asphalt concrete beams undergo damage
inducing cyclic loading (displacement control). Using the deflection history, load
response history, and geometry of test specimen, the maximum strain and stress in
specimen can be calculated using Eq. 2.1 and Eq. 2.2, respectively.
(2.1)

11
(2.2)
where ε = maximum strain, σ = maximum stress, P = load applied by actuator at
time t, b = average specimen width and h = average specimen height, δ =
deflection at center of beam at time t, a = distance between inside clamps and L =
distance between outside clamps. Figure 2.3 illustrates a schematic of test set-up.
Sample flexural stiffness is then calculated using σ and ε data recorded from each
cycle.
(2.3)
where E = flexural stiffness.
Then, number of cycles at 50% reduction in stiffness is recorded as failure of
beam. Similar process is repeated at other strain levels to obtain relation between
applied strain and number of cycles to failure. The same relation is given in Eq.
2.4. Sometimes, initial stiffness of material is also incorporated into fatigue model
as shown in Eq. 2.5.
(2.4)
(2.5)
Four-point flexural bending of a beam implies that the middle third of the beam is
subjected to pure bending. The flexural stiffness in the mid-section is reduced at a
higher rate than the outer sections due the presence of higher stresses and strains,

12
where eventually micro-cracking will initiate and propagate. Although the
stiffness varies along the length of the beam during fatigue testing, for
interpreting measured deflections, it is assumed that there is a constant stiffness
throughout the beam. A study by Pronk (2009) on the stiffness variation of an
asphalt beam during four-point fatigue testing showed that errors are induced in
the data measurement if the beam stiffness does not reduce at the same rate as that
of the mid-section. Pronk (2009) recommends using strain gauges when
performing fatigue tests so as to determine the rate of stiffness reduction in the
outer sections and thereby establishing correction factors.
Energy Ratio
Rowe and Bouldin (2000) introduced the Energy Ratio for modeling fatigue
behavior. The Energy Ratio approach is based on a stress-controlled study by
Hopman et al. (1989) which claims to identify the point at which micro-cracking
becomes a macro-crack (defined as fatigue failure). The Energy Ratio is obtained
by multiplying stiffness by corresponding number of cycle. Laboratory fatigue
testing is conducted until flexural stiffness is reduced to at least 20 percent.
The Energy Ratio is cross plotted against number of cycles to find failure
location. Such a plot has two distinct regions. In first region, the stiffness
parameter is monotonically increasing where as in second region stiffness
parameter is monotonically decreasing. The reduction in stiffness is linear
(dE*/dn = slope = constant) in the micro-crack formation phase. As cracks form

13
and begin to propagate, the relative damage (dE*/dn) accelerates and resulting
product, the energy ratio (ER), decreases. The junction of these two regions
indicates peak value of stiffness parameter. The peak in the curve indicates the
transition point between micro-crack formation and propagation of a macroscopic
crack, as shown in Figure 2.4. The point at which the maximum value of ER
occurs is defined as the fatigue failure. The peak value can be identified by
systematic search or by curve fitting. A systematic search can be made to locate
maximum value and then back-calculating number of cycles. The Energy Ratio is
defined in Eq. 2.6:
Energy Ratio (ER) = (Ei/E0) x Ni (2.6)
where E0 is the initial flexural stiffness (MPa) Ei is the flexural stiffness at cycle i
(MPa), and Ni is cycle number.
Rowe and Bouldin (200) point out that beam samples showing 50 percent |E0*|
reduction may not yet experience crack initiation. The authors recommend that
testing be conducted until the modulus has dropped to 20 percent |E0*|. Another
disadvantage with traditional controlled stress (strain) tests is that they do not
show the point where micro-crack formations become macro-crack formations
(defined as fatigue failure), as highlighted in Figure 2.4.
Traditional FEL Criteria
Finally, when a beam sample is subjected to 50 million cycles or more, it is
considered to have a FEL close to that applied strain level. To better define the

14
exact FEL, further fatigue testing may be required at a slightly higher strain to
identify the approximate FEL of the mixture. Target failure by loading cycles is
determined by the Highway Capacity manual (2000) which states that 500 million
load cycles is estimated as the maximum possible number of load repetitions
expected in a 40 year period. When considering a shift factor of 10, laboratory
testing to 50 million cycles would equate to approximately 500 million loading
cycles in the field. Based on these analyses, a mix which provided 50 million
cycles or more is considered to be below the FEL.
2.2.3 Fatigue Analysis Approaches
The trend of fatigue analysis approaches has changed significantly over the past
decade due to the rapid growth in computer technology. Initially, empirical
approaches are used to determine fatigue behavior in HMA. However, the
introduction of damage mechanics, discrete element analysis, dissipated energy
and fracture mechanics along with flexure, direct, and/or indirect tension testing
has brought about a shift from empirical-based approaches to mechanistic-based
approaches. This has allowed for a more fundamental understanding of crack
initiation, propagation and fracture.
Traditionally, FEL testing is conducted to a maximum of 50 million cycles which
may take as long as two months to complete. This amount of time is not practical
for routine determination of a FEL. Reducing fatigue testing and introducing a
function (Weibull, Power, logarithmic etc.) to extrapolate the strain level required

15
to reach 50 million cycles is one way to reduce testing time. Furthermore, the use
of fatigue analysis approaches reduces extensive testing time required to confirm
the existence of FEL. Previous studies show the time-saving benefits of applying
fatigue analysis approaches to determining the FEL of HMA mixes (Prowell et al.
2008, Carpenter and Shen 2005, 2006, and 2007, Carpenter et al. 2003). Fatigue
analysis approaches include energy-based techniques as well as viscoelastic
damage mechanics models and extrapolation techniques. Each of these
approaches are described in the following sections.
RDEC Approach
The Ratio of Dissipated Energy Change (RDEC) approach is perhaps the most
refined energy method, which can be used not only to extrapolate fatigue life, but
also determine the FEL. The RDEC is defined as the difference in dissipated
energy between two loading cycles which contributes to damage. In other words,
the area found inside a hysteresis loop (created during cyclic loading and
unloading of HMA) is the dissipated energy. The difference in area of each loop
indicates the damage produced by dissipated energy.
RDEC =
(2.7)
where DEn = total dissipated energy at cycle n, DEn+x = total dissipated energy at
cycle n+x, and x = the number of cycles between the two data points.

16
Previous studies by Ghuzlan (2001) and Carpenter et al. (2003) described the
damage curve using the RDEC versus loading cycles shown in Figure 2.5. It can
be seen that the damage curve is separated into three stages: the initial period
(Stage I), the plateau period (Stage II), and the failure period (Stage III). Stage I
shows rapidly decreasing dissipated energy ratio which indicates ‘settling’ of the
beam sample. The average dissipated energy ratio in Stage II is known as plateau
value. The plateau stage is when a constant percentage of dissipated energy
produces damage. This behavior continues until an increase in dissipated energy
ratio occurs which signifies fatigue failure and unstable crack propagation (Stage
III).
From the plateau stage (Stage II), a value can be determined which indicates
fatigue failure in a sample. This is called the Plateau Value and is defined as the
RDEC value at the number of cycles equal to the failure point (Nf50). Failure is
defined as a 50 percent reduction in initial stiffness, with the initial stiffness being
determined at the 50th
loading cycle. Lower PVs correspond to longer fatigue
lives (Ghuzlan and Carpenter 2000). According to Carpenter and Shen (2005,
2006, and 2009), the PV-Nf relationship is not mixture specific and is supposedly
independent of temperature, mode of loading, frequency, and healing capacity
(rest periods). However, the relationship between the strain amplitude and the PV
must be determined for each HMA mixture.

17
The PV approach can also be used to determine the effects of mixture variables on
the fatigue life. A study by Shen and Carpenter (2007) produced a PV prediction
model based on applied strain and material properties. By varying material
properties such as binder content, flexural stiffness, nominal maximum size of
aggregate gradation, the predicted PV changes, and in turn the predicted fatigue
life is changes. Therefore, this unique PV-Nf relationship suggests that the PV can
be used to predict fatigue life (damage) as well as the effect of mixture variables
and load on the fatigue life.
Furthermore, the PV approach can also be used to determine the FEL. A study by
Carpenter and Shen (2005), included fatigue testing of 98 different mixtures,
using both modes of loading (stress and strain), and varying rest periods (0-0.4
sec) and frequency (0.5-10 Hz). From the PV-Nf relationship, a PV threshold is
identified where the fatigue behavior changes considerably between low and
normal strain fatigue tests. Below PV of 6.74e-09, HMA mixtures showed
extraordinary long fatigue life regardless of applied strain amplitude. Therefore, a
strain level which provides a PV of 6.74e-09 or less, indicates FEL behavior.
In this study, a relationship between the PV and the strain amplitude, which is not
independent of mixture or temperature, is developed. The PV-strain amplitude
relationship is used to predict the strain amplitude that yields a PV of 6.74e-09
which is the FEL.
(2.8)

18
where ε = strain amplitude, and and are regression coefficients (Carpenter and
Shen 2005, Underwood and Kim 2009).
Pseudo Strain Approach
Some fatigue analysis approaches such as the RDEC approach consider asphalt
concrete as an elastic material. However asphalt concrete is a viscoelastic material
and exhibits rate dependent and temperature dependent behavior. Kim (1988)
successfully applied the elastic-viscoelastic correspondence principle for
modeling sand-asphalt mixture behavior under multi level cyclic loading. With
the elastic-viscoelastic correspondence principle, the physical strain ε in the
elastic theory is replaced with a pseudostrain, εR. A pseudo strain is similar to a
physical strain, except that it is independent of time or loading history. The
pseudostrain accounts for the linear viscoelastic hereditary effects of the material
through the convolution integral (Eqn. 2.9) so that damage may be evaluated
separately from viscoelastic effects. Without this substitution, identifying damage
during cyclic loading is very difficult as there may only be a slight difference in
hysteresis loops. The hysteresis loop itself is a direct result of the viscoelastic
response of asphalt concrete. However, when applying very low strains, i.e. no
damage occurring, the hysteresis loops should lie on top of one another. By
applying a pseudo strain, the hysteresis loop collapses and the stress-strain curve
should forms a straight line (line of equality). However, if damage occurs, then
the line of equality changes whereby (i) a reduction in the slope of the pseudo

19
strain line (secant pseudo stiffness) occurs, and/or (ii) the pseudo strain line forms
a loop.
ε
ε
(2.9)
where E(t, t ) = relaxation modulus; and ER = constant reference modulus (usually
taken as unity).
The relaxation modulus describes the linear visoelastic properties and is
determined from dynamic modulus (E*) testing. Data obtained from the E*
testing is used to develop a mastercurve and from this, the relaxation modulus is
determined.
Kim (1988) found that the secant pseudostiffness (stress corresponding to
maximum pseudostrain divided by maximum pseudostrain in each cycle) value
decreases with increasing damage. Daniel (Daniel 2001, Daniel and Kim 2002)
found that the relationship between the normalized pseudostiffness (C1) and the
damage parameter (S1) is unique for a given asphalt concrete mix (hereafter
referred to as damage characteristic curve) under uniaxial mode of loading. The
normalized pseudostiffness (C1) is obtained by dividing secant pseudostiffness by
initial pseudostiffness, while damage parameter (S1) is a function of normalized
pseudostiffness, time and material properties and is shown in Eq. 2.10.
(2.10)

20
where εR
max,i = maximum pseudostrain in cycle i, C1i = normalized
pseudostiffness in cycle i, S1i = damage parameter in cycle i, = material
constant and t = time to maximum pseudostrain in cycle i.
Due to continuous growth of damage, numerical value of damage parameter
continuously increases (with initial value of 0). Further, the normalized
pseudostiffness is plotted against the damage parameter to obtain damage
characteristic curve. Swamy (2011) extended viscoelastic continuum damage
mode to flexure mode of loading and found that damage characteristic curve is
unique at given temperature under flexure mode of loading. Swamy and Daniel
(2011) found a point of inflection in the damage characteristic curve beyond
which the material loses its structural integrity at faster rate. Also, it is observed
that normalized pseudostiffness at this inflection point depends on mixture
properties. The failure criterion used by Swamy and Daniel (2011) is included in
Chapter V where different HMA fatigue failure criteria are analyzed.
The pseudostrain approach can also be used to determine the FEL of HMA.
Pseudo strain calculation requires time history of the applied strain. This is
achieved using increasing strain amplitude testing where direct tension or uniaxial
tension testing is usually performed. Finally, using a cross-plot of stress vs.
pseudo strain, damage is identified when there is a reduction in the slope or the
appearance of a hysteresis loop. At this point, the FEL can be determined (Kim
and Underwood 2009).

21
2.2.4 Extrapolation Techniques
One of the two main requirements for this analytical approach is to choose the
appropriate model for the fatigue analysis. The other main requirement is to
determine the minimum number of cycles to use in the model in order to produce
an accurate fatigue life estimate. A study done by Prowell et al. discusses five
different models used with beam fatigue testing of HMA mixtures; exponential
model, logarithmic model, single-stage Weibull function, three-stage Weibull
function, and the ratio of dissipated energy change (RDEC). HMA mixtures that
did not fail within 50 million cycles are extrapolated to the number of cycles
corresponding to 50 percent reduction of the stiffness. In addition, each model is
evaluated in terms of predicting fatigue failure, using HMA samples that had
fatigue lives of 20-50 million cycles. The authors concluded that the best
extrapolation method for low-strain fatigue tests is the single-stage Weibull
function, which appeared to be the most conservative and also had the least
variability (Prowell et al. 2008).
However, there are some drawbacks to using these models. The AASHTO T321
standard does not state whether all of the data (especially the initial data) should
be used when solving the constants of the exponential model. The power,
logarithmic and RDEC models all overestimate the fatigue life when applied to
tests of low cyclic loads (less than 10 million). These models are recommended
for estimating fatigue life at strain levels less than or equal to the FEL. A number
of initial cycles also need to be eliminated in order to obtain a good fit to the slope

22
at high numbers of cycles. Failure to eliminate some of the initial cycles may
result in an overestimation of the fatigue life (Prowell et al. 2008).
For this study, the single-stage Weibull function and the RDEC approach are used
to extrapolate the fatigue life of HMA samples tested at low and normal strains.
Weibull Single-Stage Function
The single-stage Weibull function has been used before with some success in
predicting FEL in HMA, as discussed earlier in Chapter II. The NCHRP Project
646 in particular compared several extrapolation techniques in determining the
FEL. The NCHRP Project 646 concluded that the single-stage Weibull function
provided the most reliable results, when compared with actual FEL test data.
Based on this recommendation, the single-stage Weibull approach is included in
this study to predict the fatigue life of low strain tests, and if possible, provide
confirmation of the FEL for SP-II and SP-III mixtures. A step-by-step procedure
for applying this approach to predicting fatigue life is shown in the NCHRP 646
Project report (Prowell et al. 2010). The general form of the Weibull function is
shown in Eq. 2.11:
–
(2.11)
where R(t) = the reliability at time t where t might be time or another life
parameter such as loading cycles, γ = the slope, δ = the minimum life, and θ = the
characteristic life.

23
Tsai et al. (2003) adapted this Eq. 2.11 where the minimum life, δ, is assumed to
be 0. The general form is then simplified into Eq. 2.12, where the hazard function
is equal 1/γ. Since the beam fatigue loading cycles are applied at a constant
frequency of 10 Hz, the loading cycles, n, can be substituted for time, t.
(2.12)
where S(t) = probability of survival until time t, n = number of loading cycles, λ =
scale parameter (intercept, b), γ = shape parameter (slope, m).
To characterize fatigue damage, the stiffness ratio (SR) is used, which is the
stiffness measured at any cycle, divided by the initial stiffness. According to Tsai
et al (2002), SR(n) can be substituted for S(t) given the fact that at any one cycle,
the sample has a probability of survival past that cycle equal to the stiffness ratio
times 100 percent. Eq. 2.13 allows the scale and shape parameters for laboratory
beam fatigue data to be determined by linear regression.
(2.13)
This equation is applied to fatigue test data taken from low strain testing. A plot
of the data shows the left-hand side of the equation versus the natural logarithm of
the number of cycles, and from this, a straight line regression is produced. Using
the slope and intercept parameters as well as a SR of 0.5, Equation 2.13 is solved
for n by Excel solver function. This value of n is the extrapolated fatigue life for
50 percent initial stiffness.

24
Figure 2.6 presents typical fatigue curves of two HMA samples fitted to the
single-stage Weibull function. Both samples are tested at the same strain, and the
point where both curves intersect is where both tests initiated. However, from this
point on, both curves diverge and follow different paths. The paths are indicative
of the rate of fatigue damage occurring in both samples. From this, one can see
that sample K2 has a much steeper slope, which corresponds to a higher rate of
fatigue damage, and hence a shorter fatigue life. A linear regression of the curves
is shown which can be used to estimate fatigue life using Eq. 2.13.
Fatigue Life Extrapolation Using RDEC Approach
For fatigue testing at normal strain amplitudes, the number of cycles to failure,
Nf50, is plotted versus the dissipated energy (kPa). Figure 2.7 shows an example of
the DE-LC relationship for an SP-II mixture. A best fit equation for the DE-LC
data is obtained, using a power law relationship. From the best fit equation, the
slope, f, of the curve, is noted. As stated earlier, the RDEC is defined as the ratio
of dissipated energy change between two loading cycles by the number between
the cycles, that is, the average ratio of dissipated energy change per loading
cycles, as seen in Eq. 2.7. However, because of the presence of noise in the raw
data, the average RDEC for an arbitrary 100 cycles at cycle ‘n’ is calculated using
Eq. 2.14.
(2.14)
where f = the slope from the regressed DE-LC curve.

25
PV calculation from low strain fatigue test data is similar to what is shown above
for normal strain testing. The RDEC (Eq. 2.7) versus loading cycles is plotted
using a log-log scale. Carpenter and Shen’s unique PV-Nf curve, Eq. 2.15, is then
used with fatigue test data (Nf50) from previous fatigue tests performed at normal
strain amplitudes. The intersection of these two curves is the estimated fatigue life
of the sample tested at low strain. Figure 2.6 provides an example of a RDEC vs.
loading cycle curve for a fatigue test (SP-II-L2) conducted at low strain. Shown
on the same plot is a curve displaying the fatigue life of tests conducted at normal
strain, which are fitted Eq. 2.15.
(2.15)
The RDEC-LC curve is extended until it crosses the unique PV-Nf curve. The
intersection point of these two curves produces the PV (y) and Nf50 (x). The PV
and Nf50 are then calculated using Eq. 2.16 and 2.17, respectively.
(2.16)
(2.17)
2.3 Factors Affecting the FEL of Asphalt Concrete
2.3.1 Effects of Rest Periods
An important concept that has been highlighted recently in pavement design,
which directly affects the FEL of HMA, is damage recovery or healing that occurs
during rest periods. Current research undertaken by the National Cooperative
Highway Research Program considers this concept as their primary objective in

26
designing a perpetual pavement. The aim of the research is to design/build a
pavement that ensures that the damage induced by the loading is low enough so
that healing occurs. Therefore, there is no accumulation of damage over the life of
the pavement (Advanced Asphalt Technologies 2008). This design approach
differs from traditional perpetual pavement design approaches which do not
consider healing.
Healing is a well known phenomenon in materials such as polymers, glass and
portland cement (Jud and Kausch 1979, Stavrinidis et al. 1983, Sukhotskaya et al.
1983, Clear 1985, and Edvardsen 1999). The healing phenomenon is generally
considered as the capability of a material’s self-recovery which occurs between
loads when damage is reversed as the asphalt–aggregate interface reattaches,
thereby closing microcracks. However, according to some researchers, it is a
continuous physical-chemical reaction that may occur as applied load damage
develops, not just between load applications (Carpenter and Shen 2006).
According to another study by Freund and Suresh (2003), when considering a
viscoelastic material such as HMA, the actual fatigue behavior can be explained
as energy equilibrium between surface energy and the dissipated damage energy.
Healing potential is the difference between surface energy and the dissipated
damage energy. Little et al. (1999) showed that surface energy is responsible for
microcrack damage rates using Schapery’s viscoelastic fracture theory. According
to Little et al., if surface energy is smaller than the dissipated damage energy, the
healing potential is negative; hence the material will increase surface energy

27
through microcracking. This is the process of crack initiation and propagation
(damage). However, if the dissipated damage energy is low, the positive healing
potential controls the energy equilibrium whereby a reduction in surface energy
will close crack openings through a healing process. The dissipated energy level
is determined by external load and internal material properties (Carpenter and
Shen 2005).
Another study which helps explain the mechanism of healing in asphalt materials
is that of Petersen (1984), which stated that the association force (secondary
bond) is considered the main factor in controlling the physical properties of
asphalt. Petersen’s concludes that the higher the polarity, the stronger the
association forces. Lytton (2000) conducted a similar study which concluded that
the fracture or healing of an asphalt mixture is related to two mechanisms: the
surface energy storage and the surface energy release. Therefore, microfracture
and healing of HMA are governed by the energy balance per unit of crack area
between the dissipated energy released and the energy that is stored on the surface
of the crack.
However, the effects of healing and its contribution to fatigue life of HMA are
very much unknown. As yet, there is no current pavement design method that
considers the effects of rest periods under real traffic conditions, except for the
use of shift factors, which are arbitrary at best. A study done by Carpenter and
Shen (2006) described the effects of healing or rest periods on the fatigue life of

28
HMA and in particular, explains the existence of a FEL in HMA. Data recorded
from strain-controlled flexural-fatigue tests on two different mixes (neat and
polymer-modified) is analyzed using the RDEC approach (Carpenter and Shen
2005). Figure 2.8 described the effect of rest periods on two HMA mixes. As the
rest period increased, the fatigue life also increased for both HMA mixes
(Carpenter and Shen 2006). However, the major disadvantage of this method is
the additional time required to incorporate healing. A short rest period of 0.9
second can increase testing time from 3 to 30 hours. A more reasonable rest
period of 90 seconds would require 10 to 100 days of continuous testing
(Underwood and Kim 2009).
2.3.2 Effect of Applied Strains
There are times during the service life of a perpetual pavement that it will
experience strains greater than the design FEL (usually 70 με) which will
certainly reduce the fatigue life of the pavement and may even eliminate possible
FEL behavior. Some studies have shown that higher applied strains reduce the
fatigue life of HMA. In particular, a study by Carpenter and Shen (2006) applied
continuous loading on two different HMA mixes and then compared the fatigue
test results of both mixes. The study concluded that higher applied strains yielded
higher plateau values, which correspond to a lower fatigue life. This result is
expected as higher applied strains are more likely to cause more damage. In
addition, healing of the HMA requires more time and if full recovery is not
achieved, damage accumulates and the fatigue life shortens.

29
The theory of reduced fatigue life due to higher applied strain levels is discussed
in greater detail by Thompson and Carpenter (2004) where they investigated the
effects of overloading HMA mixtures beyond the FEL. Cyclic loading is carried
out to about 50 million cycles at 70 με on a HMA mixture with a fatigue life of 6
x 1011
cycles. At this point the strain level is increased to 500 με and loading is
continued for another 6000 cycles. It is also noted that the fatigue life of the
undamaged mixture at 500 με is about 20,000 cycles. Following the 6000 cycles,
the strain level is reduced to 70 με with the remaining fatigue life expected to be
around 2.3 x 10¹¹
cycles, which suggests FEL behavior. Thompson and
Carpenter’s paper (2004) concluded that the effects of overloading do not alter the
existence of a FEL. This study also confirms that at higher applied strains, fatigue
life is shortened but does not necessarily eliminate the FEL behavior of a
perpetual pavement.
2.3.3 Effect of Multiple Temperatures
Environmental effects, especially temperature variations, are considered one of
the main contributors to long-life flexible pavement deterioration according to
pavement experts in the United Kingdom (Brown et al. 2004). To be of practical
use, strain amplitudes on HMA mixes must be applied using a wide range of
temperatures. As mentioned previously, applied strains are usually tested in a
controlled environment with a temperature of 20°C. Healing can also be
considered but the effect of temperature on healing is very much unknown. Some
studies indicate that the healing effect of rest periods increases with increasing

30
temperature (Bonnaure et al. 1982). Research spearheaded by the NCHRP Project
9-19 investigated the effects of using multiple temperatures (along with rest
periods) on allowable strains of HMA mixes by applying a time-temperature
superposition (Chehab et al. 2003). Results showing allowable to applied strain
ratios of a specific HMA mix at different temperatures revealed that critical
fatigue cracking conditions are more apparent at low-moderate pavement
temperatures (10-15°C). This is expected as fatigue damage is usually reduced at
higher temperatures where the HMA mixture softens and the healing rate of
damage increases.
2.3.4 Effects of Aging
The effects of aging are very important when characterizing the fatigue life of
HMA and the establishing the subsequent FEL. It is well known that as the
pavement life ages, the stiffness of the asphalt binder increases and in turn, the
dynamic modulus of the HMA increases. Hence, the applied strains must be
loared in order to prevent fatigue cracking. In addition, healing of HMA is also
affected and one can assume that as the asphalt binder hardens, the healing effect
decreases. Only one study has been found from the literature review that
comprehensively describes the effects of long-term aging of HMA. Laboratory
aging exposure conditions are varied (0, 3, and 6 months) at 60°C which
simulated approximately up to 12 years of aging. Results of strain-controlled
laboratory testing showed that binder oxidative aging reduced HMA mixture
resistance to cracking and its ability to heal. In addition, all mixtures tested

31
showed an exponentially declining Nf trend due to aging (Walubita 2006). The
recent pavement design guide developed by AASHTO, the mechanistic-empirical
pavement design guide (MEPDG), uses a global aging model to determine aged
modulus values of HMA mixes. Further research is needed in this area to
determine the effect of aging on HMA healing and consequently the effect of
aging on the FEL.
2.3.5 Effects of Binder Content and Mixture Variables
Research on the effect of mix variables on the FEL of HMA have shown a wide
range of FEL values depending on binder selection and HMA mix composition.
The FEL of HMA mixtures is said to be affected by mixture variables such as
percent air voids, aggregate gradation, asphalt binder content etc. However, from
the literature search, there are very few studies about the effect of polymer-
modified binders on the FEL. Some studies have shown that using certain
polymer binders (PG 76-22) in particular HMA mixtures enhances the ability to
withstand fatigue cracking. Therefore, the presence of modified binder in HMA
materials should improve the FEL of HMA mixtures (Von Quintas et al. 2004,
Prowell et al. 2010). Another study showed mixed results with mixtures
containing two different modified binders showing greater fatigue life than
mixtures containing one of the unmodified binders. However, mixtures containing
unmodified binder with lower temperature susceptibility, achieved two to three
times the fatigue life of the polymer modified mixtures (Goodrich 1988).
32
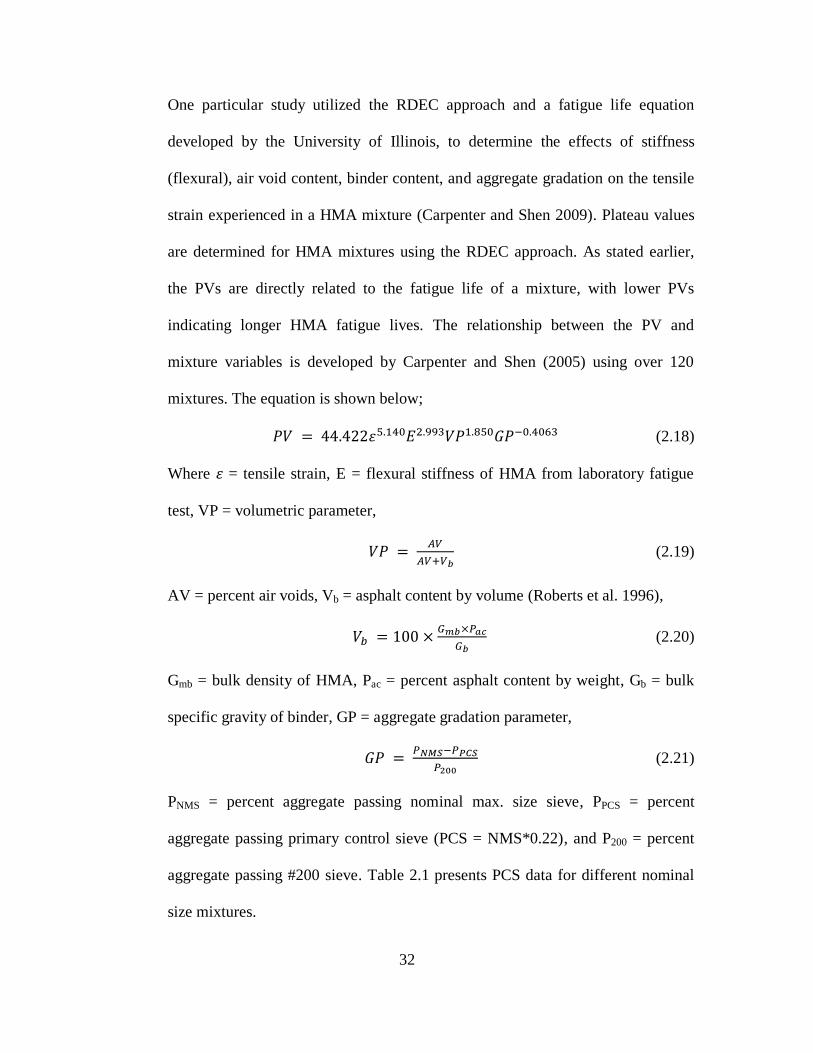
One particular study utilized the RDEC approach and a fatigue life equation
developed by the University of Illinois, to determine the effects of stiffness
(flexural), air void content, binder content, and aggregate gradation on the tensile
strain experienced in a HMA mixture (Carpenter and Shen 2009). Plateau values
are determined for HMA mixtures using the RDEC approach. As stated earlier,
the PVs are directly related to the fatigue life of a mixture, with lower PVs
indicating longer HMA fatigue lives. The relationship between the PV and
mixture variables is developed by Carpenter and Shen (2005) using over 120
mixtures. The equation is shown below;
(2.18)
Where = tensile strain, E = flexural stiffness of HMA from laboratory fatigue
test, VP = volumetric parameter,
(2.19)
AV = percent air voids, Vb = asphalt content by volume (Roberts et al. 1996),
(2.20)
Gmb = bulk density of HMA, Pac = percent asphalt content by weight, Gb = bulk
specific gravity of binder, GP = aggregate gradation parameter,
(2.21)
PNMS = percent aggregate passing nominal max. size sieve, PPCS = percent
aggregate passing primary control sieve (PCS = NMS*0.22), and P200 = percent
aggregate passing #200 sieve. Table 2.1 presents PCS data for different nominal
size mixtures.

33
Once the PV is known, the allowable strain, , where no damage accumulates, can
be determined using Equation 2.2, and this is considered to be the FEL strain of a
mixture. Applying a PV of 6.74e-09
, which represents FEL behavior in a HMA
mixture (Carpenter and Shen 2005), to Equation 2.22, enables a prediction of the
FEL using material properties.
(2.22)
The paper concluded that the flexural stiffness, volumetric parameter, percent air
voids, and percent asphalt content had the most significant impact on the fatigue
life of HMA. Early research conducted by Monismith indicated that an increase in
HMA stiffness due to a decrease in air voids, and an optimum asphalt content
produced longer HMA fatigue life (Monismith et al. 1970). The mix variable that
affected the FEL of HMA the least is the aggregate gradation. Variables included
within the aggregate gradation included the gradation parameter, GP, percent
passing the nominal maximum size sieve, PNMS, percent passing the primary
control sieve, PPCS, and percent passing the #200 sieve, P200. Little or no change is
observed due to changes made to these mix variables. Research conducted by
Monismith also concludes that aggregate grading also has little effect on fatigue
life of HMA (Monismith et al. 1970). However, this conclusion does not seem
practical as gradation plays a significant role in the stiffness of HMA mixtures
and this in turn may be highly influential on the FEL of HMA (Prowell et al.
2010).

34
Finally, recent studies (Lee et al. 2002, Von Quintus 2004) have shown that HMA
mixtures containing modified binders have a greater laboratory fatigue life than
those that contain unmodified binders. However, there are very few studies which
have explored this area, and more research is needed in order to know more about
the effect of modified binders on the fatigue life of HMA mixtures.
2.4 Correlating Laboratory Testing to Field Performances
Many studies have been conducted to determine the relationship between
laboratory fatigue test results and subsequent field performances (Leahy et al.
1995, Pierce and Mahoney 1996, Harvey et al. 1997, Romero et al. 2000, Zhou et
al. 2007). The conclusions of some of these studies indicate that the laboratory
fatigue life of HMA specimens do not match the field fatigue life of tested
pavements (Romero et al. 2000, Zhou et al. 2007). One study in particular tried to
identify the relationship between laboratory FEL, measured strains of pavement
test sections (National Center for Asphalt Technology, NCAT), and the overall
performance of these test sections (Willis and Timm 2009). Results indicated that
no relationship could be found between laboratory testing, measured field strains,
and overall pavement performance. Although this paper is not successful in its
objective, it does illustrate the difficulty in producing laboratory test results that
can be related to field performances.
The other alternative to relating laboratory testing to field performances is the
application of shift factors. The application of shift factors to laboratory test

35
results is well documented and from the literature, shift factors vary from 4 to 100
depending on mix design and state agency (Harvey et al. 1997, Priest 2006). It
appears that from the literature reviewed, the fatigue life of HMA pavements in
the field is much greater than the HMA mixes tested in the laboratory. Reasons
for this vary from wheel wander in field pavements and fatigue test methods
(loading/temperature variations) to the effect of healing/rest periods on the fatigue
life of field pavements (Tangella et al. 1990). However, the use of shift factors
clearly underlines the difficulty of applying field fatigue conditions to laboratory
fatigue test set ups.
2.5 FEL in Current Flexible Pavement Design
Traditionally the inclusion of fatigue in flexible pavement design requires the use
empirical relationships which relate the tensile strain to the number of load cycles
to failure. An example of this relationship is shown earlier in Eq. (2.4). This
empirical relationship has since been modified based on observed behavior in the
field. An example of this can be seen in the Mechanistic Empirical Pavement
Design Guide (MEPDG);
(2.23)
where Nf = number of cycles to failure, |E*| is the dynamic modulus of the HMA,
and K, n, and b are the regression constants determined from laboratory testing.

36
2.5.1 MEPDG
The basic inputs for the MEPDG include environmental conditions, materials, and
traffic data. The material characterization provides two major inputs; pavement
response properties which predict the states of stress, strain and displacement
within the pavement due to traffic loading, and distress/transfer functions which
relate traffic loading to fatigue cracking, rutting, and other pavement distresses
(Walubita 2006). The latest version of the MEPDG considers two fatigue factors;
(i) a HMA fatigue algorithm shown in Eq. 2.23, and (ii) a FEL. The first option
determines the tensile strain, t, at the base of the HMA layer due to traffic-
induced loading. MEPDG plugs this value into Equation 2.23 to determine Nf
which is then used to calculate percent fatigue cracking. The second option
compares the calculated t to the predetermined FEL (input value). If the resulting
t is below the FEL, fatigue cracking will be negligible (zero). Thompson and
Carpenter did a study where they applied a FEL input value and then compared
the results with the predicted fatigue cracking (no FEL input) using the HMA
fatigue algorithm. Results indicated that the FEL input has very little effect on the
estimated HMA fatigue cracking (Thompson and Carpenter 2009).
2.5.2 Illi-Pave
Illi-Pave is a stress-dependent elastic layer program (ELP) developed at the
University of Illinois (Thompson and Carpenter 2006). Tensile strains at the base
of HMA pavements can be calculated using the following fatigue algorithm
developed at the University of Illinois;

37
(2.24)
where εHMA = HMA flexural strain (micro-strain) for a 9-kip wheel load, THMA =
HMA thickness (inches), EHMA = HMA modulus (ksi), and ERi = subgrade
modulus (ksi).
No traffic input is required. Through iterations, the pavement thickness required
to achieve a specific FEL can be determined. Illi-Pave is a program that can
determine a pavement thickness that ensures HMA strains are less than or equal to
the FEL.
2.5.3 PerRoad
Another ELP model widely used is the PerRoad program which is developed at
Auburn University, Alabama (Timm and Young 2004). The HMA fatigue
algorithm is identical to Eq. 2.4 shown earlier. Fatigue results are presented as the
percent of HMA strain less than the FEL, which should be close to 100 percent if
a perpetual pavement is required. Basic inputs to PerRoad are similar to those
used in the MEPDG and both programs can accommodate FEL as design input.
However, the major drawback of these two programs is that predicted HMA
strains are not provided as outputs. Thompson and Carpenter emphasized this
point in their study on the suitability of these three programs in designing
perpetual pavements using the FEL. They also stated that the simplicity of the Illi-
Pave procedure is an attractive feature compared to the comprehensive nature of
the other two programs. However, the take-home message of this paper is that all

38
three programs are more than capable of providing perpetual pavement designs
(Thompson and Carpenter 2009).

39
Table 2.1 Control Sieves for Various Asphalt Mixes
Sieve Size
NMS
mm
(in.)
37.5
(1.5)
25
(1)
19
(0.75)
12.5
(0.5)
9.5
(0.375)
4.75
(#4)
PCS
mm
(in.)
9.5
(0.375)
4.75
(#4)
4.75
(#4)
2.36
(#8)
2.36
(#8)
1.18
(#16)
Note: NMS=Nominal Max Sieve Size, PCS=Primary Control Sieve

40
Figure 2.1. Typical S-N Diagram for Laboratory Fatigue Tests:
(a) Endurance Limit; (b) No Endurance Limit (Advanced Asphalt Technologies
2008)
Ap
pli
ed S
trai
n (
με)
Cycles to Failure, N
(a) Fatigue Endurance
Limit
Data points taken
from fatigue testing
(b) No Fatigue Endurance
Limit

41
Figure 2.2. Typical Flexural Stiffness Reduction Curve Fatigue Test
0
20
40
60
80
100
120
0 5000 10000 15000 20000 25000 30000 35000
Sti
ffness
Rat
io, E
/E0
Number of Cycles , N
Stiffness Ratio (%)
Internal Heating
Micro-crack Formation
Crack Formation

42
Figure 2.3 Schematic of Four-Point Beam Fatigue Test
Applied Load or Stress, P
P/2 P/2
R1 R2
a=L/3
Deflection, Δ
h
b
Applied Strain, ε = 12*h*Δ
3L2 - 4a2
Measured Stress, σ = P*L
b*h2

43
Figure 2.4. Energy Ratio (Rowe) vs. number of cycles to failure
0
500000
1000000
1500000
2000000
2500000
3000000
3500000
4000000
0 2000 4000 6000 8000 10000
N*
E -
Sti
ffn
ess
Rat
io (
kP
a)
Number of Cycles to Failure, Nf
Sample D1
Sample D2
Maximum value
of ER
Sample Failure, Nf

44
Figure 2.5. Typical Dissipated Energy Ratio Plot Showing Three Stages of
Fatigue
0.00
0.01
0.01
0.02
0.02
0.03
0.03
0.04
0.04
0 100000 200000 300000 400000 500000 600000 700000
Dis
sip
ate
d E
ner
gy R
ati
o, D
SE
R
Number of Cycles to Failure, Nf
Dissipated Energy Ratio
Stage I Stage II Plateau Stage
Stage III
Plateau
Value

45
Figure 2.6 Typical Fatigue Curves for SP-II Mixture using Single-Stage Weibull
Fuction
y = 0.5738x - 6.17
R² = 0.9645
y = 0.8756x - 6.6302
R² = 0.9224
-5.0
-4.0
-3.0
-2.0
-1.0
0.0
1.0
2.0
0 2 4 6 8 10 12
Ln(-
Ln(S
R))
Ln(N)
Sample K1 Sample K2
Linear (Sample K1) Linear (Sample K2)

46
Figure 2.7 Dissipated Energy vs. Number of Cycles to Failure for SP-II Sample
y = 70.295x-0.352
R² = 0.9695
0
0.5
1
1.5
2
2.5
3
3.5
4
4.5
0 2000 4000 6000 8000 10000 12000
Dis
sipat
ed E
ner
gy (
kP
a)
Number of Cycles to Failure, Nf50
DE - SP-II Sample f

47
Figure 2.8 Fatigue Life Prediction of SP-II Sample using RDEC Approach
Sample L2
200ms
1.E-14
1.E-13
1.E-12
1.E-11
1.E-10
1.E-09
1.E-08
1.E-07
1.E-06
1.E-05
1.E-04
1.E-03
1.E-02
1.E-01
1.E+00
1 100 10000 1000000 100000000 1E+10
Lo
g R
DE
C
Log Number of Cycles, N
PV-Nf Sample L2-200ms Power (PV-Nf) Power (Series5)
Nf
Nf
Nf
1600 microstrain
800 microstrain
400 microstrain
Nf

48
Figure 2.9. Effect of Rest Period on Fatigue Life
(Advanced Asphalt Technologies 2008)
Rela
tive F
atigue L
ife
Duration of Rest Period, sec
0 2 4 6 8 10 12
20
18
16
14
12
10
8
4
0
Neat PG 64-22
Polymer PG 70-22

49
CHAPTER III
EXPERIMENTAL WORK
3.1 General
This chapter describes the experimental plan which includes materials selection
and sample preparation. Laboratory fatigue testing is described in this chapter.
3.2 Experimental Plan
Two HMA mixtures: SP-II and SP-III mixtures, which are typically used in major
highways and primary routes in the State of New Mexico are used in this study.
The SP-II mixture is considered a rut-resistant HMA mixture, predominantly used
in intermediate AC layers of a pavement structure. This type of HMA mixture is
selected for fatigue analysis on the assumption that although considered a rut-
resistant mixture, it may perform poorly in fatigue or other forms of cracking. The
SP-III mixture is considered a finer Superpave HMA mixture than SP-II mixture,
and is designed with a PG 70-22 binder. SP-III mixture is considered a fatigue
resistant HMA mixture usually used in the intermediate and base AC layers of a
pavement structure.
HMA mixtures and aggregate materials are obtained from on-site construction
projects and from source batch plants. Sampling methods in accordance with
AASHTO T-168 (bituminous mixtures) standards and T-2 (aggregates)
procedures are followed. In total, about 40-50 bags containing 18-20 kg of HMA

50
mixtures are collected from the project site and about 25-30 bags of similar
weight containing HMA granular materials are also collected from the source
batch plant. HMA mixtures are sampled using paper bags (double-bagged) where
a smaller sample size is more efficient for the heating/compaction process.
Samples of PG 64-22 binder and PG 70-22 binder grades are also collected from
the source batch plant.
Laboratory testing is performed to determine the physical properties of the HMA
mixtures subsequently used for this project. Laboratory testing includes the bulk
specific gravity test (Gmb), the theoretical maximum specific gravity test (Gmm), as
well as binder content and aggregate gradation testing.
3.2.1 HMA Mixture Gradation
Aggregate gradation chart of SP-II and SP-III mixtures is shown in Figure 3.1.
Maximum density lines for maximum aggregate sizes of 1 in. and 1.5 in. are
plotted in Figure 3.1, corresponding to maximum aggregate sizes of respective
SP-III and SP-II mixtures. Mixes that plot above the maximum density line are
generally fine mixes while mixes that plot below the maximum density line are
generally coarse mixes. Both SP-II and SP-III mixtures plot below their respective
maximum density lines. Therefore, SP-II and SP-III are coarse mixes with SP-II
somewhat coarser than SP-III due to larger size aggregates. Table 3.1 shows
aggregate gradations of three SP-II mixture samples that are tested using
AASHTO T30-08 standards. Also shown in Table 3.1 are the upper and lower

51
limits of the SP-II aggregate gradation. Results show that all three sample
gradations fall within these limits. Table 3.2 shows similar results for aggregate
gradations of the SP-III mixture, with sample gradations falling within the
specified limits.
3.2.2 Selected Binder Grades and Binder Contents
Among the performance grade (PG) binders typically used in New Mexico, the
selected binders for this study are PG 64-22 and PG 70-22. Unlike PG 64-22, PG
70-22 is a modified binder with a polymer that improves its high-temperature
properties in terms of the shear and viscosity properties. The design asphalt
content for SP-II and SP-III mixtures is 4.4% and 4.6% respectively (NMDOT
Specifications 2007). Laboratory testing to determine the binder content of SP-II
and SP-III mixtures is performed according to AASHTO T 308 standards with the
results presented in Table 3.3. Once again, three samples of each HMA mixture
are tested and an average percentage of binder content is presented. Results show
that the SP-II and SP-III mixtures contain 4.3% and 4.5% respectively.
3.3 Sample Preparation
In the early stages of sample preparation, there are some major concerns in
achieving target density of HMA beam specimens which are highlighted and
discussed below. The dimensions of the HMA beam samples used in FEL
laboratory testing are approximately 380 mm x 65 mm x 50 mm (15″ x 2.5″ x 2″).
Samples are compacted to dimensions slightly greater than those shown above

52
using an asphalt beam compactor (due to mold size). In terms of heating and
transferring the HMA mixtures, AASHTO T312 standards are followed. HMA
mixtures are heated to 150°C for no more than one hour and are then compacted
using a GCTS beam compactor, shown in Figure 3.3. HMA beam samples are
compacted using a sinusoidal loading of 80 kN at a frequency of 1 Hz until they
reached the specified density (2 in. height). Sample density is determined
following AASHTO T 269 standards. There are currently no AASHTO standards
for HMA beam compaction so a lot of time is spent adjusting compaction
methods in order to achieve the target density. However, the target density of
94.5±0.5% is not achieved with the percentage air voids varying from 9 to 12 %.
The problem of high air voids in specimens lay with the compaction method
which is inadequate. Reasons for this may be due to absence of kneading action
during the compaction process which provides a better compaction without
fracturing the aggregate. However, these issues are resolved with the acquisition
of a new linear kneading compactor. Once installed, the target density of
94.5±0.5% for both SP-II and SP-III mixtures is achievable. The compaction
method is very similar to what is used in the field. Figure 3.4 shows the linear
compactor used by the UNM research team. The compactor is very impressive in
terms of size and is made primarily of stainless steel and 1045 steel for rugged
functionality. The compactor is driven by a hydraulic unit located next to the
compactor which is also shown in Figure 3.4.

53
The compactor is capable of fabricating two test specimens (18″ x 6″ x 3″) in less
than five minutes. Figure 3.5 shows freshly compacted HMA mixtures within the
heated molds and those which have been previously compacted.
3.4 HMA Sample Cutting
Once cooled, the compacted HMA specimens are then cut into two beams (15″ x
2.5″ x 2.0″) using a GCTS stone-cutting saw, as shown in Figure 3.6. The stone-
cutting saw originally did not come with a clamp which is suitable for cutting
beam specimens. So the UNM research team enlisted the help of David Woods
who is a prototype machinist from the Department of Mechanical Engineering,
UNM. With his help, a new clamp assembly is designed to enable safe and precise
cutting of the compacted beams.
3.5 Specimen Volumetric Proportions
The theoretical maximum specific gravity (Gmm) of the loose HMA mixtures is
determined by using the AASHTO T 209 standards and the results are shown in
Table 3.4. The Gmm at design AC for SP-II and SP-III mixtures is typically 2.439
and 2.430 respectively (NMDOT Specifications 2007). Three samples of each
HMA mixture are tested. Table 3.4 shows that the average Gmm for SP-II and SP-
III mixtures is 2.401 and 2.420 respectively.

54
Bulk specific gravity (Gmb) testing is performed on HMA beam samples
according to AASHTO T 269 standards. NMDOT specifications for HMA
percent air voids (AV) call for the Gmb to be between 5 to 6%.
3.6 Sample Conditioning
Prior to laboratory fatigue testing, the HMA beam samples are conditioned to
simulate short-term aging in the field. Short-term aging of the HMA mixtures is
considered during the compaction process whereby loose HMA mixtures are
exposed to 163°C for one hour prior to compaction. Once cooled, the beam
samples are cut to the dimensions specified earlier. Each sample is then
conditioned to test temperature, 20°C, using an environmental test chamber for 2
hours. Figure 3.7 presents the environmental chamber where sample conditioning
is conducted.
3.7 Four Point Bending Beam Fatigue Test
This study applies the traditional approach to fatigue analysis of asphalt concrete
in accordance with the AASHTO T 321-07 Standards. This approach consists of
relating stress (strain) to the number of load repetitions to failure and is described
using Wohler Curves. In addition to this, the energy approach is utilized, which
defines fatigue life as a function of dissipated energy change with each loading
cycle. This is called the Plateau Value approach, as described earlier in Section
2.5.

55
Cyclic loading using continuous controlled strain is applied to an asphalt concrete
beam sample until it fails, where both the critical strain and the number of cycles
to failure data is recorded. Figure 3.8 presents the beam fatigue apparatus.
Loading is done using a sinusoidal waveform at a frequency of 10 Hz at a fixed
temperature of 20°C. Two replicate samples are tested at each strain level. Cyclic
loading of the beam sample induces tension in the bottom section where
microcracking and subsequent macrocracking will propagate to the top of the
beam. This behavior in essence simulates field fatigue cracking due to traffic
loading. Fatigue testing is conducted at stain levels varying from 400–1200 με,
from which a ε-N relationship is developed, in the form of Eq. 2.4.
Although much has been said about the benefits of including rest periods in
fatigue testing, this study did not consider this option due to the additional time
required. Rather testing is performed at 10 Hz which simulates traffic speed of 60
mph, similar to what is expected on New Mexico’s highways. The time recorded
to run each test varied from two hours (high strain) to one month (low strain).
3.8 Selected Mode of Cyclic Loading
Controlled strain mode of loading is selected for this study because it best
represents the type of loading experienced by thin pavement layers (2-3 inches).
Thin asphalt pavement layers are not the main load-carrying components and the
strain in the asphalt layer is governed by the underlying layers, and is not affected
by the reduction in asphalt stiffness. Therefore, this creates a constant strain mode

56
of loading. The SHRP A003-A project, evaluated various laboratory fatigue test
methods of asphalt concrete, and stated that unless thick pavements sections are
being considered (4-8 inches), controlled strain mode should be used for all
fatigue testing (Tangella et al. 1990, Tayebali et al. 1992). For thicker pavements,
the asphalt layer is the main load-carrying component and as the asphalt material
stiffness reduces, the changes in stress are not significant, which leads to a
constant stress mode of loading.
In addition, field fatigue cracking is usually determined by calculating expected
strains at the base of the pavement, which means the performance of thick
pavements can be determined by constant strains test (Tayebali et al. 1992,
Prowell et al. 2010). Finally, perpetual pavements usually contain a thin HMA
layer which is placed at the bottom of the section designed especially to resist
fatigue cracking. More about perpetual pavements can be found in Appendix A.
3.9 Data Acquisition and Analysis
Laboratory fatigue testing is controlled using GCTS software and fatigue test data
is recorded using a GCTS data acquisition system. From this system, test results
featuring the stiffness reduction, dissipated energy, Energy Ratio, and applied
strain plots are generated.

57
Table 3.1 Aggregate Gradation for SP-II Mixture
SIEVE SIZE
NMDOT Specification
SP-II PERCENT Passing
(mm)
Lower
Limit (%)
Upper
Limit (%)
Sample
A
Sample
B
Sample
C
2.0″ 50.8 100 100 100.00 100.00 100.00
1.5″ 38.1 100 100 100.00 100.00 100.00
1.0″ 25.4 90 100 97.32 92.18 100.00
3/4″ 19 - 90 83.67 87.75 87.98
1/2″ 12.7 - - 58.46 66.70 64.64
3/8″ 9.51 - - 50.27 56.92 54.50
#4 4.76 - - 33.40 35.82 34.02
#8 2.38 19 45 20.43 21.94 20.81
#16 1.19 - - 13.75 14.49 13.75
#30 0.595 - - 9.26 9.59 9.16
#50 0.297 - - 5.95 5.87 5.66
#100 0.149 - - 3.36 3.03 2.91
#200 0.075 1 7 1.90 1.40 1.35

58
Table 3.2 Aggregate Gradation for SP-III Mixture
SIEVE SIZE
NMDOT Specification
SP-III PERCENT Passing
(mm)
Lower
Limit (%)
Upper
Limit (%)
Sample
A
Sample
B
Sample
C
2.0″ 50.8 100 100 100.00 100.00 100.00
1.5″ 38.1 100 100 100.00 100.00 100.00
1.0″ 25.4 100 100 100.00 100.00 100.00
3/4″ 19 90 100 95.83 93.58 93.65
1/2″ 12.7 - 90 72.11 81.56 70.42
3/8″ 9.51 - - 61.95 62.25 60.78
#4 4.76 - - 34.78 34.08 34.70
#8 2.38 23 49 25.15 25.52 25.59
#16 1.19 - - 18.21 18.28 19.05
#30 0.595 - - 7.90 9.55 8.73
#50 0.297 - - 5.82 6.01 5.53
#100 0.149 - - 4.44 4.34 4.15
#200 0.075 2 8 3.03 3.75 3.75

59
Table 3.3 Asphalt Binder Content for NMDOT SP-II and SP-III Mixtures
Asphalt Binder
Content
Sample
A
Sample
B
Sample
C Average
SP-II 4.13 4.76 4.26 4.38
SP-III 4.29 4.63 4.52 4.48

60
Table 3.4 Theoretical Maximum Specific Gravity of SP-II and SP-III Mixtures
Max. Theoretical
Sp. Gravity (Gmm)
Sample
A
Sample
B
Sample
C Average
SP-II 2.416 2.386 2.401 2.401
SP-III 2.414 2.415 2.432 2.420

61
Figure 3.1 Aggregate Gradations for Superpave SP-II and SP-III Mixtures
0
20
40
60
80
100
Per
cent
Pas
sing
Sieve Size^0.45
SP-II Mix
SP-III Mix
#200 #8 #4 3/8 in 1/2 in 3/4 in 1 in 1.5 in 2 in
1″ Max
density line
3/4″ Max
density line

62
Figure 3.3 Loading Frame and Sample Mold for Beam Compaction
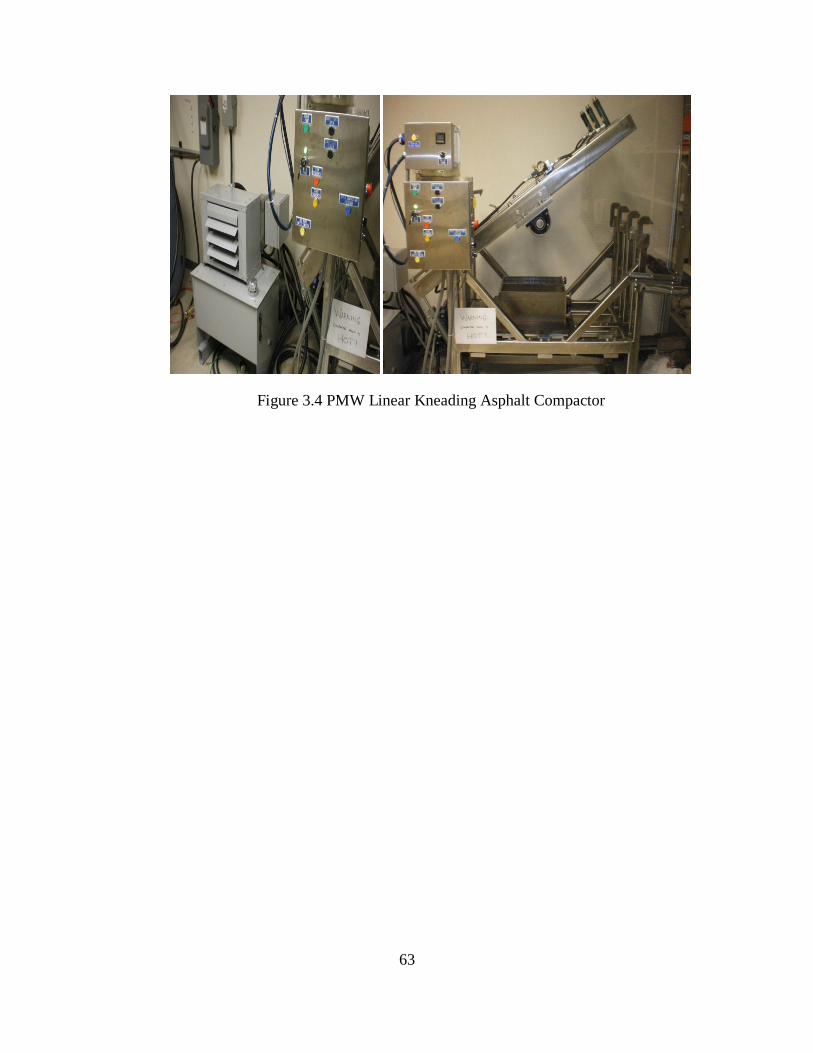
63
Figure 3.4 PMW Linear Kneading Asphalt Compactor

64
Figure 3.5 HMA Beam Samples Compacted by Linear Kneading Compactor

65
Figure 3.6 Stone Cutting Saw with Modified Clamp

66
Figure 3.7 Environmental Chamber and Beam Fatigue Apparatus

67
Figure 3.8 Beam Fatigue Apparatus

68
CHAPTER IV
FATIGUE TEST RESULTS AND ANALYSIS
4.1 Introduction
In this section, laboratory fatigue test results of four HMA mixtures are presented
and analyzed. These test results are presented in terms of applied strain amplitude,
initial flexural stiffness (psi), percent air voids, and the number of cycles to
failure. As stated earlier, fatigue failure is presented using two stiffness-based
approaches; number of cycles to attain 50% reduction in stiffness (Nf50), and
number of cycles at peak Energy Ratio (Nf(ER)). The Energy Ratio curve is
obtained by multiplying stiffness ratio by corresponding cycle number.
Laboratory fatigue testing is performed at normal strain amplitudes (600-1200 με)
and at low strain amplitudes (200-400 με). Although this study discusses ‘normal
and low strain’ in terms of applied amplitude, these terms are actually referring to
the levels of fatigue damage. Low strain usually refers to low damage
accumulation whereas normal strain refers to high damage accumulation. In this
case, low strain usually ranges from 200-400 με. However, there are some fatigue
test results in this study that show high fatigue damage at 400 με.
If the stiffness reduces by 50% as the number of cycles increases, sample is
considered failed. Samples which did not fail during testing are analyzed using
extrapolation techniques, to determine their fatigue life. The extrapolation

69
techniques used for this analysis are the single-stage Weibull function, and the
RDEC approach. Previous studies have recommended these techniques in
providing good results for extrapolating fatigue life data from low strain fatigue
testing (Prowell et al. 2008).
4.2 Objective
The objective of this study is to determine the FEL of New Mexico’s HMA
mixtures by laboratory testing. In addition, two analytical models are used to
estimate the FEL: the Plateau Value approach and the phenomenological
approach. The estimated FEL values produced from these two models are
compared to those estimated by stiffness-based fatigue failure criteria: traditional
Nf50 and Energy Ratio (ER) criteria. In addition, the effect of binder’s
performance grade (PG) on the estimated FEL of the four HMA mixtures is also
investigated.
4.3 Test Matrix
Table 4.1 presents a test matrix describing laboratory fatigue test parameters for
this study. Two different mixture types are tested; SP-II and SP-III mixtures, and
these mix types are prepared in the laboratory as well as collected from the field.
Field SP-II mixture is designed with PG 64-22 binder, while laboratory SP-II
mixture is designed with PG 70-22. For the SP-III mixture, the field design
contains PG 70-22. However, laboratory SP-III mixture contains PG 64-22

70
binder. The applied strain amplitude varies from 400 to 1200 με while the percent
air voids varies from 5 to 6%.
4.4 Laboratory Fatigue Test Results
Table 4.2 presents laboratory fatigue test results for field-collected HMA
mixtures. An alternative Beam ID is shown which represents the mix-type (SP-II
or SP-III), the source of the material (F=field, or L=laboratory), replicate sample
notation (S1, S2, S3 etc.), and the percent air voids. To prevent confusion with
sample referencing, the original Beam ID is also provided. Samples that did not
meet the percent air voids target criteria are not considered for further FEL
analysis. The PG binder grade used for each mix type is also shown, along with
the initial stiffness. The fatigue failure criteria listed in Table 4.2 includes
traditional Nf50 and ER criteria. Figure 4.1 presents stiffness-based failure curves
of an SP-II sample, SP-II-N1. The left and right axis describes the stiffness ratio
and Energy Ratio behavior with increasing cycles, respectively. SP-II-N1 is tested
at 1000 με where failure is recorded at 1,085 cycles and at 1,249 cycles, according
to Nf50 and Nf(ER) failure criteria, which is highlighted in Figure 4.1.
Table 4.3 presents laboratory fatigue test results for two HMA mixtures which are
prepared in the laboratory. As stated earlier, the only difference between the field
and laboratory mixes (SP-II or SP-III) is the binder grade. The respective
aggregate gradation and binder content remain the same for both SP-II and SP-III
71
mixes. Similar to the field mixture fatigue results, the fatigue life of the laboratory
HMA mixtures is presented using Nf50 and Nf(ER) failure criteria.
4.5 Analysis of Laboratory Data
Individual fatigue life results (Nf50 and Nf(ER)) show considerable variation. For
example, SP-II sample N2 has a much lower fatigue life than its replicate, sample
A1, and the same can be said again for SP-II samples A1 and M2, even though all
three are tested under the same conditions and load. One would attribute to testing
three samples can take care of this issue. Figure 4.2 illustrates the varying
stiffness reduction rates for these SP-II samples. This may be attributed to the
effect of percent air voids, as it can be seen that the fatigue life of these three
samples increases as the percent air voids increases. However, this theory does
not hold true when looking at the fatigue life data of SP-III samples J1, M2, and
F2 (three replicates). These replicate SP-III samples are each tested at 800 με yet
their associated fatigue life did not follow the same trend as shown earlier for the
SP-II samples. SP-III-M2 had the highest percent air voids of the replicate
samples, yet showed a similar fatigue life to SP-III-J1, and much lower fatigue
life than SP-III-F2. Due to complex nature of fatigue crack initiation and
propagation, replicate samples of similar air voids did not show similar behavior
due to density gradient that exists in samples. A more in-depth analysis of the
fatigue life of these HMA samples is required and this is shown in Chapter 6. The
average fatigue life of replicate samples decreases as the strain amplitude
increases, with the exception of SP-II samples, K1 and K2, which did not meet

72
the target air voids criteria. Finally, there is no apparent trend from Table 4.2 that
indicates high initial stiffness has an effect on the associated fatigue life. SP-II
sample stiffness varied from 470 to 900 ksi and SP-III sample stiffness varied
from 300 to 600 ksi.
In terms of laboratory fatigue life data, Table 4.3 shows a similar trend to what is
observed in field HMA mixtures. The majority of the results show replicate
samples with lower percent air voids have lower fatigue life. That being said, SP-
III samples SP-III-4B and SP-III-10A show the opposite behavior, albeit with
percent air voids that are slightly higher the target criteria. SP-II sample stiffness
varied from 480 to 830 ksi and for the SP-III samples, initial stiffness varied from
520 to 1000 ksi. Once again, no apparent trend could be seen which suggests that
variation in stiffness affects the fatigue life of replicate samples.
Figure 4.3 compares the average fatigue life of field-collected mixtures with
laboratory prepared mixtures tested at varying strain amplitudes (Nf50 results
only). It can be seen here that the SP-II samples show similar results, as shown in
Figure 4.3(a). For the SP-III mixture, Figure 4.3(b) shows that the fatigue life of
the laboratory prepared samples is slightly lower than that shown for the field
samples. Mixture variables for laboratory prepared SP-III specimens are identical
to those shown in field collected SP-III materials except for the PG binder grade.
Laboratory prepared mixtures contained neat PG 64-22 binder, whereas field
mixtures used modified PG 70-22. Therefore, the difference in observed fatigue

73
lives may be attributed to change in PG binder. More discussion on the effect of
PG binder on fatigue life of HMA mixtures is shown in Section 4.8.
4.6 Extrapolation of Fatigue Life
Low strain fatigue testing (70 – 500 με) may often lead to an unreasonable
number of loading cycles without ever achieving failure. In order to confirm the
existence of the endurance limit, fatigue test data from low strain testing needs to
be extrapolated to predict a failure point. Table 4.4 shows extrapolated fatigue
failure for failed samples as well as those which have not failed. SP-II and SP-III
mixtures both contained samples which did not fail; SP-II-L2 and SP-III-B1. For
the SP-II sample (SP-II-L2), approximately 8.5 million cycles are run yet the
initial stiffness only reduced by 30%. Therefore, the fatigue life is extrapolated
using the single-stage Weibull function and the RDEC approach, and the
estimated fatigue life is 81.5 million cycles and 102.5 million respectively. Figure
4.4 presents the fatigue curve of SP-II-L2 fitted to the single-stage Weibull
function.
SP-III sample, SP-III-B1, yielded a 20% reduction in stiffness after 3.5 million
cycles. The fatigue life is extrapolated using the single-stage Weibull function and
the RDCE approach, showing an estimated fatigue life of 1.46e09 cycles and
4.81e19 cycles respectively. Although there is no failed fatigue test data to
confirm these fatigue lives, the estimated values are extremely high. In order to
determine whether these two extrapolation techniques provide reasonable

74
predictions, fatigue life of failed samples is also predicted. Figure 4.5 compares
predicted fatigue life of SP-II samples with the fatigue life recorded from
laboratory testing using both extrapolation techniques. It can be seen here that
there is good consistency between the predicted and laboratory tested fatigue life,
especially for the tradition Nf50 criterion. For the SP-III samples, Figure 4.6 also
shows good consistency, more so for the single-stage Weibull function, whereas
the RDEC approach seems to overestimate the fatigue life.
4.6.1 The Effect of Applied Strain on Fatigue Life
The applied strain amplitude plays a vital role in the fatigue life of asphalt
concrete. Figure 4.7 shows flexural stiffness vs. initial number of loading cycles
for both SP-II and SP-III mixtures tested under increasing strain levels. Figure
4.7(a) shows that even though SP-II samples SP-II-M2 and SP-II-L1 have the
same initial stiffness, the fatigue damage rate is much different due to the
difference in strain amplitude with sample SP-II-L1 showing a greater reduction
in stiffness. The same can be said for SP-III mixtures as shown in Figure 4.7(b).
SP-III-E2 has a much higher rate of fatigue damage in the initial cycles, than SP-
III-F2. However, as the loading cycles continue the rate of fatigue damage rate
reduces where the fatigue curves of both SP-III-E2 and SP-III-F2 show similar
stiffness reduction rates. However, sample SP-III-E2 is close to failure as it
approaching 50% of its initial stiffness, whereas sample SP-III-F2 will not fail for
another 100,000 cycles.

75
Figure 4.8 also shows strain amplitude vs. the fatigue life curves (ε-Nf) of SP-II
mixture. As the tensile strain is reduced, the number of cycles to failure increased,
exhibiting an asymptotic curve. This behavior is indicative of FEL, which
suggests that below a specific strain level, a material can experience infinite
loading cycles without accumulating damage. Figure 4.8(a) features log-log plots
of ε-Nf curves fitted to both failure criteria using the power series, where both
curves exhibit similar fatigue behavior of SP-II mixtures. The traditional approach
(Nf50) showing a slightly better fit than that of Rowe’s stiffness ratio approach.
The same can be said of Figure 4.9(a), where the fatigue curves of the SP-III
mixture are almost identical. It must be noted that even though the two different
failure criteria provided similar results, the Energy Ratio approach showed
samples failing long after they had exceeded the 50% stiffness reduction. Figure
9(b) illustrates the asymptotic behavior of the SP-III mix fatigue curve as the
applied strain reduces.
4.7 Fatigue Endurance Limit Prediction
The fatigue endurance limit of SP-II and SP-III mixtures is determined using two
different approaches: (i) the strain amplitude-fatigue life (ε-N) approach, and (ii)
the RDEC approach. The ε-N approach is considered the traditional approach to
determining the FEL which is equivalent to 50 million cycles. The RDEC
approach applies the unique PV-Nf relationship where the strain amplitude which
yields a PV equivalent to a fatigue life of 50 million cycles is deemed the FEL.

76
4.7.1 FEL Prediction Using the ε-Nf Method
Plots (log-log) of applied strain levels versus the number cycles to failure (ε-Nf) of
field SP-II and SP-III mixtures are shown in Figure 4.8 and Figure 4.9. Research
has shown that the log-log transformation of the data from tests conducted at
normal strain levels (above the endurance limit) produce a straight line (Prowell et
al. 2010). A fatigue life of 50 million cycles is used to predict the micro-strain
level which is equivalent to the fatigue endurance limit. Using Eq. 4.1, and the
FEL is determined.
(4.1)
where and are regression coefficients, and N = 50 million cycles.
Using the ε-Nf models, the strain which is equivalent to a fatigue life of 50 million
cycles is determined. For the field SP-II mixtures, a FEL of 195 με is predicted
using Nf50 criterion and 231 με using ER failure criterion. These FEL values are
reasonable considering that fatigue testing of SP-II-L2 sample at 200 με provided
an extremely high number of cycles which required extrapolation to determine
failure. Furthermore, the FEL values shown for the SP-II mixture in this study are
similar to what has been shown for HMA mixtures in previous studies (Prowell et
al. 2010).
In terms of the field SP-III mixtures, a FEL of 308 με is predicted using
traditional Nf50 criterion, and 313 με using the ER criterion. These values seem
high but not unreasonable. Due to the mixture variables, such as the use of a

77
modified binder and higher binder content, the FEL can be significantly different
from different mixtures. Some studies have shown that the presence of a modified
binder in HMA mixtures may improve fatigue resistance (Von Quintas 2004).
4.7.2 FEL Prediction Using the RDEC
In this study, the Ratio of Dissipated Energy Approach (RDEC) approach is used
to predict the FEL of HMA mixtures by determining the relationship between the
Plateau Value (PV) and the strain amplitude, which is not independent of mixture
or temperature. The PV-strain amplitude relationship allowed for the prediction of
the strain amplitude that yields a PV of 6.74e-09
i.e. Nf = 1.1e7 loading cycles,
which is the FEL.
(4.2)
where ε = strain amplitude, and and are regression coefficients (Carpenter and
Shen 2005, Underwood and Kim 2009).
Figure 4.10 presents the ε-PV curves for field SP-II and SP-III mixtures. It can be
seen here that the mixture with the lower PV corresponding to induced damage
for the same strain level has a longer fatigue life; which is the SP-III mixture. The
slopes of both curves are very similar which means that the change in percentage
of dissipated energy contributing to damage is similar for both mixtures. Using
the ε-PV model, the estimated FEL for the field SP-II mixture is 235 με (ER) and
222 με (Nf50). The FEL of the field SP-III mixture is estimated to be 311 με (ER)
and 341 με (Nf50).

78
Figure 4.11 presents the PV-Nf relationship for field SP-II and SP-III mixtures
and is fitted to a power model (solid line). The dotted line represents Carpenter
and Shen’s relationship which is fitted to the fatigue test data recorded from this
study, using Eq. 4.3, shown below.
PV = 0.4428 (Nf ) –1.1102
(4.3)
It can be seen here that both relationships are almost identical and follow a similar
trend. The PV corresponding to the FEL of 6.74e-09 is also plotted on Figure
4.11.
PV Prediction Model
The PV prediction model, which is initially described in Section 2.3.5, uses
material properties such as the flexural stiffness (E), Volumetric Parameter (VP),
and the Gradation Parameter (GP) are used to predict the PV. Eq. 4.4 presents the
PV model;
(4.4)
Where E = flexural stiffness, VP = Volumetric Parameter;
(4.5)
where AV = percent air voids, Vb = asphalt content by volume (Roberts et al.
1996),
(4.6)

79
Gmb = bulk density of HMA, Pac = percent asphalt content by weight, Gb = bulk
specific gravity of binder (1.019 for PG 64-22, and 1.020 for PG 70-22), GP =
Gradation Parameter,
(4.7)
PNMS = percent aggregate passing nominal maximum size sieve, (NMS is defined
as one sieve size greater than the first sieve to retain more than 10 percent of the
material), PPCS = percent aggregate passing primary control sieve (PCS =
NMS*0.22), and P200 = percent aggregate passing #200 sieve.
Table 4.6 shows predicted PV values for field SP-II and SP-III mixtures
respectively. PV values based on the predictive model (Eq. 4.4) are compared
with those measured from tests and Figure 4.12 shows good consistency, with
data points loosely following the line of equality but with some scattering.
Therefore, it can be said that the PV model is an alternative method to predict the
PV of HMA mixtures using only material properties and load/response
parameters.
Using this PV predictive model, the FEL is estimated using material properties
such as the flexural stiffness (E), Volumetric Parameter (VP), and the Gradation
Parameter (GP).
(4.8)

80
The estimated FEL from the PV model is then compared with FEL predictions
provided from the two previous models described in this study, the ε-Nf approach
and the ε-PV approach.
Using Eq. 4.8, FEL values of 160 με and 207 με are predicted for field SP-II and
SP-III mixtures respectively. Table 4.8 compares FEL values for SP-II and SP-II
mixtures predicted using the ε-Nf and ε-PV approaches, as well as those predicted
using the material properties (Eq. 7.4). It can be seen here that the FEL values
estimated using the PV model, are conservative when compared with the other
two approaches (ε-Nf and ε-PV), which is not a bad thing in terms of design
consideration.
4.8 The Effect of Polymer-Modified Binder on the FEL of HMA Mixtures
As shown in the literature search, there are very few studies about the effect of
polymer-modified binders on the FEL. This study performed fatigue testing on
four HMA mixture types with two different binder grades, PG 64-22 and PG 70-
22. Figure 4.13 presents ε-Nf curves describing the fatigue behavior of laboratory
SP-II mixture. A fatigue life of 50 million cycles is used to predict the strain level
which is equivalent to the FEL. From the relationships shown in Figure 4.13(a),
and using Eq. 4.1, the FEL of the laboratory SP-II mixture is estimated to be 150
με and 191 με, using traditional Nf50 criterion and Energy Ratio failure criterion
respectively. Figure 4.13(b) presents ε-Nf curves of the SP-II mixture without
using log-log scale where the estimated FEL using ER criterion is clearly higher

81
than the FEL using the Nf50 criterion. Figure 4.14 describes the ε-Nf curve of the
SP-III mixtures from which, the FEL is estimated to be 185 με (Nf50) and 202 με
(Nf(ER)).
From the above results, the addition of a modified binder, PG 70-22, to the SP-II
mixture, reduced the estimated FEL by 27%. For the SP-III mixture, the use of the
neat PG 64-22 binder saw a reduction in the estimated FEL by 30%.
Figure 4.15 presents ε-PV curves describing the fatigue behavior of both
laboratory prepared mix types. Once again, the PV of 6.74e-09 is used to estimate
the strain level which indicates FEL behavior. Using Eq. 4.2, the FEL of the
laboratory SP-II mixture is estimated to be 166 με (Nf50) and 213 με (Nf(ER)). For
the laboratory SP-III mixture, the FEL is estimated to be 182 με (Nf50) and 170 με
(Nf(ER)). The results show a similar trend to what is found earlier, using the ε-Nf
model. The addition of modified binder, PG 70-22, reduced the estimated FEL of
the laboratory SP-II mixture by 18%. The FEL of the SP-III mixture containing
neat PG 64-22 is almost half (44%) the estimated FEL of the field mixture.
4.9 Laboratory vs. Field Mixture
4.9.1 Fatigue Performance
This section summarizes the fatigue performance of laboratory mixtures and that
of field mixtures. Figure 4.16 compares the fatigue life of both laboratory and
field mixtures. Figure 4.16(a) shows data points loosely following the line of

82
unity which indicates similar fatigue life for the SP-II mixture. However, Figure
4.16(b) shows more scatter whereby the fatigue life of the field SP-III mixture
seems to be greater than that of the laboratory mixture.
Another way to analyze fatigue life of these mixtures is to compare their PV data.
As stated in the literature, the PV represents fatigue life and lower PV indicates
longer fatigue life. Figure 4.17 presents PV data for both laboratory and field SP-
II and SP-III mixtures. A similar trend to what is shown earlier is also seen here
with Figure 4.17(a) showing good consistency, indicating similar fatigue life for
laboratory and field mixtures. Figure 4.17(b) confirms the earlier observation that
the fatigue life of the field SP-III mixture is much longer than that of the
laboratory mixture with lower PV data indicating greater fatigue life.
4.9.2 Predicted FEL
The predicted FEL values for all four mix types are shown in Table 4.8. It can be
seen here that the FEL of laboratory mixtures is much lower than that of the field
mixes when looking at the ε-Nf and ε-PV results. However, the PV prediction
model shows an increased FEL for the laboratory SP-II mixture, suggesting that
the higher PG binder grade improves the estimated FEL. Figure 4.18 presents the
predicted FEL values for SP-II and SP-III mixtures using ε-Nf and ε-PV models.
It can be seen here that predicted FEL values of the laboratory and field SP-II
mixture are very similar for both models. However, there is a significant

83
difference between the predicted FEL values of the field SP-III mixture than those
shown for the laboratory SP-III mixture.
Table 4.9 summarizes the predicted FEL values of the SP-II and SP-III mixtures
(field and laboratory). It can be seen here that for the field mixes, the SP-III mix
shows higher estimated FEL values than the SP-II mix using both Nf50 and ER
failure criterion. This is largely due to the presence of a stiffer binder grade
(polymer-modified), smaller aggregate size (1″ NMS), and less stiffness as shown
by the dynamic modulus and relaxation modulus results. However, this is not the
case for the laboratory SP-II and SP-III mixes where similar estimated FEL values
are shown. This may be largely due to the larger size gradation in the SP-II
mixture whereby a stiffer binder grade such as PG 70-22 may not be as effective.
Due to its better fatigue performance and higher FEL values, this study
recommends using SP-III mixture with PG 70-22 binder grade in the base layer of
future asphalt concrete designs. SP-III mix FEL values can be inserted into the
MEPDG program whereby the percentage fatigue cracking can be predicted for
the design life. An improvement in predicted fatigue performance allows for
reduction in design AC layer thickness which is more cost-effective.
4.10 Statistical Analysis
Statistical analysis was done on the initial flexural stiffness results and the fatigue
life data of the SP-II and SP-III field mixtures. In addition, analysis is also

84
performed on SP-II and SP-III fatigue curves using different failure criteria to
determine if they are statistically similar.
4.10.1 Flexural Stiffness Data
Due to a large variation in initial flexural stiffness of test samples, additional
samples were prepared and tested under similar conditions. SP-II mixture
specimens were prepared with strict control on aggregate gradation using the
specifications presented in Chapter 3. The neat PG 64-22 binder is also used in
the mix design. Cyclic loading is applied for 500 cycles only with strain
amplitude varying from 50 to 200 με. In this way, sample stiffness can be
analyzed with minimal damage. The percent air voids varied between 3 to 5%.
Table 4.10 presents the testing parameters as well as the stiffness ratio results
after 500 cycles. It can be seen here that for samples tested from 50 to 150 με, a
slight increase in stiffness ratio is observed. This is most likely due to strain
hardening during the initial load cycles before sample stabilizes. For samples
tested at 200 με, a slight decrease in stiffness ratio is observed due to damage.
Figure 4.19 presents the stiffness ratio results after 500 cycles. It can be clearly
seen that samples with different percent air voids show similar stiffness.
Therefore, it is concluded that even with stricter control on aggregate gradation
during the mix design process, it is extremely difficult to achieve identical
stiffness with samples compacted to similar density.

85
4.10.2 Fatigue Life Data
Replicate samples with large variations in fatigue life data are further analyzed in
this section. Based on recommendations made in the NCHRP Project 646,
samples which showed a difference between log of the fatigue life greater than
0.69, were not considered for further FEL analysis (Prowell et al. 2010).
4.10.3 Fatigue Results Using Nf50 and ER Criteria
To determine whether two fatigue curves using the traditional (Nf50) and Energy
Ratio (ER) approaches, from different mixtures are statistically the same, the F-
Test is introduced. The hypothesis, Ho, states that the two failure curves are the
same, and Ha states that two curves are different. Ho is rejected if the p-value is
less than = 0.05. The p-value is the level of significance, which is defined as the
probability of obtaining a value of the test statistic that is more likely to reject Ho
than the actual observed value of the test statistic. This probability is computed
assuming that the null hypothesis is true. Thus, if the p-value is a small value,
then the sample data fail to support Ho, and the decision is to reject Ho (Ott 2001).
The F-test is performed on the ε-Nf and PV-ε curves for both SP-II and SP-III
mixtures which are shown in Figures 4.7 through 4.9 using Eq. 4.9.
(4.9)
where SSE1 is the error sum of squares for Regression Curve 1 (Nf50), SSE2 is the
error sum of squares for Regression Curve 2 (ER), SSE(R) is the combined

86
regression curve from both mixtures, df(F) is the total degrees of freedom df1 +
df2, and df(R) is the degree of freedom for the combined regression curve.
The p-value is determined using the Excel function of F probability distribution
for the two data sets (FDIST):
(4.10)
where dfa = df(R) − df(F ), and dfb = df(F ).
For ε-N regression curves through power law, the p-values for SP-II and SP-III
mixtures are 7.21e-26 and 0.995 respectively. Because the p-value is greater than
α = 0.05 for the SP-III mixture, the Ho hypothesis is not rejected and it is
concluded that the two fatigue curves are statistically the same. However, for the
SP-II mixture, the p-value is less than 0.05 which means that the two fatigue
curves are different. For PV-ε regression curves through power law, the p-values
for SP-II and SP-III mixtures are 0.998 and 0.306 respectively. Because the p-
values are greater than α = 0.05 for both mixtures, the Ho hypothesis is not
rejected and it is concluded that the two fatigue curves are statistically the same.
4.11 Conclusions
The key features of this study found as:
Majority of fatigue test results show that fatigue failure according to
the Energy Ratio criterion occurred after a sample has achieved 50%
reduction in stiffness, which is the traditional fatigue criterion.

87
Fatigue life extrapolation using the single-stage Weibull function and
RDEC approach showed good consistency with fatigue test results of
field SP-II and SP-III mixtures, performed at normal strain levels.
However, for low strain testing, extremely high fatigue life data is
predicted, which suggests that an overestimation of fatigue life.
Using the traditional ε-Nf relationship, the FEL values of field SP-II
and SP-III mixtures are predicted. The FEL of the SP-II mixture is
estimated to be 195 με, using traditional failure criterion (Nf50), and
231 με using the Energy Ratio failure criterion (ER). For the SP-III
mixture, the FEL is estimated to be 308 με (Nf50) and 313 με (ER).
Using the ε-PV approach, the FEL values of field SP-II and SP-III
mixtures are predicted. The FEL of the SP-II mixture is estimated to
be 235 με (ER) and 222 με (Nf50). For the SP-III mixture, the FEL is
estimated to be 311 με (ER) and 341 με (Nf50).
PV values predicted using the material property-based PV prediction
model showed good consistency with PV values determined from
laboratory testing. However, the estimated FEL values using the PV
model are much lower than those predicted using the ε-Nf and ε-PV
models.
The effect of polymer modified binder on the FEL of HMA mixtures
showed mixed results, with an increase in estimated FEL of SP-III
mixture, but reducing the estimated FEL of SP-II mixture.

88
The estimated FEL of laboratory mixtures is much lower than that of
the field mixes. In particular, the fatigue performance of laboratory
SP-II mixtures compares well with that of field SP-II mixtures.
However, the laboratory SP-III mixture performs poorly when
compared with fatigue performance of the field SP-III mixture.
The F-test is performed on the ε-Nf and PV-ε curves to determine
whether the curves developed using the traditional (Nf50) and Energy
Ratio (ER) approaches are statistically the same. For ε-N regression
curves through power law, it is determined that the two fatigue curves
are statistically the same for the SP-III mixture. However, the opposite
is the case for the SP-II fatigue curves. For the PV-ε curves, the F-Test
shows that the fatigue curves are statistically the same using the
different fatigue failure approaches.

89
Table 4.1 Test Matrix for Laboratory Fatigue Testing of SP-II and SP-III
Mixtures
HMA Mix
Type
PG
Binder
Applied
Strain (με)
% Air
Voids
SP-II 64-22,
70-22
400, 800,
1000, 1200 5-6
SP-III 64-22,
70-22
400, 800,
1000, 1200 5-6

90
Table 4.2 Laboratory Fatigue Test Results for Field SP-II and SP-III Mixtures
Alternative Beam ID
Beam
ID
Strain
εt (με)
PG
Binder
Stiffness
E0 (psi)
% Air
Voids
Failure Criteria Avg. Cycles to Failure
Nf50 Nf(ER) Nf50 Nf(ER)
SP-II MIXTURE
SPII-F-400-S1-5.2% N2 400 64-22 646,000 5.2 79,008 69,069
355,377 469,631 SPII-F-400-S2-5.4% A1 400 64-22 880,310 5.4 263,411 239,818
SPII-F-400-S3-5.9% M2 400 64-22 666,158 5.9 723,711 1,100,007
SPII-F-800-S1-5.1% I2 800 64-22 471,000 5.1 11,700 10,910 11,100 45,662
SPII-F-800-S2-5.8% L1 800 64-22 655,716 5.8 10,500 80,412
SPII-F-1000-S1-4.8% N1 1000 64-22 853,302 4.8 1,085 1249 2,795 5,795
SPII-F-1000-S2-5.7% O2 1000 64-22 531,200 5.7 4,504 10,341
SPII-F-1200-S3-3.5% K1 1000 64-22 908,661 3.5 1,684 1,547 8,155 7,288
SPII-F-1200-S4-3.0% K2 1000 64-22 850,501 3.0 14,625 13,029
SPII-F-1200-S1-4.7% E1 1200 64-22 680,645 4.7 1,879 4651 1,108 2,599
SPII-F-1200-S2-4.9% J2 1200 64-22 711,640 4.9 337 547
SP-III MIXTURE
SPIII-F-400-S1-4.9% B1 400 70-22 537,945 4.9 NA NA NA NA
SPIII-F-600-S1-4.9% C2 600 70-22 557,499 4.9 770,008 748,820 770,008 748,820
SPIII-F-800-S1-4.7% J1 800 70-22 455,466 4.7 38001 52,926
71,001 174,289 SPIII-F-800-S2-5.9% M2 800 70-22 415,678 5.9 42,001 46,826
SPIII-F-800-S3-5.0% F2 800 70-22 402,190 5.0 114,001 148,576
SPIII-F-800-S4-3.7% I1 800 70-22 275,282 3.7 90,001 448,826
SPIII-F-1000-S1-4.8% B2 1000 70-22 433,644 4.8 29,801 35,276 25,201 30,276
SPIII-F-1000-S2-4.8% P1 1000 70-22 582,762 4.8 20,601 25,276
SPIII-F-1200-S1-5.0% P2 1200 70-22 485,731 5.0 6,476 7,551 8,026 22,149
SPIII-F-1200-S2-5.8% Q2 1200 70-22 451,938 5.8 9,576 34,551
SPIII-F-1200-S3-2.8% D1 1200 70-22 355,000 2.8 2050 4408 2,095 3,223
SPIII-F-1200-S4-3.0% D2 1200 70-22 300,000 3.0 2140 2038
Note: NA=no data available

91
Table 4.3 Fatigue Test Results of Laboratory Prepared SP-II and SP-III Mixtures
Alternative Beam ID
Beam
ID
Applied
εt (με)
PG
Binder
Stiffness
E0 (psi)
% Air
Voids
Failure Criteria Avg. Cycles to Failure
Nf50 Nf(ER) Nf50 Nf(ER)
SP-II MIXTURE
SPII-L-400-S1-4.3% 1A 400 70-22 732,504 4.3 71,618 56,907
237,877 544,477 SPII-L-400-S2-4.5% 1B 400 70-22 680,476 4.5 122,008 875,620
SPII-L-400-S3-5.1% 5B 400 70-22 834,120 5.1 520,004 700,904
SPII-L-800-S1-4.7% 2A 800 70-22 579,362 4.7 19,494 18,303 15,827 20,715
SPII-L-800-S2-4.5% 2B 800 70-22 476,521 4.5 12,160 23,127
SPII-L-1000-S1-5.1% 7A 1000 70-22 675,111 5.1 2,363 3,657 2,240 3,195
SPII-L-1000-S2-4.8% 7B 1000 70-22 707,020 4.8 2,117 2,733
SPII-L-1200-S1-5.0% 8A 1200 70-22 774,222 5.0 718 787 629 661
SPII-L-1200-S2-5.0% 8B 1200 70-22 697,054 5.0 539 535
SP-III MIXTURE
SPII-L-400-S1-4.8% 6A 400 64-22 1,040,810 4.8 146,711 131,514 387,008 442,215
SPII-L-400-S2-5.1% 6B 400 64-22 995,268 5.1 627,304 752,915
SPII-L-800-S1-5.0% 9A 800 64-22 676,177 5.0 2,300 2,869
7,576 6,581 SPIII-L-800-S2-6.3% 9B 800 64-22 709,450 6.3 2,422 3,243
SPIII-L-800-S3-6.0% 10B 800 64-22 661,054 6.0 18,006 13,631
SPIII-L-1000-S1-5.0% 8A 1000 64-22 581,865 5.0 7,200 22,685 6,569 17,666
SPIII-L-1000-S2-6.3% 8B 1000 64-22 522,036 6.3 5,937 12,647
SPIII-L-1200-S1-6.2% 4B 1200 64-22 610,473 6.2 4,205 3,642 2,558 2,451
SPIII-L-1200-S2-6.5% 10A 1200 64-22 592,931 6.5 910 1,260

92
Table 4.4 Extrapolated Fatigue Test Results for Field SP-II and SP-III Mixtures
Alternative Beam ID
Beam
ID
Applied
εt (με)
Stiffnes
E0 (psi)
% Air
Voids
Cycles
Tested
Extrapolated Cycles to Nf50 Failure Criteria
RDEC Weibull Nf50 Nf(ER)
SP-II MIXTURE
*SPII-F-200-S1-5.4% L2 200 954,638 5.4 8,479,090 102,493,275 81,486,025 91,989,6501
NA
SPII-F-400-S1-5.2% N2 400 646,000 5.2 79,008 77,779 86,600 79,008 69,069
SPII-F-400-S2-5.4% A1 400 880,310 5.4 389,811 222,502 220,900 263,411 239,818
SPII-F-400-S3-5.9% M2 400 666,158 5.9 723,711 877,612 1,335,000 723,711 1,100,007
SPII-F-800-S1-5.1% I2 800 471,000 5.1 11,700 11,510 11,940 11,700 10,910
SPII-F-800-S2-5.8% L1 800 655,716 5.8 90,000 25,097 20,650 10,500 80,412
SPII-F-1000-S1-4.8% N1 1000 853,302 4.8 2,665 1,486 860 1,085 1,249
SPII-F-1000-S2-5.7% O2 1000 531,200 5.7 17,256 4,797 4,642 4,504 10,341
SPII-F-1200-S1-3.5% K1 1000 908,661 3.5 13,148 1,788 2,073 1,684 1,547
SPII-F-1200-S2-3.0% K2 1000 850,501 3.0 18,046 871 407 14,625 13,029
SPII-F-1200-S3-4.7% E1 1200 680,645 4.7 6,553 1,964 625 1,879 4,651
SPII-F-1200-S4-4.9% J2 1200 711,640 4.9 1,542 13,697 24,690 337 547
SP-III MIXTURE
*SPIII-F-400-S1-4.9% B1 400 537,945 4.9 3,539,851 4.8E+19
1.5E+09 2.4E+191 NA
SPIII-F-600-S1-4.9% C2 600 557,499 4.9 833,560 89,727 1,110,000 770,008 748,820
SPIII-F-800-S1-4.8% J1 800 455,466 4.8 106,276 39,303 24,130 38001 52,926
SPIII-F-800-S2-5.9% M2 800 415,678 5.9 79,176 23,569 29,900 42,001 46,826
SPIII-F-800-S3-5.0% F2 800 402,190 5.0 150,000 129,567 71,250 114,001 148,576
SPIII-F-1000-S1-4.8% B2 1000 433,644 4.8 50,701 32,335 21,250 29,801 35,276
SPIII-F-1000-S2-4.8% P1 1000 582,762 4.8 40,901 20,832 13,110 20,601 25,276
SPIII-F-1200-S1-5.0% P2 1200 485,731 5.0 12,326 6,962 5,187 6,476 7,551
SPIII-F-1200-S2-5.8% Q2 1200 451,938 5.8 52,526 9,704 9,230 9,576 36,746
SPIII-F-1200-S3-2.8% D1 1200 355,000 2.8 13,949 2,159 2,115 2050 4408
SPIII-F-1200-S4-2.8% D2 1200 300,000 3.0 4,898 1,963 1,928 2140 2038
Note: NA = no data available, *Samples which did not fail, 1Results averaged using the RDEC and the Weibull Single-Stage approach.

93
Table 4.5 Control Sieves for Various Asphalt Mixes
Sieve Size
NMS
mm
(in.)
37.5
(1.5)
25
(1)
19
(0.75)
12.5
(0.5)
9.5
(0.375)
4.75
(#4)
PCS
mm
(in.)
9.5
(0.375)
4.75
(#4)
4.75
(#4)
2.36
(#8)
2.36
(#8)
1.18
(#16)
Note: NMS=Nominal Max Sieve Size, PCS=Primary Control Sieve

94
Table 4.6 Plateau Value Results for Field SP-II and SP-III Mixtures
Beam
ID
Applied
εt (με)
Initial E0
(psi)
% Air
Voids VP
Failure Criteria Plateau Values Predicted
Nf50 Nf(ER) PVf50 PVf(ER) PV
SP-II MIXTURE
N2 400 646,000 5.2 0.3305 79,008 69,069 8.3E-06 9.5E-06 5.2E-07
A1 400 880,310 5.4 0.3390 263,411 239,818 3.5E-07 3.8E-07 1.4E-06
M2 400 666,158 5.9 0.3591 723,711 1,100,007 7.2E-08 4.8E-08 6.6E-07
I2 800 471,000 5.1 0.3263 11,700 10,910 3.2E-05 3.4E-05 6.9E-06
L1 800 655,716 5.8 0.3551 10,500 80,412 1.4E-05 1.8E-06 2.2E-05
N1 1000 853,302 4.8 0.3131 1,085 1249 1.7E-04 1.4E-04 1.2E-04
O2 1000 531,200 5.7 0.3512 4,504 10,341 4.0E-05 1.7E-05 3.6E-05
E1 1200 680,645 4.7 0.3086 1,879 4,651 6.0E-05 2.5E-05 1.5E-04
J2 1200 711,640 4.9 0.3175 337 547 5.3E-04 3.5E-04 1.8E-04
K1 1200 908,661 3.5 0.2494 1,684 1,547 5.2E-05 5.7E-05 9.5E-05
K2 1200 850,501 3.0 0.2217 14,625 13,029 2.0E-05 2.2E-05 6.2E-05
SP-III MIXTURE
B1 400 537,945 4.9 0.3090 NA NA NA NA 2.60E-07
C2 600 557,499 4.9 0.3090 770,008 748,820 1.6E-07 1.7E-07 2.3E-06
J1 800 455,466 4.8 0.3002 38001 52,926 3.1E-06 2.2E-06 5.3E-06
M2 800 415,678 5.9 0.3500 42,001 46,826 3.5E-06 3.1E-06 5.3E-06
F2 800 402,190 5.0 0.3133 114,001 148,576 8.8E-07 6.7E-07 3.9E-06
B2 1000 433,644 4.8 0.3046 29,801 35,276 6.1E-06 5.2E-06 1.5E-05
P1 1000 582,762 4.8 0.3046 20,601 25,276 7.8E-06 6.4E-06 3.6E-05
P2 1200 485,731 5.0 0.3133 6,476 7,551 2.1E-05 1.8E-05 5.6E-05
Q2 1200 451,938 5.8 0.3461 9,576 36,746 1.4E-05 3.7E-06 5.4E-05
Note: VP = Volumetric Parameter, NA = no data available, 1Less than 6.74E-9 proposed by
Carpenter and Shen (2005) as indicative of long fatigue life.

95
Table 4.7 Plateau Values Results for Laboratory SP-II and SP-III Mixtures
Beam
ID
Applied
εt (με)
Initial E0
(psi)
% Air
Voids VP
Failure Criteria Plateau Values Predicted
Nf50 Nf(ER) PVf50 PVf(ER) PV
SP-II MIXTURE
1A 400 732,504 4.3 0.2914 71,618 56,907 1.2E-06 1.5E-06 6.0E-07
1B 400 680,476 4.5 0.3008 122,008 875,620 8.3E-07 1.2E-07 5.1E-07
5B 400 834,120 5.1 0.3402 520,004 700,904 2.0E-07 1.5E-07 1.2E-06
2A 800 579,362 4.7 0.3101 19,494 18,303 9.4E-06 1.0E-05 1.2E-05
2B 800 476,521 4.5 0.3008 12,160 23,127 1.6E-05 8.4E-06 6.2E-06
7A 1000 675,111 5.1 0.3278 2,363 3,657 9.1E-05 5.9E-05 6.4E-05
7B 1000 707,020 4.8 0.3146 2,117 2,733 1.6E-04 1.3E-04 6.9E-05
8A 1200 774,222 5.0 0.3235 718 787 4.2E-04 3.8E-04 2.4E-04
8B 1200 697,054 5.0 0.3235 539 535 3.4E-04 3.4E-04 1.8E-04
SP-III MIXTURE
6A 400 1,040,810 4.8 0.3044 146,711 131,514 6.0E-07 6.7E-07 1.8E-06
6B 400 995,268 5.1 0.3174 627,304 752,915 1.8E-07 1.5E-07 1.7E-06
9A 800 676,177 5.0 0.3131 2,300 2,869 1.2E-04 9.6E-05 1.9E-05
9B 800 709,450 6.3 0.3648 2,422 3,243 1.1E-04 8.3E-05 2.9E-05
10B 800 661,054 6.0 0.3536 18,006 13,631 8.5E-06 1.1E-05 2.2E-05
8A 1000 581,865 5.0 0.3131 7,200 22,685 2.5E-05 7.8E-06 3.7E-05
8B 1000 522,036 6.3 0.3648 5,937 12,647 4.6E-05 2.2E-05 3.6E-05
4B 1200 610,473 6.2 0.3609 4,205 3,642 1.0E-04 1.2E-04 1.4E-04
10A 1200 592,931 6.5 0.3721 910 1,260 1.1E-04 7.9E-05 1.4E-04
Note: VP = Volumetric Parameter

96
Table 4.8 Predicted FEL Values for SP-II and SP-III Mixes
Failure
Criteria
SP-II (64-22) SP-II (70-22)
ε-Nf ε-PV PV Model ε-Nf ε-PV PV Model
Nf50 195 222 160
171 209 171
Nf(ER) 231 235 218 268
SP-III (64-22) SP-III (70-22)
ε-Nf ε-PV PV Model ε-Nf ε-PV PV Model
Nf50 185 182 160
308 341 207
Nf(ER) 202 268 313 311

97
Table 4.9 Summary of FEL Performance of SP-II and SP-III Mixtures
PG Binder Grade
Predicted FEL Values (Nf50)
Mix Type SP-II SP-III
Mix Type SP-II SP-III
Field PG 64-22 PG 70-22
Field 1951/222
2 308
1/341
2
Laboratory PG 70-22 PG 64-22
Laboratory 1711/209
2 185
1/182
2
Note: 1=Nf50 failure criterion, and 2=ER
failure criterion
Predicted FEL Values
(ER)
Field Mixtures
Mix Type SP-II SP-III
SP-II SP-III
Field 2311/235
2 313
1/311
2
High E* Low E*
Laboratory 2181/268
2 202
1/268
2
High E(t) Low E(t)
Note: 1=Nf50 failure criterion, and 2=ER Note: E*=Dynamic Modulus,
failure criterion
E(t)=relaxation modulus

98
Table 4.10 Test Parameters and Results of SP-II (PG 64-22) Mixture
SP-II PG 64-22 % Air
Voids
Initial E0
(psi)
Initial E0
(MPa)
Applied
Strain (με)
Cycles
Tested
Stiffness
Reduction, % Beam ID
1A 2.6 1,233,225 8,505 50 500 102
1B 2.2 1,575,429 10,865 50 500 103
2A 4 1,099,080 7,580 150 500 100
2B 3.8 1,356,160 9,353 150 500 102
3A 4.1 1,073,744 7,405 200 500 95
3B 3.9 914,264 6,305 200 500 95
5A 4.6 1,028,389 7,092 100 500 101
5B 4.6 1,221,856 8,427 100 500 103

99
Figure 4.1 Variation of Stiffness Ratio and Energy Ratio with Number of Loading
Cycles of SP-II-N1 Sample
0
10000
20000
30000
40000
50000
60000
0
20
40
60
80
100
120
0 500 1000 1500 2000 2500 3000
Ener
gy R
atio
(%
)
Sti
ffness
Rat
io (
%)
Number of Loading Cycles, N
Stiffness Ratio (SR)
Energy Ratio (E*N)
Maximum ER
50% SR
Nf50 Nf(ER)

100
Figure 4.2. Stiffness Ratio Reduction Curves of Replicate SP-II Samples
0
20
40
60
80
100
120
140
0 100000 200000 300000 400000 500000 600000 700000
Sti
ffness
Rat
io,
E/E
0 (
%)
Number of Cycles to Failure, Nf
SP-II-A1
SP-II-N2
SP-II-M2

101
Figure 4.3(a) Comparison of Fatigue Life between Field and Laboratory SP-II
Mixtures
1
10
100
1,000
10,000
100,000
1,000,000
SP-II Field Mix SP-II Laboratory Mix
Num
ber
of
Cycl
es,
Nf
400 με
800 με
1000 με
1200 με

102
Figure 4.3(b) Comparison of Fatigue Life between Field and Laboratory SP-III
Mixtures
1
10
100
1,000
10,000
100,000
1,000,000
10,000,000
SP-III Field Mix SP-III Laboratory Mix
Num
ber
of
Cycl
es,
Nf
800 με
1000 με
1200 με
400 με

103
Figure 4.4 Fatigue Curve for SP-II Sample (L2) using Weibull Fuction
-5
-5
-4
-4
-3
-3
-2
-2
-1
-1
0
0 5 10 15 20
Ln(-
Ln(S
tiff
ness
Rat
io))
Ln(Cycles)
Sample L2 Linear (Sample L2)
y = 0.3237x - 6.263
R2 = 0.9211

104
(a) Single-Stage Weibull Function (b) RDEC Approach
Figure 4.5 Comparison of Extrapolated and Tested Fatigue Life Results of Field
SP-II Mixtures
1.E+00
1.E+01
1.E+02
1.E+03
1.E+04
1.E+05
1.E+06
1.E+07
1.E+00 1.E+02 1.E+04 1.E+06
Lo
g W
eibu
ll P
redic
ted N
f50
Log Fatigue Life from Tests, Nf
Nf50
Nf(ER)
1.E+00
1.E+01
1.E+02
1.E+03
1.E+04
1.E+05
1.E+06
1.E+07
1.E+00 1.E+02 1.E+04 1.E+06
Lo
g R
DE
C P
redic
ted N
f50
Log Fatigue Life from Tests, Nf
Nf50
Nf(ER)

105
(a) Single-Stage Weibull Function (b) RDEC Approach
Figure 4.6 Comparison of Extrapolated and Tested Fatigue Results of Field SP-III
Mixtures
1.E+00
1.E+01
1.E+02
1.E+03
1.E+04
1.E+05
1.E+06
1.E+07
1.E+00 1.E+02 1.E+04 1.E+06
Lo
g W
eibu
ll P
redic
ted N
f50
Log Fatigue Life from Tests, Nf
Nf50
Nf(ER)
1.E+00
1.E+01
1.E+02
1.E+03
1.E+04
1.E+05
1.E+06
1.E+07
1.E+00 1.E+02 1.E+04 1.E+06
Lo
g R
DE
C P
redic
ted N
f50
Log Fatigue Life from Tests, Nf
Nf50
Nf(ER)

106
Figure 4.7(a) Flexural Stiffness vs. Loading Cycles for Field SP-II Mixtures

107
Figure 4.7(b) Flexural Stiffness vs. Loading Cycles for Field SP-III Mixtures

108
(a) Log-log Plot
(b) Regular Plot
Figure 4.8 ε-Nf Curve for Field SP-II Mixtures
y = 3506x-0.163
R² = 0.9355
y = 3543.1x-0.154
R² = 0.8157
10
100
1000
10000
1.00E+00 1.00E+02 1.00E+04 1.00E+06 1.00E+08
Lo
g A
ppli
ed S
trai
n (
με)
Log Number of Cycles, Nf
Nf50 Nf(ER) RDEC Predicted Weibull Predicted Power (Nf50 ) Power (RDEC Predicted)
0
200
400
600
800
1000
1200
0 200000 400000 600000 800000 1000000 1200000
Lo
g A
pplied
Str
ain (
με)
Log Number of Cycles, Nf
Nf50 Nf(ER)
Power (Nf50 ) Power (Nf(ER))

109
(a) Log-log Plot
(b) Regular Plot
y = 4403.6x-0.15
R² = 0.8976
y = 4892.2x-0.155
R² = 0.783
1
10
100
1000
10000
100000
1000 10000 100000 1000000
Lo
g A
ppli
ed S
trai
n,
με
Log Number of Cycles to Failure, Nf50
Nf50 Nf(ER) Power (Nf50) Power (Nf(ER))
y = 4403.6x-0.15
R² = 0.8976
y = 4892.2x-0.155
R² = 0.783
0
200
400
600
800
1000
1200
1400
1 200001 400001 600001 800001 1000001
Applied
Str
ain,
με
Number of Cycles to Failure, Nf50
Nf50 Nf(ER) Power (Nf50) Power (Nf(ER))

110
Figure 4.9 ε-Nf Curve for Field SP-III Mixtures
Figure 4.10 Plateau Value vs. Strain Amplitude for Field SP-II and SP-III
Mixtures
y = 1E-22x5.895
R² = 0.9669
y = 5E-25x6.3683
R² = 0.8972
1.E-09
1.E-08
1.E-07
1.E-06
1.E-05
1.E-04
1.E-03
1.E-02
100 1000 10000
Lo
g P
late
au V
alue,
PV
Log Applied Strain, με
SP-II Mix SP-III Mix PV (FEL) Power (SP-II Mix) Power (SP-III Mix)
PVFEL = 6.74E-09
Fatigue Endurance Limit

111
Figure 4.11 Plateau Value vs. Cycles to Failure for Field SP-II and SP-III
Mixtures
y = 0.3161x-1.078
R² = 0.9991
y = 0.4428x-1.11
R² = 1
1.E-22
1.E-20
1.E-18
1.E-16
1.E-14
1.E-12
1.E-10
1.E-08
1.E-06
1.E-04
1.E-02
1.E+00
100 100000 100000000 1E+11 1E+14 1E+17 1E+20
Pla
teau
Val
ue,
lo
g
Number of Cycles, log Nf50
SP-II Mixtures SP-III Mixtures PV (FEL) Power (Carpenter and Shen)
PVFEL = 6.74E-09
Fatigue Endurance Limit

112
(a) SP-II Mixture (b) SP-III Mixture
Figure 4.12 Comparison between PV from Model with PV from Test Results for
Field Mixtures
1.E-08
1.E-07
1.E-06
1.E-05
1.E-04
1.E-03
1.E-02
1.E-01
1.E+00
1.E-08 1.E-06 1.E-04 1.E-02 1.E+00
Pre
dic
ted P
V
PV from Tests
PVf50
PVf(ER)
1.E-08
1.E-07
1.E-06
1.E-05
1.E-04
1.E-03
1.E-02
1.E-01
1.E+00
1.E-08 1.E-06 1.E-04 1.E-02 1.E+00
Pre
dic
ted P
V
PV from Tests
PVf50
PVf(ER)

113
(a) Log-log Plot
(b) Regular Plot
Figure 4.13 ε-Nf Curves for Laboratory SP-II Mixtures
y = 4204.4x-0.188
R² = 0.9124
y = 3622.4x-0.166
R² = 0.8866
1
10
100
1000
10000
1,000 10,000 100,000 1,000,000 10,000,000
Str
ain A
mp
litu
de
(με)
Number of Cycles to Failure, Nf
Nf50
Nf(ER)
Power (Nf50)
Power (Nf(ER))
0
200
400
600
800
1000
1200
1400
0 100,000 200,000 300,000 400,000 500,000 600,000
Str
ain A
mp
litu
de
(με)
Number of Cuycles to Failure, Nf
Nf50 Nf(ER)
Power (Nf50 ) Power (Nf(ER))

114
(a) Log-log Plot
(b) Regular Plot
Figure 4.14 ε-Nf Curve for Laboratory SP-III Mixtures
y = 3998.5x-0.175
R² = 0.7493
y = 4028.2x-0.171
R² = 0.6674
1
10
100
1000
10000
100 1,000 10,000 100,000 1,000,000 10,000,000
Lo
g S
trai
n A
mp
litu
de
(με)
Log Number of Cycles to Failure, Nf
Nf50 Nf(ER) Power (Nf50) Power (Nf(ER))
y = 3998.5x-0.175
R² = 0.7493
y = 4028.2x-0.171
R² = 0.6674
0
200
400
600
800
1000
1200
1400
0 200,000 400,000 600,000 800,000
Str
ain A
mp
litu
de
(με)
Number of Cycles to Failure, Nf
Nf50 Nf(ER)
Power (Nf50) Power (Nf(ER))

115
Figure 4.15 ε-PV Curves for Laboratory SP-II and SP-III Mixtures from
Laboratory Fatigue Testing
y = 5E-22x5.7637
R² = 0.9423
y = 1E-20x5.2355
R² = 0.7995
1.0E-08
1.0E-07
1.0E-06
1.0E-05
1.0E-04
1.0E-03
1.0E-02
1.0E-01
1.0E+00
100 1000 10000
Pre
dic
ted P
V
PV from Tests
SP-II Mixture SP-III Mixture
Power (SP-II Mixture) Power (SP-III Mixture)

116
(a) SP-II Mixture (b) SP-III Mixture
Figure 4.16 Comparison of Fatigue Life for Laboratory and Field Mixtures
100
1,000
10,000
100,000
1,000,000
100 1,000 10,000 100,000 1,000,000
Fie
ld F
atig
ue
Lif
e, N
f
Laboratory Fatigue Life, Nf
Nf50
Nf(ER)
100
1000
10000
100000
1000000
100 1,000 10,000 100,000 1,000,000
Fie
ld F
atig
ue
Lif
e, N
f
Laboratory Fatigue Life, Nf
Nf50
Nf(ER)

117
(a) SP-II Mixture (b) SP-III Mixture
Figure 4.17 Comparison of Plateau Values for Laboratory and Field Mixtures
1.E-08
1.E-07
1.E-06
1.E-05
1.E-04
1.E-03
1.E-02
1.E-01
1.E+00
1.E-08 1.E-06 1.E-04 1.E-02 1.E+00
Fie
ld F
atig
ue
Lif
e, P
V
SP-II-Lab (PG 70-22) PV
Nf50
Nf(ER)
1.E-08
1.E-07
1.E-06
1.E-05
1.E-04
1.E-03
1.E-02
1.E-01
1.E+00
1.E-08 1.E-06 1.E-04 1.E-02 1.E+00
Fie
ld F
atig
ue
Lif
e, P
V
SP-III-LPV
Nf50
Nf(ER)

118
(a) SP-II Mix using ε-Nf Model (b) SP-III Mix using ε-Nf Model
(c) SP-II Mix using ε-PV Model (d) SP-III Mix using ε-PV Model
Figure 4.18 Comparison of Predicted FEL Values for SP-II and SP-III Mixtures
0
50
100
150
200
250
0 50 100 150 200 250
SP
-II-
70-2
2 F
EL
(μ
ε)
SP-II-64-22 FEL (με)
FEL(Nf50)
FEL (ER) 0
50
100
150
200
250
300
0 100 200 300 400
SP
-III
-64-2
2 F
EL
(μ
ε)
SP-III-70-22 FEL (με)
FEL(Nf50)
FEL (ER)
0
50
100
150
200
250
0 100 200 300
SP
-II-
70-2
2 F
EL
(μ
ε)
SP-II-64-22 FEL (με)
FEL(Nf50)
FEL (ER)
0
50
100
150
200
250
300
350
400
0 100 200 300 400
SP
-III
-64-2
2 F
EL
(μ
ε)
SP-III-70-22 FEL (με)
FEL(Nf50)
FEL (ER)

119
Figure 4.19 Stiffness Results for SP-II (PG 64-22) Samples with Varying Air
Void Contents
5000
6000
7000
8000
9000
10000
11000
12000
0 100 200 300 400 500 600
Fle
xura
l S
tiff
ness
(M
Pa)
Number of Cycles, N
2.6% AV (50 με)" 2.2% AV (50 με) 4.6% AV (100 με)
4.6% AV (100 με) 4% AV (150 με) 3.8% AV (150 με)
4.1% AV (200 με) 3.9% AV (200 με)

120
CHAPTER V
COMPARISON OF DIFFERENT FAILURE CRITERA
FOR FATIGUE TESTING
5.1 Introduction
Traditionally, third point loaded beam fatigue has been used to characterize
fatigue performance under laboratory conditions (AASHTO T 321-07). This
includes subjecting beams to damage inducing cyclic loading (displacement
control) and monitoring its stress history. Using the beam geometry, applied
displacement and measured load, strain and stress in beam are calculated. Further,
stiffness of material is calculated using stress and strain history. Then, the number
of cycles at 50% reduction in stiffness is recorded as failure of the beam. This
procedure is repeated at other strain levels to obtain relation between applied
strain and number of cycles to failure. The same relation is given in Equation 5.1.
Sometimes, initial stiffness of material is also incorporated into fatigue model and
is given in Equation 5.2.
(5.1)
(5.2)
where = number of cycles at failure, = maximum tensile strain in beam, =
initial stiffness and = regression coefficients.

121
Under controlled displacement mode of loading, the stress in beam reduces with
increase in number of cycles. Due to testing difficulties, it is difficult to monitor
development and propagation of cracks in the beam. Often, it takes a large
number of repetitions of load to see a macrocrack in the beam. Due to nature of
loading, measured load might not decrease beyond certain value. Also, 50%
reduction in stiffness has been arbitrarily defined as failure point. Such an
approach might not indicate better utilization of material and time resources
available.
Several researchers have proposed energy based approaches to analyze fatigue
data. Among them dissipated energy, cumulative dissipated energy and dissipated
energy ratio approaches are popular among pavement engineering community due
to its simplistic nature. However these approaches fail to account for viscoelastic
nature of asphalt concrete. On the other hand viscoelastic continuum damage
approach has shown promising results in terms of robustness, efficient utilization
of available resources.
In summary, this study compared fatigue failure criterion developed using
stiffness based approach with viscoelastic continuum damage approach. Such a
comparison can aid phenomenological approach in describing fatigue
performance in a rational manner.

122
5.2 Background on Current Fatigue Failure Criteria
As mentioned previously, in phenomenological approach failure is defined as
number of cycles at which stiffness of material decreases by 50% (AASHTO T
321). Initial stiffness of beam is measured at 50th
loading cycle. This is to account
for initial setting of beam. However one might expect stiffness reduction from
first cycle itself. Thus in this approach damage in initial few cycles is ignored.
This often leads to unrealistic values especially at higher strain amplitude levels.
Other researchers have used dissipated energy to model fatigue behavior (Van
Dijk and Vesser 1977, Rowe 1993, Pronk and Hopman 1990, Pronk 1997).
Dissipated energy is defined as energy lost during each cycle of loading. This
includes energy lost due to damping, viscoelastic effects and damage growth.
Dissipated energy can be calculated by calculating area within stress-strain curve.
Mathematically, dissipated energy in each cycle is given by Equation 5.1.
Further dissipated energy in each cycle is summed to obtain cumulative dissipated
energy as shown in Equation 5.2.
(5.1)
(5.2)
where = dissipated energy in cycle , = stress amplitude, = strain
amplitude, = phase angle between stress and strain and = cumulative
dissipated energy up to cycle .

123
Van Dijk and Vesser (1977) found a strong relation between numbers of cycles
and cumulative dissipated energy. Pronk and Hopman (1990) refined dissipated
energy approach by defining energy ratio to check for linearity. Energy ratio is
defined as ratio of initial dissipated energy to dissipated energy in cycle
multiplied by number of cycles. Deviation from straight line in plot of energy
ratio against number of cycles indicates development of macrocrack in beam.
However deviation from straight line is subjected to individual judgment.
Guzlan and Carpenter (2000) used the Dissipated Energy Ratio (DER) to quantify
relative change in dissipated strain energy. Dissipated energy ratio is defined as
Chapter 2 where Guzlan and Carpenter (2000) found a strong relationship
between DER and number of cycles to failure. A plot of dissipated energy ratio
vs. number of cycles indicates three distinct regions, as described earlier in
Chapter 2. Research by Shen and Carpenter (2005) indicated a linear relationship
between the plateau value and number of cycles to 50 percent initial stiffness
(semi-log scale). However due to overly sensitive dissipated energy difference,
plot of dissipated energy ratio vs. number of cycles indicates scatter. Thus it is
difficult to interpret failure location visually as well as mathematically.
Rowe and Bouldin (2000) introduced Energy Ratio for modeling fatigue behavior
and is described in detail in Chapter 2. The Energy Ratio is obtained by
multiplying stiffness (kPa) by the corresponding number of cycle. The Energy
Ratio is cross plotted against number of cycles to determine the failure location.

124
The peak value in this plot indicates the transition from micro-cracking to macro-
cracking.
In all above cases, material is considered to be elastic. However asphalt concrete
exhibits rate dependent and temperature dependent behavior. Kim (1988)
successfully applied the elastic-viscoelastic correspondence principle for
modeling sand-asphalt mixture behavior under multi level cyclic loading. Kim
(1988) found that the secant pseudo stiffness (stress corresponding to maximum
pseudo strain divided by maximum pseudo strain in each cycle) value decreases
with increasing damage. Daniel (Daniel 2001, Daniel and Kim 2002) found that
the relationship between the normalized pseudo stiffness ( ) and the damage
parameter ( ) is unique for a given asphalt concrete mix (hereafter referred to as
damage characteristic curve) under uniaxial mode of loading. Swamy (2011)
extended viscoelastic continuum damage mode to flexure mode of loading and
found that damage characteristic curve is unique at given temperature under
flexure mode of loading. Swamy and Daniel (2011) found a point of inflection in
the damage characteristic curve beyond which the material loses its structural
integrity at faster rate. Also, it is observed that normalized pseudo stiffness at this
inflection point is dependent on mixture properties.
In this study, traditional four point bending beam fatigue testing apparatus is used.
AASHTO T321 standards are used for fatigue testing. For determining
viscoelastic properties, displacement controlled cyclic loading mode is used.

125
5.3 Laboratory Testing
Initially, prepared specimen is tested for its viscoelastic properties and
subsequently tested for its fatigue properties. During the determination of
viscoelastic properties, specimen is subjected to low strain amplitude cyclic
loading to obtain its dynamic modulus and phase angle fingerprint at different
temperatures and frequencies. The maximum strain in specimen is limited to 75
microstrain. Dynamic modulus and phase angle measurements are obtained at -
10°C to 30°C in 10°C increments. Within each temperature, frequencies of 15, 10,
5, 2, 1, 0.5, 0.2, and 0.1 Hz are used. Using time-temperature superposition
principle, dynamic modulus and phase angle mastercurves are constructed. Using
dynamic modulus and phase angle mastercurve coefficients, relaxation modulus
mastercurve is obtained using the inter-conversion technique proposed by Park
and Kim (1999).
In second stage, fatigue testing is conducted on specimens to obtain fatigue
properties on mixture. All specimens are tested at damage inducing strain level. In
this research strain amplitudes used are in range of 400-1200 microstrain. Using
the deflection history, load response history, and geometry of test specimen, the
maximum strain and stress in specimen are calculated using Eq. 5.3 and 5.4,
respectively.
(5.3)
(5.4)

126
Where = Load applied by actuator at time , =average specimen width and
=average specimen height, = deflection at center of beam at time t, = distance
between inside clamps and = distance between outside clamps.
5.4 Analysis procedure
The relaxation modulus mastercurve is obtained using dynamic modulus and
phase angle mastercurve coefficients through the inter-conversion technique.
Dynamic modulus mastercurves and relaxation modulus for both mix types are
presented in Appendix B. Using computed strain history and relaxation modulus
mastercurve, pseudo strain is computed using Eq. 5.5. This pseudo strain accounts
for all viscoelastic effects and separates effects of damage and healing within the
specimen.
(5.5)
where ER = reference modulus, E(t) = relaxation modulus, = computed physical
strain, t = elapsed time between the time loading began and the time of interest
and τ = time variable.
In a fatigue test, loops are seen in cross plot of measured stress vs. pseudo strain.
Further the slope of these loops decreases as testing progresses. The secant
pseudo stiffness ( ) in any cycle i is calculated by dividing measured stress by
maximum pseudo strain in cycle i . To account for specimen to specimen
variation, secant pseudo stiffness is divided by secant pseudo stiffness in first
cycle of loading (I). From here onwards for simplicity, this value will be referred

127
to as normalized pseudo stiffness ( ). Due to continuous growth of damage,
numerical value of normalized pseudo stiffness continuously decreases (has value
of 1 at undamaged condition, 0 at complete failure). The variation of normalized
pseudo stiffness during a fatigue test is shown in Figure 5.1. Using the histories of
normalized pseudo stiffness and computed physical strain, damage parameter is
computed. The equation to compute damage parameter is presented in Eq. 5.6.
(5.6)
Where = maximum pseudo strain in cycle , = normalized
pseudostiffness in cycle , = damage parameter in cycle , = material
constant and = time to maximum pseudo strain in cycle .
Due to continuous growth of damage, numerical value of damage parameter
continuously increases (with initial value of 0). Further, the normalized pseudo
stiffness is plotted against the damage parameter to obtain damage characteristic
curve. This curve is fitted with generalized exponential model presented in Eq.
5.7.
(5.7)
Where = normalized pseudostiffness, = damage parameter and =
regression coefficients.
Visual examination of actual damage characteristic curve and predicted values
from generalized exponential model indicated that generalized exponential model

128
over-predicted at lower normalized pseudo stiffness values. Thus using data
points below which deviation is seen is fitted with second order polynomial. The
composite mode consisting of generalized exponential model and second order
polynomial is used for further analysis. The point of intersection of generalized
exponential model and second order polynomial referred to point of inflection.
Characteristic damage curve obtained for SP-II-K2 specimen (SP-II mixture) is
shown in Figure 5.2. The number of cycles corresponding to this inflection point
has been documented as failure criterion by Swamy and Daniel (2011). The same
figure shows fitted generalized exponential model and second order polynomial.
More details about viscoelastic continuum damage approach as applied to flexure
mode of loading can be found elsewhere (Swamy 2011, Swamy and Daniel 2011).
Using the computed strain and stress, stiffness in each cycle of loading is
computed. Further stiffness ratio is computed using initial stiffness, stiffness
corresponding to number of cycles. The formula to compute stiffness ratio is Eq.
5.8. The variation of the stiffness ratio with number of cycles is shown in Figure
5.1. During the course of the fatigue test, stiffness ratio increases initially and then
decreases. Number of cycles corresponding to maximum stiffness ratio has been
considered to be failure point by researchers (Rowe and Bouldin 2000).
(5.8)
Where = stiffness ratio, = stiffness in cycle , and = initial stiffness.

129
5.5 Results
Damage characteristic curves for SP-II and SPIII mixtures using alpha =1 +1/n
are shown in Figure 5.3 and Figure 5.4, respectively. Alpha is a material constant,
used to determine the relaxation modulus master curve, ER, shown in Eq. 5.5. The
slope of the ER = n. If the material’s fracture energy and failure stress are
constant, then the material constant, , equals 1+1/n. On the other hand, if the
fracture process zone size and fracture energy are constant, the material constant,
equals 1/n. Lee and Kim (1998b) suggested that material constant forms =
1+1/n, and = 1/n, are more suitable for controlled strain amplitude test and
controlled stress amplitude test, respectively.
5.6 Comparison of Parameters at Maximum Stiffness Ratio
The number of cycles to 50% reduction in stiffness is compared with number of
cycles at maximum energy ratio for SP-II and SP-III mixtures in Figure 5.5 and
Figure 5.6, respectively. In general, number of cycles at maximum energy ratio is
higher than number of cycles to 50% reduction in stiffness.
The number of cycles at inflection point in damage characteristic curve (using
alpha = 1 + 1/n) is compared with number of cycles at maximum energy ratio for
SP-II and SP-III mixtures in Figure 5.7 and Figure 5.8, respectively. In general, a
strong correlation is found between number of cycles at inflection point in
damage characteristic curve and number of cycles at maximum energy ratio.

130
Further, number of cycles at inflection point in damage characteristic curve is
always less than number of cycles at maximum energy ratio.
5.7 Comparison of CD Method with Traditional Method
Scatter plot of number of cycles at inflection point in damage characteristic curve
vs. number of cycles at 50% reduction in stiffness for SP-II and SP-III mixtures
are presented in Figure 5.9 and Figure 5.10, respectively. Coefficient of
correlation (with power fit, both on log scales) is in range of 0.6575 to 0.9245. R2
values and visual interpretation indicates a strong correlation between these two
parameters.
5.8 Effect of Strain Amplitude
Effect on strain amplitude on number of cycles is investigated for SP II and SP III
mixture. Criterion like 50% reduction in stiffness, maximum stiffness ratio and
inflection point in damage characteristic curve is used in evaluation. The plots for
SP-II and SP-III mixtures are shown in Figure 5.11 and Figure 5.12, respectively.
In case of SP-II mixture, with decrease in strain amplitude, the number of cycles
increased for all three cases. However this is not the case for SP-III mixture. In
case of SP-II mixture, R2 value is 0.797, 0.738 and 0.8195 for 50% reduction in
stiffness, maximum stiffness ratio and inflection point in damage characteristic
curve, respectively. For SP-III mixture, R2 value is 0.219, 0.403 and 0.5904 for
50% reduction in stiffness, maximum stiffness ratio and inflection point in

131
damage characteristic curve, respectively. This indicates that there is better
correlation between strain amplitude and the number of cycles at inflection point
in the damage characteristic curve.
5.9 Summary
This section summarizes compared fatigue failure criterion developed using
stiffness based approach with viscoelastic continuum damage approach, as
performed in this study:
Dynamic modulus testing is performed on asphalt beam samples to
determine the dynamic modulus and phase angle master curves. Using
mastercurve coefficients, a relaxation modulus mastercurve is obtained
whereby the pseudo-strain is computed for each test.
The secant pseudostiffness (stress corresponding to maximum
pseudostrain divided by maximum pseudostrain in each cycle) value is
found to decrease with increasing damage. The damage characteristic
curve describes the relationship between the normalized
pseudostiffness (C1) and the damage parameter (S1).
Using the VCDM approach, a point of inflection is identified in the
damage characteristic curve beyond which the material loses its
structural integrity at faster rate. This point is considered the fatigue
failure of the sample.
A strong correlation is found between the VCDM criterion and the
Energy Ratio criterion. Further, the fatigue life of the VCDM approach
is always less than Energy Ratio fatigue life.

132
A strong correlation is also found between the VCDM criterion and
the traditional criterion (Nf50).
The effect of strain amplitude on the fatigue life of SP-II and SP-III
mixtures is analyzed using the three different failure approaches. In
case of the SP-II mixture, with decrease in strain amplitude, the
number of cycles increased for all three cases. However this is not the
case for SP-III mixture. Higher R2 values for the inflection point in
damage characteristic curve suggest that there is better correlation
between strain amplitude and number of cycles at inflection point in
the damage characteristic curve.

133
Figure 5.1 Variation of Normalized Pseudo Stiffness and Stiffness Ratio with
Number of Repetitions
0.0E+00
5.0E+06
1.0E+07
1.5E+07
2.0E+07
2.5E+07
3.0E+07
0.0
0.2
0.4
0.6
0.8
1.0
1.2
0 5000 10000 15000 20000
Sti
ffness
Rat
io
No
rmal
ized
Pse
udo
stif
fnes
s, C
1
Cycle Number
C1 Stiffness Ratio

134
Figure 5.2 Damage Characteristic Curve for SP-II-K2 Specimen
0.00
0.25
0.50
0.75
1.00
0.E+00 1.E+05 2.E+05 3.E+05 4.E+05 5.E+05
No
rmal
ized
Pse
udo
stif
fnes
s, C
1
Damage Parameter, S1
Raw Data
Generalized Exponential Model
Second Order Polynomial
Inflection Point

135
Figure 5.3 Damage Characteristic Curves for SP-II Mixture
0.0
0.2
0.4
0.6
0.8
1.0
0.E+00 1.E+05 2.E+05 3.E+05 4.E+05 5.E+05 6.E+05 7.E+05
No
rmal
ized
Pse
ud
ost
iffn
ess,
C1
Damage Parameter, S1
SP-II-K1
(1200 ms)
SP-II-K2
(1200 ms)
SP-II-I2
(800 ms)
SP-II-M2
(400 ms)
SP-II-N2
(400 ms)

136
Figure 5.4 Damage Characteristic Curves for SP-III Mixture
0.0
0.2
0.4
0.6
0.8
1.0
0.E+00 1.E+05 2.E+05 3.E+05 4.E+05 5.E+05
No
rmal
ized
Pse
ud
ost
iffn
ess,
C1
Damage Parameter, S1
SP-III-C2
(600 ms)
SP-III-F2
(800 ms)
SP-III-I1
(800 ms)
SP-III-E2
(1200 ms)
SP-III-D1
(1200 ms)

137
Figure 5.5 Comparison of number of cycles at maximum energy ratio and number
of cycles for 50% stiffness reduction for SP II mixture
1.0E+03
1.0E+04
1.0E+05
1.0E+06
1.0E+07
1.0E+03 1.0E+04 1.0E+05 1.0E+06 1.0E+07
Num
ber
of
Cycl
es
at M
axim
um
Ener
gy
Rat
io
Number of Cycles for 50% Stiffness Reduction

138
Figure 5.6 Comparison of Number of Cycles at Maximum Energy Ratio and
Number of Cycles for 50% Stiffness Reduction for SP-III Mixture
1.0E+03
1.0E+04
1.0E+05
1.0E+06
1.0E+03 1.0E+04 1.0E+05 1.0E+06
Nu
mber
of
Cycl
es
at M
axim
um
Ener
gy
Rat
io
Number of Cycles for 50% Stiffness Reduction

139
Figure 5.7 Comparison of Number of Cycles at Inflection Point and Number of Cycles at Maximum Energy Ratio for SP-II Mixture
1.0E+02
1.0E+03
1.0E+04
1.0E+05
1.0E+06
1.0E+07
1.0E+02 1.0E+03 1.0E+04 1.0E+05 1.0E+06 1.0E+07
Num
ber
of
Cycl
es
at I
nfl
ecti
on P
oin
t in
CD
Curv
e
Number of Cycles at Maximum Energy Ratio

140
Figure 5.8 Comparison of Number of Cycles at Inflection Point and Number of
Cycles at Maximum Energy Ratio for SP-III Mixture
1.0E+02
1.0E+03
1.0E+04
1.0E+05
1.0E+06
1.0E+02 1.0E+03 1.0E+04 1.0E+05 1.0E+06
Num
ber
of
Cycl
es
at I
nfl
ecti
on P
oin
t in
CD
Curv
e
Number of Cycles at Maximum Energy Ratio

141
Figure 5.9 Comparison of Number of Cycles at Inflection Point and Number of
Cycles for 50% Stiffness Reduction for SP-II Mixture
1.0E+02
1.0E+03
1.0E+04
1.0E+05
1.0E+06
1.0E+02 1.0E+03 1.0E+04 1.0E+05 1.0E+06
Num
ber
of
Cycl
es
at I
nfl
ecti
on P
oin
t in
CD
Curv
e
Number of Cycles for 50% Stiffness Reduction
GEM, alpha = 1 + 1/n
GEM, alpha = 1/n

142
Figure 5.10 Comparison of Number of Cycles at Inflection Point and Number of
Cycles for 50% Stiffness Reduction for SP-III Mixture
1.0E+02
1.0E+03
1.0E+04
1.0E+05
1.0E+06
1.0E+02 1.0E+03 1.0E+04 1.0E+05 1.0E+06
Num
ber
of
Cycl
es
at I
nfl
ecti
on P
oin
t in
CD
Curv
e
Number of Cycles for 50% Stiffness Reduction
GEM, alpha = 1 + 1/n
GEM, alpha = 1/n

143
Figure 5.11 Effect of Strain Amplitude on Failure Criteria for SP-II Mixture
100
300
500
700
900
1100
1.0E+02 1.0E+03 1.0E+04 1.0E+05 1.0E+06 1.0E+07
Str
ain A
mp
litu
de
(με)
Number of Cycles
Maximum stiffness ratio Inflection point in DC curve 50% stiffness reduction

144
Figure 5.12 Effect of Strain Amplitude on Failure Criteria for SP-III Mixture
100
300
500
700
900
1100
1300
1.0E+02 1.0E+03 1.0E+04 1.0E+05 1.0E+06
Str
ain A
mp
litu
de
(με)
Number of Cycles
Maximum stiffness ratio Inflection point in DC curve 50% stiffness reduction

145
CHAPTER VI
FATIGUE CRACK PROPAGATION IN
HMA MIXTURES
6.1 Introduction
It has been well documented that fatigue cracking has three stages; crack
initiation, propagation, and rapid failure (Kravchenko 1964). Under controlled
displacement flexural mode of loading, the stress in the beam reduces with
increase in loading cycles. Due to testing difficulties, it is difficult to monitor
development and propagation of cracks in the beam. Often, it takes a large
number of load repetitions to see a macrocrack in the beam. For this study,
traditional four-point bending is performed on HMA beam specimens and the
resulting fatigue cracking is analyzed. Fatigue testing is conducted in an
environmental chamber where the temperature is kept constant at 20°C. At the
end of each test, each beam is examined and where visible, cracks are highlighted
and photographed. In addition, crack lengths are measured using a scale roller
pen, and separated into three categories, depending on where the location of the
crack existed: within the asphalt mastic, through aggregates, and at the interface
between aggregate and asphalt mastic.
The mastic is a the mixture of fine aggregate passing the #200 sieve and asphalt
binder, which is a viscoelastic composite that has adhesive and cohesive
properties capable of withstanding tensile forces (Kias 2008). The interface is

146
defined as the surface that is the boundary between the binder, or mastic, and the
aggregate. The aggregate consists of coarse particulate matter that is coated with
binder and forms the load-bearing skeleton of the HMA. Cracks can initiate and
propagate through any of these three phases. The objective of this paper is to
determine a pattern or trend, if any, of crack initiation and propagation in HMA
materials, as well as understand why fatigue results may differ under similar
testing conditions.
6.2 Background
Traditional mechanistic-empirical approaches for predicting fatigue of HMA
mixtures require controlled stress (strain) laboratory testing, usually dictated by a
single temperature over a range of applied stress (strain) levels. The number of
cycles to failure is then recorded along with the critical stress (strain) level and a
plot of this relationship describes the fatigue behavior of a HMA mixture.
Usually, replicate samples are required for testing at different stress or strain
levels. Results of fatigue testing of replicate samples should in theory be similar.
However, this is not always the case as it is virtually impossible to recreate two to
three identical samples. Aggregate alignment and distribution vary with each
sample prepared, and because of that, crack initiation and propagation rates
change with each test. Therefore, it can only be assumed that the fatigue life
differs from one sample to another, despite similar testing conditions.

147
Many test factors can be controlled such as mixture type, sample stiffness,
percentage air voids, temperature, frequency, and aggregate gradation. However,
due to the limited sample size, factors which are nearly impossible to control are
the location and distribution of large size aggregates (greater than ½ inch). Beam
sample size for fatigue testing is 15″ x 2.5″ x 2.0″ (AASHTO T321-07). Within
these boundaries, larger size aggregates can congregate, which may lead to poor a
density gradient, and ultimately premature fatigue failure. As stated earlier,
fatigue failure has three stages; crack initiation, propagation, and failure. The
presence of larger-size aggregates within close proximity of each other may
induce crack initiation, as well as affect crack propagation rates.
There are numerous studies of crack behavior in metallic materials, yet crack
initiation, crack path and propagation are not well understood in asphalt concrete.
One particular study characterized crack initiation and propagation through HMA
materials. In particular, crack pathways are evaluated by micro-mechanical testing
of the phases of asphalt concrete in tension, compression, and shear, Results
showed that the interface phase is preferential for crack initiation and propagation
(Kias 2008). However, notched samples are tested under monotonic loading only.
This study investigates cracking due to fatigue failure on un-notched HMA
samples and the effects of the chosen crack path on the associated fatigue life.

148
6.3 Fatigue Test Results
6.3.1 SP-II Mixture
Table 6.1 presents the fatigue test results of SP-II mixture samples. The applied
strain and initial stiffness of the beam (taken at 50 load cycles) are shown, as well
as the percent air voids and fatigue life of each test specimen. The fatigue life is
the number of cycles required to achieve failure. AASHTO T321-07 standards
require that a sample achieve 50% reduction in initial stiffness (Nf50) before
considered failed. However, this may only lead to minor cracking, even micro-
cracking which may not be visible to the naked eye. Therefore, beam samples are
tested until they achieved 80-90% reduction in initial stiffness, whereby macro-
cracking can be easily identified. Also listed in Table 6.1 is the failure criterion
(Nf(ER)) defined by the Energy Ratio method. The Energy Ratio approach is based
on a stress-controlled study by Hopman et al. (1989) which claims to identify the
point at which micro-cracking becomes a macro-crack (defined as fatigue failure).
The Energy Ratio is obtained by multiplying stiffness by corresponding number
of cycle. The point at which the maximum value of ER occurs is defined as the
fatigue failure. The peak in the curve indicates the transition point between micro-
crack formation and propagation of a macroscopic crack. The Energy Ratio is
defined in Equation 6.1:
Energy Ratio (ER) = Cycle Number* Stiffness (6.1)
where E is the flexural stiffness (kPa) and N is the number of cycles.

149
Table 6.1 shows that the strain range varied from 200 to 1000 με. Sample SP-II-
L2 is tested at 200 microstrain (με) for 10 days, achieving 8.5 million cycles, yet
flexural stiffness reduced by only 30%. Therefore, testing is stopped and the
applied strain is increased to 400 με for the next test.
Table 6.2 presents crack lengths measured for each SP-II sample. Crack lengths
are measured as they pass through the asphalt mastic, aggregate, and interface
phases. Each sample face is labeled clearly; Faces 1 and 3 are the sides of the
beam, while Faces 2 and 4 are the bottom and top sides respectively. Micro and
macro-cracking usually occurs at the base of the sample (Face 2) first, due to the
presence of the maximum tensile strain, which is induced during flexure. The
cracking propagates upward through the beam until it eventually appears on the
topside of the beam. This process basically simulates the behavior of fatigue
cracking in the field.
Replicate samples which are tested under similar conditions are analyzed.
Samples SP-II-A1, SP-II-M2, and SP-II-N2 are tested at 400 με. All tests are
conducted at the same frequency (10 Hz) and temperature (20°C), and contain
similar air voids (5-6%). Sample SP-II-A1 failed after 263,111 cycles (Nf50).
Table 2.2 shows that sample SP-II-A1 had a total crack length of 3 inches. The
majority of the crack length occurred along the interface (93%), whereas the
remaining cracks propagated through the asphalt mastic (3%) and aggregates
(4%).

150
Figure 6.1 illustrates the cracking in the base of sample SP-II-A1 and shows that
the crack path propagates at the interface between large size aggregates and
asphalt mastic. The crack then propagated towards the topside of the beam, as
shown in Figure 6.2. However, when compared with replicate test samples, the
fatigue life data differs. It can be seen from Table 2.1 that sample SP-II-M2 is of
same mix type, contained similar air voids, but had slightly lower flexural
stiffness. SP-II-M2 is also tested at 400 με but yielded a far greater fatigue life.
Figure 6.3 shows the crack path in sample SP-II-M2. The data shown in Table
6.2, shows that only 33% of the crack length occurred at the interface, with the
majority, 52%, passing through aggregates. As expected, the crack propagation
rate is reduced when cracks pass through aggregates, therefore extending the
fatigue life of the material. This scenario may explain the superior fatigue life of
sample SP-II-M2 when compared with sample SP-II-A1.
The last replicate sample, SP-II-N1, is shown in Figure 6.4. Little or no cracking
is evident in the sample, except for minor cracking which is visible at the
interface of a large aggregate in the base of the sample. The reason for low
cracking in sample SP-II-N1 is because the test is stopped after achieving only
70% reduction in stiffness, whereas 80-90% usually initiates unstable macro-
cracking. However, the sample SP-II-N1 achieved 50% reduction in stiffness
(failure) well before samples SP-II-A1 and SP-II-M2. The remaining SP-II

151
samples described in Table 6.1 all show similar results (Nf50 data) to their
replicate test samples.
6.3.2 SP-III Mixture
Table 6.3 presents fatigue test results of SP-III mixture samples. Once again,
sample name, applied strain, sample stiffness, percent air voids, and fatigue life of
each test specimen are shown. The applied strain varied from 70 to 1200 με. Once
again, initial test samples, SP-III-A1 and SP-III-B1, experienced 25 and 3.5
million cycles respectively, without achieving failure. Therefore, testing is
continued at higher strains and the results are analyzed. In general, with
increasing strain, fatigue life reduces. This trend is shown in Table 6.3, when
looking at the average number of cycles to failure for each strain level.
As with the SP-II mixtures, fatigue results from replicate samples tested at the
same applied strain are analyzed and discussed. Samples SP-III-F2, SP-III-J1, and
SP-III-M2 are tested at 800 με, under identical conditions. Table 6.4 presents
crack lengths measured for each SP-III sample. Crack lengths are measured as
they pass through the asphalt mastic, aggregate, and interface phases. Each
sample face is labeled clearly; Faces 1 and 3 are the sides of the beam, while
Faces 2 and 4 are the bottom and top sides respectively.
Figure 6.5 shows multiple cracking primarily located at the interface of
aggregates and asphalt mastic of sample SP-III-F2. Table 6.3 confirms this

152
observation with 80% of total cracking occurring at the interface. From Figure
6.6, cracks are highlighted propagating upwards through sample SP-III-F2 from
the bottom side. The crack follows a path along the interface of a large aggregate
whereupon it stops about halfway through the beam. The fatigue life of sample
SP-III-F2 is 114,000 cycles. When compared with replicate sample SP-III-J1,
which has a much shorter fatigue life, it can be seen that almost 90% of the
cracking occurred at the interface also. Figure 6.7 shows the crack path in the base
of sample SP-III-J1. Large air voids are visible which may have initiated
cracking, and almost certainly increased the crack propagation rate. Therefore, the
fatigue life of sample SP-III-J1 with 38,000 cycles, is much shorter than that of
sample SP-III-F2.
Finally, sample SP-III-M2 showed a fatigue life similar to that of sample SP-III-
J1, with 42,000 cycles. Once again, Table 6.4 shows that 60% of the crack path is
located at the interface. Figure 6.8 shows some air voids present between large
size aggregates, but surprisingly, the crack path did not pass through the air voids.
Instead, the crack followed a path along the interface between two large
aggregates. This suggests that the effect of air voids is minimal on cracking in this
sample. When comparing all three samples, each show similar values in terms of
flexural stiffness, ranging between 400-450 ksi, and percentage air voids varying
from 5 to 6%. Therefore, judging by the photographic evidence of cracking
highlighted in each sample, the distribution of large-size aggregates seems to play
a vital role. Sample SP-III-F2 has a much better distribution of large size

153
aggregates within the asphalt mastic than that shown in samples SP-III-J1 and SP-
III-M2. In addition, the presence of voids does not necessarily cause crack
initiation or even propagation. Rather, the presence of larger size aggregates close
to one another, and crack propagation along the interface of these aggregates may
reduce the fatigue life in the HMA materials.
From this study, the measured crack lengths from fatigue test results of SP-II and
SP-III mixtures show that the majority of the cracking occurred at the interface.
54% and 70% of the total fatigue crack lengths in SP-II and SP-III samples are
measured at the interface phase. This finding concurs with other studies which
showed that the interface phase is preferential for crack initiation and propagation
(Kias 2008).
6.4 Conclusions
The conclusions being made here are:
HMA mixture samples of similar mix design which are tested under
similar conditions did not necessarily show similar fatigue lives. HMA
fatigue life depends greatly on the ability of the material to withstand
crack propagation. This study shows that the location and distribution
of large size aggregates within the asphalt matrix affects crack
propagation, whereby crack paths often propagate at the interface of
the large aggregates and asphalt mastic.

154
Failure due to fatigue cracking most often occurred at the interface of
HMA samples where 54% and 70% of the total fatigue crack lengths
in SP-II and SP-III samples are measured at the interface phase.
Approximately 30% and 20% of the total fatigue crack lengths are
measured in the mastic phase, and 17% and 10% are measured in the
aggregate phase, of SP-II and SP-III samples.

155
Table 6.1 Flexural Fatigue Test Results for SP-II Mixture Samples
Beam
ID
Applied
εt (με)
Initial
E0 (psi)
% Air
Voids
Cycles
Tested
Failure Criteria Avg. Cycles to Failure
Nf50 Nf (ER) Nf50 Nf(ER)
L2 200 954,638 5.4 8,479,090 NA NA NA NA
N2 400 646,000 5.2 115,101 79,008 69,069
355,377 469,631 A1 400 880,310 5.4 389,811 263,411 239,818
M2 400 666,158 5.9 1,535,746 723,711 1,100,007
I2 800 471,000 5.1 23,612 11,700 10,910 11,100 45,661
L1 800 655,716 5.8 156,076 10,500 80,412
N1 1000 853,302 4.8 2,665 1,085 1249 2,795 5,795
O2 1000 531,200 5.7 17,256 4,504 10,341

156
Table 6.2 Crack Lengths in Failed SP-II Samples
Sample Sample Fatigue Cracking (in) Crack Location (%)
I2 Side Mastic Aggregate Interface Total Mastic Aggregate Interface
Side 1 Face 1 0.3 0.77 1.07 2.1 14.0 36.0 50.0
Bottom Face 2 1.29 1.84 2.01 5.1 25.1 35.8 39.1
Side 2 Face 3 0 0 0.55 0.6 0.0 0.0 100.0
Top Face 4 0 0 0 0.0 NA NA NA
M2
Face 1 0.52 0.45 1.89 2.9 18.2 15.7 66.1
Face 2 0.55 1.84 1.17 3.6 15.4 51.7 32.9
Face 3 0.45 0 1.74 2.2 20.5 0.0 79.5
Face 4 1.86 0 0.42 2.3 81.6 0.0 18.4
L1
Face 1 0.25 0 0.6 0.9 29.4 0.0 70.6
Face 2 0.89 0 1.61 2.5 35.6 0.0 64.4
Face 3 0 0 0.79 0.8 0.0 0.0 100.0
Face 4 0 0 0 0.0 NA NA NA
N2
Face 1 0 0 0 0.0 NA NA NA
Face 2 0 0 1.17 1.2 0.0 0.0 100.0
Face 3 0 0 0 0.0 NA NA NA
Face 4 0 0 0 0.0 NA NA NA
N1
Face 1 0.4 0 0.17 0.6 70.2 0.0 29.8
Face 2 0.22 1.19 1.6 3.0 7.3 39.5 53.2
Face 3 0.72 0 1.32 2.0 35.3 0.0 64.7
Face 4 0 0 0 0.0 NA NA NA
A1
Face 1 0.25 0.22 0.12 0.6 42.4 37.3 20.3
Face 2 0.1 0.12 2.8 3.0 3.3 4.0 92.7
Face 3 1.14 0 0 1.1 100.0 0.0 0.0
Face 4 0 0.15 0.79 0.9 0.0 16.0 84.0
O2
Face 1 0.45 0 0.77 1.2 36.9 0.0 63.1
Face 2 0.92 0.37 1.07 2.4 39.0 15.7 45.3
Face 3 1.07 0 0 1.1 100.0 0.0 0.0
Face 4 0 0 0 0.0 NA NA NA
TOTAL 11.38 6.95 21.66 40.0 28.5 17.4 54.2

157
Table 6.3 Flexural Fatigue Test Results for SP-III Mixture Samples
Beam
ID
Applied
εt (με)
Initial
E0 (psi)
% Air
Voids
Cycles
Tested
Failure Criteria Avg. Cycles to Failure
Nf50 Nf(ER) Nf50 Nf(ER)
A1 70 437,320 9.9 20,741,011 NA NA NA NA
B1 400 537,945 4.9 3,539,851 NA NA NA NA
C1 600 557,499 4.9 833,560 770,008 748,820 770,008 748,820
J1 800 455,466 4.8 106,276 38,001 52,926
64,668 82,776 M2 800 415,678 5.9 79,176 42,001 46,826
F2 800 402,190 5 150,000 114,001 148,576
B2 1000 433,644 4.8 50,701 29,801 35,276 25,201 30,276
P1 1000 582,762 4.8 40,901 20,601 25,276
P2 1200 485,731 5 12,326 6,476 7,551 8,026 22,149
Q2 1200 451,938 5.8 52,526 9,576 36,746

158
Table 6.4 Crack Lengths in Failed SP-III Samples
Sample Sample Fatigue Cracking (in) Crack Location (%)
P1 Side Mastic Aggregate Interface Total Mastic Aggregate Interface
Side 1 Face 1 0.32 0 1.29 1.61 19.9 0.0 80.1
Bottom Face 2 0.87 0.94 1.53 3.34 26.0 28.1 45.8
Side 2 Face 3 0.27 0.22 0.57 1.06 25.5 20.8 53.8
Top Face 4 0 0 0 0 NA NA NA
M2 Face 1 0 0.34 0.57 0.91 0.0 37.4 62.6
Face 2 0.72 0.17 1.32 2.21 32.6 7.7 59.7
Face 3 0.25 0 0.65 0.9 27.8 0.0 72.2
Face 4 0 0 0 0 NA NA NA
B1 Face 1 0 0 0 0 NA NA NA
Face 2 0.25 0.47 0.92 1.64 15.2 28.7 56.1
Face 3 0 0 0.27 0.27 0.0 0.0 100.0
Face 4 0 0 0 0 NA NA NA
F2 Face 1 0 0 0.52 0.52 0.0 0.0 100.0
Face 2 0.35 0.42 3.13 3.9 9.0 10.8 80.3
Face 3 0 0 1.59 1.59 0.0 0.0 100.0
Face 4 0 0 0 0 NA NA NA
Q2 Face 1 0.65 0.2 0.97 1.82 35.7 11.0 53.3
Face 2 0.46 0.63 1.29 2.38 19.3 26.5 54.2
Face 3 0 0 0.49 0.49 0.0 0.0 100.0
Face 4 1.41 0 0.94 2.35 60.0 0.0 40.0
J1 Face 1 0 0 1.12 1.12 0.0 0.0 100.0
Face 2 0.42 0 2.97 3.39 12.4 0.0 87.6
Face 3 0.41 0 0.55 0.96 42.7 0.0 57.3
Face 4 0 0 0 0 NA NA NA
B2 Face 1 0 0 0.62 0.62 0.0 0.0 100.0
Face 2 0.46 0 0.2 0.66 69.7 0.0 30.3
Face 3 0 0 0 0 NA NA NA
Face 4 0 0 0 0 NA NA NA
P2 Face 1 0.27 0.12 0.5 0.89 30.3 13.5 56.2
Face 2 0.19 0.22 2.26 2.67 7.1 8.2 84.6
Face 3 0 0 0.65 0.65 0.0 0.0 100.0
Face 4 0 0 0 0 NA NA NA
TOTAL 7.3 3.73 24.92 36 20.3 10.4 69.3

159
Figure 6.1 Fatigue Cracking in HMA Beam Sample SP-II-A1

160
Figure 6.2 Fatigue Crack Propagating Upwards in HMA Beam Sample SP-II-A1

161
Figure 6.3 Fatigue Cracking in HMA Beam Sample SP-II-M2

162
Figure 6.4 Fatigue Cracking in HMA Beam Sample SP-II-N2

163
Figure 6.5 Fatigue Cracking in HMA Beam Sample SP-III-F2

164
Figure 6.6 Fatigue Crack Propagating Upwards in HMA Beam Sample SP-III-F2

165
Figure 6.7 Fatigue Cracking in HMA Beam Sample SP-III-J1

166
Figure 6.8 Fatigue Cracking in HMA Beam Sample SP-III-M2

167
CHAPTER VII
CONCLUSIONS AND RECOMMENDATIONS
7.1 Summary
This thesis documents an extensive laboratory investigation of fatigue endurance
limits in asphalt concrete. In addition, alternative fatigue failure criteria are
compared, as well as the effect of crack propagation paths, and polymer-modified
binder, on the fatigue life of asphalt concrete. The fatigue endurance limit is
defined as the strain level below which a material sustains an infinite fatigue life
without accumulating damage. Although, an infinite fatigue life for an asphalt
pavement is not practical for design, a design life of 50 years or more is
considered extraordinary long. Such a structure is termed a perpetual pavement,
and is considered the future of pavement design. Although most of study focuses
on laboratory fatigue failure of asphalt concrete, attempts are made to relate the
findings with the field asphalt concrete fatigue, which can be incorporated in
current pavement design methods.
Fatigue failure, especially in asphalt concrete, is poorly understood problem as
described in Chapter 1. The main problem with the past studies on identifying
fatigue endurance limits is that those studies are mostly based on the
phenomenological approach which relates the number of loading cycles to fatigue
failure with applied tensile strain and initial stiffness of material. However,

168
asphalt concrete is a viscoelastic material, which means that fatigue failure is
temperature dependent. Chapter 1 formulates the problem statement.
Chapter 2 covers previous studies done to investigate the fatigue endurance limit
as well as their limitations. A number of laboratory test methods developed in the
past to determine fatigue failure are described. Very few studies, if any, address
the fatigue failure of asphalt concrete from viscoelastic point of view. Hence the
use of viscoelastic damage mechanics is recommended in addressing the current
problem in asphalt concrete for fatigue failure.
Chapter 3 presents the experimental work performed in this study. In order to
facilitate current standards, fatigue testing is performed using AASHTO T321-07.
Four point bending is applied to beams using controlled strain loading for a range
of strain amplitudes. In addition, a dynamic modulus testing is conducted to
determine the linear viscoelastic range of asphalt concrete which is represented by
dynamic modulus and phase angle mastercurves as well as the relaxation
modulus. Dynamic modulus testing is usually performed on cylindrical samples
(6 in. tall) under compression. On contrary, dynamic modulus testing of beam
samples under flexural loading may be more useful as sample slabs (2-3 in. tall)
can be extracted from the field and then directly tested, once they are cut to size.
Laboratory sample preparation also included compaction using a linear kneading
compactor, sample sizing using a stone-cutting saw, and finally sample

169
conditioning using an environmental chamber. Each fatigue test at a certain strain
level required additional replicate samples (2-3) to be tested.
The results of laboratory fatigue testing at normal and low strain levels are
presented in Chapter 4. Failure is defined as 50% reduction in stiffness and the
majority of tests are conducted until sample stiffness has reduced by 80-90% in
order to identify fatigue cracking. Beam samples which did not fail had their
fatigue life determined using extrapolation techniques. In this way, a more
complete picture of the fatigue behavior of asphalt concrete is described.
Although previous studies have shown that an endurance limit does exist for
HMA mixtures, an established value is yet to be determined, with values varying
from 70-300 microstrain (με) based on mixture variability. Chapter 4 determines
the FEL of HMA mixtures using the phenomenological approach as well as a
fundamental energy based approach, the dissipated energy concept. Furthermore,
two different stiffness-based fatigue failure criteria are compared, as well as their
effect of the estimated FEL of HMA materials. In addition, the effect of certain
mixture variables on the FEL is investigated. Starting from last one and half
decades, polymer has been a part of asphalt binder. Therefore this study includes
fatigue behavior of a polymer modified binder as well as that of base asphalt
binder which is described in Chapter 4. Polymer-modified PG 70-22 and
unmodified PG 64-22 binders are investigated for their effect on FEL of asphalt
concrete.

170
Flexural fatigue testing has been used by the asphalt pavement industry for
several decades. Various approaches have been used to relate fatigue performance
with parameters such as stiffness, dissipated energy, cumulative dissipated
energy, pseudostiffness and so on. Traditional fatigue relation testing relates the
number of loading cycles to failure with applied tensile strain and initial stiffness
of material. Furthermore, the number of loading cycles to failure is defined as that
number of cycles at which the stiffness of a material reduces by 50%. Also,
approaches based on cumulative dissipated energy require visual interpretation of
plots and often ignore viscoelastic effects. On the other hand, approaches based
on viscoelastic continuum damage have shown promising results. This approach
has considerable advantages like reduction in testing time and resources, and is
based on fundamental energy based approach. Therefore a viscoelastic damage
mechanics model is very appropriate to examine fatigue failure in asphalt
concrete. Chapter 5 compares stiffness based failure criterion with failure
criterion based on viscoelastic continuum damage approach.
For this study, fatigue testing of HMA mixtures required controlled strain
laboratory testing of replicate samples at various strain amplitudes. The number of
cycles to failure is recorded along with the critical strain level and this
relationship is used to describe the fatigue behavior of asphalt concrete. Replicate
samples are tested at each strain level. However, fatigue test results of replicate
samples did not always provide similar results. It is impossible to recreate two to
three identical samples, hence crack paths in failed samples vary considerably.

171
Chapter 6 presents a study on the effect of the crack path on the fatigue life of
asphalt concrete. Fatigue cracks are highlighted and photographed in each failed
specimen. Crack lengths are separated into three categories, depending on where
the crack existed; (1) within the asphalt mastic, (2) through the aggregates, and
(3) at the interface between aggregate and asphalt mastic. Fatigue life data of
replicate samples are analyzed using the crack path data as a means to understand
inconsistent results.
7.2 Conclusions
The viscoelastic nature of asphalt concrete influences the fatigue life of laboratory
tested asphalt beam samples. Therefore the viscoelastic continuum damage
mechanics (VCDM) model can be considered a tool to determine the fatigue
failure in AC. A comparison of selected fatigue analysis approaches, a summary
of mixture fatigue results and the effects of polymer-modified binder on HMA
mixture fatigue resistance are summarized in this section.
Fatigue test results show that fatigue failure according to the Energy
Ratio criterion most often occurred after a sample has achieved 50%
reduction in stiffness, which is the traditional fatigue criterion.
Fatigue life extrapolation using the single-stage Weibull function and
RDEC approach showed good consistency with fatigue test results of
SP-II and SP-III mixtures, performed at normal strain levels. However,
for low strain testing, extremely high fatigue life data is predicted,
which suggests that an overestimation of fatigue life.

172
The FEL values of field SP-II and SP-III mixtures are predicted using
the traditional ε-N relationship. The FEL of the SP-II mixture is
estimated to be 195 με, using traditional failure criterion (Nf50), and
231 με using the Energy Ratio failure criterion (ER). For the SP-III
mixture, the FEL is estimated to be 308 με (Nf50) and 313 με (ER), as
shown in Table 7.1.
The FEL values of field SP-II mixture using the ε-PV approach are
estimated to be 235 με (ER) and 222 με (Nf50), and for the field SP-III
mixture, the FEL is estimated to be 311 με (ER) and 341 με (Nf50), as
shown in Figure 7.1.
PV values predicted using the material property-based PV prediction
model showed good consistency with PV values determined from
laboratory testing. However, the estimated FEL values using the PV
model are much lower than those predicted using the ε-Nf and ε-PV
models.
The effect of polymer modified binder on the FEL of HMA mixtures
showed mixed results, with an increase in estimated FEL of SP-III
mixture, but reducing the estimated FEL of SP-II mixture.
The FEL of laboratory mixtures is much lower than that of the field
mixes. In particular, the fatigue performance of laboratory SP-II
mixtures compares well with that of field SP-II mixtures. However, the
laboratory SP-III mixture performs poorly when compared with the
fatigue performance of the field SP-III mixture.

173
The F-test is performed on the ε-Nf and PV-ε curves to determine
whether the curves developed using the Nf50 and ER failure criteria are
statistically the same. For ε-N regression curves through power law, it
is determined that the two fatigue curves are statistically the same for
the SP-III mixture. However, the opposite is the case for the SP-II
fatigue curves. For the PV-ε curves, the F-Test shows that the fatigue
curves are statistically the same using the different fatigue failure
approaches.
Using the VCDM approach, a point of inflection is identified in the
damage characteristic curve beyond which the material loses its
structural integrity at faster rate. This point is considered the fatigue
failure of the sample.
A strong correlation is found between the VCDM criterion and the
stiffness-based failure criteria.
Asphalt concrete beam samples of similar mix type which are tested
under similar conditions did not necessarily show similar fatigue lives.
The fatigue life depends greatly on the chosen crack path. This study
showed that the path of least resistance i.e. the interface of the
aggregates and asphalt mastic, greatly affected the associated fatigue
life.
7.3 Recommendations for Future Work
Recommendations for future work based on this study are shown below:

174
Perform tensile static load tests on asphalt concrete beams for both SP-
II and SP-III mixtures to determine the maximum tensile strength of
each mix type. These results can then be compared with initial flexural
stiffness of test samples. Samples that have similar tensile strength
values can then be selected for subsequent fatigue testing.
The large variation in fatigue life data shown in this study may be due
to human error introduced during the mixing or compaction process. In
order to account for this, additional test samples were prepared using
strict gradation control measures and tested for 500 loading cycles at
low strain amplitudes. Results show that stiffness values were similar
for samples with different percent air voids. In addition, stiffness
variations were observed in samples of similar percent air voids.
Therefore, it is recommended that emphasis be placed on achieving
similar sample stiffness as well as similar air void content in future
testing.

175
Table 7.1 Summary of FEL Performance of SP-II and SP-III Mixtures
PG Binder Grade
Predicted FEL Values (ε-Nf50)
Mix Type SP-II SP-III
Mix Type SP-II SP-III
Field PG 64-22 PG 70-22
Field 1951/222
2 308
1/341
2
Laboratory PG 70-22 PG 64-22
Laboratory 1711/209
2 185
1/182
2
Note: 1=predicted from ε-Nf50 model, and
2=predicted from ε-PV model
Predicted FEL Values
(ε-PV)
Field Mixtures
Mix Type SP-II SP-III
SP-II SP-III
Field 2311/235
2 313
1/311
2
High E* Low E*
Laboratory 2181/268
2 202
1/268
2
High E(t) Low E(t)
Note: 1=predicted from ε-Nf50 model, Note: E*=Dynamic Modulus,
and 2=predicted from ε-PV model
E(t)=relaxation modulus

176
(a) SP-II Mix using ε-Nf Model (b) SP-III Mix using ε-Nf Model
(c) SP-II Mix using ε-PV Model (d) SP-III Mix using ε-PV Model
Figure 7.1 Comparison of Predicted FEL Values for SP-II and SP-III Mixtures
0
50
100
150
200
250
0 50 100 150 200 250
SP
-II-
70-2
2 F
EL
(μ
ε)
SP-II-64-22 FEL (με)
FEL(Nf50)
FEL (ER) 0
50
100
150
200
250
300
0 100 200 300 400
SP
-III
-64-2
2 F
EL
(μ
ε)
SP-III-70-22 FEL (με)
FEL(Nf50)
FEL (ER)
0
50
100
150
200
250
0 100 200 300
SP
-II-
70-2
2 F
EL
(μ
ε)
SP-II-64-22 FEL (με)
FEL(Nf50)
FEL (ER)
0
50
100
150
200
250
300
350
400
0 100 200 300 400
SP
-III
-64-2
2 F
EL
(μ
ε)
SP-III-70-22 FEL (με)
FEL(Nf50)
FEL (ER)

177
REFERENCES
AASHTO T 166-07. “Standard Method of Test for Bulk Specific Gravity of
Compacted Hot Mix Asphalt (HMA) Using Saturated Surface-Dry
Specimens.” American Association of State Highway and Transportation
Officials (AASHTO), Washington D.C., (2007).
AASHTO T 168-07. Standard Test Method for Sampling Bituminous Paving
Mixtures, American Association of State Highway and Transportation
Officials (AASHTO), Washington D.C., (2007).
AASHTO T 209-07. Standard Method of Test for Theoretical Maximum Specific
Gravity and Density of Hot Mix Asphalt (HMA), American Association of
State Highway and Transportation Officials (AASHTO), Washington
D.C., (2007).
AASHTO T 269-07. “Standard Method of Test for Percent Air Voids in
Compacted Dense and Open Asphalt Mixtures.” American Association of
State Highway and Transportation Officials (AASHTO), Washington
D.C., (2007).
AASHTO T 30-08. Standard Method of Test for Mechanical Analysis of
Extracted Aggregate, American Association of State Highway and
Transportation Officials (AASHTO), Washington D.C., (2008).
AASHTO T 308-08. Standard Method of Test for Determining the Asphalt
Content of Hot-Mix Asphalt (HMA) by the Ignition Method, American

178
Association of State Highway and Transportation Officials (AASHTO),
Washington D.C., (2008).
AASHTO T 312-07. Standard Method of Test for Preparing and Determining the
Density of Hot Mix Asphalt (HMA) Specimens by Means of the
Superpave Gyratory Compactor, American Association of State Highway
and Transportation Officials (AASHTO), Washington D.C., (2007).
AASHTO T321-07. “Standard Test Method for Determining the Fatigue Life of
Compacted Hot-Mix Asphalt (HMA) Subjected to Repeated Flexural
Bending.” American Association of State Highway and Transportation
Officials (AASHTO), Washington D.C., (2007).
ASTM D7460-10. “Standard Test Method for Determining Fatigue Failure of
Compacted Asphalt Concrete Subjected to Repeated Flexural Bending.”
ASTM International, West Conshohocken, PA, (2010).
Advanced Asphalt Technologies, LLC (2008). “Developing a Plan for Validating
an Endurance Limit for HMA Pavements: HMA Endurance Limit
Validation Study,” National Cooperative Highway Research Program
Project 9-44.
Bonnaure, F.P., Huibers, A.H.J.J., Boonders, A. (1982). “A Laboratory
Investigation of the Influence of Rest Periods on the Fatigue Response of
Bituminous Mixes,” Proceedings, Association of Asphalt Paving
Technologists, Vol. 51, Kansas City, Missouri.
Brown, S. F., Hakim, B. and Thom, N. H., (2004). “Performance and
Rehabilitation of Heavy-Duty Pavements in the UK: Some Case Studies.”

179
Proceedings of the International Symposium on design & construction of
long lasting asphalt pavement. Auburn, Alabama. pp. 811-829.
Carpenter, S. H., Ghuzlan, K. A., and Shen, S. (2003). “Fatigue Endurance Limit
for Highway and Airport Pavement.” Transportation Research Record,
No. 1832, pp. 131-138.
Carpenter, S. H., and Shen, S. (2005). “Application of the Dissipated Energy
Concept in Fatigue Endurance Limit Testing.” Transportation Research
Record, No. 1929, pp. 165-173.
Carpenter, S. H., and Shen, S. (2006). “Dissipated Energy Approach to Study
Hot-Mix Asphalt Healing in Fatigue.” Transportation Research Record,
No. 1970, pp. 178-185.
Carpenter, S. H. and Shen, S. (2009). “Effect of Mixture Variables on the Fatigue
Endurance Limit for Perpetual Pavement Design.” Proceedings
International Conference on Perpetual Pavements. Columbus, Ohio 2009.
Chehab, G. R., Kim, Y. R., Schapery, R. A., Witczak, M. W., and Bonaquist, R.
(2003). “Characterization of Asphalt Concrete in Uniaxial Tension Using
a Viscoelastoplastic Continuum Damage Model.” Journal of the
Association of Asphalt Paving Technologists, Vol. 72: 315-355.
Clear, C. A. (1985). “The Effect of Autogenous Healing upon Leakage of Water
Through Crack Initiation and Arresting in Epoxy.” International Journal
of Fracture, Vol. 55(3): 209-222.
Daniel, J.S. (2001). “Development of a Simplified Fatigue Test and Analysis
Procedure Using a Viscoelastic, Continuum Damage Model and its

180
Implementation to WesTrack Mixtures.” Doctoral dissertation, North
Carolina State University, Raleigh, NC.
Daniel J.S. and Kim, Y.R. (2002). “Development of a Simplified Fatigue Test and
Analysis Procedure Using a Visco-Elastic Continuum Damage Model.”
Journal of the Association of Asphalt Paving Technologists, Vol. 71: 619-
650.
Edvardsen, C (1999). “Water Permeability and Autogenous Healing of Cracks in
Concrete.” ACI Materials Journal, Vol. 96(4): 448–454.
Epps, A. L., Harvey, J. T., and Monismith, C. L. (1999). “Performance
Characteristics of Mixes Containing Asphalt Cements and Crumb Rubber
Modified Binders.” Symposium on Asphalt, Number One Thermoplastic
Polymer as part of the 217th American Chemical Society Meeting,
Anaheim, California, March 1999.
Freund, L. B., and Suresh, S. (2003). Thin Film Materials: Stress, Defect
Formation and Surface Evolution. Cambridge University Press,
Cambridge, United Kingdom.
Ghuzlan, K., and Carpenter, S. H. (2000). “Energy-Derived, Damage-Based
Failure Criterion for Fatigue Testing.” Transportation Research Record,
No. 1723, pp. 141–149.
Ghuzlan, K (2001). “Fatigue damage analysis in asphalt concrete mixtures based
upon dissipated energy concepts,” thesis, presented to University of
Illinois at Urbana-Champaign, IL, in partial fulfillment of the
requirements for the degree of Doctor of Philosophy.

181
Goodrich, J.L. (1988). “Asphalt and Polymer Modified Asphalt Properties
Related to the Performance of Asphalt Concrete Mixes.” Proceedings of
Association of Asphalt Paving Technologists Technical Sessions, Vol. 57,
Williamsburg, VA, pp. 116–175.
Harvey, J. T., Deacon, J.A., Taybali, A.A., and Leahy, R.B. (1997). “A
Reliability-Based Mix Design and Analysis System for Mitigating
Fatigues Distress.” Proceedings of the 8th International Conference on
Asphalt Pavements, Vol. 1. University of Washington, Seattle, WA, pp.
301-323.
Hibbeler, R.C. (2005). Mechanics of Materials. Prentice-Hall, Inc., Upper Saddle
River, NJ.
Jud, K., and Kausch, H. H. (1979). “Load Transfer Through Chain Molecules
After Interpenetration at Interfaces.” Polymer Bulletin, Vol. 1, pp. 697–
707.
Kias, E.M.C. (2008). “Laboratory Evaluation of Cracking in Asphalt Concrete.”
Master’s Thesis, University of New Mexico, Albuquerque, NM.
Kim, Y.R. (1988). “Evaluation of Healing and Constitutive Modeling of Asphalt
Concrete by Means of Theory of Nonlinear Viscoelasticity and Damage
Mechanics.” Doctoral dissertation, Texas A & M University, College
Station, TX.
Kim, Y. R., Lee, H. J., and Little, D. N. (1997a). “Fatigue Characterization of
Asphalt Concrete using Visco-Elasticity and Continuum Damage Theory.”

182
Journal of the Association of Asphalt Paving Technologists, Vol. 66, pp.
520-569.
Kim, Y. R., Lee, H. J, Kim, Y, and Little, D. N. (1997b). “Mechanistic evaluation
of fatigue damage growth and healing of asphalt concrete: Laboratory and
field experiments.” Proceedings of the 8th International Conference on
Asphalt Pavements, ISAP, Seattle, Washington, August 10-14, 1089-1107.
Kim, Y., Allen, D. H., and Little, D. N. (2005). “Damage-induced Modeling of
Asphalt Mixtures through Computational Micromechanics and Cohesive
Zone Fracture.” Journal of Materials in Civil Engineering, ASCE, 17(5),
pp. 477-484.
Kim, Y.R. (2008). Modeling of Asphalt Concrete. McGraw-Hill Professional,
New York.
Kravchenko, P.E. (1964). Fatigue Resistance. Oxford; Pergamon Press, New
York.
Leahy, R.B., Hicks, R.G., Monismith, C.L., and Finn, F.N. (1995). “Framework
for Performance-Based Approach to Mix Design and Analysis.”
Proceedings of the Association of Asphalt Paving Technologists, Vol. 64,
pp 431-473.
Lee, H.J., Daniel, J.S., Kim, Y.R. (2000). “Continuum Damage Mechanics-Based
Fatigue Model of Asphalt Concrete.” Journal of Materials in Civil
Engineering, Vol. 12(2), pp. 105-112.
Lee, H. J., J. Y. Choi, Y. Zhao, and Y. R. Kim (2002). “Laboratory Evaluation of
the Effects of Aggregate Gradation and Binder Type on Performance of

183
Asphalt Mixtures.” In Proceedings of the Ninth International Conference
on Asphalt Pavements, Copenhagen, Denmark. 2002.
Little, D. N., Lytton, R. L., Williams, D., and Kim, Y. R. (1999). “An Analysis of
the Mechanism of Microdamage Healing Based on the Applications of
Micromechanics First Principles of Fracture and Healing.” Journal of the
Association of Asphalt Paving Technologists, Vol. 68, pp. 501–542.
Lytton, R.L. (2000). “Characterizing Asphalt Pavements for Performance.”
Transportation Research Record, No. 1723, pp. 5–16.
Matthews, J., Monismith, C. L., and Craus, J. (1993). “Investigation of
Laboratory Fatigue Testing Procedures for Asphalt Aggregate Mixtures.”
Journal of Transportation Engineering, Vol. 119, pp. 634-654.
Mechanistic-Empirical Pavement Design Guide – A Manual of Practice (Interim
Edition). American Association of State Highway and Transportation
Officials (AASHTO), Washington D.C., (2008).
Monismith, C. L., and Epps, J. A. (1970). “Asphalt Mixture Behavior in Repeated
Flexure.” Report No. TE 70-5, Institute of Transportation and Traffic
Engineering, University of California, Berkley.
Mun, S., Guddati, M. N., and Kim, Y. R. (2004). “Fatigue Cracking Mechanisms
in Asphalt Pavements with Viscoelastic Continuum Damage Finite-
Element Program.” Transportation Research Record, No. 1896, pp. 96-
106.

184
Park, S.W., Kim, Y. R., and Schapery, R.A. (1996). ‘‘A Viscoelastic Continuum
Damage Model and its Application to Uniaxial Behavior of Asphalt
Concrete.’’ Mechanics of Materials, Vol. 24(4), pp. 241–255.
Petersen, J. C. (1984). “Chemical Composition of Asphalts Related to Asphalt
Durability: State of the Art.” Transportation Research Record, No. 999,
pp. 13–30.
Pierce, L. M. and Mahoney, J.P. (1996). “Asphalt Concrete Overlay Design Case
Studies.” Transportation Research Record, No. 1543, pp 3-9.
Priest, A.L. (2006). “Methodology and Calibration of Fatigue Transfer Functions
for Mechanistic-Empirical Flexible Pavement Design.” NCAT Report 06-
03, National Center for Asphalt Technology, Auburn University,
Alabama.
Pronk, A.C., and P.C. Hopman (1990). “Energy Dissipation: The Leading Factor
of Fatigue.” Highway Research: Sharing the Benefits, Proceedings of the
Conference, the United States Strategic Highway Research Program
(SHRP), London.
Pronk, A.C., “Comparison of 2 and 4-Point Fatigue Tests and Healing in 4-Point
Dynamic Bending Test based on the Dissipated Energy Concept.”
Proceedings of the 8th
International Conference on Asphalt Pavements,
Seattle, Washington, USA, 1997.
Prowell, B., Brown, E. R., Daniel, J., Bhattacharjee, S., Von Quintus, H.,
Carpenter, S. H., Shen, S., Anderson, M., Swamy, A. K., and
Maghsoodloo, S. (2008). “Endurance Limit of Hot Mix Asphalt Mixtures

185
to Prevent Fatigue Cracking in Flexible Pavements.” Updated Draft Final
Report, NCHRP 9-38, National Cooperative Highway Research Program,
Washington, D.C.
Prowell, B., Brown, E. R., Anderson, M., Daniel, J., Swamy, A. K., Von Quintus,
H., Shen, S., Carpenter, S. H., Bhattacharjee, S., and Maghsoodloo, S.
(2010). “Validating the Fatigue Endurance Limit for Hot Mix Asphalt.”
NCHRP Report 6-46, National Cooperative Highway Research Program,
Washington, D.C.
Romero, P., Stuart, K.D., and Mogawer, W. (2000). “Fatigue Response of Asphalt
Mixtures Tested by the Federal Highway Administration’s Accelerated
Loading Facility.” Journal of the Association of Asphalt Paving
Technologists, Vol. 69, pp. 212-235.
Roberts, F.L., Kandhal, P.S., Brown, E.R., Lee, D.Y., and Kennedy, T.W. (1996).
Hot mix asphalt materials, mixture design, and construction. NAPA
Education Foundation, Lanham, MD.
Rowe, G.M. (1993). “Performance of the Asphalt Mixtures in the Trapezoidal
Fatigue Test.” Journal of Association of Asphalt Paving Technologists, 62,
344-384.
Rowe, G.M. and Bouldin, M.G. (2000). “Improved Techniques to Evaluate the
Fatigue Resistance of Asphaltic Mixtures.” Proceedings of 2nd
Eurasphalt
& Eurobitumen Congress, Barcelona, Spain 2000.

186
Schapery, R. A. (1984). “Correspondence Principles and a Generalized J-integral
for Large Deformation and Fracture Analysis of Viscoelastic Media.”
International Journal of Fracture, Vol. 25, pp. 195–223.
Schapery, R. A. (1990). “A Theory of Mechanical Behavior of Elastic Media with
Growing Damage and Other Changes in Structure.” Journal of the
Mechanics and Physics of Solids, Vol. 38, pp. 215–253.
Shen, L. and Carpenter, S. H. (2005). “Application of Dissipated Energy Concept
in Fatigue Endurance Limit Testing,” Transportation Research Record,
No. 1929, pp. 165-173.
Stavrinidis, B., and Holloway, D. G. (1983). “Crack Healing in Glass.” Physics
and Chemistry of Glasses, Vol. 24(1), pp. 19–25.
Sukhotskaya, S. S., Mazhorava, V. P., and Terekhin, Y. N. (1983). “Effect of
Autogenous Healing of Concrete Subjected to Periodic Freeze–Thaw
Cycles.” Journal of Hydrotechnical Construction, Vol. 17(6), pp. 295–
296.
Swamy, A. K. (2011). “Evaluating Mode of Loading Effect and Laboratory
Fatigue Performance of Asphalt Concrete using Viscoelastic Continuum
Damage Mechanics.” Doctoral dissertation, University of New
Hampshire, Durham, NH, 2011.
Swamy, A. K. and J. S. Daniel. (2011). “Modeling Flexural Fatigue Behavior
using Viscoelastic 19 Continuum Damage Mechanics Principles.”
Proceedings of Engineering Mechanics Institute 2011, Boston, USA.

187
Tangella, R., Craus, J., Deacon, J.A., and Monismith, C.L. (1990). “Summary
Report of Fatigue Response of Asphalt Mixtures.” SHRP-A/IR-90-011,
Institute of Transportation Studies, University of California, Berkley.
Tarefder, R. A. and Bateman, D. (2010) “Future Design of Perpetual Pavements
for New Mexico,” Final Report, Submitted to Research Bureau, New
Mexico Department of Transportation, 2010.
Tayebali, A. A., Deacon, J. A., Coplantz, J. S., Harvey, J. T., and Monismith, C.
L. (1992). “Fatigue Response of Asphalt-Aggregate Mixes.” Report No.
SHRP A-404, Strategic Highway Research Program, National Research
Council, Washington, D.C.
Thompson, M.R., ad Carpenter, S.H. (2004). “Design Principles for Long Lasting
Pavement,” Proceedings, International Symposium of Design and
Construction of Long Lasting Asphalt Pavements, National Center for
Asphalt Technology, Auburn, AL.
Thompson, M. and Carpenter, S.H. (2006). “Considering Hot-Mix-Asphalt
Fatigue Endurance Limit in Full-Depth Mechanistic-Empirical Pavement
Design.” Proceedings International Conference on Perpetual Pavement
Design (CD-ROM), Columbus, OH.
Thompson, M. and Carpenter, S.H. (2009). “Perpetual Pavement Design: An
Overview.” Proceedings of the 2009 International Conference on
Perpetual Pavement, Columbus, OH, 2009.
Timm, D., H., and Young, J., B. (2004). “Effects of Load Spectra and Variability
on Perpetual Pavement Design.” Proceedings, International Symposium of

188
Design and Construction of Long Lasting Asphalt Pavements, National
Center for Asphalt Technology, Auburn, AL.
Underwood, B.S. and Kim, Y.R. (2009). “Analytical Techniques for Determining
the Endurance Limit of Hot Mix Asphalt Concrete,” Proceedings of the
2009 International Conference on Perpetual Pavement, Columbus, OH
2009.
Van Dijk, W., and Vesser, W. (1977). “The Energy Approach to Fatigue for
Pavement Design.” Journal of Association of Asphalt Paving
Technologists, Vol. 46, pp. 1–40.
Von Quintus, H.L., Mallela, J., and Jiang, J. (2004). “Quantifications of the
Effects of Polymer-Modified Asphalt for Reducing Pavement Distress.”
ER-215, Asphalt Institute, Lexington, KY.
Walubita, L. (2006). “Comparison of Fatigue Analysis Approaches for Predicting
Fatigue Lives of Hot-Mix Asphalt Concrete (HMAC) Mixtures.” Thesis,
presented to University of Texas A&M, TX, in partial fulfillment of the
requirements for the degree of Doctor of Philosophy.
Willis, J.R. and Timm, D.H. (2009). “A Comparison of Laboratory Fatigue
Thresholds to Measured Strains in Full-Scale Pavements.” Proceedings,
International Conference on Perpetual Pavements, Columbus, Ohio 2009.
Zhou, F., Hu, S., Chen, D., and Scullion, T. (2007). “Overlay Tester: Simple
Performance Test for Fatigue Cracking.” Transportation Research
Record, No. 2001, pp. 1-8.

189
APPENDICES

190
APPENDIX A1
DESIGN OF OPTIMAL PERPETUAL PAVEMENT

191
Design of Optimal Perpetual Pavement Structure
Rafiqul A. Tarefder1, and Damien Bateman
2
Abstract
In this study, combinations of layer, stiffness, and thickness that produce an
optimal perpetual pavement are determined for implementation on New Mexico
State highways. Using a number of trial designs in the Mechanistic Empirical
Pavement Design Guide (MEPDG), pavement performances are determined and
analyzed for 50 year design life. It is shown that the required thickness of
perpetual pavement varies from 10 to 15 in. for moderate to high truck traffic
roads. One example is a pavement that has a 3 in. surface layer containing a fine
asphalt mix and a 7 in. intermediate layer that uses a coarse asphalt mix. This
perpetual pavement carries up to 180 million equivalent single axle loads
(ESALs) over its 50 year design life. Low bottom-up fatigue cracking (< 12%) as
1 Assistant Professor, Department of Civil Engineering, University of New Mexico, MSC01 1070,
Albuquerque, NM 87131, Phone: (505) 277 6083, Fax: (505) 277 1988, Email:
[email protected]; Corresponding Author.
2 Graduate Research Assistant and Ph.D. Candidate, Department of Civil Engineering, University
of New Mexico, MSC01 1070, Albuquerque, NM 87131, Phone: (505) 277 3222, Fax: (505) 277
1988, Email: [email protected]

192
well as little or no top-down cracking (< 0.2 ft/mi) are observed at the end of 50
years. Rutting in the intermediate layer is also low (< 0.05 in.) at the end of the
10-year maintenance cycle. Overall, fatigue cracking is not a major concern in the
design of perpetual pavements for New Mexico’s conditions, rather rutting is
more of a concern. For implementation of the perpetual pavements, a resurfacing
plan is recommended to remove rutting (if > 0.1″) in the top surface every 10
year. Additionally, perpetual pavements with and without rich binder layers
(RBLs) are examined in this study. Recommends are made for using a perpetual
pavement that does not include a RBL based on life cycle cost analysis. Another
factor that is investigated in this study is de-bonding of Hot Mix Asphalt (HMA)
layers. Analysis shows that 88% of the perpetual pavements may fail by top-down
cracking if de-bonding occurs between two HMA layers. Bottom-up cracking
increases significantly in a de-bonded environment.
Key Words
Perpetual pavement, MEPDG, stiffness, de-bonding, rutting, fatigue, HMA, top-
down cracking, design, ESAL, rich binder layer.
1 Associate Professor, Department of Civil Engineering, University of New Mexico, MSC01
1070, Albuquerque, NM 87131, Phone: (505) 277 6083, Fax: (505) 277 1988, Email:
[email protected]; Corresponding Author.
2 Graduate Research Assistant and Ph.D. Candidate, Department of Civil Engineering, University
of New Mexico, MSC01 1070, Albuquerque, NM 87131, Phone: (505) 277 3222, Fax: (505) 277
1988, Email: [email protected]

193
Introduction
Traditionally, asphalt pavements have been designed for a 20-year life, whereas
perpetual pavements are expected to perform for 50 years or more (Newcomb
2002, Nunn and Ferne 2001, Mahoney et al. 2007). Perpetual pavement in this
study is defined as an asphalt pavement designed and built to last 50 years or
more without requiring major structural rehabilitation or reconstruction. With
perpetual pavements, the potential for traditional fatigue cracking is reduced, and
pavement distress is typically confined to the upper layer of the structure
(Walubita and Scullion 2007). Thus, when surface distress reaches a critical level,
an economical solution is to remove and replace the top layer (Prowell et al.
2006). The perpetual pavement concept can be used for any pavement structure
where it is desirable to minimize rehabilitation and reconstruction costs as well as
minimize closures to traffic. These considerations are especially important on
high-traffic volume freeways where user delay costs may be prohibitive. In
particular, in urban areas where new roads are being built, use of perpetual
pavements may minimize future costs due to user delays and construction.
Perpetual asphalt pavement is a very appealing alternative to concrete pavements,
especially for large metropolitan areas (Scholz et al. 2006, Merrill et al. 2006).
Perpetual pavement has been around for long time (Romanoschi 2008). While
there are some successes with perpetual pavements, there is a big gap in our
understanding the design of this pavement (Harvey 2004, Yang 2006). The main
issue with the current perpetual pavement design method is that it does not ensure

194
optimum structure and/or layers that have yet to satisfy 50 year design periods.
However, through a sound scheme of varying layer, thickness, and stiffness of
pavement layers, it is possible to obtain optimal asphalt pavement structures that
will last 50 years or more requiring only periodic top surface replacement. Such
scheme should include mechanistic pavement design methodology, materials
selection to improve rutting and fatigue resistance, prediction of performance, and
life-cycle cost analysis (Tarefder et al. 2009).
Another critical issue with perpetual pavement design is that some of the most
important factors related to pavement longevity are not adequately addressed by
existing design approaches. In particular, the effects of interlayer de-bonding can
be principal factor in reduction of pavement performance over time, yet this effect
is only accounted for in a relatively crude manner (Tarefder et al. 2009, Scullion
2006). Thus, another goal of this study is to examine the effects of bonding/de-
bonding on the design life of perpetual pavements. Having de-bonded layers
within the HMA structure, fatigue cracking may initiate at the de-bonded
interface, which may results in more severe the consequences on the pavement’s
fatigue life.
Yet another important issue regarding perpetual pavement design is the possibility
of using perpetual pavement designs with binder ‘rich bottom layer’ or so called
rich binder layer (RBL). Conceptually, this layer is softer or flexible than
traditional binder layer so as to accommodate higher number of load repetition

195
without showing up any bottom-up cracking. Another way to prevent this bottom-
up cracking is just by reducing the magnitude of the tensile strain at the bottom of
the binder layer through use of thicker layer. Whether RBL layer has been
associated with moisture infiltration issue, the thicker layer is related to cost
issues (Walubita and Scullion 2007, Wills and Timm 2006). To this end, it is
attempted in this study whether a perpetual pavement can be design without RBL
and if so, then how economical it will be.
Objectives and Scope
The specific objectives of this study are to:
Determine the optimal perpetual pavement structure using the
mechanistic-empirical design approach to develop and evaluate design
alternatives based on pavement layer, stiffness, and thickness. Also,
perform a Life Cycle Cost Analyses (LCCA) to assess the most
economic design among the alternative designs which pass the design
life criteria of 50 years or more.
Examine whether there is a need for a RBL in the design of perpetual
pavement structure in New Mexico.
Examine the behavior of the layers’ interface due to non-bonding and
bonding environments.

196
Structure of a Perpetual Pavement
A perpetual pavement a wear-resistant and renewable top layer, a rut-resistant
intermediate layer, and a fatigue-resistant base layer (Asphalt Institute 2004, Hass
et al. 2006). Figure 1 shows the structure of the perpetual pavement that is used
in this study. It contains treated subgrade, granular base and a thick asphalt mat on
top. The asphalt mat comprises of three different asphalt layers: surface course,
intermediate course, and base course.
HMA Surface Layer: The choice of the HMA surface layer depends on the
functional requirements, which could be a combination of comfort, durability,
stability, skid resistance and noise reduction. There may be additional
requirements like surface water drainage or very low water impermeability. A
wide range of bituminous surface layer products can be considered appropriate
depending on specific requirements. In some instances, the use of a conventional
dense-graded Superpave mixture is adequate (Christopher and McGuffey 1997).
In very high-traffic areas, the use of Stone Matrix Asphalt (SMA) may be
attractive. In other instances, an Open Graded Friction Course (OGFC) is used to
reduce splash and spray and to provide better skid resistance during rainstorms
(Martin et al. 2001). An OGFC is considered to be a non-structural layer and
therefore, it is not used pavement performance calculations in this study (MEPDG
Interim Guide 2008). Rather, a dense-graded fine Superpave mix is considered as
a surface layer.

197
HMA Intermediate Layer: HMA intermediate layer is the middle layer designed
specifically to carry most of the traffic load. Therefore, it must be rut-resistant and
durable. Rut resistance can best be provided by using stone-on-stone contact in
the coarse aggregate and using binders having appropriate high-temperature
properties such as high performance grade (PG) binders (Sides and Uzzan 2009,
Timm and Newcomb 2006).
HMA Base layer: HMA base layer is designed specifically to resist fatigue
cracking. Two approaches can be used to resist fatigue cracking in the base
layer. First, the total pavement thickness can be made great enough such that the
tensile strain at the bottom of the base layer is insignificant. Alternatively, the
HMA base layer could be made using an extra-flexible HMA. This can be most
easily accomplished by increasing the asphalt content of the base layer. As such,
the base layer is called rich binder layer (RBL). Recently, the need for the rich
bottom fatigue layer has been questioned especially when the total HMA
thickness is greater than 12 inches (Tarefder et al. 2008, Sargand 2009).
Review of Current Practices
There have been several state DOT, FHWA, and AASHTO studies involving the
design, construction, and testing of existing perpetual pavements (Powers 2007,
Rowe et al. 2001, AMEC 2007, Scholz et al. 2007, Mahoney 2001, Krebs 2008,
Battaglia 2009, Green 2008, Renteria 2008, Scullion 2006). In this study, these all
the state DOTs are contacted through email, fax, and phone (not survey) to collect

198
perpetual pavement data such as the number of pavement layer, thickness, and
stiffness, design method, and field performance. Table 1 shows 17 states’
perpetual pavement data. This is not an exhaustic list. There are states and
agencies which have perpetual pavements but very little to no information on the
perpetual pavements are available. However, the current list suffices the purpose
of data gathering, which is to have a sense of mean and range of layer thickness,
stiffness, and number of layers used in perpetual pavements. Table 1 presents the
perpetual pavement sections built by their respective state highway agency,
surface course life, design life, traffic volume, layer thickness, stiffness, and
performance grade (PG) binder. Also shown in Table 1 is some statistical analysis
of the data. The mean layer thickness is determined as well as the range (standard
deviation) of thicknesses for each asphalt layer. This information is used in the
Section 5 to determine an optimal perpetual pavement structure based on layer,
thickness, and stiffness. From Table 1, it can be seen that polymer modified
binders are more commonly used in surface and intermediate layers, in order to
prevent rutting. The use of polymer-modified binders in base layers is rare. Based
on the literature reviewed, only one state DOT (i.e., Illinois DOT) out of 17 has
used a polymer-modified binder in its base layer.
In perpetual pavement design concept, the tensile strain at the bottom of the
asphalt layer is kept so small that the fatigue life of the base layer becomes
virtually infinite (Prowell et at. 2006, Von Quintus 2006). The limiting strain that
leads to this infinite fatigue life is called endurance limit. An endurance limit or

199
limiting strain of 70 μ (micro-strain) is the most common value used (Garcia and
Thomas 2008, Carpenter 2006). To ensure limiting strain, currently two main
approaches are used. The first approach is the construction of a bottom lift for the
base layer with rich in binder content (i.e., RBL layer). The second approach is
the increase of the total thickness of asphalt layers. Table 2 presents state DOTs
that use a RBL in their perpetual pavements. Some DOTs decided against using a
RBL as the potentially higher permeability of Superpave mixtures might allow
moisture to infiltrate and become entrapped and this would lead to premature
stripping of the HMA (Mueller 2007, Tarefder et al. 2005, AMEC 2007, Maupin
2001, Harm 2001). Maryland and Oregon DOTs do not include a RBL in their
respective perpetual pavements, I-695 and I-5 (Scholz et al. 2006, Renteria 2008,
Powers 2007). Texas, California and Ohio DOTs use both RBLs and polymer
modified binders in their respective base and upper asphalt layers, to prevent
fatigue cracking and rutting (Walubita and Scullion 2007, Martin et al. 2001,
Green 2008).
Also shown in the last column of Table 2 is the design method used for each state
perpetual pavement. Many US states still use AASHTO 1993 Pavement Guide for
the design of perpetual pavements, such as Kansas, Washington, Oregon and New
Jersey (Romanoschi 2008, Mahoney 2001, Scholz et al. 2006, Rowe et al. 2001).
Several states have come up with their own mechanistic empirical design method
such as California, Illinois and Texas, while others are in the process of
developing a mechanistic-empirical method (Asphalt Institute 2004, Walubita and

200
Scullion 2007, Harvey et al. 2004). In this study, AASHTO’s Mechanistic
Empirical Pavement Design Guide (MEPDG) is used to analyze perpetual
pavement design alternatives.
Perpetual Pavement Design Alternatives
Design alternatives are developed based on a test matrix of varying design
parameters used as inputs to MEPDG. Design trials are created based on layer
stiffness and thickness. Traffic volume, climate, and pavement distress criteria
are selected to represent traffic and climatic conditions of New Mexico.
Pavements that pass the predefined performance criterion are considered
perpetual pavements. In addition, HMA mixes used in successful perpetual
pavements are analyzed with particular emphasis on performance in the
intermediate and rich binder layers. LCCA is employed for final selection of
perpetual pavements.
Input Matrix
An input matrix is devised to combine these parameters as level 3 input to
MEPDG. Table 3 presents the input matrix. This input matrix is created to
determine how a perpetual pavement performs based on the individual layer
thicknesses, HMA mix design, and PG-binder grades. Traditionally, NMDOT
allows only one type of materials in untreated base course, which are granular
materials or granular base (GB). The thickness of the granular base in New
Mexico traditionally varies from 6 to 10 inches. The granular base thickness is set

201
to 6 in. to reduce the trial designs. The thickness of the treated subgrade layer is
12 in.
Review of NMDOT projects reveal that most of the NMDOT flexible pavement
thicknesses fall below 15 inches (Tarefder and Damien 2010). Therefore, the
maximum thickness of HMA layer is set to 15 in. The surface layer thickness
varies from 1.5 to 3 inches. The RBL thickness varies from 3 to 7 inches all over
the United States (Tarefder and Damien 2009). A RBL layer thickness of 5 inches
is the mean thickness taken from 38 perpetual pavement data collected. From this
data the standard deviation is also calculated and used to determine the range of
thicknesses of the rich-binder layers. The thicknesses of the intermediate layer are
calculated based on the total HMA layer thickness minus the surface and RBL
layers. An additional 2 and 4 inches are subtracted from the resulting intermediate
layer thickness to account for total thickness of 11 and 13 inches. Adjustments are
made here to reduce the total thickness so as to produce more feasible alternatives
for NMDOT.
Other parameters that are varied in the matrix are the mix design and the binder’s
Performance Grade (PG). Two modified PG binders are used in the surface and
intermediate layers. These are PG 76-22 and PG 70-22 binders. PG 64-22 is used
in the rich binder layer for flexibility. The input matrix contains 3213 runs. The
number of runs is calculated using the formula below:

202
where T1 = thickness of surface layer, T3 = thickness of rich binder layer, 15-T1-T3
= thickness of intermediate layer, SuperPave (SP) Mix1 = SP-II, Mix2 = SP-III,
Mix3 = SP-IV, PG1 = PG 70-22, and PG2 = PG 76-22, and SP = SuPerPave
(Superior Performing Pavement).
Table 4 shows Superpave mix gradations used by NMDOT. Mix SP-II is a coarse
mix. Mixes SP-III and SP-IV are fine mixes. As it can be seen from Table 4, mix
SP-IV contains higher percentage of fine aggregates (% passing < #200 sieve)
than mix SP-III. Therefore, mixes SP-III and SP-IV are used in the surface course.
The intermediate and RBL layers use mix type SP-II, SP-III, and SP-IV. The
percentage air voids and effective binder content are shown in Table 4. They are
set to the criterion specified by the NMDOT for these mixes. The surface and
intermediate HMA mix designs contain 6% air voids. In New Mexico, HMA
mixes are compacted at 6±1% air voids in the field but designed at 4±1% air
voids. The RBL contains 3% air voids. In general, rich binder layers use a higher
percentage of binder than traditional surface mix. The extra binder fills the voids
in the mineral aggregate and thus creates a low air-void mix.
Design Simulations
The MEPDG Version 1.0 is used for running design simulations. The MEPDG is
based on mechanistic-empirical principles, where mechanistic part assumes that

203
pavement can be modeled as a multi-layered elastic structure and the empirical
part related stress-strain to common term pavement distresses such as rutting,
fatigue cracking, roughness (NCHRP 2008). There are three levels of inputs in the
MEPDG analyses. In Level 1, materials properties such as dynamic modulus of
asphalt concrete and resilient modulus of soils and aggregate are obtained from
laboratory tests. In Level 2, these properties are determined using existing or local
correlation equations. In Level 3, the dynamic and resilient moduli are calculated
from index properties such as soil classification, plasticity, aggregate gradation,
binder content, etc. using nationally calibrated correlations or equations. The
MEPDG’s level 3 analysis is calibrated to nationwide standards. However, it
would be more beneficial if level 1 analysis is used where the MEPDG is
calibrated to meet local highway standards (NCHRP 2008). Unfortunately, this
has yet to be done in New Mexico. So level 3 analysis is performed in this study
to determine optimal perpetual pavement structure.
There are options available in MEPDG when considering fatigue cracking. One
option is including a fatigue endurance limit for the pavement. A fatigue
endurance limit considers the tensile strain experienced at the bottom of the HMA
layer under traffic loading. If the tensile strain remains below the endurance limit,
the pavement will have an infinite fatigue life. The fatigue endurance limit of
NMDOT mixes are not known yet. Therefore, this study did not use fatigue
endurance limit criteria. Rather, it uses the nationally calibrated fatigue model

204
which predicts the percentage fatigue cracking (MEPDG 2008, MEPDG Interim
Guide 2008).
Traffic and Climatic Data
The functional classification of traffic, appropriate traffic class and growth factors
are selected for designing perpetual pavements to last 50 years or more for major
highways in New Mexico. The basic required MEPDG input data is Annual
Average Daily Traffic (AADT), percentage of trucks in the design direction and
on the design lane, operational speed, and traffic growth rate (MEPDG 2008,
MEPDG Interim Guide 2008). For this study, all other required traffic inputs,
such as monthly and hourly truck distribution, truck class distribution, axle load
distributions, and some other general traffic inputs, are derived from the design
guide level 3 or default values. Table 5(a) presents the traffic volumes used in this
study. Table 5(a) also shows the equivalent number of ESALs to enhance the
understanding of design traffic for 50+year perpetual pavements. The AADTTs
used are 1750, 5000, and 10000 with a truck traffic classification (TTC) factor of
1, which considers predominantly single trailer trucks (Class 9 traffic). Traffic
growth is similar to typical New Mexico interstate traffic growth which is 4%.
Two lanes and 50 percent trucks in the design direction, operational speed of 70
mph, and vehicle tire pressure of 120 psi are used in this study.
Climate conditions may play a significant role in the performance of perpetual
pavements. Pavements located in semi-arid regions require specific design criteria

205
to withstand the extreme temperature changes. The climatic data used in this
study is taken from the weather station at Albuquerque, New Mexico. The water-
table depth is known to below 10 ft depth. Variations in climatic inputs are not
considered for perpetual pavement design in this study.
Base and Subgrade Input Data
The granular base consisted of compacted crushed gravel with a resilient modulus
(MR) of 20000 psi. The natural subgrade also contains A-5 material with MR of
5000 psi. The resilient modulus (MR) of the treated subgrade (TSG) is 8000 psi.
The MEPDG does not include a special type 9 of material (for example:
engineered materials) for treated subgrade, so this layer is treated as sandy soil
(A-4) with an increased modulus of 8000 psi (MEPDG Interim Guide 2008).
Distress Criterion
The pavement performance criteria are shown in Table 5(b) (MEPDG Interim
Guide 2008). Pavements are considered failed when the predicted distresses are
equal to these target distress values. The MEPDG predicted results are analyzed
based on surface-down cracking, fatigue cracking, AC rutting, total rutting, and
International Roughness Index (IRI) over a period of 50 years. In this study
however, priority is given to fatigue (bottom-up) cracking and asphalt concrete
(AC) rutting. Indeed, the definition of a perpetual pavement is that a pavement
having no bottom-up fatigue failure. Fatigue cracking is a major contributor to
pavement failure and requires costly reconstruction. IRI is not considered in

206
selecting perpetual pavement designs, because periodic resurfacing of optimal
perpetual pavement is planned with 3/4 in. open graded friction course (OGFC),
which is assumed to take care of the IRI requirement. In this study, the predicted
distress at the end of 50 years is directly compared to the target distress values
shown in Table 5(b). These target distress values are recommended by the
MEPDG for primary highway routes. Ideally, one should consider the reliability
of distress model which is not considered in this study.
Analysis of Simulation Outputs Using Flow Charts
Using the inputs and performance criteria described above, MEPDG simulations
are run for 50 years. From the outputs of 3213 simulations run, it is observed that
none of the pavements experienced any thermal cracking over a period of 50
years. The use of modified binders and the location of the climate data
(Albuquerque) might have reduced the impact of thermal cracking on the
pavements analyzed. None of the 3213 pavements failed by surface-down
cracking (> 700ft/mi). Thus, further investigation falls into the category of rutting
and bottom-up (fatigue) cracking, which is done through flow charts in the next
two sections.
Two options are sought for selecting perpetual pavement from 3213 simulation
outputs. In option one, the pavements that pass the performance criteria at the end
of 50 years do not need to be resurfaced. In option two, the assumption is it is
most likely that the pavement top surface will deteriorate due to exposure, and

207
therefore, use 0.75 in. thick OGFC as a non-structural layer in every 10 year
cycle.
Perpetual Pavements with No Resurfacing
In this section, perpetual pavements are identified that last 50 years without
requiring resurfacing. A flow chart of 3213 perpetual pavements is created based
on the performance criteria mentioned earlier and is illustrated in Figure 2(a). It
can be seen that when fatigue cracking criteria of ≤ 20% at the end of 50 years is
applied, only 8 pavements fail. Interestingly, thin pavements failed at relatively
high annual average daily truck traffic (5000 AADTT). It can be noted that
AADTT of 10000 is not applied to pavements with asphalt concrete (AC)
thickness < 10″. Top-down and thermal cracking criterion (≤ 700ft/mi) is then
applied to the remaining 3205 pavements and here it can be seen that none of the
pavements failed by this performance criterion. However, when total rut criterion
of ≤ 0.5″ is applied, none of the pavements pass. Figure 2(a) illustrates that using
total rut criterion of ≤ 0.5″ and fatigue cracking ≤ 20%, no perpetual pavements
can be found. The 8 eight pavements which failed by bottom-up cracking all have
8″ asphalt thickness and carry 5000 AADTT. None of these pavements contain a
rich binder layer. As a next step, the rutting distress criterion is lifted from 0.5 to
0.75″. Once again, none of the pavements passed this criterion as Figure 2(b)
illustrates.

208
Since none of the pavements passed the performance criterion for total rutting
(AC + base + subgrade), priority is given to those pavements that pass by only
AC rutting. Pavements that pass this criterion can have their subgrade material
modified to prevent rutting in this layer. Hence, Figure 3(a) presents a flow chart
which screens 3213 perpetual pavements based on AC rut criterion ≤ 0.25″ at the
end of 50 years. It can be seen that about 405 perpetual pavements pass for AC rut
≤ 0.25″ and fatigue cracking ≤ 20%. However, all of these pavements have 15″
AC thickness for AADTT of 1750. In New Mexico, pavement thickness ranges
from 4 to 10 inches. Therefore, a pavement with 15 inch AC layer thickness is not
a viable option in New Mexico and therefore, thick pavements (AC greater than
10 inch) are not considered for further analysis. No perpetual pavements can be
found using 5000 and 10000 AADTT.
As a next step, AC rut failure criterion is increased from 0.25 to 0.5″ at the end of
50 years. Based on a flow chart plotted in Figure 3(b), additional pavements are
considered for further analysis. For AC rut ≤ 0.5″ and fatigue cracking ≤ 20%,
perpetual pavements can be found for the following;
For 1750 AADTT – 509 have 11″ and 648 have 13″ HMA thickness
For 5000 AADTT – 5 have 14″ and 808 have 15″ HMA thickness
For 10000 AADTT – 64 have 15″ HMA thickness
Findings
Table 6(a) presents perpetual pavements with 14″ HMA thickness and AADTT of
5000. All 5 pavements have a 3″ surface layer, 4″ intermediate layer, and 7″ RBL.

209
All of these pavements use PG 76-22 in their surface layers. All of these
pavements have 8000 psi resilient modulus (MR) in the treated subgrade layer.
Perpetual Pavements with Resurfacing
Figure 4(a) presents the same performance criteria (AC rut ≤ 0.25″) but
resurfacing (using 0.75 inch non-structural OGFC) is considered every 10 years,
if needed. Resurfacing is required if pavements show AC rutting of more than
0.25″ at the end of 50 years. Therefore, every 10 years pavements are allowed to
have 0.05″ AC rutting. Thus at the end of 20 years, pavements are allowed to
have 0.1″ AC rutting. Pavements failing this performance criterion need
resurfacing (AC1 rut → 0) and combined rutting in the intermediate and base
layers are checked for having AC2 + AC3 ≤ 0.05″ rutting every 10 years. At the
end of 30 years, pavements are allowed to have 0.15″ rutting and so on. This
criterion is checked against AC rut of intermediate and base AC layers but not for
surface layers. This is logical as the surface layer is expected to have some OGFC
treatment at 10 year intervals to maintain surface IRI and smoothness criteria.
Therefore, in the analysis, rutting of the AC layer is set to zero after each
maintenance cycle or 10 year.
For AC rut ≤ 0.25″ and fatigue cracking ≤ 20%, perpetual pavements can be as
follows:
For 1750 AADTT – 329 pavements have 11″, 621 pavements have
13″, and 293 pavements have 15″ HMA thickness

210
For 5000 AADTT – 5 pavements have 14″ and 766 have 15″ HMA
thickness
For 10000 AADTT – 41 pavements have 15″ HMA thickness
Pavements with 14″ HMA thickness and 5000 AADTT are the same pavements
mentioned earlier. Figure 4(b) presents a flow chart of pavements that are checked
against AC rut criterion of 0.5″ at the end of 50 years. Resurfacing is also
considered here if pavements show ≥ 0.1″ AC rutting after 10 years. Combined
rutting in the intermediate and base layers is also monitored (AC2 + AC3 rut ≤
0.1). For AC rut ≤ 0.5″ and fatigue cracking ≤ 20%, perpetual pavements can be
found as follows;
For 1750 AADTT – 37 pavements have 11″ HMA thickness
For 5000 AADTT – 9 pavements have 10″, 17 pavements have 11″, 13
pavements have 12″, and 4 pavements have 15″ HMA thickness
For 10000 AADTT – 357 pavements have 15″ HMA thickness
Findings
It can be seen that for 10000 AADTT, most of the perpetual pavements obtained
are 15 inch thick. A pavement of 10 inch is considered very high and not feasible
in New Mexico. Therefore, it is concluded that for very high traffic it is not
possible to find a perpetual pavements thinner than 0 inch. Also, from the above
discussion it can be seen that a number of perpetual pavements can be obtained
for low traffic (AADTT 1750) roads. Ideally, perpetual pavements are not needed

211
for low traffic road. To this end, this continues to further analyze the perpetual
pavement design alternatives obtained for 5000 AADTT. From the above
discussion, itt is shown that 9 perpetual pavements have 10″ HMA thickness and
17 perpetual pavements have 11″ HMA thickness, each carrying 5000 AADTT,
that pass the performance criteria for fatigue cracking and AC rutting.
Perpetual Pavements for 5000 AADTT
Table 6(b) presents perpetual pavements with 10″ AC thickness and 5000
AADTT. These pavements have shown to have the highest performance and the
lowest thickness (10″). Material properties and pavement response data of these
eight pavements are also shown. These perpetual pavements can carry up to 5000
annual average daily truck traffic (AADTT). This traffic is equivalent to 32
million ESALs at the end of 20 years, and 165 million ESALs at the end of 50
years.
Run 2739 is not feasible due to lift thickness of the surface layer and
the nominal size aggregate in this mix (SP-III).
The remaining eight pavements have 3″ surface layer and use fine
mixes (SP-III, SP-IV) and PG 76-22 in this layer.
Six out the eight pavements have a 4″ intermediate layer.
Two out of the eight pavements do not have a RBL, but they have
thicker intermediate layers (7″).
All of these pavements have 8000 psi resilient modulus (MR) in their
treated subgrade.

212
None of the pavements pass the total rut criterion of 0.75″.
Resurfacing must be considered as total rutting will not be as high if
the pavement is maintained every 10 years.
It can be noted that 10″ pavements carrying 5000 AADTT show very high rutting
in the subgrade. Subgrade rutting is a major contributor to the failure of all
pavements to pass the total rut criterion of 0.75″. However, by improving the
material stiffness (MR) of the subgrade from 5000 psi to 15,500 psi (Default for
A-5 material in MEPDG), subsequent rutting in this layer reduces, as Figure 5
illustrates. Figure 5 also shows the effect of this change to total rutting. Points to
note from this analysis: Subgrade rutting reduces by 60% and total rutting reduces
by 30% due to improved MR (from 5000 psi to 15500 psi) in the subgrade.
However, AC rutting slightly increases in all of the pavements shown in Figure 5.
Table 7 ranks the perpetual pavements having 11″ HMA thickness (5000
AADTT) based on AC rut criterion (AC2+AC3 ≤ 0.1″ after 10 years).
Some of these pavements have AC1 = 0.09″. However, these
pavements are not feasible due to lift thickness of the surface layer and
the nominal size aggregate in this mix (SP-III). SP-III mix requires a
minimum lift thickness of 2.5″.
All of these pavements contain a RBL.
All of these pavements have 8000 psi resilient modulus (MR) in their
treated subgrade.

213
Top-down cracking increases by 100% due to increased stiffness in the
subgrade. However, all of the pavements pass the top-down cracking
performance criterion (≤ 700ft/mi).
Rutting in the combined AC2 and AC3 layers does not change due to
increased stiffness in the subgrade.
Evaluate Design Alternatives Based on Life Cycle Cost Analysis
LCCA is performed to evaluate the feasibility of these design alternatives, in
particular to identify the one that may be the most cost-effective to build and
maintain. The candidate costs that are considered in a LCC analysis are: initial
construction, maintenance, rehabilitation, salvage value, user delay (during future
maintenance or resurfacing), and vehicle operating cost. The first four are agency
costs that typically have the most impact on strategy selection. However, when
considered, the last two user costs can have major effects on the selection of a
strategy that is most cost-effective overall (Walls and Smith 1998). National lime
association’s LCCA program is used to determine the most economic design
(National Lime Association 2003).
Based on the findings of this study, eight perpetual pavements can be
implemented in the State of New Mexico based. Eight design alternatives are
consolidated to these two groups: group one is a perpetual pavement without RBL
and group two is a perpetual pavement with RBL. The LCAA parameters are
shown in Table 8. The LCCA model input data for both pavements is identical
214
except for initial costs of construction. Traffic is about 5000 AADTT in one
direction. All other traffic inputs are taken from MEPDG level 3 default values.
User costs are those costs that are accrued by the user of the facility during the
construction, maintenance and/or rehabilitation and everyday use of a roadway
section. Work zone user costs are costs usually associated with construction,
maintenance, and rehabilitation activities that restrict the normal traffic flow.
Mean life cycle cost is compared between RBL versus no RBL pavements.
Analysis
Alternative 1: Perpetual Pavement (No RBL)
3″ Surface HMA = $100/cy
7″ Intermediate HMA = $110/cy
6″ Granular Base = $42/cy
12″ Treated Subgrade = $36/cy
Perpetual Pavement costs about $288/cy
Alternative 2: Perpetual Pavement (with RBL)
3″ Surface HMA = $100/cy
4″ Intermediate HMA = $110/cy
3″ Rich Binder HMA = $120/cy
6″ Granular Base = $42/cy
12″ Treated Subgrade = $36/cy
Perpetual Pavement costs about $408/cy

215
Estimated initial construction of the perpetual pavement with the rich binder layer
is higher due to presence of three HMA different layers that require specific
construction practices (lift compaction, density, etc.). Resurface rehabilitation is
done every 10 years. It involves 0.75″ mill and fill with OGFC. User cost (lane
rental fee) for a high-volume facility is considered to be $10,000 lane-mi/day.
LCCA is performed over 50 years with a discount rate of 4%.
Results
Mean Life Cycle Cost ($) Per Lane Mile:
Perpetual Pavement (No RBL) = $2.3 million
Perpetual Pavement (RBL Incl.) = $3.3 million
It can be seen that Alternative 1 (no RBL) has a lower life cycle cost than
Alternative 2 (RBL Included), which is expected.
Evaluate Impacts of Removing a Layer of a Perpetual Pavement
This study investigates whether the need for a rich binder layer (RBL) to
minimize fatigue damage is justified. It is also debated whether selected perpetual
pavement structures can be made less complex by removing the rich binder
layers. As such, 50 perpetual pavements are selected from based on low AC
rutting for carrying 5000 AADTT. Pavements analyzed in this section are further
reduced from 50 to 21 due to removal of the RBL. By removing this layer, many
of the 50 reference pavements become identical in design and material properties.
Figure 6 highlights the effects of removing the rich binder layer from the

216
pavement structure. The X and Y axes on Figures 6(a) and (b) have the same scale
and the 45° line indicates where rutting values for both cases (with and without a
RBL) are the same. Figure 6(a) and 6(b) clearly shows that there is an increase in
rutting in both the AC and subgrade layers due to removal of the RBL. Rich
binder layers are generally used to minimize bottom-up fatigue cracking. An
increase in rutting might be due to the reduced thickness of the pavement where
stress intensity might have increased. As expected, Figure 7 shows a significant
increase in fatigue cracking even though none of the pavements failed. Pavements
that include RBLs show fatigue cracking ranging from 0–2%. However,
pavements that do not have RBLs show fatigue cracking ranging from 3–35%.
Minimizing fatigue cracking is important and the presence of a RBL ensures that
the pavements shown in this study do not fail by fatigue cracking for 50 years or
more.
Determine Effects of De-bonding on Perpetual Pavement Performance
In this study, the effects of HMA layer de-bonding on the performance of selected
perpetual pavements are determined using MEPDG. The MEPDG program for
flexible pavements accounts for bonding in terms of complete bonding or no
bonding. Eight optimal perpetual pavements passing the design life criteria of 50
years or more, shown in Table 6(b), are analyzed for bonding and de-bonding.
These eight optimal perpetual pavements have 10″ HMA thickness and carry
5000 AADTT. The results are then compared to the same pavements with full
bonding between HMA layers.

217
Figure 8(a) presents MEPDG predicted top-down cracking in eight HMA
perpetual pavements carrying 5000 AADTT at the end of 50 years for bonded and
de-bonded cases. It can be seen here that all but one of the pavements fail (> 700
ft/mi) when there is complete de-bonding between all of the HMA layers with
predicted top-down cracking in excess of 10,000 ft/mi for six of the eight
pavements. These six pavements are predicted to fail within 2 years. The
pavement that did not fail (Run 2751) showed an increase from 0.2 to 75 ft/mi.
However, not all HMA layers are expected to experience de-bonding. Usually de-
bonding occurs in the upper HMA layers due to the presence of moisture. Hence,
analysis is done to determine the effect of de-bonding in upper HMA layers. Once
again, the same eight pavements shown above are used in this analysis. Figure
8(b) presents predicted top-down cracking for these eight pavements with de-
bonding occurring in the top two asphalt layers. None of the pavements fail but a
significant increase in top-down cracking is predicted.
Predicted bottom-up cracking is presented in Figure 9(a) for the same 8 perpetual
pavements shown earlier. Bottom-up cracking has increased significantly (150 –
700%) in all eight pavements with two of them failing (> 20%). The failed
pavements do not contain a rich binder layer and are predicted to fail at the end of
20 years. Figure 9(b) presents predicted bottom-up cracking for eight perpetual
pavements that have de-bonding in their upper asphalt layers. Bottom-up cracking
increases in all of the pavements with two of them failing (> 20%). These two

218
pavements do not contain rich binder layers and they are predicted to fail after 30
years.
In terms of AC rutting, all of the pavements are predicted to have more than twice
the amount of AC rutting than those with bonded HMA layers. This is illustrated
in Figure 10(a) where AC rutting increases from 0.2 to 0.5″ at the end of 50 years.
However, all eight pavements still pass the AC rut criterion (≤ 0.5″ after 50 years)
even with de-bonded HMA layers. When there is de-bonding in only the upper
asphalt layers, AC rutting is once again shown to be very high. Figure 10(b)
shows that AC rutting increases from 0.2 to 0.46″ which is almost the same as the
predicted AC rutting with de-bonding in all HMA layers. Thus, from this analysis,
we can say that preventing de-bonding of upper asphalt layers will reduce
potential AC rutting.
Summary of De-Bonding Study
A total of 7 out of 8 perpetual pavements with de-bonded HMA layers
fail by top-down cracking (< 700 ft/mi) at the end of 50 years.
For bottom-up cracking ≤ 20%, 2 of the 8 pavements failed due to de-
bonding of all asphalt layers. Bottom-up cracking also significantly
increased in the remaining 6 pavements (150 – 700%).
AC Rutting more than doubled (0.2 to 0.5″) in all of the pavements
due to the de-bonding of all HMA layers. However, none of the
pavements failed by AC rutting.

219
De-bonding of upper asphalt layers still causes a significant increase in
top-down cracking. However none of the pavements fail. A significant
increase in bottom-up cracking is also noted, as well as AC rutting. AC
rutting values are similar to those values predicted when all HMA
layers are de-bonded. Hence, preventing de-bonding of upper asphalt
layers will significantly reduce potential AC rutting.
Implementation Note
This study suggests two perpetual pavements: with and without RBL, which can
be implemented in the State of New Mexico. These are presented below:
Option One: Implementable Perpetual Pavement (with RBL)
Choice one (pavement trial no. 2725), presented in Figure 11(a), has 3″ surface
layer, 4″ intermediate layer, and 3″ rich binder layer. A fine mix (SP-IV) is used
in both the surface and rich binder layers. A coarse mix (SP-II) is used in the
intermediate layer. Stiffer PG binders are used in the surface and intermediate
layers, and a softer binder, PG 64-22, is used in the rich binder layer. Both the
surface and intermediate layers are compacted to traditional 6% air voids, while
the rich binder layer has to contain a non-traditional 3% air voids. This pavement
is shown to have very low fatigue cracking (< 2%) and top-down cracking (< 0.5
ft/mi), as well as little or no rutting in the intermediate and base layers at the end
of 50 years.

220
Option Two: Optional Perpetual Pavement (without RBL)
Base on the life cycle cost analysis, it is evident that the use of rich binder layer is
not an economic option. Pavement structure can be designed to meet perpetual
pavement performance requirements without a RBL. Figure 11(b) presents an
optimal perpetual pavement (pavement trial No. 2751) that does not contain a rich
binder layer. This pavement has 3″ surface layer and 7″ intermediate layer. A fine
mix (SP-IV) is used in the surface layer and a coarse mix (SP-II) is used in the
intermediate layer. Both or these HMA layers contain modified binders and 6%
air voids. Fatigue cracking, at the end of 50 years, is about 12% which is well
below the failure value of 20%. It shows virtually no top-down or low-
temperature (transverse) cracking. Very low rutting is predicted in the surface
layer (< 0.2″) and intermediate layer (< 0.05″) at the end of 50 years.
A key factor of any implementation plan is to have a successful maintenance plan
that fixes the rut in the top surface (if > 0.1″) every 10 years. This way, perpetual
pavements can perform as expected and maintain a very high level of
performance over the 50 year design life. Another major concern of perpetual
pavement, as well as any pavement, is potential de-bonding of HMA layers. De-
bonding of HMA layers due to moisture can cause significant top-down and
bottom-up cracking, which can lead to failure of these pavements. The selected
perpetual pavements are implementable but procedures must be enforced to
prevent moisture from initiating de-bonded environments.

221
Conclusions
In this study, an optimal perpetual pavement is determined. This is done through a
full analysis of design alternatives based on layer stiffness and thickness, as well
as quantification of the impact of removing RBL layer and consideration of
various degrees of de-bonding between layers of a perpetual pavement section.
The findings of this study are summarized below:
From a total of 3213 MEPDG simulations, it is shown that none of the
pavements experienced any thermal cracking. The use of modified
binders and the location of the climate data (Albuquerque) might have
reduced the impact of thermal cracking on the pavements analyzed.
None of the 3213 pavements failed by surface-down cracking. For
criteria: bottom-up cracking ≤ 20% at the end of 50 years, only 8
pavements failed.
For AC rut ≤ 0.25″ and fatigue cracking ≤ 20% at the end of 50 years
(no rehab), 405 perpetual pavements are found to pass. However, all of
these pavements have 15″ AC thickness for AADTT of 1750. No
perpetual pavements can be found using 5000 and 10000 AADTT.
For AC rut ≤ 0.5″ and fatigue cracking ≤ 20% at the end of 50 years
(thin resurfacing every 10 years), 37 perpetual pavements are found to
have 11″ thickness for carrying 1750 AADTT. Perpetual pavements
carrying 1750 and 5000 AADTT are also found using 10″ (9
pavements), 11″ (17 pavements), and 12″ AC thickness (13

222
pavements). Perpetual pavements carrying 10000 AADTT all have 15″
AC thickness (293 pavements).
By increasing the subgrade resilient modulus (MR) from 5000 psi to
15,500 psi (Default for A-5 material in MEPDG), subsequent rutting in
this layer reduces by 60% and total rutting reduces by 30%. Therefore,
improved subgrade is an important factor for perpetual pavement
design.
Perpetual pavements are found both with and without rich binder layer
(RBL). Life cycle cost analysis of these perpetual pavements shows
that perpetual pavements that do not contain a RBL are the most
economic design. Perpetual pavements of 10″ thickness (for 5000
AADTT) can be designed without RBL layers. Indeed, 2 perpetual
pavements without RBL have shown to have performance similar to 7
perpetual pavements with RBL layer (10″ thickness, 5000 AADTT).
When RBL layer is removed in certain perpetual pavements, predicted
AC and base/subgrade rutting increases significantly, as well as
bottom-up cracking increases. However, this is not the case in all
simulations. Some perpetual pavements without an RBL did not fail by
rutting or bottom-up cracking. A combination of appropriate mix
design and sufficient layer thickness may be the reason for this.
A total of 8 perpetual pavements are studied for de-bonding. MEPDG
analysis shows that 7 out of 8 perpetual pavements with de-bonded
HMA layers fail due to top-down cracking criterion (< 700 ft/mi) at

223
the end of 50 years. For bottom-up cracking ≤ 20%, 2 of the 8
pavements failed. Bottom-up cracking also significantly increased in
the de-bonded pavements (150 – 700%). AC Rutting more than
doubled (0.2 to 0.5″) in all of the pavements due to the de-bonding of
all HMA layers. However, none of the pavements failed by AC rutting.
For New Mexico’s pavement conditions (using MEPDG), it is shown
that fatigue cracking is not a major concern for designing perpetual
pavements, rather rutting is more of a concern.
Acknowledgements
This project is funded by New Mexico Department of Transportation. The authors
would like to thank the project sponsor: Larry Velasquez (District 3 Engineer,
NMDOT), project advocate: Jeff Mann (Head of Pavement Design, NMDOT),
project technical panel: Bob Meyers (Geotechnical Section Manager, NMDOT),
Robert McCoy (Head of Pavement Exploration, NMDOT), and Parveez Anwar
(State Asphalt Engineer, NMDOT), Steve Von Stein (FHWA representative and
Pavement Engineer), and Scott McClure (Research Bureau Chief), and project
manager: Virgil Valdez (Research Bureau, NMDOT) for valuable suggestions
during quarterly meeting (every three month) throughout the entire duration (2-
year) of the project. Special thanks to Pranav Shrestha for his computer-support to
accomplish thousands of MEPDD simulation runs.

224
References
AASHTO T 166. “Standard Method of Test for Bulk Specific Gravity of
Compacted Hot Mix Asphalt (HMA) Using Saturated Surface-Dry
Specimens.” American Association of State Highway and Transportation
Officials (AASHTO), Washington D.C., (2007).
AASHTO T 269. “Standard Method of Test for Percent Air Voids in Compacted
Dense and Open Asphalt Mixtures.” American Association of State
Highway and Transportation Officials (AASHTO), Washington D.C.,
(2007).
AASHTO T321-07. “Standard Test Method for Determining the Fatigue Life of
Compacted Hot-Mix Asphalt (HMA) Subjected to Repeated Flexural
Bending.” American Association of State Highway and Transportation
Officials (AASHTO), Washington D.C., (2007).
ASTM D7460-10. “Standard Test Method for Determining Fatigue Failure of
Compacted Asphalt Concrete Subjected to Repeated Flexural Bending.”
ASTM International, West Conshohocken, PA, (2003).
Advanced Asphalt Technologies, LLC (2008). “Developing a Plan for Validating
an Endurance Limit for HMA Pavements: HMA Endurance Limit
Validation Study,” National Cooperative Highway Research Program
Project 9-44.
Bonnaure, F.P., Huibers, A.H.J.J., Boonders, A. (1982). “A Laboratory
Investigation of the Influence of Rest Periods on the Fatigue Response of

225
Bituminous Mixes,” Proceedings, Association of Asphalt Paving
Technologists, Vol. 51, Kansas City, Missouri.
Brown, S. F., Hakim, B. and Thom, N. H., (2004). “Performance and
Rehabilitation of Heavy-Duty Pavements in the UK: Some Case Studies.”
Proceedings of the International Symposium on design & construction of
long lasting asphalt pavement. Auburn, Alabama. pp. 811-829.
Carpenter, S. H., Ghuzlan, K. A., and Shen, S. (2003). “Fatigue Endurance Limit
for Highway and Airport Pavement.” Transportation Research Record,
No. 1832, pp. 131-138.
Carpenter, S. H., and Shen, S. (2005). “Application of the Dissipated Energy
Concept in Fatigue Endurance Limit Testing.” Transportation Research
Record, No. 1929, pp. 165-173.
Carpenter, S. H., and Shen, S. (2006). “Dissipated Energy Approach to Study
Hot-Mix Asphalt Healing in Fatigue.” Transportation Research Record,
No. 1970, pp. 178-185.
Carpenter, S. H. and Shen, S. (2009). “Effect of Mixture Variables on the Fatigue
Endurance Limit for Perpetual Pavement Design.” Proceedings
International Conference on Perpetual Pavements. Columbus, Ohio 2009.
Chehab, G. R., Kim, Y. R., Schapery, R. A., Witczak, M. W., and Bonaquist, R.
(2003). “Characterization of Asphalt Concrete in Uniaxial Tension Using
a Viscoelastoplastic Continuum Damage Model.” Journal of the
Association of Asphalt Paving Technologists, Vol. 72: 315-355.

226
Clear, C. A. (1985). “The Effect of Autogenous Healing upon Leakage of Water
Through Crack Initiation and Arresting in Epoxy.” International Journal
of Fracture, Vol. 55(3): 209-222.
Daniel J.S. and Kim, Y.R. (2002). “Development of a Simplified Fatigue Test and
Analysis Procedure Using a Visco-Elastic Continuum Damage Model.”
Journal of the Association of Asphalt Paving Technologists, Vol. 71: 619-
650.
Di Benedetto, H., Ashayer Soltani, M.A. and Chaverot, P., (1997). “Fatigue
Damage for Bituminous Mixtures.” Proceedings of the 5th
Int. RILEM
Symposium MTBM, Lyon 1997, pp. 263-270.
Edvardsen, C (1999). “Water Permeability and Autogenous Healing of Cracks in
Concrete.” ACI Materials Journal, Vol. 96(4): 448–454.
Epps, A. L., Harvey, J. T., and Monismith, C. L. (1999). “Performance
Characteristics of Mixes Containing Asphalt Cements and Crumb Rubber
Modified Binders.” Symposium on Asphalt, Number One Thermoplastic
Polymer as part of the 217th American Chemical Society Meeting,
Anaheim, California, March 1999.
Freund, L. B., and Suresh, S. (2003). Thin Film Materials: Stress, Defect
Formation and Surface Evolution. Cambridge University Press,
Cambridge, United Kingdom.
Ghuzlan, K., and Carpenter, S. H. (2000). “Energy-Derived, Damage-Based
Failure Criterion for Fatigue Testing.” Transportation Research Record,
No. 1723, pp. 141–149.

227
Ghuzlan, K (2001). “Fatigue damage analysis in asphalt concrete mixtures based
upon dissipated energy concepts,” thesis, presented to University of
Illinois at Urbana-Champaign, IL, in partial fulfillment of the
requirements for the degree of Doctor of Philosophy.
Harvey, J. T., Deacon, J.A., Taybali, A.A., and Leahy, R.B. (1997). “A
Reliability-Based Mix Design and Analysis System for Mitigating
Fatigues Distress.” Proceedings of the 8th International Conference on
Asphalt Pavements, Vol. 1. University of Washington, Seattle, WA, pp.
301-323.
Hibbeler, R.C. (2005). Mechanics of Materials. Prentice-Hall, Inc., Upper Saddle
River, NJ.
Hopman, P.C., Kunst, P.A.J.C. and Pronk, A.C. (1989). “A Renewed
Interpretation Method for Fatigue Measurements, Verification of Miner’s
Rule.” 4th Eurobitumen Symposium, Madrid, Spain, Vol. 1, pp. 557-561.
Jud, K., and Kausch, H. H. (1979). “Load Transfer Through Chain Molecules
After Interpenetration at Interfaces.” Polymer Bulletin, Vol. 1, pp. 697–
707.
Kim, Y. R., Lee, H. J., and Little, D. N. (1997a). “Fatigue Characterization of
Asphalt Concrete using Visco-Elasticity and Continuum Damage Theory.”
Journal of the Association of Asphalt Paving Technologists, Vol. 66, pp.
520-569.
Kim, Y. R., Lee, H. J, Kim, Y, and Little, D. N. (1997b). “Mechanistic evaluation
of fatigue damage growth and healing of asphalt concrete: Laboratory and

228
field experiments.” Proceedings of the 8th International Conference on
Asphalt Pavements, ISAP, Seattle, Washington, August 10-14, 1089-1107.
Kim, Y., Allen, D. H., and Little, D. N. (2005). “Damage-induced Modeling of
Asphalt Mixtures through Computational Micromechanics and Cohesive
Zone Fracture.” Journal of Materials in Civil Engineering, ASCE, 17(5),
pp. 477-484.
Kim, Y.R. (2008). Modeling of Asphalt Concrete. McGraw-Hill Professional,
New York.
Leahy, R.B., Hicks, R.G., Monismith, C.L., and Finn, F.N. (1995). “Framework
for Performance-Based Approach to Mix Design and Analysis.”
Proceedings of the Association of Asphalt Paving Technologists, Vol. 64,
pp 431-473.
Lee, H.J., Daniel, J.S., Kim, Y.R. (2000). “Continuum Damage Mechanics-Based
Fatigue Model of Asphalt Concrete.” Journal of Materials in Civil
Engineering, Vol. 12(2), pp. 105-112.
Little, D. N., Lytton, R. L., Williams, D., and Kim, Y. R. (1999). “An Analysis of
the Mechanism of Microdamage Healing Based on the Applications of
Micromechanics First Principles of Fracture and Healing.” Journal of the
Association of Asphalt Paving Technologists, Vol. 68, pp. 501–542.
Lytton, R.L. (2000). “Characterizing Asphalt Pavements for Performance.”
Transportation Research Record, No. 1723, pp. 5–16.

229
Matthews, J., Monismith, C. L., and Craus, J. (1993). “Investigation of
Laboratory Fatigue Testing Procedures for Asphalt Aggregate Mixtures.”
Journal of Transportation Engineering, Vol. 119, pp. 634-654.
Mechanistic-Empirical Pavement Design Guide – A Manual of Practice (Interim
Edition). American Association of State Highway and Transportation
Officials (AASHTO), Washington D.C., (2008).
Monismith, C. L., and Epps, J. A. (1970). “Asphalt Mixture Behavior in Repeated
Flexure.” Report No. TE 70-5, Institute of Transportation and Traffic
Engineering, University of California, Berkley.
Mun, S., Guddati, M. N., and Kim, Y. R. (2004). “Fatigue Cracking Mechanisms
in Asphalt Pavements with Viscoelastic Continuum Damage Finite-
Element Program.” Transportation Research Record, No. 1896, pp. 96-
106.
Ott, R. L (2001). An Introduction to Statistical Methods and Data Analysis, 5th
ed. Michael Longnecker, Texas A&M University, Tx.
Park, S.W., Kim, Y. R., and Schapery, R.A. (1996). ‘‘A Viscoelastic Continuum
Damage Model and its Application to Uniaxial Behavior of Asphalt
Concrete.’’ Mechanics of Materials, Vol. 24(4), pp. 241–255.
Petersen, J. C. (1984). “Chemical Composition of Asphalts Related to Asphalt
Durability: State of the Art.” Transportation Research Record, No. 999,
pp. 13–30.
Pierce, L. M. and Mahoney, J.P. (1996). “Asphalt Concrete Overlay Design Case
Studies.” Transportation Research Record, No. 1543, pp 3-9.

230
Priest, A.L. (2006). “Methodology and Calibration of Fatigue Transfer Functions
for Mechanistic-Empirical Flexible Pavement Design.” NCAT Report 06-
03, National Center for Asphalt Technology, Auburn University,
Alabama.
Pronk, A.C. and Hopman, P.C. (1990). “Energy Dissipation: The Leading Factor
of Fatigue. Highway Research: Sharing the Benefits.” Proceedings of the
Conference, the United States Strategic Highway Research Program,
London, UK.
Pronk, A.C. (2008). “Analytical Investigation of the Correctness of Formulas
Used in Bending Beam Tests.” Efficient Transportation and Pavement
Systems: Characterization, Mechanisms, Simulation, and Modeling.
Taylor and Francis Group, London, UK.
Prowell, B., Brown, E. R., Daniel, J., Bhattacharjee, S., Von Quintus, H.,
Carpenter, S. H., Shen, S., Anderson, M., Swamy, A. K., and
Maghsoodloo, S. (2008). “Endurance Limit of Hot Mix Asphalt Mixtures
to Prevent Fatigue Cracking in Flexible Pavements.” Updated Draft Final
Report, NCHRP 9-38, National Cooperative Highway Research Program,
Washington, D.C.
Romero, P., Stuart, K.D., and Mogawer, W. (2000). “Fatigue Response of Asphalt
Mixtures Tested by the Federal Highway Administration’s Accelerated
Loading Facility.” Journal of the Association of Asphalt Paving
Technologists, Vol. 69, pp. 212-235.

231
Rowe, G.M. and Bouldin, M.G. (2000). “Improved Techniques to Evaluate the
Fatigue Resistance of Asphaltic Mixtures.” Proceedings of 2nd
Eurasphalt
& Eurobitumen Congress, Barcelona, Spain 2000.
Schapery, R. A. (1984). “Correspondence Principles and a Generalized J-integral
for Large Deformation and Fracture Analysis of Viscoelastic Media.”
International Journal of Fracture, Vol. 25, pp. 195–223.
Schapery, R. A. (1990). “A Theory of Mechanical Behavior of Elastic Media with
Growing Damage and Other Changes in Structure.” Journal of the
Mechanics and Physics of Solids, Vol. 38, pp. 215–253.
Shen, L. and Carpenter, S. H. (2005). “Application of Dissipated Energy Concept
in Fatigue Endurance Limit Testing,” Transportation Research Record,
No. 1929, pp. 165-173.
Stavrinidis, B., and Holloway, D. G. (1983). “Crack Healing in Glass.” Physics
and Chemistry of Glasses, Vol. 24(1), pp. 19–25.
Sukhotskaya, S. S., Mazhorava, V. P., and Terekhin, Y. N. (1983). “Effect of
Autogenous Healing of Concrete Subjected to Periodic Freeze–Thaw
Cycles.” Journal of Hydrotechnical Construction, Vol. 17(6), pp. 295–
296.
Tangella, R., Craus, J., Deacon, J.A., and Monismith, C.L. (1990). “Summary
Report of Fatigue Response of Asphalt Mixtures.” SHRP-A/IR-90-011,
Institute of Transportation Studies, University of California, Berkley.
Tayebali, A. A., Deacon, J. A., Coplantz, J. S., Harvey, J. T., and Monismith, C.
L. (1992). “Fatigue Response of Asphalt-Aggregate Mixes.” Report No.

232
SHRP A-404, Strategic Highway Research Program, National Research
Council, Washington, D.C.
Thompson, M.R., ad Carpenter, S.H. (2004). “Design Principles for Long Lasting
Pavement,” Proceedings, International Symposium of Design and
Construction of Long Lasting Asphalt Pavements, National Center for
Asphalt Technology, Auburn, AL.
Thompson, M. and Carpenter, S.H. (2006). “Considering Hot-Mix-Asphalt
Fatigue Endurance Limit in Full-Depth Mechanistic-Empirical Pavement
Design.” Proceedings International Conference on Perpetual Pavement
Design (CD-ROM), Columbus, OH.
Thompson, M. and Carpenter, S.H. (2009). “Perpetual Pavement Design: An
Overview.” Proceedings of the 2009 International Conference on
Perpetual Pavement, Columbus, OH, 2009.
Timm, D., H., and Young, J., B. (2004). “Effects of Load Spectra and Variability
on Perpetual Pavement Design.” Proceedings, International Symposium of
Design and Construction of Long Lasting Asphalt Pavements, National
Center for Asphalt Technology, Auburn, AL.
Tsai, B. W., Harvey, J. T., and Monismith, C. L. (2002). “High Temperature
Fatigue and Fatigue Damage Process of Aggregate-Asphalt Mixes.”
Journal of the Association of Asphalt Paving Technologists, Vol. 71, pp.
345–385.

233
Tsai, B. W., Harvey, J. T., and Monismith, C. L. (2003). “Application of Weibull
Theory in Prediction of Asphalt Concrete Fatigue Performance.”
Transportation Research Record, No. 1832, pp. 121-130.
Underwood, B.S. and Kim, Y.R. (2009). “Analytical Techniques for Determining
the Endurance Limit of Hot Mix Asphalt Concrete,” Proceedings of the
2009 International Conference on Perpetual Pavement, Columbus, OH
2009.
Walubita, L. (2006). “Comparison of Fatigue Analysis Approaches for Predicting
Fatigue Lives of Hot-Mix Asphalt Concrete (HMAC) Mixtures.” thesis,
presented to University of Texas A&M, TX, in partial fulfillment of the
requirements for the degree of Doctor of Philosophy.
Willis, J.R. and Timm, D.H. (2009). “A Comparison of Laboratory Fatigue
Thresholds to Measured Strains in Full-Scale Pavements.” Proceedings,
International Conference on Perpetual Pavements, Columbus, Ohio 2009.
Zhou, F., Hu, S., Chen, D., and Scullion, T. (2007). “Overlay Tester: Simple
Performance Test for Fatigue Cracking.” Transportation Research
Record, No. 2001, pp. 1-8.

234
Table 1 – Summary of Perpetual Pavement Data
State PP
Highway/
Interstate
Surface
Life
(yrs)
Design
Life
(yrs)
Traffic Layer Thickness (in) Layer Stiffness PG Binder
AADTT
OGFC/
SMA HMA1 HMA2 HMA3 HMA4 Total GB TSG
GB MR
(psi)
TSG MR
(psi) HMA1 HMA2 HMA3 HMA4
California I-710 19 40 10000 1 OGFC 3 6 3 - 13 6 - - - - 64-40 64-16 -
Illinois I-70 19 30 11760 2 SMA 5.5 10 - - 17.5 8 - - 28000 76-28 76-28 70-22 -
Iowa US-60 15 40 8250 - 2 2 7.5 3 14.5 9 18 50000 20000 64-34 64-34 58-38 58-38
Kansas US-75 (a) - 10 450 - 1.5 2.5 9 - 13 - 6 - 5000 70-28 70-28 70-22 -
US-75 (b) - 10 5000 - 1.5 2.5 7 - 11 - 6 - 2500 70-28 70-28 64-22 -
US-75 (c) - 10 450 - 1.5 2.5 9 - 13 - 6 - 2500 70-28 70-28 64-22 -
US-75 (d) - 20 900 - 1.5 2.5 12 - 16 - 6 - 2500 70-28 70-28 64-22 -
Kentucky I-64 20 40 10000 - 2 9 - - 11 - - 200,000 - 76-22 76-22 - -
I-65 20 40 - - - - - - - - - 200,000 - 76-22 70-20 - -
Maryland I-695 12.5 30 15750 2 SMA 1.5 12 - - 15.5 6 12 30,000 8000 70-20 - - -
Michigan US-24
- - 2.5 3 4.5 - 10 12 14 30,000 5,000 70-28 70-22 70-22 -
I-96 20 40 8900 - 1.5 2.5 10 - 14 16 12 30,000 12,000 76-22 76-22 70-22 -
M-84
- - 1.5 2 3 - 6.5 12 - - 5000 70-28 70-28 58-22 -
Minnesota TH-71
- - 4.5 1.5 - - 6 4.5 - - A-2-4 52-34 - - -
TH-10
- - 3.5 3 3 - 9.5 6 18 30,000 29,500 - 58-28 58-34 -
TH-18
- - 4 3 1.5 - 8.5 4.5 10 30,000 29,500 52-34 52-34 - -
TH-61
- - 3 1 3 2 9 6 12 30,000 29,500 58-28 58-28 58-34 -
I-35 16 30 864 - 4 4 4 - 16 3 9 100,000 22,000 58-28 58-28 64-28 -
New Jersey I-287 12 20 12000 - 2 2 7 - 11 8 10 30,000 32,000 76-22 76-22 64-22 -
New Mexico US-70 8 30 1338
Ohio I-77
- - 1.5 1.75 10 4 17.25 6 - 30,000 - 76-22 76-22 58-28 58-28
US-30 20 50 3747 1.5 SMA 1.75 9 4 - 14.75 6 - 30,000 - 76-22 76-22 64-22 64-22
Oklahoma SH-152 20 50 2000 2 SMA 3 3 3 3 14 - - - 30,000 76-28 64-22 64-22 64-22
Oregon I-5 15 30 12240 2 OGFC 2 8 - - 12 12 - 30,000 - 64-22 64-22 - -
Texas IH-35 (a)
- 3 SMA 3 13 4 - 23 - 8 - 30,000 76-22 70-22 64-22 -
IH-35 (b)
- 3 SMA 3 8 2 - 16 - 8 - 30,000 76-22 70-22 64-22 -
IH-35 (c)
- 3 SMA 3 8 3 - 17 - 8 - 30,000 76-22 70-22 70-22 -
IH-35 (d)
- 1.5 OGFC 2 2 12 4 21.5 - 6 - 30,000 76-22 64-22 64-22 -
IH-35 (e)
- 1.5 OGFC 2 3 10 4 20.5 - 6 - 30,000 76-22 70-22 64-22 -
IH-35 (f)
- 1.5 OGFC 2 3 12 4 20.5 - 6 - 30,000 76-22 70-22 64-22 -
SH-114 20 30 18000 2 HDAMA 3 13 4 - 22 - 8 - 30,000 76-22 70-22 64-22 -
Virginia I-95 - - 2950 1.5 SMA 2 17 - - 20.5 3 6 30,000 30,000 70-22 64-22 - -
Washington I-90 18.5 50 5400 2 SMA 14 - - - 16 12 - 29,500 - 64-22 - - -
Wisconsin STH-50 (a) - 20 770 - 2 3.5 3.5 - 9 4 8 29,500 30,000 58-28 64-22 64-22 -
STH-50 (b) - 20 770 - 2 3.5 3.5 - 9 4 8 29,500 30,000 64-28 58-28 58-28 -
STH-50 (c) - 20 770 - 2 3.5 3.5 - 9 4 8 29,500 30,000 58-28 70-22 70-22 -
I-94 (a) - 20 9476 - 2 4.5 4.5 - 11 4 17 29,500 30,000 76-28 70-22 64-22 -
I-94 (b) - 20 9476 - 2 4.5 4.5 - 11 4 17 29,500 30,000 70-28 70-22 64-22 -
STATISTICAL
ANALYSIS
Average = 17 29 7498 2 3 5 6 3 14 7 9 15,000 12,563 - - -
Std. Dev.= 3.77 12.48 5370 - 2 4 3 1 5 4 4 86603 12,266 - - -
Mode = 20 20 770 - 2 3 3 4 11 6 6 200,000 2500 76-22 70-22 64-22 64-22
Note: AADTT=Annual average daily truck traffic, OGFC=open graded friction coarse, SMA=stone matrix asphalt, HMA=hot mix
asphalt, GB=granular base, MR=resilient modulus, TSG=treated subgrade, and PG=performance grade.

235
Table 2 – Perpetual Pavement Structural Design Information
No. State Pavement
Perpetual Pavement Concept
Design Method
Or Software
Limiting Strain
in Base Layer
Rich Binder
Layer (RBL)
1 California (I-710) 70 µε Yes CIRCLY, CA-4PRS
2 Illinois (I-70) 60 µε No ILLIPAVE
3 Iowa (US-60) 70 µε No -
4 Kansas (US-75) 70 µε Yes
1993 AASHTO,
EVERSTRESS
5 Kentucky (I-695) 70 µε No Mechanistic Design
6 Maryland (I-695) No Yes AASHTO 1993
7 Michigan (US-24) 65 µε Yes -
8 Minnesota (I-35) No No
ELSYM 5,
Von Quintus Cat. 2001
9 New Jersey (I-287) No No -
10 New Mexico (US-70) No Yes Asphalt Institute
11 Ohio (US-30) 70 µε Yes Kenlayer
12 Oklahoma (SH-152) 70 µε Yes PerRoad
13 Oregon (I-5) 70 µε Yes
AASHTO 1993,
WESLEA
14 Texas (SH-114) 70 µε Yes FPS 19W, PerRoad
15 Virginia (I-95) No No -
16 Washington (I-90) No No
AASHTO 1993,
EVERSERIES
17 Wisconsin (STH-50) - Yes
AASHTO 1972,
WisPave
Note: No = no limiting strain or rich-binder used in base layer,
YES = there is a limiting strain or rich binder used in base layer, and
“–” means data is not available.

236
Table 3 – Parameters Used for MEPDG Test Matrix
Layer Type Layer Thickness (in) Mix Design PG Binder
Surface, T1
1.5
2 - 2.5
3
SP-III
SP-IV
76-22
70-22
Intermediate
15-T1-T3
15-T1-T3-2
15-T1-T3-4
SP-II
SP-III
SP-IV
76-22
70-22
Rich Binder
Layer (RBL), T3
3
5
7
SP-II
SP-III
SP-IV
64-22
Granular Base 6
10 A-5 NA
Treated
Subgrade 12 A-5 NA
Note: NA = Not Applicable, SP = SuperPave

237
Table 4 – HMA Mix Gradations (NMDOT specifications)
Mix
Design
Percent Passing Sieve Size % Asphalt
Content
(Volumetric)
% Air
Voids
Lift
Thickness
Range (in) 1 3/4 1/2 3/8 #4 #200
SP-II 95 85 - 55 33 4 9.0 6 3 - 3.5
SP-III 100 97 90 65 41 5 10.5 6 2.5 - 3.5
SP-IV - 100 95 75 45 5.5 11.5 6 1.5 - 3
Granular
Base Stiffness, E = 20,000 psi NA 7 6. - 12
Treated
Subgrade Stiffness, E = 8,000 psi NA 5 10. - 12
Note: SP = SuperPave, NA = Not Applicable

238
Table 5(a) – AADTT and Cumulative ESALs
AADTT Cum. ESALs
1750 57,829,092
5000 165,226,044
10000 330,451,948
Table 5(b) – Performance Criteria of Perpetual Pavements
Performance Criteria Max. Value
Alligator Cracking (% of Lane Area) 20
Total Rutting (in) 0.50
10 Year AC Rutting (in) 0.25
Thermal Cracking (ft/mi) 700
Surface-Down Cracking (ft/mi) 700
International Roughness Index - IRI (in/mi) 200

239
Table 6(a) – Design Criteria of 14″ Perpetual Pavements Carrying 5000 AADTT
Table 6 (b) – Design Criteria of 10″ Perpetual Pavements Carrying 5000 AADTT
Run
Traffic
(AADTT) Surf Itmd. RBL Total GB
Surf.
Mix
Itmd.
Mix
RBL
Mix
Surf.
PG
Itmd.
PG
Top-Down
Cracking
(ft/mi)
Bottom-Up
Cracking
(%)
Thermal
Cracking
(ft/mi)
IRI
(in/mi)
AC1
Rut
(in)
AC2 +
AC3 Rut
(in)
2730 5000 3 4 7 14 6 SP-IV SP-II SP-IV 76-22 76-22 8000 0 0.208 0 96.7 0.09 0.02
2731 5000 3 4 7 14 6 SP-IV SP-III SP-III 76-22 76-22 8000 0 0.362 0 97.9 0.09 0.02
2732 5000 3 4 7 14 6 SP-IV SP-III SP-IV 76-22 76-22 8000 0 0.308 0 98.0 0.09 0.02
2716 5000 3 4 7 14 6 SP-III SP-IV SP-II 76-22 70-22 8000 0 0.458 0 97.5 0.08 0.03
2717 5000 3 4 7 14 6 SP-III SP-IV SP-III 76-22 70-22 8000 0 0.358 0 97.7 0.08 0.03
10 Yr. Predicted DistressLayer Thickness (in) Mix Design PG Binder
Treated
SG MR
(psi)
50 Yr. MEPDG Predicted Distress
Run
Traffic
(AADTT) Surf Itmd. RBL Total GB
Surf.
Mix
Itmd.
Mix
RBL
Mix
Surf.
PG
Itmd.
PG
Top-Down
Cracking
(ft/mi)
Bottom-Up
Cracking
(%)
Thermal
Cracking
(ft/mi)
IRI
(in/mi)
AC1
Rut
(in)
AC2 +
AC3 Rut
(in)
2712 5000 3 4 3 10 6 SP-III SP-IV SP-IV 76-22 70-22 8000 0.48 1.8 0 107.6 0.14 0.05
2711 5000 3 4 3 10 6 SP-III SP-IV SP-III 76-22 70-22 8000 0.41 2.1 0 107.5 0.14 0.05
2710 5000 3 4 3 10 6 SP-III SP-IV SP-II 76-22 70-22 8000 0.31 2.8 0 107.3 0.14 0.05
2744 5000 3 7 - 10 6 SP-III SP-IV - 76-22 70-22 8000 0.45 8.1 0 107.7 0.14 0.05
2726 5000 3 4 3 10 6 SP-IV SP-III SP-IV 76-22 76-22 8000 0.42 1.7 0 107.7 0.16 0.04
2725 5000 3 4 3 10 6 SP-IV SP-II SP-IV 76-22 76-22 8000 0.42 1.6 0 107.4 0.16 0.04
2724 5000 3 4 3 10 6 SP-IV SP-II SP-II 76-22 76-22 8000 0.27 2.5 0 107.2 0.16 0.04
2751 5000 3 7 - 10 6 SP-IV SP-II - 76-22 76-22 8000 0.14 11.8 0 107.1 0.16 0.03
50 Yr. MEPDG Predicted Distress 10 Yr. Predicted DistressPG BinderMix DesignLayer Thickness (in)
Treated
SG MR
(psi)

240
Table 7 – Ranking of 11″ Perpetual Pavements Based on Rutting in AC2 + AC3
Layer Thickness (in) Mix Design PG Binder
TSG
MR (psi)
50 Yr. MEPDG Predicted
Distress
10 Yr. Predicted
Distress
Run
Traffic
(AADTT) Surf Itmd RBL Total GB
Surf.
Mix
Itmd.
Mix
RBL
Mix
Surf.
PG
Itmd.
PG
Top-
Down
Crack
(ft/mi)
Bottom-
Up
Crack
(%)
Therma
l Crack
(ft/mi)
IRI
(in/
mi)
AC1
Rut
(in)
AC2 +
AC3 Rut
(in)
2686 5000 2 6 3 11 6 SP-III SP-II SP-II 70-22 76-22 8000 0.03 1.42 0 105 0.11 0.07
2688 5000 2 6 3 11 6 SP-III SP-II SP-III 70-22 76-22 8000 0.04 1.06 0 105 0.11 0.07
2690 5000 2 6 3 11 6 SP-III SP-II SP-IV 70-22 76-22 8000 0.05 0.90 0 105 0.11 0.07
2695 5000 2 4 5 11 6 SP-III SP-II SP-II 70-22 76-22 8000 0.03 1.50 0 105 0.11 0.08
2697 5000 2 4 5 11 6 SP-III SP-II SP-III 70-22 76-22 8000 0.04 1.16 0 105 0.11 0.08
2699 5000 2 4 5 11 6 SP-III SP-II SP-IV 70-22 76-22 8000 0.05 1.01 0 105 0.11 0.08
2692 5000 2 6 3 11 6 SP-III SP-III SP-II 76-22 76-22 8000 0.02 1.51 0 105 0.09 0.09
2693 5000 2 6 3 11 6 SP-III SP-III SP-III 76-22 76-22 8000 0.03 1.13 0 105 0.09 0.09
2694 5000 2 6 3 11 6 SP-III SP-III SP-IV 76-22 76-22 8000 0.04 0.96 0 105 0.09 0.09
2687 5000 2 6 3 11 6 SP-III SP-II SP-II 76-22 70-22 8000 0.03 1.50 0 105 0.09 0.09
2701 5000 2 4 5 11 6 SP-III SP-III SP-II 76-22 76-22 8000 0.02 1.52 0 105 0.09 0.09
2689 5000 2 6 3 11 6 SP-III SP-II SP-III 76-22 70-22 8000 0.03 1.12 0 105 0.09 0.09
2691 5000 2 6 3 11 6 SP-III SP-II SP-IV 76-22 70-22 8000 0.04 0.95 0 105 0.09 0.09
2702 5000 2 4 5 11 6 SP-III SP-III SP-III 76-22 76-22 8000 0.03 1.18 0 105 0.09 0.09
2696 5000 2 4 5 11 6 SP-III SP-II SP-II 76-22 70-22 8000 0.02 1.52 0 105 0.09 0.09
2698 5000 2 4 5 11 6 SP-III SP-II SP-III 76-22 70-22 8000 0.03 1.18 0 105 0.09 0.09
2700 5000 2 4 5 11 6 SP-III SP-II SP-IV 76-22 70-22 8000 0.04 1.02 0 105 0.09 0.10

241
Table 8 – Input Values for LCCA of Two Perpetual Pavement Types
Alternative 1 Perpetual Pavement (Run
2744) - No RBL Alternative 2
Perpetual Pavement (Run
2710) – RBL Included
Initial Pavement Design Initial Construction Initial Pavement Design Initial Construction
Mean
Std.
Dev COV
Mean
Std.
Dev COV
AADTT = Average
Daily Traffic (one way) 5000 100 10%
AADTT = Average
Daily Traffic
(one way)
5000 100 10%
% T = Percent Trucks 25% 0.025 10% % T = Percent Trucks 25% 0.025 10%
TF = Truck Factor 0.38 0.038 10% TF = Truck Factor 0.38 0.038 10%
G = Growth Rate 4 0.004 10% G = Growth Rate 4 0.004 10%
N = Analysis Period 50
N = Analysis Period 50
PSli = Initial PSI 4.2 0.2814 6.7 PSli = Initial PSI 4.2 0.2814 6.7
PSIt = Terminal PSI 2
PSIt = Terminal PSI 2
Mr = Effective Mr 5000 500 10% Mr = Effective Mr 5000 500 10%
a1 = Surf Layer Coeff. 0.44 0.044 10% a1 = Surf Layer Coeff. 0.44 0.044 10%
a2 = Base Layer Coeff. 0.14 0.014 10% a2 = Base Layer Coeff. 0.14 0.014 10%
m2 = Base Drainage
Coeff. 1 0.1 10%
m2 = Base Drainage
Coeff. 1 0.1 10%
a3 = Subbase Layer
Coeff. 0.11 0.011 10%
a3 = Subbase Layer
Coeff. 0.11 0.011 10%
m3 = Subbase Drainage
Coeff. 1 0.1 10%
m3 = Subbase Drainage
Coeff. 1 0.1 10%
Mill and Fill (in) 0.75
OGFC Mill and Fill (in)
0.75
OGFC
1=US/State, 2=County 1
1=US/State, 2=County 1
Discount Rate, % 4
Discount Rate, % 4
Surf HMA ($/cy) 100 10 10% Surf HMA ($/cy) 100 10 10%
Intermediate HMA
($/cy) 100 11 10%
Intermediate HMA
($/cy) 100 11 10%
Granular Base ($/cy) 42 4.2 10% Granular Base ($/cy) 42 4.2 10%
Treated Subgrade ($/cy) 36 3.6 10% Treated Subgrade ($/cy) 36 3.6 10%
Surface Treatment
($/lane-mi) 10000 1000 10%
Surface Treatment
($/lane-mi) 10000 1000 10%
Rich Binder HMA
($/cy) 120 12 10%

242
Table 9 - Initial Construction and Overlay Costs of Pavements
Pavement
Layer Type
AC Pavement PP1 (No RBL) PP2 (Incl. RBL)
Thickness
(in)
Cost ($)
/cyd
Thickness
(in)
Cost ($)
/cyd
Thickness
(in)
Cost ($)
/cyd
AC 9 100 3 100 3 100
Int. AC - - 7 100 4 100
RBL - - - - 3 120
GB 4 42 6 42 6 42
TSG 12 36 12 36 12 36
Total 25 178 28 278 28 398
Surf. AC = Surface AC, Int. AC = Intermediate AC, RBL = Rich Binder Layer,
GB = Granular Base, TSG = Treated Subgrade, PP = Perpetual Pavement

243
Table 10. New Mexico DOT Treatment Costs (1997)
Flexible Pavement Treatment Mean Cost/
Lane Mile ($)
Fog Sealing 1,156
Crack Sealing 14,600
Chip Sealing 7,893
Open Graded Friction Course Overlay 32,160
Plant Mix Wearing Course Overlay 43,400
2" Hot Mix Overlay 80,960
In Plant Recycle (Brazer) 49,000
Heater Scarification & Overlay (Cutler) 64,125
Microsurfacing 58,560
Cold Mill/Inlay 350,000
Cold In-Situ Recycle Overlay 350,000
Rehabilitation 750,000
Reconstruction 1,835,000

244
Table 11. Construction, Maintenance, and User Costs Comparison
Rehabilitation
Year
AC Pavement PP1(No RBL) PP2(Incl. RBL)
MC($) UC($) MC($) UC($) MC($) UC($)
0 $1,835,000 $10,000 $2,100,000 $10,000 $3,000,000 $10,000
7 $350,000 $10,000 - - - -
10 - - $350,000 $10,000 $350,000 $10,000
14 $350,000 $10,000 - - - -
20 - - $350,000 $10,000 $350,000 $10,000
21 $1,835,000 $10,000 - - - -
28 $350,000 $10,000 - - - -
30 - - $350,000 $10,000 $350,000 $10,000
35 $350,000 $10,000 - - - -
40 - - $350,000 $10,000 $350,000 $10,000
42 $1,835,000 $10,000 - - - -
49 - - - - - -
50 - - - - - -
Undiscounted
Total $6,817,500 $70,000 $3,500,000 $50,000 $4,400,000 $50,000
Present Value $3,654,823 $35,557 $2,676,996 $26,486 $3,576,996 $26,486
0: Initial Construction Cost, MC: Maintenance Cost, UC: User Cost.

245
Table 12. Analysis of Variance
Groups
Bottom-Up Cracking AC Rutting IRI
P-Values F F crit P-Values F F crit P-Values F F crit
Traffic 0.08 5.41 7.71 0.08 5.41 7.71 0.08 5.22 7.71
GB Thickness 0.03 30.22 18.51 0.02 46.29 18.51 0.00 9440.02 18.51
Treated SG MR 0.10 9.00 18.51 0.10 9.00 18.51 0.10 8.84 18.51
Surface AC Mix 0.20 3.60 18.51 0.04 21.38 18.51 0.00 29344.17 18.51
Intmd AC Mix 0.61 0.31 7.71 0.04 9.74 7.71 0.00 31501.25 7.71
RBL AC Mix 0.95 0.00 7.71 0.04 9.78 7.71 0.00 32934.92 7.71

246
Figure 1. Schematic of Perpetual Pavement
3″ Zone of Compression SMA or OGFC Surface (1-3″)
High Modulus (Superpave) Intermediate
4″ Rut Resistant Materials (4-10″)
3″ Low Modulus (Rich Binder Mix) HMA Base Max Tensile Strain Fatigue Resistant Materials (3-7″)
Cement/Lime/Fly-Ash Pavement
6″ Treated Soils or Granular Foundation
Materials
12″ Natural Subgrade Foundation

247
(a) Total Rut ≤ 0.5″ after 50 Years
(b) Total Rut ≤ 0.75″ after 50 Years
Figure 2. Pavement Performance Flow Charts Based on Total Rut Criteria (No
Resurfacing)
Start
1. Bottom-Up Fatigue
Cracking Criteria< 20% After 50 Yrs → Fail 8 PPs → AADTT PPs ≤ 10″ 11 - 12″ 12.5 - 15″
↓ 3205 PPs Pass 1750 0 0 0 0
2. Top-Down Crack
Criteria< 700 ft/mi After 50 Yrs 5000 8 8 (8″) 0 0
↓ 3205 PPs Pass 10000 0 0 0 0
3. Thermal Crack Criteria < 700 ft/mi After 50 Yrs
↓ 3205 PPs Pass
4. Total Rut Criteria Total Rut ≤ 0.5″ After 50 Yrs → Fail 3205 PPs
↓
0 PPs Pass
3213
PPs
Start
1. Bottom-Up Fatigue
Cracking Criteria< 20% After 50 Yrs → Fail 8 PPs
↓ 3205 PPs Pass
2. Top-Down Crack
Criteria< 700 ft/mi After 50 Yrs
↓ 3205 PPs Pass
3. Thermal Crack
Criteria< 700 ft/mi After 50 Yrs
↓ 3205 PPs Pass
4. Total Rut Criteria Total Rut ≤ 0.75″ After 50 Yrs → Fail 3205 PPs
↓
0 PPs Pass
3213
PPs

248
(a) AC Rut ≤ 0.25″ after 50 Years
(b) AC Rut ≤ 0.5″ after 50 Years
Figure 3. Pavement Performance Flow Charts Based on AC Rut Criteria (No Rehab)
Start
1. Bottom-Up Fatigue
Cracking Criteria< 20% After 50 Yrs → Fail 8 PPs
↓ 3205 PPs Pass
2. Top-Down Crack
Criteria< 700 ft/mi After 50 Yrs
↓ 3205 PPs Pass
3. Thermal Crack
Criteria< 700 ft/mi After 50 Yrs
↓ 3205 PPs Pass
4. AC Rut Criteria AC Rut ≤ 0.25″ After 50 Yrs → Fail2327
PPs
405 PPs Pass ↓
AADTT PPs ≤ 10″ 11 - 12″ 12.5 - 15″
1750 405 0 0 405
5000 0 0 0 0
10000 0 0 0 0
3213
PPs
Start
1. Bottom-Up Fatigue
Cracking Criteria
< 20% After 50
Yrs→ Fail 8 PPs
↓ 3205 PPs Pass
2. Top-Down Crack
Criteria
< 700 ft/mi
After 50 Yrs
↓ 3205 PPs Pass
3. Thermal Crack
Criteria
< 700 ft/mi
After 50 Yrs
↓ 3205 PPs Pass
4. AC Rut CriteriaAC Rut ≤ 0.5″
After 50 Yrs→ Fail 473 PPs
↓ 2732 PPs Pass
AADTT PPs ≤ 10″ 11 - 12″ 12.5 - 15″
1750 1855 0 509 (11″)648 (13″) + 698 (15″)
= 1346
5000 813 0 05 (14″) + 808 (15″)
= 813
10000 64 0 0 64
3213
PPs
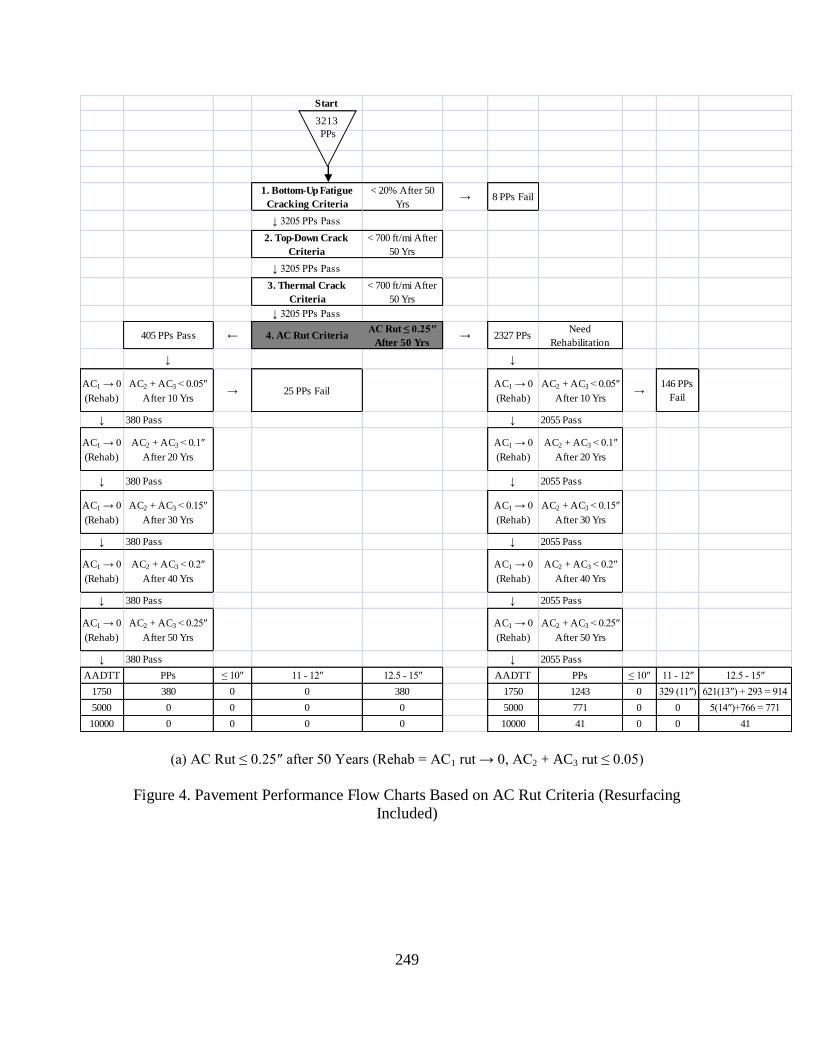
249
(a) AC Rut ≤ 0.25″ after 50 Years (Rehab = AC1 rut → 0, AC2 + AC3 rut ≤ 0.05)
Figure 4. Pavement Performance Flow Charts Based on AC Rut Criteria (Resurfacing
Included)
Start
1. Bottom-Up Fatigue
Cracking Criteria
< 20% After 50
Yrs→ 8 PPs Fail
↓ 3205 PPs Pass
2. Top-Down Crack
Criteria
< 700 ft/mi After
50 Yrs
↓ 3205 PPs Pass
3. Thermal Crack
Criteria
< 700 ft/mi After
50 Yrs
↓ 3205 PPs Pass
405 PPs Pass ← 4. AC Rut CriteriaAC Rut ≤ 0.25″
After 50 Yrs→ 2327 PPs
Need
Rehabilitation
↓ ↓
AC1 → 0
(Rehab)
AC2 + AC3 < 0.05″
After 10 Yrs→ 25 PPs Fail
AC1 → 0
(Rehab)
AC2 + AC3 < 0.05″
After 10 Yrs→
146 PPs
Fail
↓ 380 Pass ↓ 2055 Pass
AC1 → 0
(Rehab)
AC2 + AC3 < 0.1″
After 20 Yrs
AC1 → 0
(Rehab)
AC2 + AC3 < 0.1″
After 20 Yrs
↓ 380 Pass ↓ 2055 Pass
AC1 → 0
(Rehab)
AC2 + AC3 < 0.15″
After 30 Yrs
AC1 → 0
(Rehab)
AC2 + AC3 < 0.15″
After 30 Yrs
↓ 380 Pass ↓ 2055 Pass
AC1 → 0
(Rehab)
AC2 + AC3 < 0.2″
After 40 Yrs
AC1 → 0
(Rehab)
AC2 + AC3 < 0.2″
After 40 Yrs
↓ 380 Pass ↓ 2055 Pass
AC1 → 0
(Rehab)
AC2 + AC3 < 0.25″
After 50 Yrs
AC1 → 0
(Rehab)
AC2 + AC3 < 0.25″
After 50 Yrs
↓ 380 Pass ↓ 2055 Pass
AADTT PPs ≤ 10″ 11 - 12″ 12.5 - 15″ AADTT PPs ≤ 10″ 11 - 12″ 12.5 - 15″
1750 380 0 0 380 1750 1243 0 329 (11″) 621(13″) + 293 = 914
5000 0 0 0 0 5000 771 0 0 5(14″)+766 = 771
10000 0 0 0 0 10000 41 0 0 41
3213
PPs

250
(b) AC Rut ≤ 0.5″ after 50 Years (Rehab = AC1 rut → 0, AC2 + AC3 rut ≤ 0.1)
Figure 4. Pavement Performance Flow Charts Based on AC Rut Criteria (Resurfacing
Included)
Start
1. Bottom-Up Fatigue
Cracking Criteria
< 20% After 50
Yrs→ Fail 8 PPs
↓ 3205 PPs Pass
2. Top-Down Crack
Criteria
< 700 ft/mi After
50 Yrs
↓ 3205 PPs Pass
3. Thermal Crack
Criteria
< 700 ft/mi After
50 Yrs
↓ 3205 PPs Pass
2732 PPs ← Pass 4. AC Rut CriteriaAC Rut ≤ 0.5″
After 50 Yrs
→ Need
Rehab
473 PPs Needing
Rehab
↓ ↓
AC1 → 0
(Rehab)
AC2 + AC3 < 0.1″
After 10 Yrs→ Fail 48 PPs
AC1 → 0
(Rehab)
AC2 + AC3 < 0.1″
After 10 Yrs→ 98 PPs Fail
↓ 2684 PPs Pass ↓ 375 PPs Pass
AC1 → 0
(Rehab)
AC2 + AC3 < 0.2″
After 20 Yrs
AC1 → 0
(Rehab)
AC2 + AC3 < 0.2″
After 20 Yrs
↓ 2684 Pass ↓ 375 Pass
AC1 → 0
(Rehab)
AC2 + AC3 < 0.3″
After 30 Yrs
AC1 → 0
(Rehab)
AC2 + AC3 < 0.3″
After 30 Yrs
↓ 2684 Pass ↓ 375 Pass
AC1 → 0
(Rehab)
AC2 + AC3 < 0.4″
After 40 Yrs
AC1 → 0
(Rehab)
AC2 + AC3 < 0.4″
After 40 Yrs
↓ 2684 Pass ↓ 375 Pass
AC1 → 0
(Rehab)
AC2 + AC3 < 0.5″
After 50 Yrs
AC1 → 0
(Rehab)
AC2 + AC3 < 0.5″
After 50 Yrs
↓ 2684 Pass ↓ 375 Pass
AADTT PPs ≤ 10″ 11 - 12″ 12.5 - 15″ AADTT PPs ≤ 10″ 11 - 12″ 12.5 - 15″
1750 1808 0 468(11″)642 (13″) +
698(15″) = 13401750 37 0 37 (11″) 0
5000 812 0 0 5(14″) + 807 (15″) 5000 45 917(11″) + 13(12″)
= 30
2(12.5″) + 5(14″) +
4(15″) = 11
10000 64 0 0 64 (15″) 10000 293 0 0 293(15″)
3213
PPs

251
0.0
0.2
0.4
0.6
0.8
1.0
1.2
1.4
1.6
1.8
2.0
2712 2711 2710 2744 2726 2725 2724 2751
Ru
ttin
g (
in)
Pavement Run
Total Rut AC Rut Subgrade Rut
Total Rut AC Rut Subgrade Rut
SG MR = 5000 psi →SG MR = 15500psi →
Figure 5. Effects of Improving Subgrade modulus on Total, AC, and Subgrade
Rutting of Perpetual Pavements

252
0.30
0.40
0.50
0.60
0.70
0.80
0.90
1.00
0.30 0.50 0.70 0.90
AC
Ru
t w
ith
ou
t R
BL
(in
)
AC Rut with RBL (in)
0.70
0.75
0.80
0.85
0.90
0.95
1.00
0.70 0.80 0.90 1.00
Ba
se/S
G R
ut
wit
ho
ut
RB
L (
in)
Base/SG Rut with RBL (in)
(a) AC-Rutting (b) Base/Subgrade Rutting
Figure 6. MEPDG Predicted Rutting With and Without Using a Rich Binder
Layer

253
Figure 7. Fatigue Cracking for Pavements without Rich Binder Layer
0.00
5.00
10.00
15.00
20.00
25.00
30.00
35.00
40.00
0 10 20 30 40 50 60
Fat
igue
Cra
ckin
g (
%)
Time (yrs)
Run 147 Run 183 Run 183
Run 147 Run 183 Run 243

254
(a) Bonded/De-Bonded State in All HMA Layers
(b) Bonded/De-Bonded State in Upper HMA Layers
Figure 8. Top-Down Cracking in Bonded/De-Bonded HMA Pavements
0
2000
4000
6000
8000
10000
12000
2712 2711 2710 2744 2726 2725 2724 2751
To
p-D
ow
n C
rack
ing (
ft/m
i)
Pavement Run
Bonded HMA Layers
De-Bonded HMA Layers
0
100
200
300
400
500
600
700
800
2712 2711 2710 2744 2726 2725 2724 2751
To
p-D
ow
n C
rack
ing (
ft/m
i)
Pavement Run
Bonded HMA Layer
De-Bonded HMA Layer

255
(a) Bonded/De-Bonded State in All HMA Layers
(b) Bonded/De-Bonded State in Upper HMA Layers
Figure 9. Bottom-Up Cracking in Bonded/De-Bonded HMA Pavements
0.0
10.0
20.0
30.0
40.0
50.0
60.0
70.0
2712 2711 2710 2744 2726 2725 2724 2751
Bo
ttom
-up C
rack
ing (
%)
Pavement Run
Bonded HMA Layers
De-Bonded HMA Layers
0.0
5.0
10.0
15.0
20.0
25.0
30.0
35.0
40.0
45.0
2712 2711 2710 2744 2726 2725 2724 2751
Bo
ttom
-up C
rack
ing (
%)
Pavement Run
Bonded HMA Layer
De-Bonded HMA Layer

256
(a) Bonded/De-Bonded State in All HMA Layers
(b) Bonded/De-Bonded State in Upper HMA Layers
Figure 10. AC Rutting in Bonded/De-Bonded HMA Pavements
0.00
0.10
0.20
0.30
0.40
0.50
0.60
2712 2711 2710 2744 2726 2725 2724 2751
AC
Rutt
ing (
in)
Pavement Run
Bonded HMA Layers
De-Bonded HMA Layers
0.00
0.10
0.20
0.30
0.40
0.50
0.60
2712 2711 2710 2744 2726 2725 2724 2751
AC
Rutt
ing (
in)
Pavement Run
Bonded HMA Layer
De-Bonded HMA Layer

257
(a) Pavement Trial No. 2751 (no RBL) (b) Pavement Trial No. 2725 (with RBL)
Figure 11. Implementable Perpetual Pavements
SP-IV Mix PG 76-22 5% AC, 6% AV
SP-II Mix PG 76-22 4% AC, 6% AV
Crushed Gravel 20000 psi
A-5 Materials 8000 psi
SP-IV Mix PG 76-22 5% AC, 6% AV
SP-IV Mix PG 64-22 5% AC, 3% AV
Crushed Gravel 20000 psi
A-5 Materials 8000 psi
SP-II Mix PG 76-22 4% AC, 6% AV
3″
7″
6″
12″
3″
4″
3″
6″
12″

258
APPENDIX B
DYNAMIC MODULUS TEST DATA

259
Figure B1 Dynamic Modulus Mastercurve of SP-II Mixture
0
5000
10000
15000
20000
0.001 0.1 10 1000 100000 10000000
Dynam
ic M
odulu
s (k
Pa)
Reduced Frequency (Hz)
Fitted
SP-II-1
SP-II-2
SP-II-3
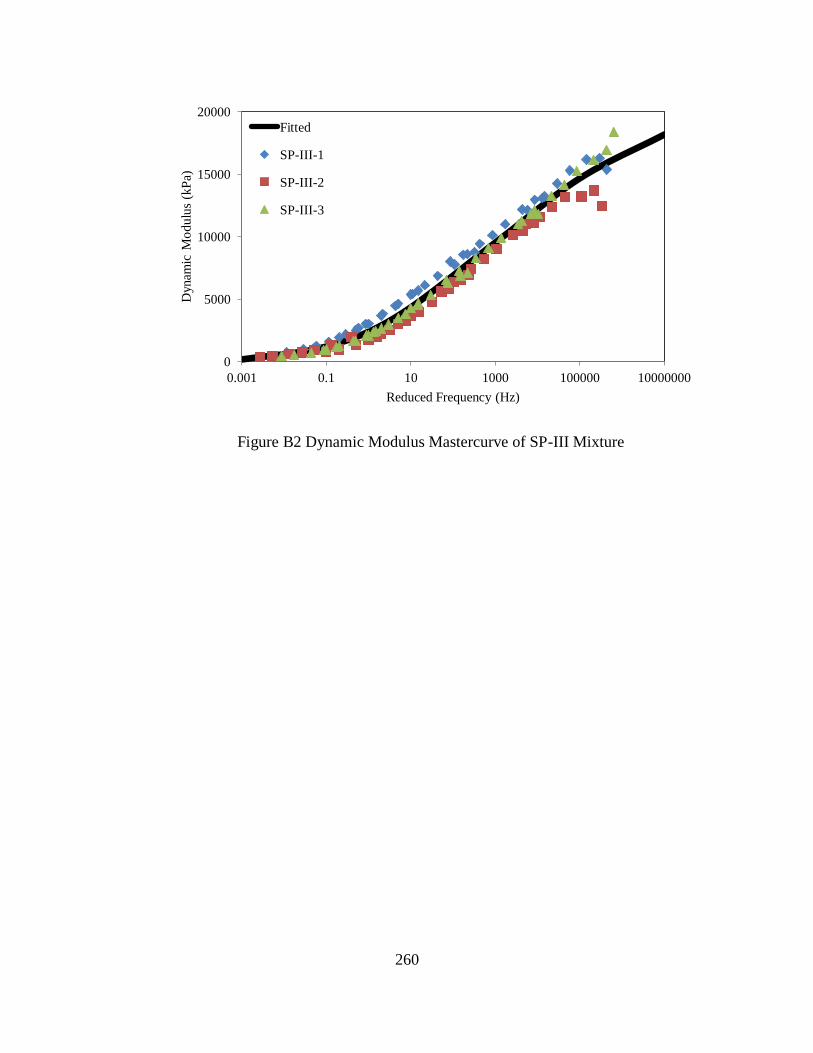
260
Figure B2 Dynamic Modulus Mastercurve of SP-III Mixture
0
5000
10000
15000
20000
0.001 0.1 10 1000 100000 10000000
Dynam
ic M
odu
lus
(kP
a)
Reduced Frequency (Hz)
Fitted
SP-III-1
SP-III-2
SP-III-3

261
Figure B3 Phase Angle Mastercurve of SP-II Mixture
0.0
10.0
20.0
30.0
40.0
50.0
60.0
0.001 0.1 10 1000 100000 10000000
Phas
e A
ngle
(deg
)
Reduced Frequency (Hz)
SP-II-1
SP-II-2
SP-II-3

262
Figure B4 Phase Angle Mastercurve of SP-III Mixture
0.0
10.0
20.0
30.0
40.0
50.0
60.0
0.001 0.1 10 1000 100000
Phas
e A
ngle
(deg
)
Reduced Frequency (Hz)
SP-III-1
SP-III-2
SP-III-3

263
Figure B5 Storage Modulus Mastercurve of SP-II Mixture
0
5000
10000
15000
20000
0.001 0.1 10 1000 100000 10000000
Sto
rage
Mo
dulu
s (k
Pa)
Reduced Frequency (Hz)
Fitted
SP-II-1
SP-II-2
SP-II-3

264
Figure B6 Storage Modulus Mastercurve of SP-III Mixture
0
5000
10000
15000
20000
0.001 0.1 10 1000 100000 10000000
Sto
rage
Mo
dulu
s (k
Pa)
Reduced Frequency (Hz)
Fitted
SP-III-1
SP-III-2
SP-III-3

265
Figure B7 Relaxation Modulus of SP-II and SP-III Mixtures
0
5000
10000
15000
20000
1.0E-08 1.0E-05 1.0E-02 1.0E+01 1.0E+04
Rel
axat
ion M
odulu
s, k
Pa
Time, s
SPII mixture
SPIII mixture