laboratory of data science business intelligence...
TRANSCRIPT

LABORATORY OF DATA SCIENCE
Business Intelligence Architectures
Data Science & Business Informatics Degree

BI Architecture
Lab of Data Science
2
6 lessons – data access
4 lessons – data quality & ETL
5 lessons – data mining
6 lessons – OLAP and reporting
1 lessons – analytic SQL

Data sources
¨ Multiple operational data sources ¤ Across departments of the organization, and external
sources ¤ Type and formats
n Relational, multidimensional, time-seriers, spatial, text, multimedia, ..
¤ Issues n Standards for representations, codes, formats of text files
n Standards for querying relational data sources n Basic programs for data manipulation
¨ We will study: ¤ Python access to text files ¤ Python access to RDBMS
Lab of Data Science
3

Extract, Transform and Load
ETL (extract transform and load) is the process of extracting, transforming and loading data from heterogeneous sources in a data base/warehouse. ¤ Typically supported by (visual) tools
¨ We will study: ¤ SQL Server 2019 Integration Services
4
Lab of Data Science
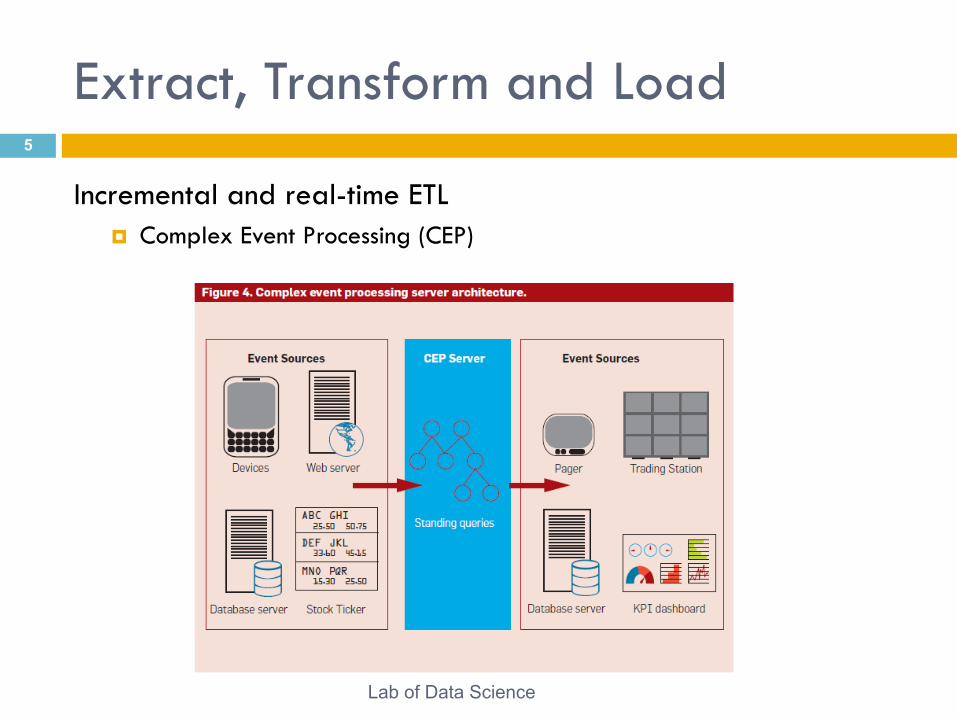
Extract, Transform and Load
Incremental and real-time ETL ¤ Complex Event Processing (CEP)
5
Lab of Data Science

Data warehouse
“A data warehouse is a subject-oriented, integrated, time-variant, and nonvolatile collection of data in support of management’s decision-making process.”
W.H. Inmon
¨ Data warehousing: the process of building and using a datawarehouse
6
Lab of Data Science

Data warehouse servers
¨ Relational DBMS (RDBMS) ¤ With specialized index and optmizations
n star-join query, bitmap index, partitioning, materialized views
¤ We will study: n SQL Server 2019 with analytic SQL
¨ MapReduce engine ¤ Big data challenge
n Architect (low-cost) data platform
¤ Covered by 687AA «Distributed Data Analysis & Mining»
Lab of Data Science
7

Which DBMS for DW? 8
Gartner names Microsoft a leader in the Magic Quadrant for Data Management Solutions for Analytics

Which BI platform? 9
Lab of Data Science
2019 Magic Quadrant for Analytics and Business Intelligence Platforms

BI Architecture
Lab of Data Science
10
6 lessons – data access
4 lessons – data quality & ETL
4 lessons – data mining
5 lessons – OLAP and reporting
1 lessons – analytic SQL

Mid-tier servers
¨ OnLine Analytical Processing (OLAP) ¤ Provides a multidimensional view of data warehouses
¤ Pre-compute aggregates and stored: n in ad-hoc structures (multidimensional OLAP - MOLAP)
n in relational DB (relational OLAP - ROLAP)
n in-memory OLAP
¨ We will study: ¤ SQL Server 2019 Analysis Services and MDX Query Language
11
Lab of Data Science

Mid-tier servers
¨ Reporting Servers ¤ Enable definition, efficient execution, and rendering of reports
¤ Data is retrieved from datawarehouse or OLAP servers
¨ We will study: ¤ Microsoft Power BI
12
Lab of Data Science

Mid-tier servers
¨ Data/web/text mining servers ¤ Extract descriptive & predictive models from structured/graph/textual data
¨ We will study: ¤ WEKA: a data mining software in Java
13
0 0.2 0.4 0.6 0.8 10
0.1
0.2
0.3
0.4
0.5
0.6
0.7
0.8
0.9
1
x
y
y < 0.33?
: 0 : 3
: 4 : 0
y < 0.47?
: 4 : 0
: 0 : 4
x < 0.43?
Yes
Yes
No
No Yes No
0 0.1 0.2 0.3 0.4 0.5 0.6 0.7 0.8 0.9 10
0.1
0.2
0.3
0.4
0.5
0.6
0.7
0.8
0.9
1
x
y
Lab of Data Science

Mid-tier servers
¨ Enterprise Search Engine ¤ Crawl, index and search by keywords over different types of data
¤ Covered by 289AA «Information Retrieval»
14
Lab of Data Science
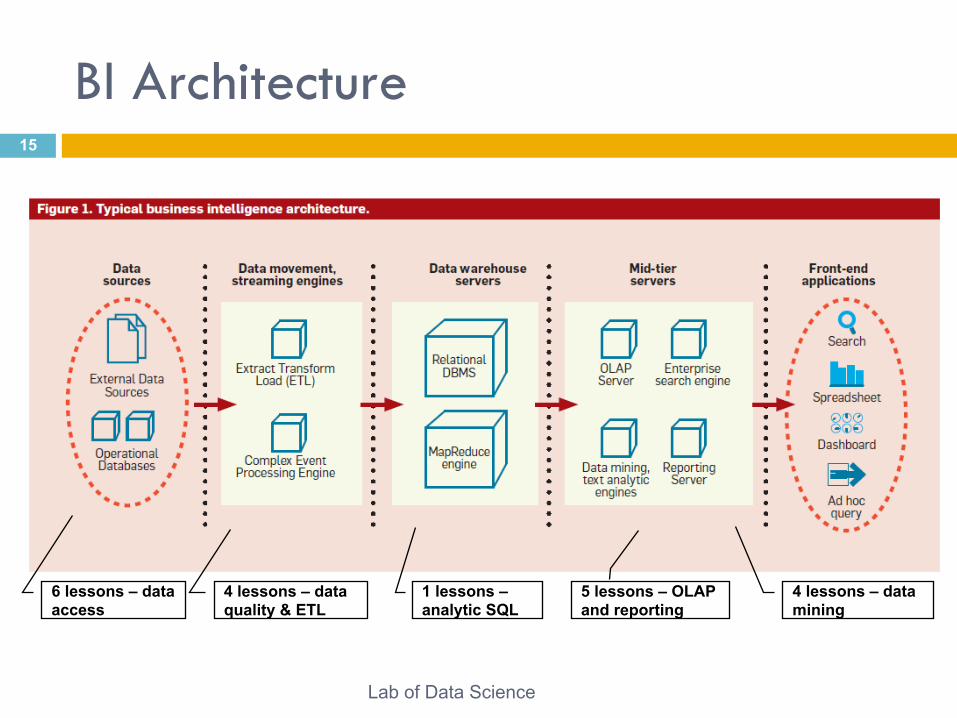
BI Architecture
Lab of Data Science
15
6 lessons – data access
4 lessons – data quality & ETL
4 lessons – data mining
5 lessons – OLAP and reporting
1 lessons – analytic SQL

Front-end applications
¨ Applications through which users perform BI tasks ¤ Spreadsheets
n for navigating multidimensional data
n We will study: Excel
¤ Enterprise portals n for accessing reports and dashboards
n for searching through query
¤ GUI n for accessing mining models
n for exploratory data analysis
n for ad-hoc queries
¤ Vertical packaged applications for CRM, Supply-Chain, Finance, Opinion mining …
¤ More specialized tools for building storytellings to produce understandable stories to presents information to the users. n Covered by 602AA «Visual Analytics»
Lab of Data Science
16
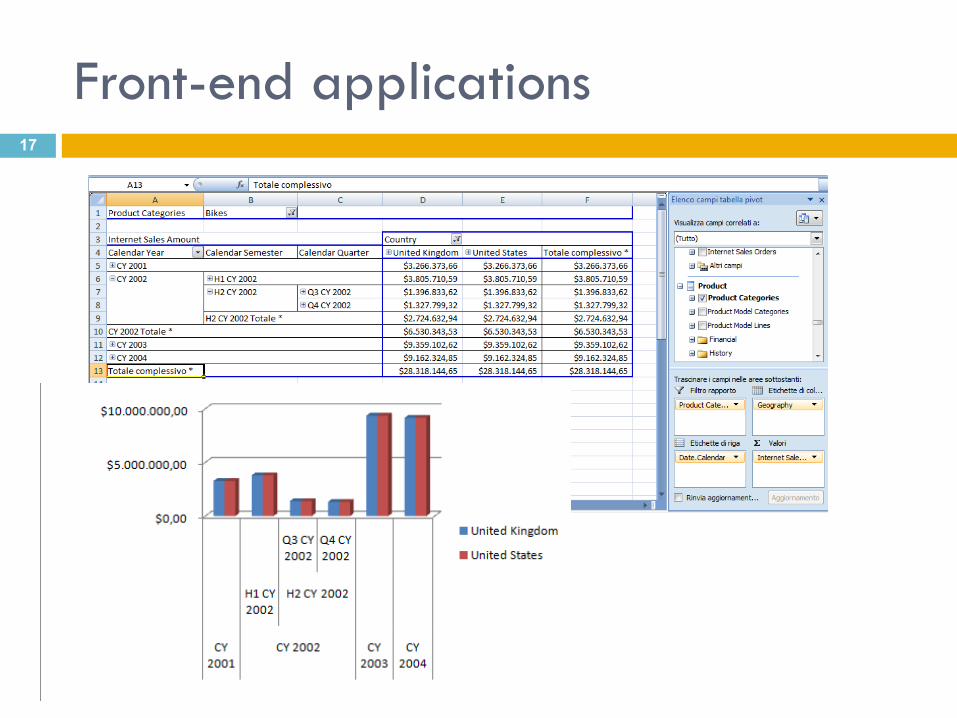
Front-end applications
Lab of Data Science
17