laboratory of nuclear medicine and radiation biology …
TRANSCRIPT

LABORATORY OF NUCLEAR MEDICINE AND RADIATION BIOLOGY 900 VETERAN AVENUE
UNIVERSITY OF CALIFORNIA, LOS ANGELES, CALIFORNIA 90024
- M O T t C l -
^ T t o * . « »*«•»• * ™""" "" 1 mfi
March 1979
These studies were supported by Contract EY-76-C-03-0012 between the.U. S. Department of Energy and the University of California.
Prepared for U. S. Department of Energy under Contract EY-76-C-03-0012
WATER FLUX IN ANIMALS: ANALYSIS OF POTENTIAL ERRORS IN THE TRITIATED WATER METHOD
Kenneth A. Nagy and Daniel Costa
DISTRIBUTION OF THIS DOCUMENT IS UNLIMITED ~tf

ABSTRACT
Laboratory studies indicate that tritiated water measurements of water flux are accurate to within -7 to H% in mammals, but errors are larger in some reptiles. However, under conditions that can occur in field studies, errors may be much greater. Influx of environmental water vapor via lungs and skin can cause errors exceeding +50% in some circumstances. If water flux rates in an animal vary through time, errors approach ±15% in extreme situations, but are near ±3? in more typical circumstances. Errors due to fractional evaporation of tritiated water may approach -9%.
This error probably varies between species. Use of an inappropriate equation for calculating water flux from isotope data can cause errors exceeding ±100:i. The following sources of error are either negligible or avoidable: use of isotope dilution space as a measure of body water volume, loss of nonaqueous tritium bcund to excreta, binding of tritium with nonaqueous substances in the body, radiation toxicity effects, and smal] analytical errors in isc ope measurements. Water flux rates measured with tritiated viater should be within +10% of actual flux rates in most situations.
INDEX TERMS
3 fiel2 -=chnique; heavy water; HHO; HiO; water balance; water turnover

1
INTRODUCTION
Rates of water influx and efflux in animals can be measured by injecting them with deuterium- or tritium-labeled water, and following the decline in specific activity of the isotope in body water through time. The specific activity declines because of the loss of labeled water from the animal via excretion and evaporation, and the simultaneous input of unlabeled water via oxidative metabolism, eating and drinking. This method is quite attractive to environmental physiologists because it permits measurement of water fluxes in animals that are living unrestrained in their natural habitats. The significance of such results is reflected by the several hundred research articles on animal water fluxes that have been published in the last two decades.
Unfortunately, the labeled water method involves several assumptions, which if invalid, may cause significant errors in calculated flux rates. Lifson and McClintock (28) provided a list of these assumptions. They are: {]) body water volume remains constant during the measurement period; (.2) rates of water influx and efflux are constant; (3) the isotope labels only the H,0 in the body; (£) the isotope leaves the body only as HoO; (5) the specific activity of the isotope in water lost fror the animal is the same as in body water; and (6) labeled or unlabeled water in the environment does not enter the animal via respiratory or ski- surfaces. Lifson and McClintock (28) summarized their theoretical and -ithematical analyses of the errors that may occur if these assumptions are wrong, especially for studies employing deuterated water. We have extsr.dsd these analyses by measuring the errors associated with several

2
of these assumptions. We give particular emphasis to errors that may occur in terrestrial field studies and to errors associated with the use of tritiated water. The first section of this paper deals with evaluations of the six assumptions. Later sections address the questions of isotope decay errors, isotope toxicity, effects of measurement errors (sensitivity analysis) and validation studies.
Open and closed systems. Water labeled with a hydrogen isotope can be used to measure water fluxes in an open system where the animal is labeled and loses isotope to an "infinite" sink, or in a closed system where either the ?nimal or the environment is labeled initially, and the isotope eventually comes to equilibrium throughout the system. We are concerned only with the former situation, as it is the method used in field studies. The latter method is frequently used in laboratory studies of aquatic and marine animals. An equation describing isotope fluxes in closed systems is given by Potts and Rudy (40).
EVALUATION OF THE SIX ASSUMPTIONS
(Jj Constant body water volume- The amount of water in an am'mal can
remain constant through time, it can change regularly (linear or exponential increase or decrease), or it can fluctuate unevenly. In this section, we consider the former situations. Errors resulting from uneven body water fluctuations are discussed later.
The behavior of a hydrogen isotope in the body water of an animal can be described by the equation
In <H*/H*) k P - (1)
3
where k i s the fractional "turnover rate" of the isotope, Hj and Hfl are initial and final specific activities of the isotope in body water, t is time elapsed (usually expressed in days) between body water samples, and In signifies natural logarithm. The half-life (T,,,) Df t*,e * s o t o P B i" the body is
11/2 k <-'
where 0.693 = In (Hj/Hg) when H_ is half the value of H,. If the animal has maintained a constant water volume throughout the measurement period, then k also represents the fractional "turnover rate" of body water, as well as the turnover rate of the isotope. If the body water volume changed, then k describes isotope turnover only, and not water flux. (T, in refers only to the isotope half-life, and not the time required for turnover of half of the body water, as has been erroneously reported in the literature.) To obtain results in units of ml H 20 (kg day) - , we modified equation 1 to read
ml H 90 flux 1000 VI }X\(,H*/HI) kg day M t ^
where W is body water volume in ml and H is body mass in g. If deuterated 2 *
water { HHO or HDO) is used, H is usually expressed in terms of atom % excess (sto- % D in body water minus atom % D in body water of an unlabeled
3 — * animal). When tritiated water ( HHO or KiO) is used, H can be counts per minute (CPM) per unit volume of body water, corrected for background CPM. It is not necessary.to correct HTO values for counting efficiency or volume of water counted, as long as these factors are identical for both Hj and H 2-

For a steady-state animal (W remains constant through time), equation $ describes both the rate of water gain and water loss, because influx = efflux = "turnover." When body water volume changes, influx ?* efflux and the calculated "turnover rate" equals neither, but lies somewhere in between. Lifson and McClintock (28) provide equations for calculating water flux rates in animals whose water volumes change regularly with time, either in a linear or an exponential fashion. He expanded and modified these equations to convert units to those used in equation 3. When an animal's body water volume increases or decreases linearly with tfme,
ml H 20 efflux 2000 (W^Wj) l n f t ^ / H ^ ) kg day. = (Mj+Mg) IntWg/Wj) t ^ )
where the subscripts 1 and 2 represent initial and final values, respectively. When body water volume changes exponentially with time,
ml H 20 efflux 2000 w^ ln^/W^) IntH^/H^Wg) kg~day = ( M ^ J (l-CwyWg}) t *5)
In animals with linearly or exponentially changing water volumes, the rate of water influx can be calculated using the relation:
ml H 20 influx ml H g0 efflux 2000 (H2 - Wj) kg day = kg day * t (Mj + ffgj ^
Two other methods for calculating water efflux rates when W changes linearly have been published (15, 33). When Wj = U 2, both of these equations are the same as equation 3. However, when H, f V~, these

5
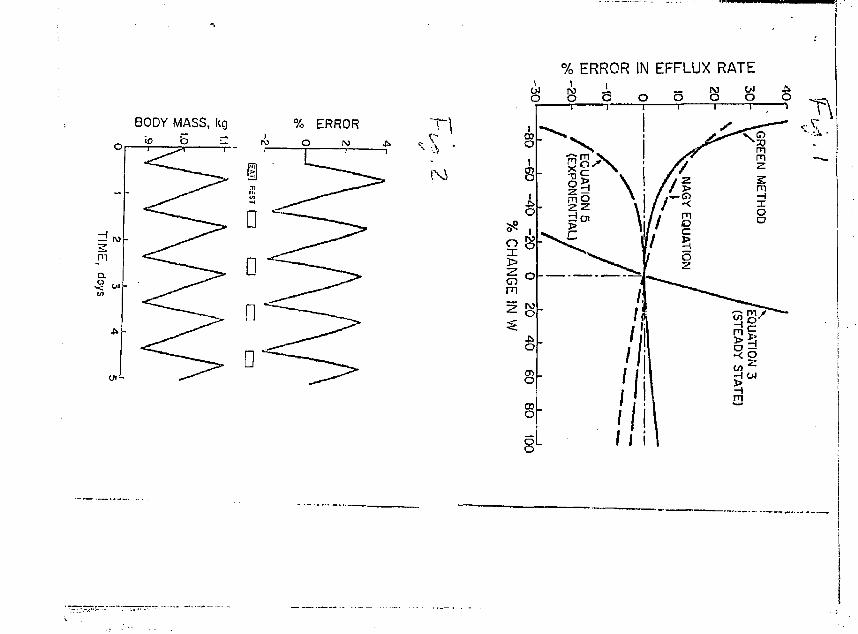
equations differ from each other, as wall as from equation 4 thereby raising the question as to which equation should he- used. Recognizing our mathematical shortcomings, we consulted a mathematician colleague (Dr. H. Strickland) about this, and he was able to prove that equation 4 is mathematically correct. Further, he pointed out that the equations of Nagy (33) and Green (15) are incorrect in part because neither includes a term to account for the rate of change in body water volume. Since the literature already contains water flux rates calculated frosn these incorrect equations, we wondered about the magnitude of error contained in published flux rates. To investigate this, we used fictitious but reasonable values for all parameters, and solved each equation for ml HpO efflux (kg day)" over a wide range of linear change in W by varying VL. Equations 3 {steady state) and S_ (exponential change in W) were also examined to assess the error caused by using these equations in an inappropriate situation.
The results, expressed as % difference from the value obtained using equation 4, are shown in Fig. 1. Use of equation 3 when the animal is not in a steady state produces large errors, as expected. The other equations yielded sir.all errors {<$%) unless body water volume changed more than about 40* during the course of the measurement period, fls this magnitude of volute change is probably uncoiraion in free-living animals, previously published water loss rates in non-steady state animals are probably fairly accurate, regardless of which equation (other than the steady state equation) was used, provided that body water volume changed regularly in those animals.
6
(2) Constant water flux rates. In most terrestrial animals, body water volumes probably do not remain constant or change regularly through time* but fluctuate in accordance with intermittent periods of feeding, drinking, defecation, urination, sweating, etc. Equations 3_ through 6 are based on the assumption of constant water flux rates, and deviations from this situation will usually produce errors in calculated flux rates. A special case that is error-free occurs when water influx and efflux rates vary in parallel (increase or decrease simultaneously so that body water volume remains constant'through time). For this situation, Lifson and McClintock (28) have shown mathematically that the calculated water efflux rate represents the average rate during the measurement period. This may well occur in the field. For example, tt is possible that some animals urinate and defecate only while feeding. Thus, both watar gain and loss rates would be high during the feeding period, low when the animal was not feeding, and body water volume would remain constant.
It is important to know how Varge an error may occur when flux rat', a vary through time. To re present an extreme but biologically feasible example, we chose the camel, which can lose up to about 35JS of its body mass in water over a two-week period in summer, and th^n rehydrate rapidly by drinking this amount of water within a few minutes. Rates of water influx and efflux in a dehydrating camel v/ere calculated from data given by Schmidt-Nielsen (45). These rates were then used in equations 4 and £ to predict H ? in a camel that dehydrated for 14 days, and than instantaneously drank just enoug.i water to replace all it lost. Since VI, = W~» equation 3 was used to obtain the calculated water efflux

7
rate for comparison with the actual efflux rate. To examine the effects of the timing of drinking on potential errors, the above calculations were repeated for a camel that drank at the beginning or in the middle of the 2 week measurement period, rather than at the end. Similarly, it is possible that a labeled field animal could be gaining water faster than it is losing it so tb--t its water volume is increasing linearly with time, only to lose a large amount of water instantaneously sometime during the measurement period and end up having W 2 = W, at recapture. A gravid female laying a clutch of eggs or giving birth exemplifies this situation. To examine these possibilities, we simply reversed the influx and efflux rates, and repeated the three "camel" calculations described above.
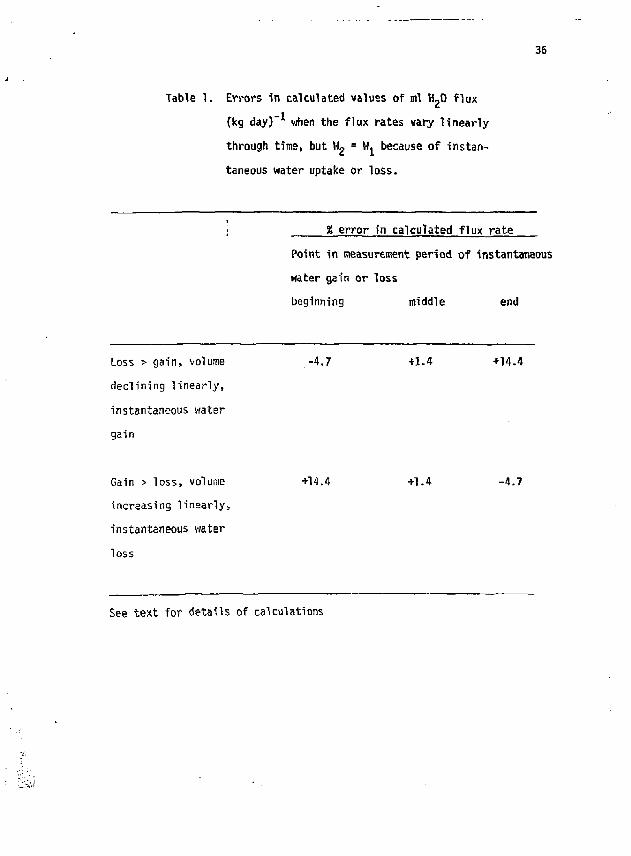
Results of these experiments are shown in Table \. The largest error (14$) occurs when water is instantaneously added at the end or withdrawn at the beginning of the measurement period. There is essentially no error when the addition or withdrawal is made in the middle of the measurement period. Thus, in field measurements, errors of this kind can be minimized by adjusting the measurement period so that drinking or elimination of large volumes occurs near the midpoint of the period. This will require detailed observation of the animal's behavior, which is not always possible. Moreover, if the animal's behavior is well-known, it wou d bs best to sample the animal more frequently, especially just before and shortly after it drinks or voids, and use equations 4 and 6 to calculate water fluxes for each portion of the measurement period, thereby obtaining additional details about drinking rates, etc.
The above experiments show the errors due to variations in water
B
fluxes in extreme situations. To assess errors in a more typical situation, we compared calculated and actual water flux rates that would be found in a desert jackra6bit (34). These animals rest under shrubs during daylight hours, and feed intermittently throughout the night (5). To simplify matters, we assumed that water efflux in a jackrabbit is constant at 333 ml (kg day) , water influx is 9 ml (kg d a y ) - 1 to represent metabolic water production during the 16 hour rest period, and influx during the 8 hour feeding period is 981 ml (kg day) . With these flux rate:., W at the end of each 24 hour period is the same
* as at the beginning. H 2 was predicted from equations 4 and £ for Rich successive four hour period, ovsr a span of five days. Actual flux rates were computed as the mean of individual four hour periods. Calculated flux rates were computed using equations 3, 4_ and j>, as appropriate, and H, was tritium specific activity at time zero for all calculations, so that each successive rate calculation represented a progressively longer period.
Results of this analysis are shown in Fig. 2. The error values shown are those for calculated water efflux rates. The errors in influx rates were nearly identical, but slightly smaller. The errors in calculated flux rates oscillated between about +3 and -2 % of actual fluxes, and
were in phase wich the oscillations in W. At the end of each 24 hr cycle, the error was close to zero. Thus, in field studies of many animals, errors due to unequal flux rates should be small (<5S), and can be made even smaller by carefully timing animal recaptures.
(3) J^otopj* labels body water only. The hydrogen atoms of water mrleuiles disassociate rapidly and can freely exchange with rapidly
9
disassociable hydrogens of organic molecules, or can become associated with nonaqueous compounds in a less-rapidly exchanging mode, either by exchanging with slowly disassociating organic hydrogens or by becoming incorporated into newly synthesized molecules (6, 54). The incarpo>atiOrt of injected isotcpic hydrogen into nonaqueous molecules can cause errors in two ways. If body water volume (W) is measured using the hyrfre*jen isotope dilution method (36), rap'u incorporation of isotope into nonaqueous compounds between the titles of injection and initial sampling will lower H, and yield an overestimate of H. Second, if a significant fraction of the isotope exchanges with body substances ac a relatively slower rate (days), this will introduce errors in calculate^ water
fluxes because H will change as a result of isotope exchange as well as from water fiiix through the animal.
The errors in tritiated Water dilution estimates of w have been assessed in a variety of animals, and these are surmarized in Table 2. HTO almost always overestimates W, and the mean error can be as high as +13%, The large range in errors found by different investigators using a single species (the white rat - Table £) suggests that snnti. of the error may be due to differences in techniques. However, since appreciable amounts of tritium can be found in conpletely dried tissues of KTO-injected animals {IS, 38, 41, 43, 52), isottpe incorporation into body compounds may account for rach of tf",2 overestimate in W. This error
is apparently independent of the amount of isotope injected. Grrdon et al. (14) found that the error in rats was constant for HTO doses ranging from 0.2 to 1.5 microcuries (g body nass)" ' , ..nd Tisavipat et al. (53) injected more than 2000 raicrocuries (g}~ ' into rats, but still
10
found an error of +122 (Table 2). In field studies, labeled animals that have been recaptured can be given a second injection in order to measure U» by isotope dilution. In kangaroo rats (Oipodomvsh the error in this measurement was about the same as the error found upon initial injection of the same species (Table 2). If tritiated water dilution spaces are used as estimates of W in field studies, it seems advisable to collect additional animals for measurement of the e-t ror in such estimates so that they can be appropriately corrected.
Errors in HTO estimates of W can also arise from failing to wait long enough for the injected isotope to mix completely in the animal. Times required for complete mixing, as indicated by a laclc of chanqe in
it
H in successive body water samples, vary with the method of HTO administration as well as between species. Intravascular injections mix more rapidly than do oral or ir.craperitoneal doses (49), but IV injection is not practical in all situations. Complete mixing of intravascular or intraperitoneal injections occurs in 0.5 to 3 h in animals ranging from small mammals (20, 36) to man (4, 10, 37), but up to 10 h may be necessary in large ruminants (30, 47, 49, 50), and dehydrated camels given oral doses require 18 h (29). These results indicate that there is considerable variation between species in the time required for thorough mixing of fiTO. In view of this, it may be advisable to include measurements of mixing time in studies where W will he measured by hydrogen isotope dilution space.
The slow exchange of isotope with nonaqueous substances can cause an overestimate of water flux rates at the beginning of an experiment because H will decline from isotope binding as well as from water flux.
11
Lewis and Phillips (2?) determined that equilibrium between aqueous and nonaqueous tritium was reached about five days after injection in growing calves, and that the bound tritium was equivalent to a volume of water amounting to 3.5% of [4. In scorpions, King (24) found that H turnover was more rapid during the six days following injection than during the remaining 24 ('ays. Calculated water flux rates were up to 20SK higher during the first six days, apparently because tritium was being removed from body water via slow exchange with tissue hydrogen. After 25 days, the tissue-bound tritium accounted for 3.6X of all the tritium in the scorpions. An inflection in the early part of the tritium disappearance curve, as found in scorpions, has not been detected in humans (38), locusts (2), harbor seals (6), dogs (13), desert iguanas (32), and others. Thus, there appear to be at least two situations in ihich this phenomenon
may contribute to significant errors in water flux calculations: in rapidly growing animals, where tritium is being incorporated into new tissue, and in adult animals having \/ery low water flux rates, where the rate of tritium incorporation into nonaqueous substances becomes significant relative to the rate of tritium turnover via water fiun. In field studies of such animals, errors of this kind can be minimized either by waiting several days for slow exchange to become complf.-te before taking the initial sample of body water, or by correcting water flux calculations for tissue-bound tritium accorumg to the equation of King (24).
Slowly exchanging tritium can also cause errors late in an experiment, when H becomes low, because the amount of nonaqueous tritium becomes important relative to aqueous tritium, and the rate of isotope loss from
12
the body becomes increasingly limited by the hydrogen exchange rate rather than by the water flux rate. This also produces an inflection in the tritium disappearance curve. Thompson (52) and Pinson and Langham (38) measured the decline in H in HTO injected mice over several weeks, and found that H declined with a constant half-life until it reached a value less than IX of H.. An increase in half-life, indicating that slowly exchanging tritium began to limit isotope turnover, occurred at a specific activity of about 30 microcuries per liter of body water. In other animals, the point at which the haTf-life increases probably varies with the amount of tritium injected, the species of animal used, its stage of development and the rate of water flux through the animal in relation to the rate of hydrogen exchange. The results from mice suggest
that this '.ource of error can be minimized in field s'jdies by adjusting * *
doses and recapture intervals so that H, does not approach \% of h*,. (4.) Isotope lost only. _i£ the form of water. If a significant
amount of hydrogen isotope is bound to the dry matter in voided urine and feces, water fluxes will be overestimated. To investigate this, excreta from labeled animals wer; analyzed for bound tritium. We collected all urine and feces voided by the six kangaroo rats during the high humidity trial of the vapor input experiments {described in detail below). The excreta were oven-dried, ground and soaked in distilled water overnight so that bound tritium could exchange with hydrr iens on water molecules, reversing the process by which tritium presumably became bound in the animal. Most of the bound isotope should have ended up in the water (48), which was then counted by liquid scintillation. When expressed as
A it a percent of total isotope lost from the animals (H.W, - H ? W 2 ) , bound

13
tritium loss averaged 0.2S in feces, and 0.01% via urine. These kangaroo rats assimilated about 90S of the dry mass of their seed diet. In an herbivorous animal, rates of bound isotope excretion may be higher, because the lower digestibility of plants means higher rates of feces elimination, and because each six-carbon unit of cellulose has three exchangeable hydrogens (28). We repeated the above measurements using an herbivorous lizard (Saoromalus obesus), and found that the loss of bound tritium in urine and feces together amounted to only 0.9% of total isotope loss. Thus, errors in water flux calculations resulting from bound isotope loss are probably negligible in most animals.
(5) H in water lost equals H jn body water. This assumption can be violated by either bfological or isoiopic fractionation. The major type of biological fractionation is nonuniform isotope specific activity in an animal's body, which can occur when mixing of body water compartments is slow in relation to rates of water gain and loss. Biological fractionation may occur when food residence time is very short. For example, in mice with diarrhea, fecal water had a deuterium specific activity only 90<; of that in blood water (31). Other instances may be found in healthy animals in the field, such as the bird Phainopepla, which eats mistletoe berries and defecates the remains within 12-45 min. (55), or in animals which regurgitate food for their young, such as many bird species and wild canids. Lifson and McClintock (23) provide an equation to correct for this error, but it requires measurements of the rate and specific activity of any water that exits at a different specific activity than body water. This is usually not possible when working with free-living animals.
Isotope fractionation can occur when water evaporates from an animal,
u
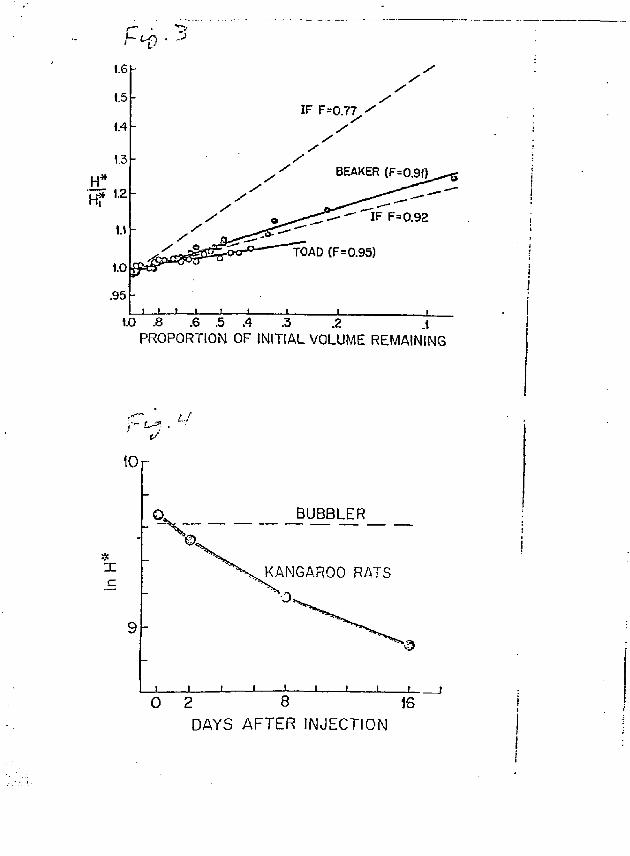
since the heavier labeled water molecules may evaporate more slowly than unlabeled water. The ratio of the vapor pressure of deuterated water (HDO) to that of unlabeled water at saturation (the fractionation factor) is 0.93 at 20°C (25). Lifson and HcClintock (28) included this ratio in an equation to correct for deuterium fractionation, and it yielded calculated flux rates that are close to actual rates. A similar equation for HTO is not available. The equilibrium vapor pressure ratio of HTO to HpO increases with increasing temperature, and at 25°C it has been reported to be 0.77 (42) and 0.92 (46). Not knowing which of these two \ery different values is accurate, whether they are applicable in non-equilibrium situations, or whether they describe isotopic fractionation in animals, we measured fractionation during the course of evaporation from a physical and a biological system.
A beaker containing 5 ml of water and 5 uCi of tritium was placed in an airtight dessicator at 23°C along with some anhydrous CaSO. to
it-absorb water vapor. H and W in the beaker were measured periodically during the seven days it took for all the water to evaporate away. The
* measured increase in H was compared with the increase expected if the fractionation factor was 0.77 and 0.92, as calculated with the equation (22)
H* = H* (VJ) F _ 1 (7)
where W is the proportion of U., remaining in the beaker at ?. given time, and F is the fractionation factor. To assess the behavior of HTO as it evaporates from an animal, ws replaced the beaker with a toad (Bufo marinus, with a full urinary bladder) that had been injected with HTO, and repeated

15
the above measurements until the toad died of dehydration, fhe toad did
not. urinate or defecate, so all of i ts water loss was by evaporation.
The beater and toad experiments were each done three times. To make
the results of beaker and toad experiments comparable, i t was necessary *
to correct the toad H values for metabolic water production. Metabolic
rates of the toads were measured over three 72-hour periods during the
ex^riment by determining the decline in oxygen concentration in the
dessicator, using a Beckman E2 analyzer. The mean rate of 0 2 consumption
was converted to H20 production using the factor 0,53 ml HJi formed per
l i ter 0 2 consumed (for fat metabolism). Then, equations 4 and £ were * +
solved for H2 at each t to determine the reduction in H due to metabolic water production alone, and the difference between these values and H,
* was added to observed H values to correct them for metabolic water
production.
The results of these experiments were plotted on logarithmic
coordinates (to transform them into straight line relationships) and
regression lines were calculated using the least squares method {Fig. ?",.
For the beaker experiments, the correlation coefficient is statistically
significant (r = 0.992, P < 0.01), and the slope of the line indicates
a fractionation factor of 0.907 (95% confidence interval = 0.900 - 0.913),
which is close to that found in an equilibrium situation at 25°C by
Sepal! and Mason (45). The correlation coafficient for the toad experi
ments is also significant (r = 0.77, P < C.01), but the slope is lower
and corresponds to an "effective" fractionation factor (defined below)
of 0.953 (952 confidence interval = 0.942 - 0.954). As the 95" confidence
intervals for the beaker and toad experiments do not overlap, the F values

16
far these two systems are significantly different. According to equation 3£ of Lifson and HcClintock (28), an F value of 0.953 yields a 4.72 underestimate of water efflux rate in an animal whose entire water loss is by evaporation only. For an F value of 0.91 (beaker), the underestimate is 9%.
The term "effective" fractionation is intended to distinguish between fractionation during evaporation from animals versus inanimate systems, for the following reason. Many animals have skin glands which secrete drops of body fluid onto the skin surface. While water is evaporating from a drop, isotopic fractionation should occur in accordance with physical principles. However, eventually the entire drop will evaporate and the specific activity of isotope in the total evaporate will be the same as in bor.y water (assuming no isotopic exchange occurs between water in the drop f?id body water during the course of evaporation). Therefore,
i * evaporation n a this avenue will have no effect on H in the animal. This could be though^ of as another form of biological fractionation. This "bulk flow" of water may also occur in non glandular areas of skin to some degree. If viater moves across skin through very narrow channels that retard mixing of water at the evaporating surface with water at the
* beginning of the channel, then H at the evaporating surface will become higher and higher as fractional evaporation proceeds, and HTO will
* evaporate more rapidly. H at the surface could, in theory, become * sufficiently high that H in evaporated water would eventually equal that in the animal, thereby completely eliminating errors due to isotopic fractionation effects at the skin. If this phenomenon occurs in animals, then the effective F value for different animals should vary in accordance

17
with those factors that affect mixing of water in skin, such as cutaneous blood flow, skin thickness and skin microstructure. This phenomenon may occur to some degree during evaporation at respiratory surfaces, but since p^monary epithelium is thin and highly perfused by blood, a large gradient in H would not be expected. If this is true, then differences in the ratio of pulmonary to cutaneous evaporation should influence the total HTO fractionation error occurring in different species.
Pinson and Langham (38) found that the tritium specific activities in sweat, insensible perspiration, exhaled water vapor, urine and blood in HTO-labeled humans were the same, within the error of measurement (< 3%). However, extremely large fractionation effects have been reported for other animals. Siri and Evers (48) measured H in body water and in water vapor collected simultaneously in downstream cold tra^s, and reported F values ranging from 0.78 to 0.96 in humans and 0.35 to 0.55 in pigeons. Using a similar method, Hatch and Mazrimas (18) found F values of 0.44 in kangaroo rats and 0.64 in mice. Haines et al. (17) also found that water vapor collected in cold traps from HTO-injected rodents had a relatively low H compared to that in body wa+er, but the cause was dilution of evaporated body water by unlabeled water absorbed to fur. We suspect that the large fractionation effects found by Siri and Evers (48) and by Hatch and Mazrimas (18) were also partly due to water absorbed to fur or feathers. Moreover, our experiences with downstream cold traps indicate that it is difficult to keep them free of contamination from other sources of unlabeled water.
{§) No water input via skin and lungs. At the interface between air and liquid water [or a liquid-containing surface such as skin or lung), water

18
molecules are continuously moving from the liquid to the vapor state. The rate at which this occurs (unidirectional efflux rate) is independent of the amount of water vapor in the air. Water molecules in the vapor state are elso condensing into the liquid continuously, but the condensation rate (unidirectional influx rata) is directly proportional to the vapor pressure and temperature just above the surface. In dry air, the unidirtctional influx rate is nero, and in saturated air, it equals the unidirectional efflux rate. Animal physiologists are interested primarily in net evaporation rate (the difference between the unidirectional influx and efflux rates), because this relates directly to the water balance status of the animal. HTO measures unidirectional fluxes rather than net evaporation, and the difference between these is therefore considered to be an "error" in many water balance studies, p n some arthropods that can increase their body mass by absorbing vapor from unsaturated air, HTO has been used specifically to measure unidirectional influx and efflux (9)0 Similarly, if liquid water contacts the skin of an animal, water molecules can exchange across the integument, thereby changing H even though the animal may show no net change in its water balance status.
The magnitude of this type of error depends primarily on two factors: the rate of ambient water input across skin and lungs, and the specific activity of tritium in the ambient water. The input of water vapor via skin should be directly related to the ambient humidity and the permeability of the skin to water. In this regard, Pinson and Langham (38) found that when the forearm of a human was exposed to either HTO vapor (at saturation) or liquid, the labeled water entered the body at about the same rate as the forearm lost water by evaporation (as determined in dry air).

19
The input of water via lungs should be related to respiratory minute volume (the product of breathing rate and tidal volume) and the v/ater content of the inspired air, providing that the proportion of inhaled water vapor that condenses into the liquid phase in the lungs is Constant. Humans inhaling HTO vapor retained nearly 99% of the isotope in the respiratory system (38), indicating that essentially all of the water vapor in inspired air mixes with, and is replaced, by body water.
The specific activity of the isotope in ambient water can have a great influence on the errors resulting from water input via skin and lungs. If H in incoming water equals H in the animal, then no error is introduced, because H ii> the animal would not change (28). If ambient water is unlabeled, then H in the animal wilt be reduced and calculated water fluxes will be too high. Alternatively, if ambient H is higher than in the animal, water flux rates measured with HTO will be underestimates.
To assess the errors due to cutaneous arid respiratory input of water vapor, we compared HTO-measured water influxes with v/ater influxes determined by material balance, using kangaroo rats (Dipodomys merriani, 30 to 40 g). These rodents can maintain a constant body mass on seeds alone (no drinking water) thus simplifying water input measurements. Also, their low water requirements facilitate detection of any errors. The first experiment was designed to investigate the effects of unlabeled airtnent wzter vapor at various relative humidities. Six animals were housed individually in large glass tubes (6 x 30 cm) containing hardware cloth platforms and stoppers at both ends. Air was bubbled through unlabeled, distilled water held at various temperatures in a v/ater bath to provide different humidities, and then metered into the chambers at 300 ml (min) . This flow rate was

20
* sufficient to keep the H in chamber water vapor lower than 10S of that in the animals, as determined by counting water collected in downstream cold traps. The rats were offered husked oat seeds that had equilibrated with the relative humidities used in each experiment, and food consumption was determined as the difference between the dry masses of seeds offered and seeds uneaten. Preformed water input was calculated from feeding rate and measured water contents of the seeds, and metabolic water production was determined from the difference between energy ingested and energy voided as urine and feces, using published values for the carbohydrate, fat and protein assimilated from oats (56) and the metabolic water yields of these substances (11). Preformed and metabolic water influxes were added to yield total water influx rates. The animals were given intraperitoneal injections of HTO (1.1 (jCi per g body mass) in order to measure influx by the decline in * H in successive blood samples. Each experiment lasted 8-12 days. Since
all the animals maintained constant body masses, influx rates were calculated using equation 3.
The results of these experiments are shown in Table 3. HTO overestimated actual water influx rates at all humidities tested, and the error increased with increasing humidity. For field applications, expressing the error in units of ml H,0 (kg Jay)" is probably better than using percent error, because percent error should vary v/ith feeding rate and diet water content, but the absolute error should not. We conclude that significant overestimates can occur in HTO-determined water fluxes when animals are in moist, unlabeled air or where their skins are wetted by unlabeled liquid water. The magnitude of this error probably varies between animals in accordance with variations in s u o properties as skin permeability, surface
21
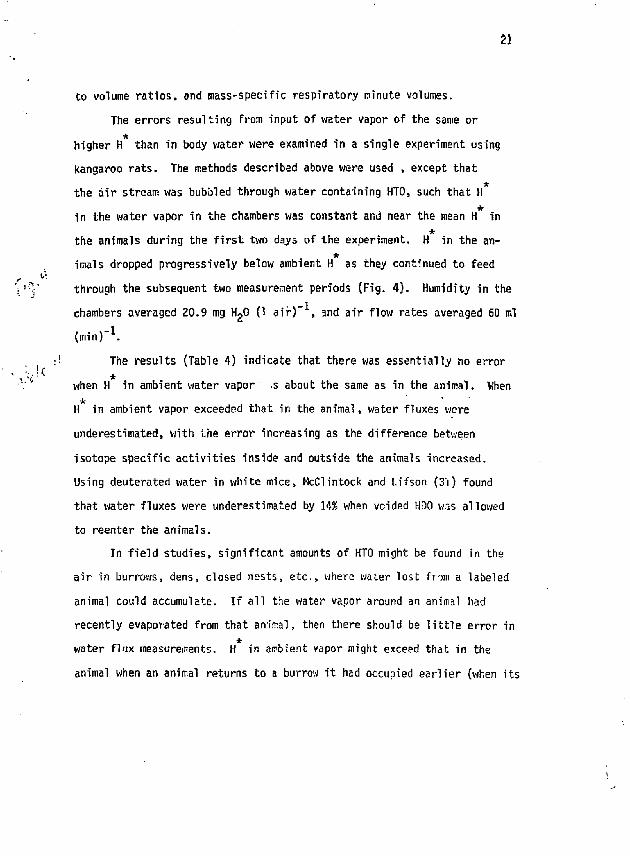
to volume ratios, and mass-specific respiratory ninute volumes. The errors resulting from input of water vapor of the same or * higher H than in body water were examined in a single experiment using
kangaroo rats. The methods described above were used , except that the air stream was bubbled through water containing HTO, such that H in the water vapor in the chambers was constant and near the mean H in
* the animals during the first two days of the experiment. H in the an-imals dropped progressively below ambient H as they continued to feed through the subsequent two measurement periods (Fig. 4). Humidity in the chambers averaged 20.9 mg H 20 (1 air)" , and air flow rates averaged 60 ml (min)~ .
The results (Table 4) indicate that there was essentially no error * when H in ambient water vapor .s about the same as in the animal. When
H in ambient vapor exceeded that in the animal, water fluxes were underestimated, with the error increasing as the difference between isotope specific activities inside and outside the animals increased. Using deuterated water in white mice, McClintock and Lifson (3'i) found that water fluxes were underestimated by H % when voided HOO wis allowed to reenter the animals.
In field studies, significant amounts of HTO might be found in the air in burrows, dens, closed nests, etc., where water lost from a labeled animal could accumulate. If all the water vapor around an animal had recently evaporated from that aniral, then there should be little error in
* water flux measurements, H in ambient vapor might exceed that in the animal when an animal returns to a burrow it had occupied earlier (when its

22
H was higher), or when an animal with a low H enters a burrow con-* taining another animal with a higher H .
It is difficult to predict the H in ambient vapor (and the resulting error in flux, measurements) that a fossoriat animal would encounter in the field. To determine this empirically, we constructed an artificial burrow in the laboratory by surrounding a hardware cloth tube with soil collected near kangaroo rat. burrows in the Mojave Desert. Then, we introduced a labeled kangaroo rat, and compared water influx rates measured via HTO and the balance method as above. The animal was free to forage on the surface of the dirt filled box for the weighed seeds we provided. Humidity and temperature in the burrow were measured using a Thunder Scientific model HSP-180 system, Samples of burrow water vapor were collected periodically using a cold probe placed close to the animal,
* and analyzed for H . The soil, collected between 15 arid 100 cm depth in midsummer , was very dry, and burrow humidity stabilized at 14.9 mg H-0 (1 air)" with the rat inside. To examine the influence of soil moisture, we watted the soil to field capacity (soaked then completely drained) ar.d repeated the above measurements. Burrow humidity stabili*2ed at 21.7 mg H 20 (1 air)" during this experiment.
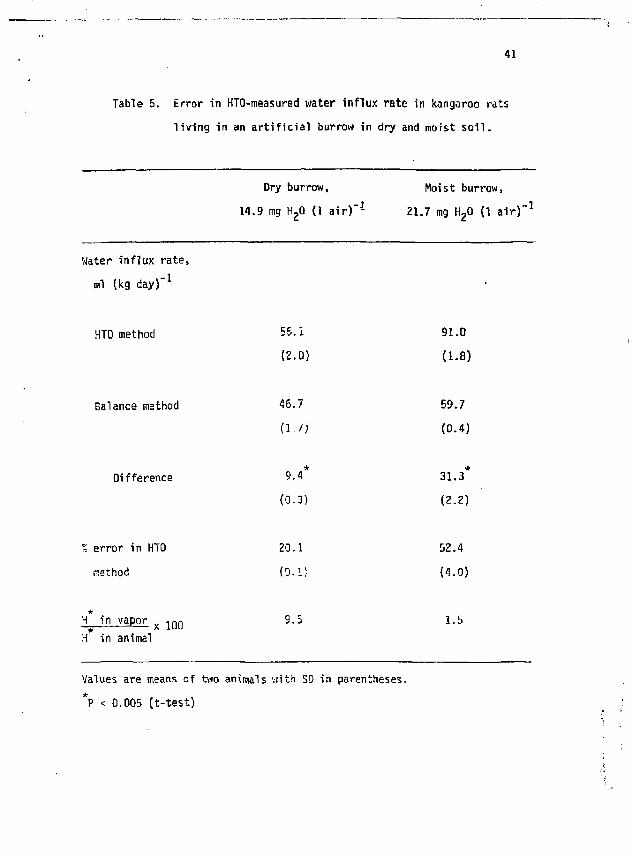
H in water vapor from both dry and moist burrows was less than 10% of H in the animals (Table 5). HTO overestimated water influx rates in both situations. The error was large in the moist burrow, and about as would be predicted from Table 3- In the dry burrow, the error was much
* lower but still significant. The comparatively low H in burrow water vapor indicates that labeled water lost from the animal rapidly exchanges with unlabeled soil water, even in relatively dry soil. This suggests that water flux measurements in burrowing animals will more likely include overestimates due to unlabeled vapor influx than underestimates resulting
23
from labeled vapor influx. The influx of ambient water vapor appears to be the largest potential error in field measurements, and it seems unavoidable.
Lifson and HcClintock (28) provide an equation which corrects for the input of labeled or unlabeled water vapor. However, its use requires knowledge of the specific activity of ambient water vapor and the rate of evaporative water loss. These are difficult to measure in field situations, but laboratory results from appropriate experiments might be of value in correcting field data.
Summary of evaluations of assumptions. Assumption (l) - constant body water volume. Equations are available for calculating accurate water flux rates from HTO turnover in animals whose water volume (w) remains constant, changes linearly or changes exponentially through time. Use of an inappropriate . ation can cause very large errors. Assumption {2;) -constant water flux rates. The above equations assume water fluxes ctre constant through time. When fluxes are not constant, these equations yield errors as high as 15% in extreme but biologically feasible situations. Under more realistic circumstances, errors are around 3%, and can be eliminated by appropriate adjustment of sampling times. Assumption (3) - tritium labels body water only. Some tritium from injected HTO becomes bourd to nonaqueous compounds in the body. If tritiun dilution space is equated with body water volume, errors ranging fro.n -6 to 13:'i of If can occur. The slow exchange of tritiui between water and nonaqueous compounds during a measurement piriod can cause errors in calculated water fluxes, but these errors can be avoided by appropriate adjustment of sampling times. Assumption (4) - tritium leaves animals only in the form of water. In kangaroo rats and lizards, the efflux of tritium that was bound to dry matter
24
in urine and feces was insignificant [<lt of total tritium efflux). ' Assumption (5.) - The specific activity in water leaving a labeled animal is the same as that in the animal's body water. In some situations, food may not remain in an animal's digestive tract long' enougij for labeled body water to equilibrate with water in the digests. This will cause underestimates in calculated flux rates. T H -tiated water is heavier than unlabeled water, and evaporates w . slowly. This can cause underestimates of as much as 10% in calculated water fluxes, depending on the proportion of total water loss that is due to evaporation and on the nature of water movement across the skin. In toads, the underestimate due to fractional evaporation was less than 5%. Assumption (6) - water in the environment does not enter animals across their skin or lung surfaces. Water does enter animals via their skin and lungs. The entry of water vapor by these routes can cause errors greater than ±50?, depending on am-bieif- humidity, specific activity of tritium in water ' ipor around the animal, the rate of liquid water flux through the animal, surface to volume re.tio, respiratory minute volume, etc. This phenomenon is apparently the largest unavoidable source of error in HTO measurements cf vsater flux.
ISOTOPE DECAY
Being a radionuclide, tritium disappears as a result of radioactive decay, with a half-life of about 12.3 years. This will cause a decline in H in an animal in addition to that caused by water flux. One v/ay to solve

25
this problem is simply to store all samples from an experiment and analyze them together. This way, the isotope in the«samples and in the animal are
decaying at the same rate, thereby cancelling out the error. If samples are not analyzed simultaneously, the decay erro" can be corrected using the equation (33)
In Hg c = In H* + k d t a - In ( h y ^ ) (8)
where H 2 C is the corrected Hg, k^ is the rate of tritium decay (1.53 x 10~ / day) and t is the time elapsed between analyses of H,, and Hn [not the time between taking the samples). Because the decay rate of tritium is so low, this correction does not become important until t is longer than several weeks, a
ISOTOPE TOXICITY
Isotopically labeled water is heavier than unlabeled water, and can have adverse effects on animals. For example, D-0 in body water concentrations between 1 and 25% depresses metabolism and growth, apparently by slowing biochemical reactions, and chronically higher concentrations in endotherms are usually fatal (32, 44, 51). In tritiated studies, HTO is normally used at concentrations of about one HTO molecule per ten billion HjO molecules of body water, so the "heaviness" of water in HTO-labeled animals should not disrupt the organise, but the radiation dase delivered by tritium might. The magnitude of the radiation dose an animal receives depends on the half-life of tritium in the organism and the amount of tritium administered. The latter usually depends on body size (as
26
this influences the volume of body fluid that can be removed for radio-assay) as well as on counting statistics. For animals weighing between 10 g and 1 kg, we usually inject about lyCi (g body mass}" . The maximum noninjurious dose suggested for HTO tracer experiments in mammals is 100 vCi (9 body miss)" (12). However, the maximum permissible body burden for humans has been set much 1 ower, from 1 to 3.7 mCi per individual, or about 0.02 uCi (g body mass)" (38, US National Bureau of Standards Handbook No. 69).
The tota"1 radiation dose (0, in rads) an animal receives from a single injection of HTO can be calculated with the equation (19)
D = 0.406 C* T 1 / z (9)
where C. is the initial specific activity of tritium in the animal in ijCi (g body mass)" and T ^ is half life of tritium in the body. For a 1 kg mammal injected with 1 pCi/g and having a predicted half-life of about 4 days (43), D = 1.6 rads. This is less than 1% of the dose needed to induce acute effects, such as diarrhea and radiation death, and less than 10% of the threshold for chronic effects (e.g., impaired fertility and cancer) in mainnals. (39). Thus, prudent use of HTO can avoid complications due to isotope toxicity.
SENSITIVITY ANALYSIS
Tt is important to know the si2e of errors that can oci_ur in calcu-* lated flux rates from analytical errors in the measurements of H , M, W
and t. We assessed this by solving equation 3 (steady state) with ficticious but realistic data. Then, we changed one value by 1%, solved the

27
equation again, and compared the results. This was repeated for each measured value, and over a wide range of combinations of values.
When Pleasured values of H, H or t are either too high or too low by 1%, the resulting error in the calculated flux rate will be close to
* 1%. Errors resulting from inaccurate measurement of H are more complicated, because the size of the flux rate error is related to the
•k *k ft *
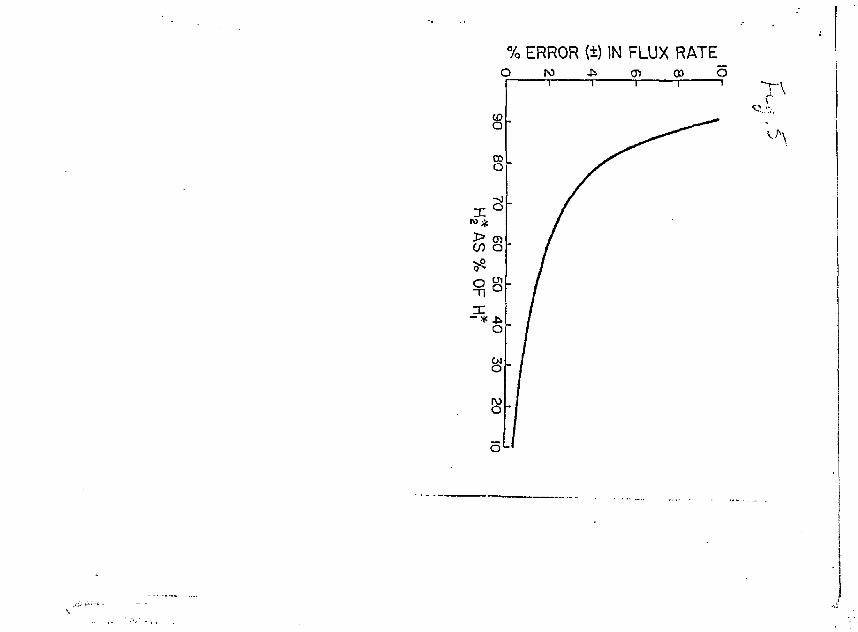
difference betvieen H, and H- If h^ is 902 of Hj, then a ±1% error in ir it
either H, or H2 yields a fiux rate error of about ±10% (Fig. 5). The
lower H, becoiras relative to H., the lower the flux rate error and at
one isotope half-l ife, the error is about 1.5%. When equations 4 and
5 (VI changing linearly through time) were examined as above, the resul
ting errors followed the same patterns as seen with equation 3, including *
the high sensitivity to errors in H shown in Fig. 5. However, the errors in water influx and water efflux rates were not equal. The one
containing the largest error depended en vihether VI was increasing or
decreasing. In field studies, errors of this kind can be minimized by
waiting for at least one half-life before recapturing HTO-labeled animals.
VALIDATION STUDIES
The accuracy of the labeled water method has been tested in many
soecies by comparison v;itP t'.e balance ~athod. Lifson and ftcCltntock.
(28) summarized the validazi^n studies dons with deuteralerf water:
nean errors ranged f om -3 to +5S in rats and mice. However, all the
HDD studies were done in netabolism chsnihers utilizing dry air , which
minimizes the error due to w3ter vapor influx thereby favoring validity
(26). All of the validation studies involving HTO were done in labora-
28
tory settings where ambient air was not dry. Nevertheless, a similar range of errors (-7 to H%) has been found in mammals (Table 6), although greater errors occurred in some reptiles.
These results are both encouraging and surprising. On the basis of the large errors from water vapor input measured in kangaroo rats {Tables 3 and 5), we expected the absolute errors in ther species to correlate with absolute humidity in ambient air. It may be that kangaroo rats are unusual in this regard, and that the magnitudes of the different types of errors vary between species, cancelling each other out to different degrees. For example, different species could show different degrees of fractional evaporation of HTO, which acts to cancel vapor input errors. The rate of air movement around an animal could affect the error from cutaneous water vapor input, through its influence on boundary layer thickness. Also, very small animals have high surface to volume ratios, and cutaneous vapor input may be relatively large (a possible explanation for the large error found in ]Jta_ lizards). These results indicate that HTO provides a reasonably accurate (± 10$) measure of water flux rates in most species tested thus far. However, there appears to be sufficient variation between species and sufficient unpredictability in the different causes of errors that we suggest: if in doubt, validate.

29
ACKNOWLEDGEMENTS This work was supported by Contract EY-76-C-03-0012 between the U.S.
Departaent of Energy and the University of California. Ue are grateful to Craig Adler, Ronald Gettinger, John Stallone and Lynn Taylor for laboratory assistance, HoWa*J Reiss and Hardin Strickland for mathematical advice, David Eisenberg, Park Nobel, Howard Reiss and Robert Scott for discussions about the biophysics of water, Malcolm Gordon vnd Robert Putnam for the loan of equipment and animals, and Paul Cooper, Eric Edney, Donald Hoyt, William Karasov, Nathan Lifson and Vaughan Shoemaker for generously commenting on the manuscript.
Present address of Daniel Costa is Physiology Research Laboratory, Scripps Institute of Oceanography, La Oolla, California 92037.

30
REFERENCES
1. Bohm, 8. C., and N. F. Hadley. Tritium-determined water flux in the free-roaming desert tenebriom'd beetle, Eleodes annata. Ecol. 58: 407-414, 1977.
2. fiuscarlet, L. A., and J. Proux. Etude a l'aide de Teau tritiee du renouvellement de Teau corporelle chez Locusta miqratoria migrator ioides. £. R. Acad. Sci. Paris, Serie D, 281: 14-9-1412, 1975.
3. Cameron, R. D., R. G. White, and J. R. Luick. Accuracy of the tritium water dilution method for determining water flux in reindeer (Rangifer tarandus). Can. JL Zool. 54: 857-862, 1975.
4. Coleman, T. G., R. D. Manning, R. A. Norman, and A. C. Guyton. Dynamics of water-isotope distribution. Am. J. Physiol. 223(6): 1371-1375, 1972.
5. Costa, W. R., K. A. Nagy, and V. H. Shoemaker. Observations of the behavior of jackrabbits (Lepus caliform"cus) in the Mojave Desert. J.. Mammal. 57: 399-402, 1976.
6. Culebras, J. M., and F. D. Moore. Total body water and the exchangeable hydrogen I. Theoretical calculation of nonaqueous exchangeable hydrogen in man. Ajn. J_. Physiol. 232(1): R54-R59, 1977.
7. Culebras, J. M., G. F. Fitzpatrick, M, F. Brennan, C. M. Boycen, and F. D. Moore. Total body water and exchangeable hydrogen II. A review of comparative data from animals based on isotope dilution and dessication, with a report of new data from the rat. Am. J. Physiol. 232(1): R60-R65, 1977.

31
Depocas, F., J. S. Hart, and h D. Fisher. Sea water drinking and water flux in starved and fed harbor seals, Phoca vijulina. Can. J.. Physiol. Pharmacol • 49: 53-62, 1971.
Devine, T. L., and G. 0. Wharton. Kinetics of water exchange between a mite, Laelaps echidnina, and the surrounding air. J.. Insect Physiol. 19: 243-254, 1973.
Edelman, I. W. The exchange of water between blood and tissues. Characteristics of deuterium oxide equilibration in body water. M.< i* Physiol. 171: 279-296, 1952.
Edney, E. B., and K. A. Nagy. Water balance and excretion. In: Environmental Physiology of Animals, edited by J. Bligh, J. L. Cloudsley-Thompson and A. G. Macdon&'M. Oxford: Bidckwell, 1976, p. 106-132.
Feinendegen, L. E. Tritium-labeled Molecules in Biology and Medicine. New York: Acad. Press, 1967, p. 344.
Foy, J. M., and H. Schniedan. Estimation of total body water (virtual tritium space) in the rat, cat, rabbit, guinea pig and man, and of the biological half-life of tritium in man. J. Physiol. 154: 169-176, 1960.
Gordon, A. J., J. K. Topps, and T. W. Begg. Total body water of rats as measured with different amounts of injected tritiated water. Proc. riutr. Soc. 30: 54A-55A, 1971.
Green, B. Water losses of the sand goanna (Varanus gouldii) in its natural environment. Ecology 53: 452-457, 1972.
Green, B., and J. D. DunSmore. Turnover of tritiated water and sodium in captive rabbits (Oryctolagus cunicuius). LL Marcmal.
59: 12-17, 1978.

32
17. Haines, H., B. Howard, and C. Setchell. Water content and distribution of tritiated water in tissues of australian desert rodents. Comp. Biochem. Physiol. 45A: 787-792, 1973.
18. Hatch, F. T., and J. A. Mazrimas. Tritiation of animals With tritiated water. Radiat. Res. 50: 339-357, 1972.
19. Hendee, W. R. Radioactive Isotopes in Biological Research. New York: John Wiley & Sons, 1973, p. 297.
20. Holleman, D. F., and R. A. Dieterich. Body water content and turnover in several species of rodents as evaluated by the tritiated water method. Ji. Mammal. 54: 456-465, 1973.
21. Holleman, D. F., and R. A. Dieterich. An evaluation of the tritiated water method for estimating body water in small rodents. Can. J. Zool. 53: 1376-1378, 1975.
Z2. Horton, J. H., J. C. Corey, and R. H. Wallaca. Tritium loss from water exposed to the atmosphere. Env. Sci. Tech. 5: 338-343, 1971.
23. Hulbert, A. J., and T. J. Dawson Hater metabolism in perameloid marsupials from different environments. Comp. Biochem. Physiol. 47A: 617-633, 1974.
24. King, V). W. Energy metabolism and body water turnover rates of free-living scorpions (Hadrurus). Ph.D. Disser, Arizona State Univ., Tempe, 1976, p. 104.
25. Kirshenbaum, I. Physical Properties and Analysis of Heavy Water. New York: McGraw-Hill, 1951.
26. Lee, J. S., and N. Lifson. Measurement of total energy and material balance in rats by means of doubly labeled water. Am. J. Physiol. 199: 238-242, 1960.
33
27. Lewis, L. D., and R. W. Phillips. Volume and kinetics of a slow tritium-hydrogen exchange in neonatal calves. Am. 0 . Physiol. 223(1): 74-76, 1972.
28. Lifson, N., and R. McClintock. Theory of use of the turnover rates of body water for measuring energy and material balance. J. Theoret. 8iol. 12: 46-74, 1966.
29. Macfarlane, W. V., and B. D. Siebert. Hydration and dehydration of desert camels. Aust. J. Exp. Biol. 45: P29, 1967.
30. Macfarlane, W. V., B. Howard, G. H. 0. Maloiy, and D. Hopcraft. Tritialad water in field studies of ruminant metabolism in Africa. In: Isotope Studies on the Physiology of Domestic Animals. Vienna: Int. Atomic Energy Agency, 1972, p. 83-93.
18 31. McClintock, R., and N. Lifson. CCL output of mice measured by D^O
under conditions of isotope re-entry into the body. Am. i). Physiol. 195(d): 721-725, 195?.
32. Minnich, 0. E., and V. H. Shoemaker. Diet, behavior and water turnover in the desert iguana, Dipsosaurus dorsal is. Am. Midi. Mat. 84: 496-509, 1970.
33. Nagy, K. A . Water and electrolyte budgets of a free-living desert lizard, Sauromalus obesus. J. Comp. Physiol. 79: 39-62, 1972.
3-1. Nagy, :<. A., V. H. Shoemaker, and W. R. Costa. Water, electrolyte anri nitrogen budgets of jackrabbi'ts (Lepus cal iform'cus) in the Mojave Desert. Physiol. Zool. 49: 351-363, 1976.
35. Nagy, K. A., R. S. Seymour, A. K. Lee, and R. Braithwaite. Energy and water budgets in free-living Antechinus stuartii (Marsupialia: Dasyuridae). J. Mammal. 59: 60-68, 1978.
34
36. Pace, N., L. Klein, H. K. Schachman, and M. Harfenist. Studies on body composition IV. Use of radioactive hydrogen for measurement in vivo of total body water. J_. Biol. Chem. 168: 459-46?, 1947.
37. Pinson, E. A. Water exchange and barriers as studied by the use of hydrogen isotopes. Physiol. Rev. 32: 123-234, 1952.
38. Pinson, E. A., and W. H. Langhair. Physiology and toxicology of tritium in man. J_. ftppl. Physiol. 10: 108-126, 1957.
39. Pizzarello, D. J., and R. L. Witcofski. Basic Radiation Biology. Philadelphia: Lea & Febiger, 1967.
40. Potts, Vi. T. W., and P. P. Rudy. Aspects of osmotic and ionic regulation in the sturgeon. J_. Exp. Biol. 56: 703-715, 1972.
41. Prentice, T. C W. Siri, N. I. Berlin, G. M. Hyde, R. J. Parsons, E. E. Joiner, and 0. H. Lawrence. Studies of total,body water with tritium. J. Cljm. Invest. 31; 412-418, 1952.
42. Price, A. H. Vapour pressure of tritiated water, f.'ature 18]: 262, 1958.
43. Richmond, C. R., W. H. Langham, and T. T. T r u j i l l o . Comparative
netabolism o f t r i t i a t e d water by mammals. J^ C e l l . Cotrrp. Physiol -
59: 45-53, 1962.
44. S ;~ is , H. V . , M. B. Ba i rd , and H. R. Massie. Deuterium oxide e f f ec t
en tsnperature-dependent surv ival in populations of Drosophila
nslanoqaster. Science 183: 427-423, 1974.
45. ScT ' id t -N ie lsen , K. Desert Animals: Physiological Problems of Heat
and Water, flew York: Oxford Univ. Press, 1964, p. 33-70.
46. Sepa l l , 0 . , .and S. G. Mason. Vapor/ l iqu id p a r t i t i o n of t r i t i u m in
t r i t i a t e d water. Can,. J . Chen. 33: 2024-2025, 1960.
35
47. Siebert, B. D., and W. V. Macfarlane. Water turnover and renal function in dromedaries in the desert. Physiol. Zool. 44: 225-240, 1971.
48. Siri, W. F., and J. Evers. Tritium exchange in biological systems. In: Tritium in the Physical and Biological Sciences, Vol. 2. Symp. Int. Atom. Energy Agency, 1952, p. 71-80.
49. Smith, B. S. W., and A. R. Sykes. The effect of routa of dosing and method of estimation of tritiated water space on the determination of total body water and the prediction of body fat in sheep. d_. Agric. Sci. 82: 105-112, 1974.
50. Springell, P. H. Water content and water turnover in beef cattle. Aust. J. Agric. Res. 19: 129-144, 1968.
51. Sutton, S. P., R. Dam, and 14. K. Nielsen. Biological effects of 0,0 administration to Coturnix japonica. Life Sci. 15: 2097-2103, 1974.
52. Thompson, R. C. Studies of metabolic turnover with tritium as a tracer. 1. Gross studies on the mouse. J_. Biol. Chem. 197: 81-87, 1952.
53. Tisavipat, A., S. Vibulsreth, H.-P. Sheng, and R. A. Huggins. Total body water measured by dessication and by tritiated water in adult rats. J.. Appl. Physiol. 37: 699-701, 1974.
54. Tucker, J. S., and F. L. Harrison. The incorporation of tritium in the body water and organic rather of selected marine invertebrates. Comp. Biochem. Physiol. 49: 337-397, 1974.
55. Walsberg, G. E. Digestive adaptations of Phainopgpla nitens associated with the eating of mistletoe berries. Condor 77: 169-174, 1975.
56. Watt, B. K., and A. L. Merrill. Composition of Foods. Agriculture Handbook No. 8. Washington, D.C: U.S. Department of Agriculture, 1963, p. 40
36
Table 1. Errors in calculated values of ml H_0 flux (kg day)" when the flux rates vary linearly through time, but W 2 = W, because of instantaneous water uptake or loss.
% error in calculated flux rate Point in measurement period of instantaneous water gain or loss beginning middle end
Loss > gain, volume -4.7 +1-4 +14.4 declining linearly, instantaneous water gain
Gain > loss, volume +14.4 +1.4 -4.7 increasing linearly, instantaneous water loss
See text for details of calculations

37
Table 2. Errors in estimated total body water volume (W) by HTO dilution space, as compared with measurements of W by drying to constant mass.
Animal H
9
Error % of W Reference
Mammals Mouse (Calom.ys) Mouse (Peromyscus) Mouse (Mus) Mouse (Antechinus) Vole (Microtus) Rat fDinodcmvs)
* " reinjection
Mouse (Acoroys) Lemming (lemnus)
Rat (Rattus)
Guinea-pig (Ca\naJ
Rabbit (Oryctolagus)
Sheep (Ovi.s)
18 +5.2 19 +2.3 20? +3.7 26 +6.2 •23 +0.1 44 +2.1 39 +3.1 57 +2.3 64 -5.7 227 +1.7
1ED-250 +6.5 200? +6.4 162 + T2.0
70-190 +9.7 500? +1.6 1300 +3.1 3200 +2.8
41000 +3.0
Holleman & Oietericl. (21) Holleman & Dieterich (21) Sin" & Evers (48) Nagy et al. (35) Holleman & Dieterich (21) Nagy (unpubl.) Nagy (unpubl.) Holleman & Dieterich (21) Holleman 8 Dieterich (21) Culebrjs et al. (7) Foy & Scfinieden (13) Siri & Evers (43) Tisavfpat et aT. (53)
Gordon et al. (14) Siri & Evers (4S) Green 6 Dunsmore (16) Pace et al. (36) Smith a Sykes (49)

Table 2 - Page 2 38
Bird Pigeon (Columba) 300? +2.5 Siri & Evers (48)
Reptiles Anole (Anolis) 1.2 +4.0 Nagy & Rand (unpubl.) Chuckwalla (Sauromalus) 167 +3.9 Nagy (urpubl.)
Arthropods Beetle (Eleodes) 1.0 +13.1 Bohm & Hadley (1) Scorpion (Hadrurus) 6 +6.0 King (24)
Values are th« overestimate (+) or underestimate (-} contained in the HTO space value, expressed in terms of percent of U. Reinjection of animals previously labeled with HTO.

39
Table 3. Error in KTO measured water influx rate resulting from
input of unlabeled water vapor via lungs and skin in
kangaroo rats.
Absolute humidi ty, mg HgO {1 air) -l
3.8 6.8 10.* 16,8 19.8
Water influx rate. ml (kg day)" HTO method 48.9 52.3 57.6 74.0 89.3
(2-2) (2.7) (2.8) (3.0) (7.7)
Balance method 45.6 46.0 47.0 50.2 62.6 (3.7) (4.3) (1.9) (3.0) (9.9)
* * * * * * + * * •
Difference +3.3 +6.3 +1C.6 +23.9 +26.8
(2.7) (4.1) (1.8) (3.5) (4.1)
* error in HTO +7.7 +14.3 +22.7 +47.9 +44.2
method (6.2) (9.4) ( ; . l ) (8.5) (12.5)
Values are nisans of six animals with SD in paren-.-.eses.
P <0.05, and p <0.005 ( t - tes t ) * as compared .-nth a difference of zero.
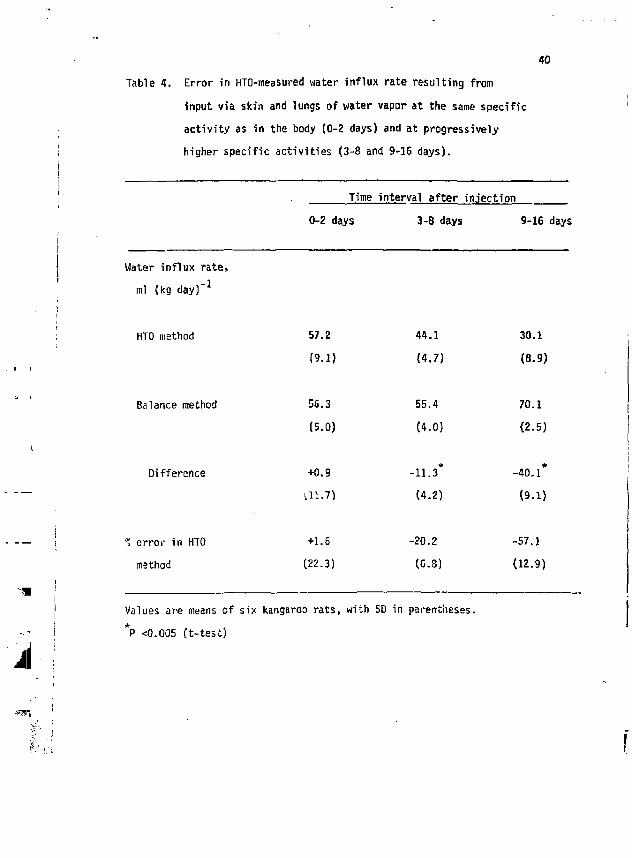
40 Table 4. Error in HTO-measured water influx rate resulting from
input via skin and lungs of water vapor at the same specific activity as in the body (0-2 days) and at progressively higher specific activities (3-8 and 9-16 days).
Time interval after injection 0-2 days 3-8 days 9-16 days
Water influx rate, ml (kg day) -
HTO method
Balance method
Difference
% error in HTO method
Values are means of six kangaroo rats, with SD in parentheses. *P <0.005 (t-test)
57.2 44.1 30.1
(9.1) (4.7) (a. 9)
56.3 55.4 70.1
(5.0) (4.0) (2-5)
+0.9 *
-11.3 -40.1*
U1.7) (4.2) (9.1)
+1.6 -20.2 -57.1
(22.3) (6.3) (12.9)
41
Table 5. Error in HTO-measured water inf lux rate tn kangaroo rats
l i v ing in an a r t i f i c i a l burrow in dry and moist s o i l .
Water influx rate,
ml (kg day)" 1
Dry burrow, Hoist burrow,
14.9 mg HgO (1 a i r ) " 1 21.7 mg HgO (1 a i r ) " 1
HTO method
(2.0)
Hg in vapor x 1 Q 0 9.5 H in animal
91.0
(1-8)
59.7
(0.4)
Balance method 46.7
( i . / ;
Difference 9.4 31.3
(0.3) (2.2)
% error in HTO 20.1 52.4
method (0.1! (4.0)
1.5
Values are means of two animals viith SO in parentheses. *P < 0.005 (t-test)

Table 6. Summary of HTO validation studies in animals.
H, Absolute Humidity
Animal g mg H 20 (1 air) -1 Error in HTO method
ml (kg day)" 1 * Reference
Mammals: Kanga .in rat (Dipodomys) Squirrel (Aminos permophi! us) Gopher (Thomomys) Marsupials (Perameles)
(Nacrotis) (Isoodon)
Oackrabbit (Lepus) Rabbit (Oryctolaqus) Monkey (Alouatta) Reindeer (Rangifer)
35 19.8
96 8-12
125 18
9 7 ^
1081 V 6-10
1468^7
1800 6-12
1800 <20
5600 20
9600 <9.4
<3.4
<1.1
+26.8 +44.2 from Table 3
+1.1 +0.5 W. H. Karasov (pers. comm.)
-3.0 -3.2 R. D. Gettinger (pers. comm
-7 Hulbert and Dawson (23)
+1.7 +1.1 Nagy et a l . (34)
+2.0 +.1.6 firecn and Dunsmore (16)
-3.0 -4.0 Na<iy and Milton (unpubl.)
-0.2 -0.1 Cameron et a l . (3)
-1.5 -2.5
+0.5 +1.3

Table 6 - Page 2
Reptiles Lizard (Uta) 3 12 Lizard (Sauromalus) 167 4 Tortoise (Gopherus) 520 12
+6.1 +29.1 Nagy [unpubl.
-0.3 -2.0 Nagy (33)
+1.3 +11,5 Nagy [unpubl.
Errors are shown as the over- or underestimate in ml (kg day)" and as percent of to ta l in f lux rate.

44
FIGURE LEGENDS
Fig. 1. Percentage error in calculated rates of water efflux resulting from the use of inappropriate equations. Errors are shown as functions of the total percent change L~100 (Wg-W^/U^ in body water volume (H), with M changing linearly through time.
Fig. 2. Errors in calculated water efflux rates resulting from cyclic variation in body water volume in a jackrabbit. Changes in body mass were assumed to be due only to changes in body water volume, which cycled because rates of water influx were not constant through time. See text for calculation methods.
Fig. 3. Fractional evaporation of HTO from a beaker (dots) and a toad (circles), as indicated by the increase in tritiun specific activity in the liquid phase during evaporation. The dashed lines represent the increase expected if the fractionation factor (F) = 0.77 (42) or 0.92 (46)
* Fig. 4. Change in tritium specific activity (H ) through time in kangaroo rats exposed to tritiated water vapor that was he'd at a constant H (bubbler).
Fig. 5. Error introduced into calculated flux rats (equation 3) a<= a * * _ result of an analytical error of 1% in H 1 or W^. (he flux error will be
positive or negative depending on the polarity of the error in H .
% ERROR IN EFFLUX RATE
BODY MASS, kg % ERROR o iv .K
i\a
w o
45.
o
OS > -z. O m ^ o
s
8 s o s ^—" T\
^
h^) 1.6 y
y y
1.5 y IF F=0.77,/
1.4 y y
y 13 y
HJF1.2 -y S BEAKER (F=0.91)
1.1 - y y
/ • ^ - - < r - - : I F F = 0-92
y *$f ^ o o - ^ — TOAD (F=0.95) 1.0
.95 1 1 1 . . i J 1 1 1 1 _
1.0 .8 .6 .5 .4 .3 .2 j PROPORTION OF INITIAL VOLUME REMAINING
i . /
10 r
BUBBLER
KANGAROO RATS
• t i i i i i \ t
0 2 8 16 DAYS AFTER INJECTION
% ERROR (±) IN FLUX RATE O W -t> CF) CD Q ~r~ TV
CD
a CO
o
* 3
C/3 O
O g x - * * o
CM
o
8
u^
oU