laboratory report of multiphase thermodynamics
DESCRIPTION
labreportTRANSCRIPT

Laboratory Report of Multiphase
Thermodynamics (B49CE)
Heat Loss from Pipes
By Retriana Maharani [H00205565]

1. ObjectivesThe objectives of this experiment is to find the rate at which the heated rod cools down within a bank of rods and by itself and also to plot the cooling curves and use the curves to find the coefficient of heat transfer for the heat rod at various positions.
2. IntroductionHeat exchanger has several types but the main forms are: parallel flow, counter-flow and cross-flow. In this experiment, the heat transfer rate associated with the cross flow of air across a cylindrical copper rod at various velocities has been investigated. The aim of the experiment is to determine the heat transfer coefficient under cross flow forced convection conditions. The real life application for forced convection are for example, car radiator or air cooled heat exchangers.
3. Basic TheoryConvection refers to heat transfer that will occur between a surface and a moving or stationary fluid when they are at different temperatures. The convection heat transfer mode were made by random molecular motion and by the bulk motion of fluid within the boundary layer. The convection can be classified according to the nature of the flow. Forced convection occurs when the fluid flows across the boundary of an object with the movement cause by external forces such by a fan, a pump or atmospheric winds. In other words, free or natural convection is induced by buoyancy forces which is due to density differences caused by temperature variations in the fluid. Example for free convection would be a a hot components on a vertical array of circuit boards in air.
4. EquipmentThe equipment used for this experiment are consist of a cross flow heat exchanger, copper cylindrical rod, the control-instrumentation unit (electric heater) and a stopwatch. This exchanger demonstrated the heat exchange by forced convection. The fixed electric fan on the equipment will draw air through a duct. The working section part is transparent and it includes holes for insertion of the heated rod and aluminum rods. It is arranged at right angles to the airflow. The aluminum rods and heated rod will be inserted into the chosen positions which in this case is for heated rod will be put in column 1 and column 4. Then the fan will be run and the air valve will be adjusted to a selected position. The heated rod was heated by the heater compartment in the control and instrumentation unit which is heated by an electric heater and it is also includes a temperature control system to keep the temperature steady.
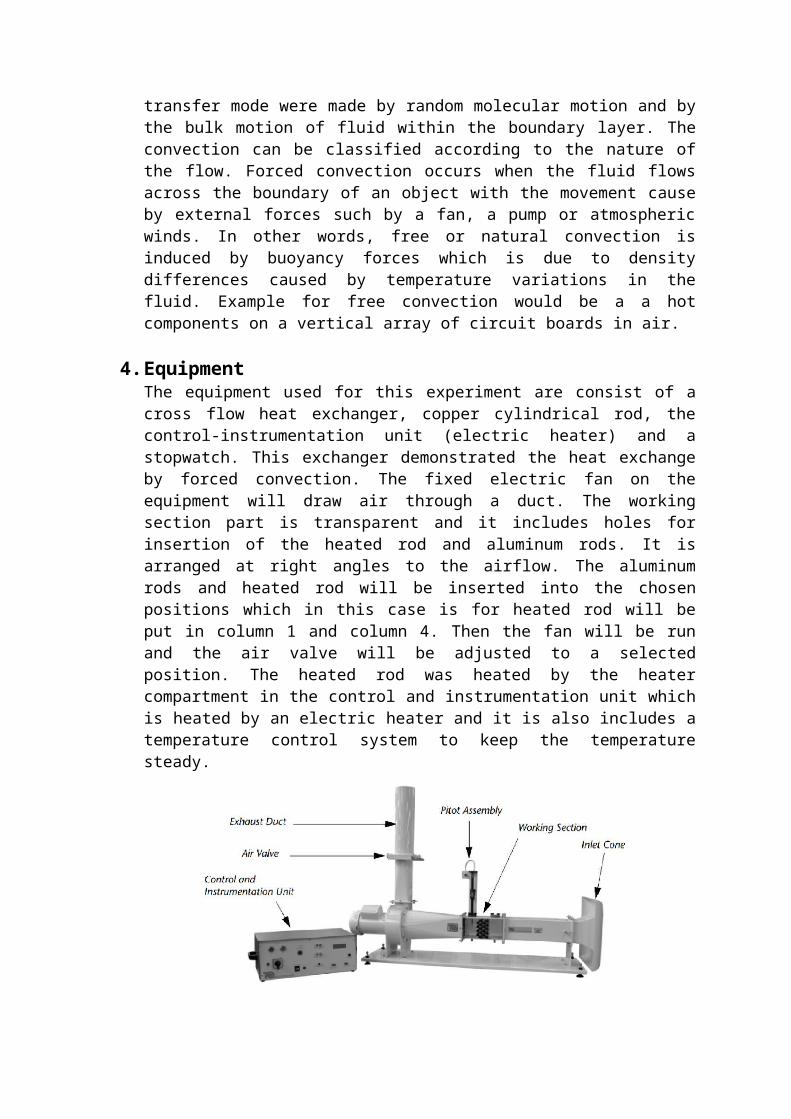
Figure 1. Heat Exchanger for Forced Convection Equipment5. Experiment Procedure
a. The rods were fitted into the working section (except for the upstream centre position in column 1). The position in column 1 was left free and ready for the heated rod.
b. The control and instrumentation unit was switched on and the heated rod was inserted into its heater compartment.
c. ‘Heater Power’ was switched on.d. The valve was fully open (100%).e. The fan was switched on the ambient air temperature (T1) was recorded.f. The heated rod from its heater compartment was removed and was fitted into the
working section. Then, the temperature of the heated rod (T2) in intervals of ten seconds until 150 seconds was recorded.
g. The experiment was repeated with air valve open at 50% and 30%.h. The experiment was also repeated with the heated rod in 1st and 4th column.i. Finally, the fan and the ‘heater power’ switch were switched off.j. The control and instrumentation unit were also switched off.
6. Data & Results
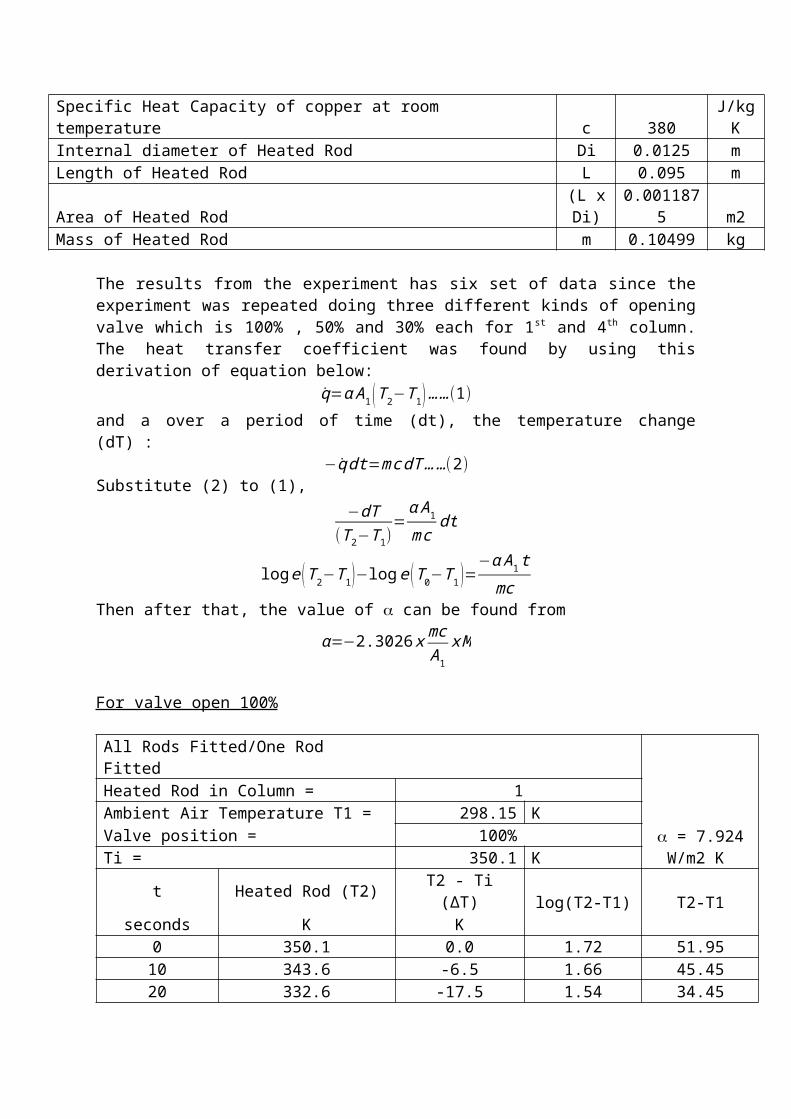
The heated rod used in here has a length of 95 mm and an internal diameter of 12.5mm. Below here is an useful data needed to calculate the heat transfer coefficient.
Useful dataThermal Conductivity of air x 0.0259 J/ms KGas constant of air R 287 J/kgKDynamic Viscosity of air at room temperature 𝞵 18.2E10-6 kg/msSpecific Heat Capacity of air at low pressure and room temp. Cp 1004.5 J/kg KSpecific Heat Capacity of copper at room temperature c 380 J/kg KInternal diameter of Heated Rod Di 0.0125 mLength of Heated Rod L 0.095 mArea of Heated Rod (L x Di) 0.0011875 m2Mass of Heated Rod m 0.10499 kg
The results from the experiment has six set of data since the experiment was repeated doing three different kinds of opening valve which is 100% , 50% and 30% each for 1 st and 4th
column. The heat transfer coefficient was found by using this derivation of equation below: q̇=α A1 (T 2−T 1 )……(1)
and a over a period of time (dt), the temperature change (dT) :−q̇ dt=mc dT……(2)
Substitute (2) to (1),−dT
(T 2−T 1)=α A1
mcdt
log e (T2−T 1 )−log e (T 0−T 1 )=−α A1tmc
Then after that, the value of can be found from

α=−2.3026 x mcA1xM
For valve open 100%
All Rods Fitted/One Rod Fitted
= 7.924 W/m2 K
Heated Rod in Column = 1Ambient Air Temperature T1 = 298.15 KValve position = 100%Ti = 350.1 K
t Heated Rod (T2) T2 - Ti (ΔT) log(T2-T1) T2-T1seconds K K
0 350.1 0.0 1.72 51.9510 343.6 -6.5 1.66 45.4520 332.6 -17.5 1.54 34.4530 324.7 -25.4 1.42 26.5540 317.5 -32.6 1.29 19.3550 311.6 -38.5 1.13 13.4560 307.8 -42.3 0.98 9.6570 304.4 -45.7 0.80 6.2580 301.8 -48.3 0.56 3.6590 299.8 -50.3 0.22 1.65
100 298.4 -51.7 -0.60 0.25110 297.2 -52.9 - -0.95120 296.5 -53.6 - -1.65130 295.8 -54.3 - -2.35140 295.4 -54.7 - -2.75150 295.1 -55.0 - -3.05
0 20 40 60 80 100 120 140 1600.00
2.00
4.00
6.00
8.00
10.00
12.00
f(x) = NaN x + NaNColumn 1 with Valve 100%
Column 1 with Valve 100% Linear (Column 1 with Valve 100%)
All Rods Fitted/One Rod Fitted = 2.964 W/m2 KHeated Rod in Column 4
Ambient Air Temperature T1 = 298.15 KValve position = 100% Ti = 350.1 K
t Heated Rod (T2) T2 - Ti (ΔT) log(T2-T1) T2 - T1seconds K K
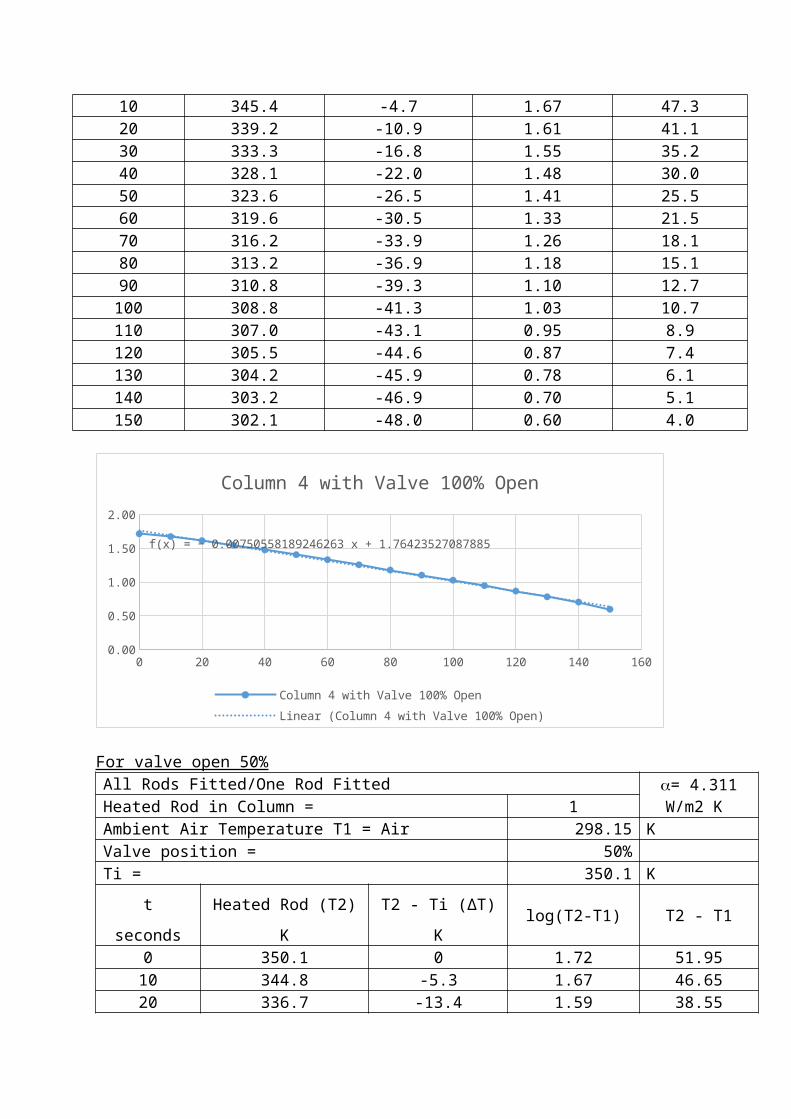
0 350.1 0.0 1.72 52.010 345.4 -4.7 1.67 47.320 339.2 -10.9 1.61 41.130 333.3 -16.8 1.55 35.240 328.1 -22.0 1.48 30.050 323.6 -26.5 1.41 25.560 319.6 -30.5 1.33 21.570 316.2 -33.9 1.26 18.180 313.2 -36.9 1.18 15.190 310.8 -39.3 1.10 12.7
100 308.8 -41.3 1.03 10.7110 307.0 -43.1 0.95 8.9120 305.5 -44.6 0.87 7.4130 304.2 -45.9 0.78 6.1140 303.2 -46.9 0.70 5.1150 302.1 -48.0 0.60 4.0
0 20 40 60 80 100 120 140 1600.000.200.400.600.801.001.201.401.601.802.00
f(x) = − 0.00750558189246263 x + 1.76423527087885
Column 4 with Valve 100% Open
Column 4 with Valve 100% Open Linear (Column 4 with Valve 100% Open)
For valve open 50%All Rods Fitted/One Rod Fitted = 4.311 W/m2
K Heated Rod in Column = 1

Ambient Air Temperature T1 = Air 298.15 KValve position = 50% Ti = 350.1 K
t Heated Rod (T2) T2 - Ti (ΔT) log(T2-T1) T2 - T1seconds K K
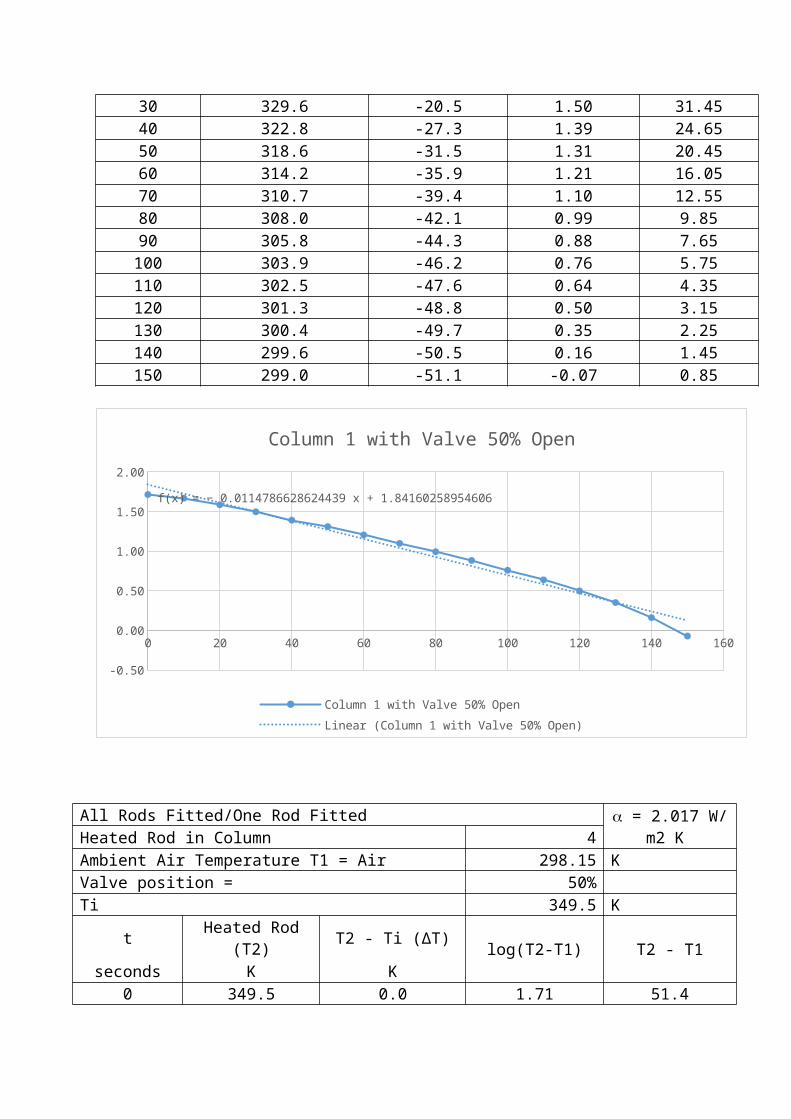
0 350.1 0 1.72 51.9510 344.8 -5.3 1.67 46.6520 336.7 -13.4 1.59 38.5530 329.6 -20.5 1.50 31.4540 322.8 -27.3 1.39 24.6550 318.6 -31.5 1.31 20.4560 314.2 -35.9 1.21 16.0570 310.7 -39.4 1.10 12.5580 308.0 -42.1 0.99 9.8590 305.8 -44.3 0.88 7.65
100 303.9 -46.2 0.76 5.75110 302.5 -47.6 0.64 4.35120 301.3 -48.8 0.50 3.15130 300.4 -49.7 0.35 2.25140 299.6 -50.5 0.16 1.45150 299.0 -51.1 -0.07 0.85
0 20 40 60 80 100 120 140 160
-0.50
0.00
0.50
1.00
1.50
2.00
f(x) = − 0.0114786628624439 x + 1.84160258954606
Column 1 with Valve 50% Open
Column 1 with Valve 50% Open Linear (Column 1 with Valve 50% Open)
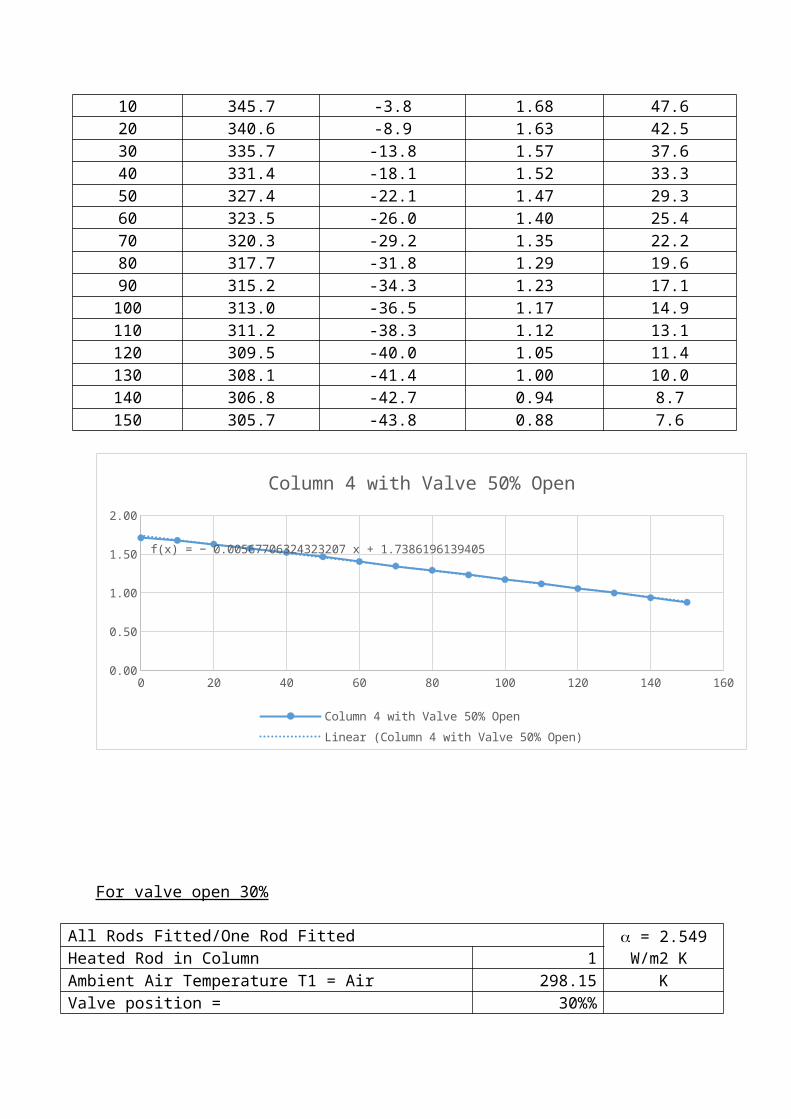
All Rods Fitted/One Rod Fitted = 2.017 W/ m2 K Heated Rod in Column 4
Ambient Air Temperature T1 = Air 298.15 K
Valve position = 50% Ti 349.5 K
t Heated Rod (T2) T2 - Ti (ΔT) log(T2-T1) T2 - T1seconds K K
0 349.5 0.0 1.71 51.410 345.7 -3.8 1.68 47.620 340.6 -8.9 1.63 42.530 335.7 -13.8 1.57 37.640 331.4 -18.1 1.52 33.350 327.4 -22.1 1.47 29.360 323.5 -26.0 1.40 25.470 320.3 -29.2 1.35 22.280 317.7 -31.8 1.29 19.690 315.2 -34.3 1.23 17.1
100 313.0 -36.5 1.17 14.9110 311.2 -38.3 1.12 13.1120 309.5 -40.0 1.05 11.4130 308.1 -41.4 1.00 10.0140 306.8 -42.7 0.94 8.7150 305.7 -43.8 0.88 7.6
0 20 40 60 80 100 120 140 1600.00
0.20
0.40
0.60
0.80
1.00
1.20
1.40
1.60
1.80f(x) = − 0.00567706324323207 x + 1.7386196139405
Column 4 with Valve 50% Open
Column 4 with Valve 50% Open Linear (Column 4 with Valve 50% Open)
For valve open 30%
All Rods Fitted/One Rod Fitted = 2.549 W/m2 K Heated Rod in Column 1
Ambient Air Temperature T1 = Air 298.15 KValve position = 30%% Ti 350 K
t Heated Rod (T2) T2 - Ti (ΔT) log(T2-T1) T2 - T1seconds K K
0 350.0 0 1.71 51.910 345.7 -4.3 1.68 47.620 339.7 -10.3 1.62 41.630 334.7 -15.3 1.56 36.640 329.2 -20.8 1.49 31.150 324.5 -25.5 1.42 26.460 320.6 -29.4 1.35 22.570 317.3 -32.7 1.28 19.280 314.3 -35.7 1.21 16.290 311.9 -38.1 1.14 13.8
100 309.6 -40.4 1.06 11.5110 307.8 -42.2 0.98 9.7120 306.3 -43.7 0.91 8.2130 305.0 -45.0 0.84 6.9140 303.8 -46.2 0.75 5.7150 302.7 -47.3 0.66 4.6
0 20 40 60 80 100 120 140 1600.000.200.400.600.801.001.201.401.601.802.00
f(x) = − 0.00712205783639891 x + 1.7632981557724
Column 1 with Valve 30% Open
Column 1 with Valve 30% Open Linear (Column 1 with Valve 30% Open)
All Rods Fitted/One Rod Fitted = 1.566 W/m2 K Heated Rod in Column 4
Ambient Air Temperature T1 = Air 298.15 KValve position = 30% Ti = 350.5 K
t Heated Rod (T2) T2 - Ti (ΔT) log(T2-T1) T2 - T1seconds K K
0 350.5 0.0 1.72 52.4
10 348.5 -2.0 1.70 50.420 344.1 -6.4 1.66 46.030 340.1 -10.4 1.62 42.040 336.5 -14.0 1.58 38.450 332.6 -17.9 1.54 34.560 329.3 -21.2 1.49 31.270 326.3 -24.2 1.45 28.280 323.6 -26.9 1.41 25.590 321.0 -29.5 1.36 22.9
100 318.4 -32.1 1.31 20.3110 316.8 -33.7 1.27 18.7120 314.9 -35.6 1.22 16.8130 313.2 -37.3 1.18 15.1140 311.7 -38.8 1.13 13.6150 310.2 -40.3 1.08 12.1
0 20 40 60 80 100 120 140 1600.00
0.20
0.40
0.60
0.80
1.00
1.20
1.40
1.60
1.80
2.00
f(x) = − 0.00436666961043535 x + 1.74787398295144
Column 4 with Valve 30% Open
Column 4 with Valve 30% Open Linear (Column 4 with Valve 30% Open)
Discussion
According to two graphs each represent the data or what happened in column 1 and 4 when the valve is fully open and 50% the heat transfer coefficient have a quite large differences. This may happen due to the heat loss when the forced convection happened. The reason for column 1 has a higher heat transfer coefficient is because the location of column 1 is almost directly after the inlet while column 4 has a barrier before it which is column 2 and 3 and the heat is already loss when it reached the column 4. The same thing also happened when the valve is 30% open. The only thing that can be found is that the heat transfer coefficient value differences for column 1

and 4 are not that high. This may happen because of the valve opening, it means that the flow is reduced and the heat loss may also be reduced.
Conclusions
This experiment shows how heat transfer coefficient changed with a varied air valve opening from 100%, 50% and 30% and it is also depends on which columns or the location of the column. Column 4 is a bit far than Column 1 from the inlet in which it will have less heat loss and also heat transfer coefficient. Depends on the opening, the valve with fully open will have higher heat transfer coefficient than half open or 30% open. There might be some error found in the value of experiment, it may be found because of the timing for stopwatch not exactly the same as when turning on the heater or the reading from the equipment might also be going too fast when it was the time to read the value of T.
7. References1. Çengel, Yunus A., Heat Transfer: A Practical Approach, 2nd edition,
McGrawHill, New York, 2003.