laboratory studies of pyrrhotite oxidation mend …mend-nedem.org/wp-content/uploads/1212.pdf ·...
TRANSCRIPT

LABORATORY STUDIES OFPYRRHOTITE OXIDATION
MEND Project 1.21.2
This work was done on behalf of MEND and sponsored byINCO Limited,Noranda Inc.,
the Ontario Ministry of Northern Development and Mines andthe Canada Centre for Mineral and Energy Technology (CANMET)
through the CANADA/Northern Ontario Development Agreement (NODA)
March 1998

LABORATORY STUDIES
OF PYRRHOTITE OXIDATION
Final Report
To
CANMET - Contract No. 23440-4-1198/01
Inco Limited
Centre Technologie Noranda
Principal Investigators
R.V. Nicholson, Department of Earth Sciences
J.M. Scharer, Department of Chemical Engineering
Research Assistants
E.C.M. Kwong, Department of Chemical Engineering
M.P. Janzen, Department of Earth Sciences
University of Waterloo
Waterloo, ON N2L 3G1
March, 1998

ii
EXECUTIVE SUMMARY
Pyrite and pyrrhotite are the most abundant sulphides in mine wastes worldwide. While there is a
large body of information related to the weathering of pyrite and the effects of this process on
water quality, there is a significant deficiency of information on the weathering reactions and the
controls on pyrrhotite reaction rates. Unlike pyrite, pyrrhotite represents a range of chemical
composition as indicated by the formula Fe1-xS in which x can vary from 0 to 0.125. This also
implies that there is an inherent deficiency of iron in the crystal structure, possibly representing
less structural stability than that of pyrite. Several crystallographic forms of pyrrhotite are known.
The objectives of this investigation were:
1) to assess the kinetic controls on pyrrhotite oxidation;
2) investigate the effects of crystal structure, metal impurities, surface area, and bacterial
catalysis on oxidation reaction rates;
3) assess the dynamics and effects on water quality of pyrrhotite oxidation in tailings column
studies; and
4) develop a modelling approach consistent with the mechanisms and controls on pyrrhotite
oxidation reactions.
This study was conducted in three distinct phases. The first phase involved twelve distinct
pyrrhotite samples for a detailed study of fundamental chemical kinetics of oxidation by oxygen
and ferric iron. The second phase comprised characterization and kinetic studies on actual
pyrrhotite concentrate obtained from the Inco Clarabell Mill (Sudbury). The pyrrhotite concentrate
material was studied to assess the oxidation kinetics for different conditions of temperature, pH
and bacterial catalysis. The third phase of the investigation involved testing of pyrrhotite tailings
material in columns designed to assess the effects of sulphur content (2 % to 6 % S2-), bacterial
inoculation (Thiobacillus ferrooxidans), the presence of calcite (1 % CaCO3) and enstalite (5 %
MgSiO3) as neutralizing solids, and the presence of fine-grained pyrrhotite material (< 45 µm) in
the tailings.
The specific surface areas (area/mass) of selected particle size-fractions varied significantly among
iii
pyrrhotite specimens and exhibited values that were a factor of 2 to 10 times greater than those of
similar size pyrite particles and 6 to 40 times greater than calculated theoretical surface areas
assuming spherical smooth geometry. The rates of abiotic oxidation by oxygen as exhibited by
iron production were, on average, ten times greater than rates for pyrite oxidation under similar
conditions. Oxidation rates by ferric iron, however, were about one-fourth of those for pyrite
oxidation under similar conditions. The effect of temperature was similar to that observed for
pyrite oxidation with activation energy values in the range of 50 to 60 kJ mol-1. Crystallographic
structure and trace metal content showed no consistently significant effects.
The effect of bacterial inoculation differed with pH and temperature. The maximum biologic rate
of sulphate production was observed at pH = 4 with rates that were approximately 10 times those
in non-biologic tests. Non-biologic rates and biologic rates approached similar values at pH values
of 2 and 6. The column studies confirmed the effects of bacterial activity on oxidation rates with
similar behaviour in a column that had been inoculated and one that had not been inoculated.
Oxidation rates and loading rates for sulphate, iron and nickel were similar in both columns
containing 6 % S2-. Only slightly lower loading rates for sulphate and iron were observed in the
column containing 2 % S2- but nickel release rates were higher than those in the 6 % S2- column.
The oxygen consumption rates reflected the loading rates of pyrrhotite oxidation products. In
general, the oxygen consumption rates were a factor of 3 to 10 higher than the stoichiometrically
equivalent sulphate production rates initially but oxygen consumption and sulphate release rates
converged with time. The average molar ratio of Fe : SO4 was about 0.9 to 0.96 suggesting that,
on average, pyrrhotite oxidation produced Fe2+ and SO42- stoichiometrically.
The presence of calcite in the 6 % S2- tailings resulted in similar oxygen consumption and sulphate
release rates to those observed for the non-carbonate tailings. However, the calcite maintained a
near neutral pH condition in the pore water with the result that Fe and Ni release rates were
significantly lower. The presence of enstatite, representing a silicate buffer, resulted in porewater
with pH = 4 to 5 and some additional ferric hydroxide precipitation with subsequent decreases in
nickel release rates compared to the control. The difference between the carbonate and silicate
buffered tailings was the pH of the porewater with the carbonate column maintaining near neutral
pH and causing almost complete precipitation of the iron.

iv
The results indicate that characteristics of pyrrhotite such as metal impurities and
crystallographic form do not affect oxidation rates significantly. The surface area of the
pyrrhotite particles is by far, the most significant parameter required to assess oxidation rates for
pyrrhotite in tailings. The results of the column tests indicate that oxygen transport is the most
important phenomenon and small uncertainties in reaction kinetics will not significantly affect
long-term predictions for tailings oxidation when both kinetics and oxygen mass transport are
considered in geochemical modelling.

v
SOMMAIRE
La pyrite et la pyrrhotine sont les sulfures les plus abondants dans les déchets miniers du monde
entier. Bien qu'il existe un important corpus d'information relative à l`altération de la pyrite et
aux effets de ce phénomène sur la qualité de l'eau, on connaît mal les réactions intervenant dans
l`altération et les facteurs qui contrôlent le taux de réaction de la pyrrhotine. Contrairement à la
composition chimique de la pyrite, celle de la pyrrhotine varie beaucoup comme l'indique la
formule Fe1-xS où x peut varier de 0 à 0,125. Ceci indique aussi une carence inhérente en fer
dans la structure cristalline, correspondant peut-être à une moins grande stabilité structurale que
dans le cas de la pyrite. La pyrrhotine se présente sous plusieurs formes cristallographiques
connues.
Les objectifs de ces travaux étaient les suivants:
1) évaluer les facteurs cinétiques qui influencent l'oxydation de la pyrrhotine;
2) étudier les effets de la structure cristalline, des impuretés de métal, de la surface et de la
catalyse bactérienne sur le taux d'oxydation;
3) évaluer la dynamique et les effets sur la qualité de l'eau de l'oxydation de la pyrrhotine
dans des études portant sur des colonnes de résidus;
4) élaborer une approche de modélisation qui concorde avec les mécanismes et les facteurs
de contrôle s'exerçant sur les réactions d'oxydation de la pyrrhotine.
Cette étude a été réalisée en trois phases distinctes. La première phase consistait à étudier de
manière détaillée douze échantillons de pyrrhotine la cinétique chimique fondamentale de
l'oxydation par l'oxygène et l'ion ferrique. La deuxième phase consistait à caractériser le
concentré de pyrrhotine obtenu de Clarabell Mill (Inco-Sudbury) et à en étudier la cinétique. On
a étudié le concentré de pyrrhotine pour évaluer la cinétique de l'oxydation dans différentes
conditions de température, de pH et de catalyse bactérienne. La troisième phase de l'étude
consistait à tester des résidus de pyrrhotine dans des colonnes conçues pour évaluer les effets de
la teneur en soufre (2 % à 6 % S2-), de l'inoculation bactérienne (Thiobacillus ferrooxidans), de
la présence de calcite (1 % CaCO3) et d'enstalite (5 % MgSiO3) comme solides neutralisants,

vi
ainsi que de la présence de pyrrhotine à fine granulométrie (< 45 Φm) dans les résidus.
La surface spécifique (aire/masse) de certaines fractions granulométriques variait beaucoup d'un
échantillon de pyrrhotine à l'autre et elle pouvait être 2 à 10 fois plus élevée que celles des
particules de pyrite de taille analogue et 6 à 40 fois supérieures aux surfaces théoriques calculées
en supposant une géométrie sphérique lisse. Le taux d'oxydation abiotique par l'oxygène indiqué
par la production de fer était en moyenne dix fois plus élevé que le taux d'oxydation de la pyrite
dans des conditions analogues. Le taux d'oxydation par l'ion ferrique était toutefois le quart
environ du taux d'oxydation de la pyrite dans des conditions analogues. L'effet de la température
était analogue à celui qu'on observait pour l'oxydation de la pyrite avec des énergies d'oxydation
variant de 50 à 60 kJ mol-1. La structure cristallographique et la teneur en métaux à l'état de
traces n'avait pas d'effet important de manière soutenue.
L'effet de l'inoculation bactérienne variait en fonction du pH et de la température. Le taux
maximal de production biologique de sulfate a été observé à pH = 4; les taux mesurés étaient à
peu près 10 fois plus élevés que ceux qui avaient été observés dans le cadre d'essais non
biologiques. À pH 2 et 6, les taux non biologiques et les taux biologiques étaient à peu près
analogues. Les essais en colonne ont confirmé les effets de l'activité bactérienne sur le taux
d'oxydation : on a constaté un comportement analogue dans une colonne inoculée et dans une
colonne non inoculée. Le taux d'oxydation et d'apport dans le cas du sulfate, du fer et du nickel
étaient analogues dans les deux colonnes renfermant 6 % S2-. Les taux d'apport dans le cas du
sulfate et du fer n'étaient que légèrement inférieurs dans la colonne renfermant 2 % S2-, mais le
taux de libération du nickel était supérieur par rapport à la colonne renfermant 6 % S2-. Le taux
de consommation de l'oxygène suivait le taux d'apport des produits d'oxydation de la pyrrhotine.
En général, le taux de consommation de l'oxygène était initialement 3 à 10 fois plus élevé que le
taux de production de sulfate, équivalent au point de vue stoechiométrique, mais avec le temps,
le taux de consommation d'oxygène et le taux de libération de sulfate convergeaient. Le rapport
molaire moyen de Fe : SO 4 était d'environ 0,9 à 0,96, ce indique qu'en moyenne, l'oxydation de
la pyrrhotine produisait du Fe2+ et du SO42- de manière stoechiométrique.
La présence de calcite dans les résidus renfermant 6 % S2- donnait lieu à des taux de

vii
consommation d'oxygène et de libération de sulfate analogues à ceux qui étaient mesurés dans le
cas des résidus ne contenant pas de carbonates. Toutefois, la calcite assurait le maintien d'un pH
presque neutre dans l'eau interstitielle, ce qui donnait des taux de libération du Fe et du Ni
beaucoup plus faibles. La présence d'enstatite, un tampon de silicate, donnait à l'eau interstitielle
un pH de 4 à 5 et faisait précipiter un peu plus d'hydroxyde ferrique, ce qui faisait diminuer le
taux de libération du nickel par rapport au témoin. La différence entre les résidus tamponnés
avec du carbonate et du silicate était liée au pH de l'eau interstitielle, la colonne de carbonate
maintenant un pH à peu près neutre et provoquant la précipitation presque complète du fer.
Les résultats indiquent que des caractéristiques de la pyrrhotine comme la présence d'impuretés
métalliques et la forme cristallographique n'influent pas beaucoup sur le taux d'oxydation. La
surface des particules de pyrrhotine est de loin le paramètre le plus important permettant
d'évaluer le taux d'oxydation de la pyrrhotine dans les résidus. Les résultats des essais effectués
en colonne indiquent que le transport de l'oxygène est le phénomène le plus important et que de
petites incertitudes relatives à la cinétique de la réaction n'influent pas beaucoup sur la prévision
à long terme de l'oxydation des résidus lorsqu'on tient compte à la fois de la cinétique et du
transport de masse de l'oxygène dans la modélisation géochimique.

viii
TABLE OF CONTENTS
Pages
EXECUTIVE SUMMARY.......................................................................................................... II
SOMMAIRE................................................................................................................................. V
TABLE OF CONTENTS.........................................................................................................VIII
LIST OF TABLES ....................................................................................................................... X
LIST OF FIGURES ....................................................................................................................XI
INTRODUCTION......................................................................................................................... 1
1 LITERATURE REVIEW................................................................................................. 5
1.1 Physio-chemical Properties of Pyrrhotite ........................................................... 51.1.1. Chemical Compositions .............................................................................. 51.1.2. Mineralogical Compositions ....................................................................... 7
1.2 Dissolution Pathway of Sulphide Minerals......................................................... 91.2.1 Oxidant-free (Non-Oxidative) Dissolution ............................................... 111.2.2 Chemical (Abiotic) Oxidation................................................................... 121.2.3 Anoxic Oxidation by Ferric Iron............................................................... 151.2.4 Biological Oxidation ................................................................................. 16
1.3 Transport Processes and Geochemistry in Mine Tailings............................... 221.3.1 Gaseous Transport - Fick’s Law Diffusion............................................... 231.3.2 Neutralizing Reactions and Formation / Dissolution of SecondaryMinerals ................................................................................................................ 241.3.3 Weathering of Rock-Forming Minerals .................................................... 25
2 MATERIALS AND METHODS ................................................................................... 27
2.1 Material Characterization.................................................................................. 272.1.1 Particle Size Distribution .......................................................................... 282.1.2 Chemical Composition.............................................................................. 282.1.3 Mineralogical Composition....................................................................... 282.1.4 Microprobe Analysis................................................................................. 292.1.5 Specific Surface Area................................................................................ 30
2.2 Determination of Intrinsic Kinetics................................................................... 302.2.1 Reactor Configurations ............................................................................. 31

ix
2.3 Bacterial Inoculum.............................................................................................. 36
2.4 Coupling of Mass Transfer with Oxidation Kinetics....................................... 382.4.1 Column Configurations............................................................................. 38
2.5 Analytical Techniques......................................................................................... 442.5.1 Ferrous Iron (Fe2+) Analysis - Bathophenanthroline Method ................... 442.5.2 Total Iron Analysis.................................................................................... 442.5.3 Nickel (Ni2+) Analysis - Atomic Absorption ............................................ 452.5.4 Sulphate (SO4
2-) Analysis - Ion Chromatography..................................... 452.5.5 Surface Texture - Scanning Electron Microscopy (SEM) ........................ 46
3 RESULTS AND DISCUSSION ..................................................................................... 47
3.1 Physical and Chemical Characteristics of Pyrrhotite Samples ...................... 473.1.1 Specimen-Grade Pyrrhotite Samples ........................................................ 473.1.2 Inco Copper Cliff Pyrrhotite Tailings Concentrate................................... 60
3.2 Fundamental Kinetics......................................................................................... 623.2.1 Comparison of Kinetic Rates among Specimen Grade Samples .............. 623.2.2 Kinetics of Pyrrhotite Oxidation in Tailings Concentrate......................... 76
3.3 Column Studies on Pyrrhotite Tailings............................................................. 883.3.1 Effect of Sulphur Content ......................................................................... 943.3.2 Effect of Bacterial Inoculation .................................................................. 983.3.3 Effect of Neutralizing Minerals .............................................................. 1013.3.4 Effect of Fine Particles............................................................................ 104
4 CONCLUSIONS ........................................................................................................... 108
5 REFERENCES.............................................................................................................. 111
Appendix A – Material Characterization of Pyrrhotite Samples
Appendix B – Non-Oxidative Dissolution of Specimen Grade Pyrrhotite Samples
Appendix C – Ferric Iron Oxidation of Specimen Grade Pyrrhotite Samples
Appendix D – Kinetic Oxidation of Inco's Copper Cliff Pyrrhotite Concentrate
Appendix E – Column Studies of Inco's Copper Cliff Pyrrhotite Concentrate

x
LIST OF TABLES
Pages
Table 2.1: Common ionic molecular forms of aqueous sulphur species. ................................... 6
Table 2.2: Thermodynamic data for iron-sulphur minerals (Woods andGarrels, 1987). ......................................................................................................... 11
Table 2.3: Acidophilic bacteria in metal ore leaching environments(adopted from Olson and Kelly, 1986).................................................................... 17
Table 2.4: Solubility products of secondary minerals in mine tailings(Stumm, 1992; Brownlow, 1996)............................................................................ 25
Table 2.5: Silicate and phosphate minerals that provide bufferingcapacities at 25°C (Lowson and Brown, 1996). ...................................................... 26
Table 3.1: Descriptions, suppliers, and localities of the twelvepyrrhotite samples. .................................................................................................. 27
Table 3.2: Theoretical chemical compositions of sulphide mineral inSudbury, ON............................................................................................................ 29
Table 3.3: Chemical composition of aqueous growth media forThiobacillus ferrooxidans........................................................................................ 36
Table 3.4: Conditions used in packed columns. ....................................................................... 39Table 4.1: Specific surface area of two pyrrhotite samples after 15
months of oxidation................................................................................................. 50
Table 4.2: Trace metal contents of pyrrhotite samples............................................................. 55
Table 4.3: Accessory minerals present in the pyrrhotite samples. ........................................... 57
Table 4.4: Hexagonal, monoclinic and orthorhombic crystal forms inthe pyrrhotite samples.............................................................................................. 59
Table 4-5: Chemical composition of Inco Copper Cliff pyrrhotiteconcentrate............................................................................................................... 61
Table 4.6: Non-oxidative dissolution rates of the pyrrhotite samples. ..................................... 63
Table 4.7: Rates of oxidation of the pyrrhotite samples by oxygen. ........................................ 65
Table 4.8: Oxidation of the pyrrhotite samples by ferric iron. ................................................. 67
Table 4.9: The rate order dependence of pyrrhotite oxidation on Fe3+ atpH=2.0. .................................................................................................................... 70
Table 4.10: Activation energies for pyrrhotite oxidation by oxygen.......................................... 74
Table 4.11: Activation energies for pyrrhotite oxidation by ferric iron. .................................... 74
Table 4.12: Activation energies for abiotic pyrrhotite oxidation (based onsulphate release). ..................................................................................................... 84
Table 4.13: Conditions used in packed columns. ....................................................................... 88

xi
LIST OF FIGURES
Figure 1.1: General concepts adopted for modelling of mine wastes. ......................................... 3
Figure 2.1: Suggested scheme for sulphur oxidation in oxidativeenvironments (adopted from Kuenen, 1993)............................................................. 6
Figure 2.2: The NaCl-type and NiAs-type crystal structures: (a) NaClstructure showing the coordination of ions and the linking ofoctahedral units; (b) linkage of ions in a unit cell of NiAsstructure and stacking of octahedral units (adopted fromVaughan and Craig, 1978)......................................................................................... 8
Figure 2.3: Projection of Fe and S atoms on the basal plane (c-axis) inthe troilite super-structure (adopted from Vaughan andCraig, 1978). .............................................................................................................. 8
Figure 2.4: Direct biological leaching without diffusion limitation(adopted from Boon and Heijnen, 1993). ................................................................ 17
Figure 2.5: Indirect biological leaching by ferric iron without diffusionlimitation (adopted from Boon and Heijnen, 1993). ............................................... 18
Figure 2.6: Indirect biological leaching by ferric iron and biologicaloxidation of sulphide without diffusion limitation (adoptedfrom Boon and Heijnen, 1993). ............................................................................... 18
Figure 2.7: Indirect biological leaching with diffusion limitation(adopted from Boon and Heijnen, 1993). ................................................................ 19
Figure 3.1: Internal spilt-flow airlift reactor .............................................................................. 32
Figure 3.2: Stirred tank reactor .................................................................................................. 34
Figure 3.3: Flow chart for the program IRON SOLVER .......................................................... 35
Figure 3.4: Column layout ......................................................................................................... 37
Figure 3.5: Headspace oxygen consumption cap with galvanic oxygensensor....................................................................................................................... 41
Figure 3.6 Lysimeter for porewater extraction ......................................................................... 42
Figure 3.7 Oxygen profile sampling port with galvanic oxygen sensor ................................... 43
Figure 4.1: Adsorption isotherm for N2 gas, at 77.4°K, on pyrrhotite....................................... 48
Figure 4.2: Specific surface area comparisons among the twelvepyrrhotite samples, a pyrite sample from Colorado, and thetheoretical geometrical specific surface area based onparticle size plotted on a log - log axis. ................................................................... 48
Figure 4.3: The effects of grinding techniques on pyrrhotite specificsurface area. ............................................................................................................. 49
Figure 4.9: XRD standardization - Correlation between peak area andhexagonal composition............................................................................................ 53
Figure 4.10: Impurity concentrations of the pyrrhotite samples. ................................................. 54
Figure 4.11: A comparison between measured microprobe atomic Fe %

xii
and predicted atomic Fe %. ..................................................................................... 56
Figure 4.12: XRD intensity spectra for: (a) pure hexagonal pyrrhotite, (b)pure monoclinic pyrrhotite, (c) mixed hexagonal andmonoclinic pyrrhotite, and (d) mixed hexagonal, monoclinicand troilite containing pyrrhotite ............................................................................. 58
Figure 4.13: Particle size distributions of pyrrhotite concentrate andquartz sand............................................................................................................... 61
Figure 4.14: Non-oxidative dissolution at pH=2.75, 25°C for Po-M-7-94measured in closed stirred tank reactors.................................................................. 63
Figure 4.15: Oxidation of pyrrhotite by oxygen at pH=2.75, 25°C for Po-M-15-93 measured in internal split-flow airlift reactors. ........................................ 65
Figure 4.16: Oxidation by Fe+3 of Po-C-5-94 at pH=2.50, 25°C,Fe+3int=1×10⁻³ [M] measured in closed stirred tank
reactors. ................................................................................................................... 68
Figure 4.17: Oxidation by Fe+3 of Po-C-5-94 at pH=2.00, 25°C,Fe+3int=1×10⁻² [M] measured in closed stirred tank
reactors. ................................................................................................................... 68
Figure 4.18: The dependence of pyrrhotite oxidation on Fe+3
(Fe+3int=2×10⁻⁴ [M], 25°C, pH=2.75, Po-C-5-94)................................................ 69
Figure 4.19: The dependence of pyrrhotite oxidation on Fe3+
(Fe3+int=1×10⁻² [M], 25°C, pH=1.99, Po-C-5-94)................................................ 70
Figure 4.20: The linearized adsorption model (Po-M-2-94)........................................................ 71Figure 4.21: The use of ferrous iron production to predict pyrrhotite
oxidation completeness. .......................................................................................... 73
Figure 4.22: The influence of crystal structure on pyrrhotite oxidation rateby oxygen (pH=2.75, 25°C). ................................................................................... 76
Figure 4.23: The influence of total trace metal content on pyrrhotiteoxidation by oxygen (pH=2.75, 25°C). ................................................................... 76
Figure 4.24: Sulphate release under abiotic pyrrhotite oxidation at 30 °Cand various pH values. ............................................................................................ 77
Figure 4.25: Iron release under abiotic pyrrhotite oxidation at 30 °C andvarious pH values. ................................................................................................... 78
Figure 4.26: The sulphate production rate for abiotic pyrrhotite oxidationby oxygen. ............................................................................................................... 79
Figure 4.27: The iron production rate for abiotic pyrrhotite oxidation byoxygen. .................................................................................................................... 80
Figure 4.28: The nickel production rate for abiotic pyrrhotite oxidation byoxygen. .................................................................................................................... 81
Figure 4.29: Effect of pH on abiotic pyrrhotite oxidation rates (based onsulphate release) at various temperatures. ............................................................... 83
xiii
Figure 4.30: Effect of pH on abiotic pyrrhotite oxidation rates (based oniron release) at various temperatures. ...................................................................... 83
Figure 4.31: Arrhenius plots of abiotic pyrrhotite oxidation rates (basedon sulphate) with temperature at various pH values. .............................................. 84
Figure 4.32: Effect of chelating agent (EDTA) on abiotic pyrrhotiteoxidation rate (based on iron release)...................................................................... 86
Figure 4.33: Effect of chelating agent (EDTA) on abiotic pyrrhotiteoxidation rate (based on nickel release). ................................................................. 86
Figure 4.34: Effect of bacterial inoculation on pyrrhotite oxidation rate(based on sulphate release). ..................................................................................... 87
Figure 4.35: Effect of bacterial inoculation on pyrrhotite oxidation rate(based on iron release)............................................................................................. 87
Figure 4.36: The sulphate, iron and nickel production loading in base casecolumn. .................................................................................................................... 89
Figure 4.37: Iron to sulphate production ratio in the column. ..................................................... 90
Figure 4.38: Nickel to sulphate production ratio in the column. ................................................. 90
Figure 4.39: The oxygen consumption rate in column. ............................................................... 92
Figure 4.40: Concentration profile in the base case column after 126 days:(a) pH profile, (b) iron concentration profile, (c) nickelconcentration profile, (d) sulphate concentration profile, and(d) normalized oxygen gas concentration profile. ................................................... 93
Figure 4.41: Comparison of sulphate loading between the base case andthe 2 % S2- columns................................................................................................. 94
Figure 4.42: Comparison of iron loading between the base case and the 2% S2- columns.......................................................................................................... 95
Figure 4.43: Oxygen concentration profile in the 2 % S2- column after 138days.......................................................................................................................... 96
Figure 4.44: Comparison of oxygen consumption rate between the basecase and 2 % S2- columns. ....................................................................................... 97
Figure 4.45: Comparison of nickel loading between the base case and the2 % S2- columns....................................................................................................... 98
Figure 4.46: Comparison of sulphate loading between the base case andthe inoculated columns. ........................................................................................... 99
Figure 4.47: Comparison of oxygen consumption rate between the basecase and the inoculated columns. .......................................................................... 100
Figure 4.48: Comparison of nickel loading between the base case and theinoculated columns................................................................................................ 100
Figure 4.49: Comparison of sulphate loading between the base case andthe mineral buffered columns................................................................................ 102
Figure 4.50: Comparison of oxygen consumption rate between in the basecase and the mineral buffered columns. ................................................................ 102
Figure 4.51: Comparison of iron loading between the base case and the

xiv
mineral buffered columns...................................................................................... 103
Figure 4.52: Comparison of nickel loading between the base case and themineral buffered columns...................................................................................... 103
Figure 4.53: Concentration profile in the 1 % calcite column after 101days: (a) iron concentration profile, and (b) nickelconcentration profile.............................................................................................. 104
Figure 4.54: Comparison of sulphate loading between the base case andthe column with fines. ........................................................................................... 105
Figure 4.55: Comparison of iron loading between the base case and thecolumn with fines. ................................................................................................. 106
Figure 4.56: Comparison of nickel loading between the base case and thecolumn with fines. ................................................................................................. 106
Figure 4.57: Comparison of oxygen consumption rate between the basecase and the column with fines.............................................................................. 107

1
INTRODUCTION
Base metal tailings often contain significant quantities of sulphide minerals, often as mixtures of
pyrite (FeS2) and pyrrhotite (Fe1-xS). Exposure of pyrrhotite at the ground surface to
atmospheric oxygen and water results in oxidation and the release of oxidation products, namely
sulphate (SO42-) and dissolved iron species (Fe2+ and Fe3+). The acidic drainage generated from
waste sulphide oxidation is recognized as the cause of severe environmental degradation in the
mining regions. Consequently, the prediction and control of acid mine drainage (AMD) from
mine tailings are recognized as major environmental issues (Filion and Ferguson, 1990).
Assessment of the acid generating potential of mine wastes and long-term treatment options are
required by the mine operators under environmental regulations. A common method of
assessment is an accelerated short-term laboratory leaching tests under highly oxidative
conditions, which often do not represent the natural conditions (SENES Consultants Ltd., 1994).
In order to develop an effective process or preventive management strategy, there is a need to
assess or predict water quality on a regional scale. There is no singular standard method for
assessing long-term impacts of acidic drainage from mine wastes on surrounding environments.
In addition to each tests, mathematical models, such as RATAP (Reactive Acidic Tailings
Assessment Program) and WATAIL (Waterloo Tailings Program) provide alternative methods
for long-term prediction.
The computer model RATAP was the result of CANMET’s initiative to conduct studies on the
factors and processes which controls acid generation in mine tailings. The program simulates
one-dimensional transport of oxygen and porewater through tailings. The tailings solids profile
is divided into twenty layers comprising the unsaturated zone, the capillary fringe and the water
table. The major processes in the model are abiotic and biotic oxidation of sulphide minerals and
the diffusive flux of oxygen through the unsaturated zone. RATAP is designed to run in a
probabilistic manner and utilizes a Monte Carlo type subroutine for the allocation of distributed
parameter values. The program has been employed successfully to simulate field data at several
tailings sites.
The WATAIL model was developed to predict water quality associated with different tailings
management options (Scharer et al., 1993). The program provides comparisons in contaminant
loading rates from tailings discharge. The model focuses on the effects of treatment or
management strategies based on reasonable engineering intervention, such as soil covers or
various degrees of flooding. The model consists of three fundamental components: oxidation
rates controlled by the estimated diffusive resistance to oxygen transport, pertinent chemical

2
reactions between oxidation products, and water balance and flow between waste sites. The
model allows tailings to be divided into zones of different characteristics (physical and
chemical). Each zone is divided into several horizontal segments known as control volumes
(layers) and the parameters (diffusion coefficient, reaction rate, etc.) are evaluated in each
control volume for each time interval (Figure 1.1).
The current kinetic model is based on the concept that sulphide oxidation is a surface
phenomenon that is controlled by the rate of oxygen transport from the atmosphere to the
reactive surface of the sulphide wastes. The surficial sulphide reaction is subdivided into
chemical (dissolved oxygen) and biological oxidation. The two reaction mechanisms are
assumed to be additive to provide an overall reaction rate. In the absence of oxygen, sulphide
dissolution is assumed to be zero. However, this approach did not account for the oxidation of
sulphide mineral by ferric iron and other chemical oxidants in the absence of dissolved oxygen.
In order for a model to provide accurate assessment of drainage qualities, fundamental
information on the kinetics and mechanisms that affect the oxidation of sulphide minerals under
various conditions are required. For many sulphide minerals, this fundamental information is
lacking. Pyrite oxidation is relatively well understood in comparison to the oxidation of
pyrrhotite. It should be noted that pyrite is the dominant sulphide waste mineral in North
American coal mining and AMD from coal wastes has been a major concern of the US
regulatory authorities. A number of investigations and several major reviews on the oxidation of
pyrite have appeared in the literature (e.g. Lowson, 1982; de Hann, 1991; Nicholson, 1994). In
contrast, pyrrhotite is the primary sulphide waste at many base metal mines across northern
Canada and the oxidation of pyrrhotite has been generally ignored. The few previous
investigations to date, however, indicate that reaction rates of pyrrhotite may be significantly
higher than reaction rates of pyrite.

3
Figure 1.1: General concepts adopted for modelling of mine wastes.
Pyrrhotite chemistry is complicated by the iron deficiency in the crystal structure. The general
formula is Fe1-xS, where x can vary from 0.0 (FeS) to 0.125 (Fe7S8) (Deer et al., 1992).
Furthermore, pyrrhotite exists in three crystal forms, hexagonal and monoclinic being the most
common (Yund and Hall, 1969). The iron deficient form of pyrrhotite (Fe7S8) is monoclinic

4
while the equimolar variety (FeS) is hexagonal. The non-stoichiometric formula of pyrrhotite is
caused by the vacancy of iron in the crystal structure. This vacant metal sites resulting in lower
crystal symmetry and giving rise to potentially higher reactivity. Small amounts of Co, Cu, Mn,
Pb, Ni and Zn can substitute for Fe in pyrrhotite but most are present as impurities, such as Cu in
chalcopyrite (CuFeS2), Pb in galena (PbS), Ni in pentlandite (Fe,Ni)9S8 and Zn in sphalerite
(ZnS).
The objective of this study was to investigate the mechanism and controlling factors affecting the
oxidation of pyrrhotite. The laboratory studies were designed to acquire fundamental data, on
intrinsic kinetics and transport processes related to pyrrhotite oxidation, for predictive purposes
and refinements of model concepts to accommodate pyrrhotite oxidation in tailings under various
reaction conditions.

5
LITERATURE REVIEW
PHYSIO-CHEMICAL PROPERTIES OF PYRRHOTITE
The iron-sulphur mineral system is the most important binary sulphide system because it
contains the only sulphides common enough to be considered rock-forming minerals (pyrite and
pyrrhotite). Phase equilibria for Fe-S system are well established above 300 °C but remain
unresolved at lower temperatures, especially in the pyrrhotite composition region.
Previous studies were generally performed using pyrite (FeS2) as the reactive mineral. This is
particularly evident with regard to reaction mechanisms and kinetic expressions for both abiotic
and biotic oxidation. There are some indications, however, that the oxidative mechanism of
sulphide moiety of the two minerals as similar. In fact, the initial high release of iron during
pyrrhotite oxidation may result in a sulphide-rich layer surrounding the pyrrhotite particle. This
layer resembles pyrite. For these reasons, relevant studies pertaining to pyrite oxidation are
included in the review when no comparable information on pyrrhotite was available.
Besides the kinetic aspects, the gaseous transport in tailings is reviewed briefly. The most
important transport mechanism in tailings is diffusive molecular transport of oxygen and other
transport mechanisms such as convective transport caused by thermal gradients, barometric
pumping or wind are acknowledged but their importance in tailings environment is generally
accepted to be secondary.
1.1.1. Chemical Compositions
A ‘sliding scale’ X-ray spacing curve was developed by Toulmin and Barton (1964) for
determination of pyrrhotite composition. Yund and Hall (1969) have compiled and evaluated the
X-ray data of previous workers and calculated the following expression to relates the d102 of
hexagonal pyrrhotites and their compositions in terms of atomic percent iron.
( ) ( )Atomic iron d d% . . . . .= + − + −45 212 72 86 2 040 3115 2 040102 1022
(2.1)
Pyrrhotite (Fe1-xS) had been generally considered having composition range from FeS to Fe7S8 (x
range from 0 to 0.125), which translates to an atomic percent of iron range from 50 % to 43.75
%.

6
The multiple valency states of sulphur result in several reaction pathways for the sulphur species.
The more common ionic molecular forms of aqueous sulphur species are given in Table 2.1. A
simplified reaction pathway proposed by Kuenen (1993) illustrated the aqueous sulphur species
and their respective reactions under oxidative environments (Figure 2.1).
Table 2.1: Common ionic molecular forms of aqueous sulphur species.
Valence ofsulphur
Molecules Ions
+6 H2SO4 (sulphuric acid) HSO4- (bisulphate) SO4
2- (sulphate)
+4 H2SO3 (sulphurous acid) HSO3- (bisulphite) SO3
2- (sulphite)
+2 HS2O3- (bithiosulphate) S2O3
2- (thiosulphate)
0
-2/x H2Sx (hydrogenpolysulphide)
HSx- (bipolysulphide) Sx
2- (polysulphide)
-2 H2S (hydrogen sulphide) HS2- (bisulphide) S2- (sulphide)
S O H O S O SO H3 62
2 2 32
42 2− − − ++ → + + (2.2)
S O S O S O e2 32
2 32
4 62 2− − − −+ → + (2.3)
S O H O S O S SO H4 62
2 2 32 0
42− − − ++ → + + + (2.4)
S S e2 0 2− −→ + (2.5)
S H O SO H e02 3
23 6 4+ → + +− + − (2.6)
SO H O SO H e32
2 42 2 2− − + −+ → + + (2.7)
Figure 2.1: Suggested scheme for sulphur oxidation in oxidative environments (adoptedfrom Kuenen, 1993).
Despite the wide variety of possible sulphur species, only HSO4-, SO4
2-, H2S (aq), HS- and S2- are
7
of significance in aqueous solutions under reasonable near surface conditions of pH and oxygen
activity.
The vacancy of iron in pyrrhotite is often substituted with other trace metal ions, such as Co, Cu,
Mn, Pb, Ni and Zn. The trace metals can also be present as minerals, such as pentlandite,
chalcopyrite, galena and sphalerite etc., which inter-grow with the pyrrhotite crystal structure.
Semi-quantitative analysis of the oxidation of monoclinic pyrrhotite was performed by Kwong
(1993). Pyrrhotite with high trace metal content appeared to oxidize slower under abiotic
conditions than pyrrhotite samples with a lower trace metal content.
1.1.2. Mineralogical Compositions
Pyrrhotite is classified as having a distorted NiAs structure. The hexagonal NiAs structure is one
of the most important in transitional metal chemistry (Vaughan and Craig, 1978). It occupies a
unique position in crystal chemistry, being related to the predominantly ‘ionic’ NaCl structure,
while also related to the intermetallic compounds having the CsCl structure (Figure 2.2).
Stoichiometric FeS has the true NiAs structure at a temperature above 140 °C. Below this
temperature, a distorted form exists so that the unit cell is related to the simple NiAs structure by
‘a’ ≈ A√ = B and ‘c’ ≈ 2C, where A and C represent the a and c parameters of the simple NiAs-
type cell and the superstructure is defined as B, 2C according to the nomenclature of Wuensch
(1963). The low temperature form exists naturally as the mineral troilite. The directions of the
displacements of the iron atoms are indicated on a c-axis projection (Figure 2.3). The iron atoms
are displaced only in the x and y directions while sulphur atoms are displaced along the c-axis.
The result is that the iron atoms form triangles, some of which are contracted and some dilated.
Sulphur atoms above or below the centres of these triangles are displaced away from contracted
triangles and towards the dilated triangles.

8
(a)
(b)
Figure 2.2: The NaCl-type and NiAs-type crystal structures: (a) NaCl structure showingthe coordination of ions and the linking of octahedral units; (b) linkage ofions in a unit cell of NiAs structure and stacking of octahedral units (adoptedfrom Vaughan and Craig, 1978).
Figure 2.3: Projection of Fe and S atoms on the basal plane (c-axis) in the troilite super-structure (adopted from Vaughan and Craig, 1978).
Non-stiochiometry of the type Fe1-xS has been attributed to vacancies on the Fe sites rather than
excess of S atoms (Deer et al., 1992). The pyrrhotite with composition of Fe7S8 has a monoclinic
structure related to the NiAs-type structure. A large number of structures and superstructures for
natural and synthetic pyrrhotites in addition to the troilite and monoclinic pyrrhotites have been

9
found (Arnold, 1967).
The most abundant natural pyrrhotites are the monoclinic (4C) and troilite (2C) types and the
intermediate pyrrhotites, which can be generally categorized as nC (Morimoto et al., 1975). The
5C and 6C types are special cases of the nC type which tend to be more widespread. Commonly,
the nC type pyrrhotite is found intergrown with either the 2C or 4C type, and intergrown
involving more than one type of nC pyrrhotite are rare.
DISSOLUTION PATHWAY OF SULPHIDE MINERALS
Although the details of the reaction and mechanism of pyrrhotite oxidation are unclear at the
present, it is generally believed that the following reactions represent the overall oxidation of
pyrrhotite (Fe1-xS).
( )Fe Sx
O x H O x Fe SO x Hx1 2 22
422
21 2−
+ − ++ −
+ → − + + (2.8)
Equation (2.8) shows the oxidation of pyrrhotite using oxygen as the primary electron acceptor
under aerobic conditions. At low pH (below 4.5), pyrrhotite oxidation may be catalyzed by
bacteria, particularly Thiobacillus ferrooxidans (Ingledew, 1986; Tuovinen, 1986). Bacteria
derive metabolic energy for carbon dioxide fixation and growth from oxidation of ferrous iron to
ferric iron (Equation 2.9) and sulphide to sulphate (Equation 2.10).
Fe O H Fe H O22
32
1
4
1
2+ + ++ + → + (2.9)
S O SO22 4
22− −+ → (2.10)
Although the oxidation of Fe2+ to Fe3+ can occur in an abiotic environment, the reaction is
greatly accelerated by the presence of chemolithotropic bacteria, particularly acidophiles. The
resulting ferric iron can act as oxidant to oxidize pyrrhotite (Equation 2.11). Therefore, the
enzymatic oxidation of ferrous iron is referred to as the indirect biological oxidation mechanism.
( ) ( )Fe S x Fe H O x Fe SO Hx13
22
428 2 4 9 3 8−
+ + − ++ − + → − + + (2.11)

10
Alternatively, oxidation may not proceed to completion. Field observations indicate that
elemental sulphur can exist in quantities up to 2.5 % in well oxidized tailings as a result of partial
oxidation of pyrrhotite (Steger and Desjardins, 1978; Jambor, 1994). The partial oxidation of
pyrrhotite by dissolved oxygen and ferric iron is illustrated in Equation (2.12) and (2.13):
( ) ( ) ( )Fe Sx
O x H x Fe S x H Ox1 22 0
21
22 1 1 1−
+ ++−
+ − → − + + − (2.12)
( ) ( )Fe S x Fe x Fe Sx13 2 02 2 3 3−+ ++ − → − + (2.13)
Elemental sulphur formed from the partial oxidation of pyrrhotite can further undergo oxidation
to sulphate. The relative rate of oxidation of elemental sulphur compared to partial oxidation of
pyrrhotite has not been established presently. The oxidation of elemental sulphur by dissolved
oxygen is relatively slow under abiotic condition, while the reaction is greatly accelerated by the
presence of T. ferrooxidans and T. thiooxidans (Equation 2.14). The chemical oxidation of
elemental sulphur to sulphate by ferric iron can also occur (Equation 2.15).
S O H O SO H02 2 4
23
22+ + → +− + (2.14)
S Fe H O SO Fe H0 32 4
2 26 4 6 8+ + → + ++ − + + (2.15)
Sulphur enrichment on the surface of pyrrhotite can occur through oxidative conversion of
pyrrhotite to pyrite or marcasite (FeS2). There is field evidence that pyrite is an intermediate
product of pyrrhotite oxidation in the mineral zoning of oxidized ore deposits (Nickel et al, 1974;
Thornber, 1975a,b; Thornber et al, 1981). The conversion reaction is shown in Equation (2.16).
( )
( )
21
22 4
1 2 1 2
1 2
22
2
Fe S x O x H
FeS x Fe x H O
x−+
+
+ −
+ − →
+ − + −( )
(2.16)
Thermodynamic data also indicate the feasibility of such oxidative conversion. It is evident that
pyrite and marcasite are both more stable than pyrrhotite. However, under an oxidative
environment, pyrite and marcasite are only metastable and will be eventually oxidized further.

11
Table 2.2 is a summary of the thermodynamic data for iron-sulphur solid species that are
common in mine tailings.
Table 2.2: Thermodynamic data for iron-sulphur minerals (Woods and Garrels, 1987).
Formula Minerals ∆Hf
(kJ⋅mol-1)
∆Gf
(kJ⋅mol-1)
S°(J⋅mol-1⋅K-1)
FeS α Troilite -98.7 -99.8 62.7
Pyrrhotite -100.4 -100.8 60.3
(Iron-rich) -100.0 -100.4 60.3
(Sulfur-rich) -92.0 -93.6 60.7
Mackinawite -93.3
FeS2 Pyrite -174.3 -163.1 52.9
Marcasite -160.0 -158.4 53.9
Fe2(SO4)3 -2580.1 -2248.4 270.9
FeSO4⋅H2O Szomolnokite -1243.9
FeSO4⋅7H2O Melanterite -3014.5 -2509.9 409.2
The presence of elemental sulphur and disulphide (pyrite and marcasite) as intermediate products
of pyrrhotite oxidation may have important implications in the determination of the oxidation
rates.
Oxidant-free (Non-Oxidative) Dissolution
Electrochemical conversion of pyrrhotite to pyrite or marcasite in natural environments was
observed previously (Thornber, 1975a; Jambor, 1994). The anodic conversion of pyrrhotite to
pyrite was accompanied by anodic conversion of pentlandite ((Ni,Fe)9S8) to violarite ((Ni,Fe)3S4)
in the absence of oxygen. The reaction of pyrrhotite and pentlandite are as follows:
( )Fe S FeS x Fe x ex1 221
2
1
21 2−
+ −→ + −
+ − (4.17)
( , ) ( , ) ( , )Ni Fe S Ni Fe S Ni Fe e9 8 3 422 3 6→ + ++ − (4.18)

12
In the absence of oxygen, sulphide sulphur acts as the electron acceptor, and the evolution of
hydrogen sulphide enhances pyrrhotite dissolution according to the following reaction:
( )Fe S H x e x Fe H Sx g12
22 2 1−+ − ++ + → − + ( ) (4.19)
The rate controlling step for the reaction is either the stripping of H2S from this reaction system
or the availability of H+ ions. The presence of trace metal sulphides provides extra electrons for
Equation (4.19). Van Weert et al. (1974) observed that H2S gas evolution occurs when the Eh
potential dropped below 0 V.
There were inconsistencies concerning the controlling mechanism of non-oxidative dissolution.
Nichol and Scott (1979) suggested that pyrrhotite dissolution was governed by the mass transfer
of ferrous iron and sulphide ions from the mineral surface. Tewari and Campbell (1976) and
Bugajski and Gamsjäger (1982) performed rotating disk electrode experiments in sulphuric acid
environments, using troilite and monoclinic pyrrhotite, respectively. The measured activation
energies for oxidant-free dissolution were 60 and 58.6 kJ⋅mol-1 respectively, which indicated a
kinetic control mechanism. A transport limited process would have activation energies in the
range of 10 - 20 kJ⋅mol-1.
Despite field observation of pentlandite conversion to violarite (Thornber, 1975a,b), laboratory
experiments by Janzen (1996) did not show any correlation between pyrrhotite dissolution with
trace nickel content. The non-oxidative dissolution rates ranged from 9.32×10⁻¹¹ to 9.21×10⁻¹⁰
mol⋅m-2⋅s-1 at pH 2.75 in a closed reactor which were almost an order of magnitude lower than
the rate measured by Kwong (1995) (5×10⁻⁹ mol⋅m-2⋅s-1) at pH 2.0 in an open airlift reactor. The
discrepancies were explained by Janzen as the result of stripping of hydrogen sulphide gas (from
Equation 4-19) from solution by the nitrogen carrier gas. The closed system used by Janzen
prevented the escape of hydrogen sulphide.
Chemical (Abiotic) Oxidation
There are relatively few studies and scarce literature on the oxidation of pyrrhotite by dissolved
oxygen. In contrast, the reaction kinetics of pyrite oxidation by dissolved oxygen has been
studied extensively in the past. Lowson (1982) reviewed the combined effect of aqueous

13
oxidation of pyrite and ferrous iron by molecular oxygen, and oxidation of pyrite by ferric iron.
Lowson proposed the following rate equation for the overall pyrite oxidation:
[ ]r A e OcE RT x pHa= ⋅ ⋅− −
2 10 (2.20)
The oxidation reaction is a heterogeneous surface reaction between aqueous dissolved oxygen
and the surface mineral. Despite Lowson’s (1982) suggestion of a first order dependence of the
kinetic rate on the oxygen concentration, the specific reaction rate of pyrite oxidation was
generally found to be half order with respect to dissolved oxygen when mass transport was not
limiting (McKibben and Barnes, 1986; Williamson and Rimstidt, 1994). The rate limiting
reaction of abiotic pyrite oxidation is not strongly pH dependent. The pH dependence ranges
from zero order (McKibben and Barnes, 1986; Moses and Herman, 1991) to fractional order
(Williamson and Rimstidt, 1994). The generally accepted reaction rate equations are as follows:
Williamson and Rimstidt:[ ]
[ ]r
O
H= − ±
±
+ ±10 8 19 0 10 20 5 0 04
0 11 0 01. ( . )
. ( . )
. ( . )(2.21)
McKibben and Barnes: [ ]r O= −10 9 742
0 5. .(2.22)
At high dissolved oxygen levels, the reaction of pyrite is believed to be controlled by the
adsorption of reactant (dissolved oxygen) and products (ferrous iron and sulphate) (Moses and
Herman, 1991; Nicholson et al., 1988). Assuming monolayer (Langmuir) adsorption behaviour,
the pyrite surface becomes saturated with oxygen as the oxygen partial pressure increases. The
reaction rate then becomes zeroth order with respect to dissolved oxygen.
Moses et al. (1987) proposed that sulphate production during pyrite oxidation is controlled by the
oxidation of sulfoxy intermediates. The production and accumulation of sulfoxy intermediates
depends on the pH and the presence of other intermediates. The most important reaction
involves the formation of sulphite from a mixture of sulfoxy intermediates:
S O S O S O SOn n62
2 32
1 62
32− −
+− −+ ↔ + (2.23)
Sulphur enrichment on the pyrrhotite surface was found after surface oxidation by either acid
leaching and / or molecular oxygen (Hamilton and Woods, 1981; Jones et al., 1992; Pratt et al.,

14
1994). Linear potential sweep voltammetry performed by Hamilton and Woods (1981)
identified elemental sulphur as the major sulphur product for pyrrhotite oxidation at all potentials
investigated. The quantity of sulphur formed on pyrite is much less than on pyrrhotite.
Surface characterization studies by Jones et al. (1992) and Pratt et al. (1994) suggested that a
layer of Fe(III)-oxyhydroxide layer overlies an iron-deficient sulphide structure. The oxide /
hydroxide overlayer is approximately 1 to 3 nm in thickness. A sulphur-enriched layer existed
below the oxide / hydroxide overlay. Pratt et al. (1994) suggests that the sulphur enrichment
resulted from iron diffusion to the surface oxide layer. The enriched layer is comprised of
various iron-deficient sulphides ranging from FeS2 to Fe2S3. The combination of oxide /
hydroxide and sulphur rich layers can create a mass transport barrier.
The oxidation of pyrrhotite by molecular oxygen was studied by Kwong (1995) in airlift reactors
using air as carrier gas. The measured oxidation kinetic rates were 2.28×10⁻⁹ mol⋅m-2⋅s-1 based
on iron release and 8.51×10⁻¹⁰ mol⋅m-2⋅s-1 based on sulphate production. The production of
sulphate was found to lag behind iron release (SO42- / Fe2+ = 0.37), which was consistent with a
build-up of sulphur rich component on the surface of pyrrhotite (Jones et al., 1992).
The oxidation rate was found to be dependent on the temperature by the Arrhenius relationship.
The activation energies for pyrrhotite oxidation by molecular oxygen ranged from 58.1 to 100.4
kJ⋅mol-1 depending on pH conditions (Kwong, 1995). The activation energies suggested a
kinetic controlled mechanism.
The kinetics of the oxidation of ferrous iron by dissolved oxygen is a function of the medium,
pH, temperature, ferrous concentration, dissolved oxygen concentration and the presence of
catalytic materials (Lowson, 1982). In an acidic environment under ambient conditions, the rate
equation is given by:
[ ] [ ]− =+
+ −dFe
dtk Fe OH P
x y
O
22
2(2.24)
At pH below 2, the rate of reaction is very slow, independent of pH (y = 0), first order with
respect to the partial pressure of oxygen and second order with respect to ferrous ion
concentration (x = 2). The corresponding reaction rate constant (k) is reported to be
approximately 2.5×10⁻⁶ mol⋅L-1⋅atm-1⋅s-1 (Lowson, 1982). At pH values between 2 and 5, the
oxidation of ferrous iron is first order with respect to ferrous iron (x = 1) and hydroxyl ion (y =

15
1). The corresponding rate constant is 1.7×10⁻⁹ atm-1⋅s-1.
The electrochemical reaction of ferrous iron oxidation by air or molecular oxygen in acidic
solution can be accelerated by the presence of other trace metal ions (Cu2+, Ni2+, etc.). At low
copper concentration (10-5 - 10-3 mol⋅L-1), the oxidation of ferrous iron is enhanced by the an
additional term:
[ ] [ ][ ]− = ++
+ + +dFe
dtk Fe P k Fe CuO
22
12 2
2(2.25)
The enhancement is first order with respect to ferrous and cupric ions. The reaction rate constant
(k1) for the enhancement term is found to be 7.6×10⁻³ mol⋅L-1⋅s-1.
Anoxic Oxidation by Ferric Iron
The oxidation of pyrite by ferric ion is found to be more complicated than oxidation by
molecular oxygen. In an abiotic environment, ferric iron is consumed in the oxidation of pyrite
while it is being formed during the oxidation of ferrous iron (Equation 2.11 and Equation 2.9 for
pyrrhotite oxidation system).
When oxygen was present, the oxidation of pyrite by ferric iron was found to be independent of
the pH (Williamson and Rimstidt, 1994). The reaction (Equation 2.26) was found to be
approximately first order with respect to ferric ion concentration and inverse half order with
respect to the ferrous iron.
[ ][ ]
rFe
Fe= − ±
+ ±
+ ±10 6 07 0 57
3 0 93 0 07
2 0 40 0 06. ( . )
. ( . )
. ( . )(2.26)
However, under anoxic conditions, pyrite oxidation by ferric iron was found to be pH sensitive.
There is an inconsistency in the literature concerning the dependence of the reaction on the
ferrous ion concentration. McKibben and Barnes (1986) found that the oxidation of pyrite by
ferric iron under anoxic condition was independent of ferrous iron, while Williamson and
Rimstidt (1994) reported a half order dependence.

16
McKibben and Barnes[ ][ ]
rFe
H= −
+
+10 9 74
3 0 5
0 5.
.
.(2.27)
Williamson and Rimstidt[ ]
[ ] [ ]r
Fe
Fe H= − ±
+ ±
+ ± + ±10 6 07 0 57
3 0 30 0 02
2 0 47 0 03 0 32 0 04. ( . )
. ( . )
. ( . ) . ( . )(2.28)
In both cases, the reaction dependence on ferric iron was reduced to half order or less.
Williamson and Rimstidt (1994) also showed the pyrite oxidation by ferric iron is enhanced at
high ferric to ferrous ratio under oxic condition, whereas the reverse holds under anoxic
condition. This illustrates a change in reaction mechanisms between oxic and anoxic conditions
for pyrite oxidation.
Investigations by Kwong (1995) using an airlift reactor at initial ferric iron concentration of
1×10⁻³ M yielded a similar reaction rate (1.14×10⁻⁸ mol⋅m-2⋅s-1). There was no significant
amount of hydrogen sulphide gas evolution detected in the open airlift system. In both studies,
the sulphate production significantly lagged behind the iron release. Sulphate release was
estimated to be 14 % of the iron release during anoxic ferric iron oxidation of pyrrhotite (Kwong,
1995). The sulphate to iron ratio with ferric iron oxidation was found to be less than the
oxidation by molecular oxygen. The oxidation rates of pyrrhotite by ferric iron were consistently
higher than the oxidation by molecular oxygen.
Biological Oxidation
The biological oxidation of sulphide minerals has received substantial research attention in the
past 20 years. However, much of the focus on the sulphide oxidation involved the microbial
recovery of metal values (Campbell et al., 1985; Olson and Kelly, 1986; Debus, 1990). The
bacterial oxidation of sulphide minerals, predominantly pyrite and pyrrhotite, regarding
environmental concerns emerged as an important key area of research in recent years (Singh and
Bhatngar, 1985; Evangelou and Zhang, 1995).
Among many acidophiles and neutrophiles identified from acid mine drainage or mine waste
site, the chemolithotrophic bacteria of the genus Thiobacillus were the more important
microorganism in the oxidation of sulphide minerals (Leduc and Ferroni, 1994; Johnson, 1991).
Recently, there was evidence that Leptospirillum ferrooxidans played an important role in

17
ferrous iron oxidation in acidic environments (Sand et al., 1992; McGinness and Johnson, 1993).
Some of the common bacteria in AMD and the respective growth conditions are given Table 2.3.
Table 2.3: Acidophilic bacteria in metal ore leaching environments (adopted from Olson andKelly, 1986).
Organism Energy Sources GrowthTemperature
PrimaryCarbon Sources
Thiobacillus ferrooxidans Fe2+, S0 mesophile CO2
Leptospirillum ferrooxidans Fe2+ mesophile CO2
Thiobacillus thiooxidans S0 mesophile CO2
Sulfolbus species S0, organic C, Fe2+ thermophile CO2, organic C
Acidophilium cryptum organic C mesophile organic C
The bacterium Thiobacillus ferrooxidans is the most dominant iron-oxidizing bacterium. This
organism is able to use both reduced sulphur species and ferrous iron as the energy source for
growth, and obtains its cellular carbon needs from fixation of CO2. The optimal growth
conditions were determined at pH 2-3 and temperature range from 20 to 35°C.
The biological oxidation of sulphide mineral can occur according to two different pathways:
direct biological oxidation and indirect biological oxidation (Boon and Heijnen, 1993). Direct
biological oxidation occurs when bacteria directly utilize both the metal component
(predominantly iron) and sulphide sulphur from the surface of the mineral. Formation of
diffusive layers on the surface of the mineral will terminate this process. The direct biological
process can be illustrated in Figure 2.4.
rr
Ym CMS bio ox
x MS
MS xMS x,
,
,− = + ⋅ (2.29)
r Cx MS MS x, = ⋅µ (2.30)
Figure 2.4: Direct biological leaching without diffusion limitation (adopted from Boonand Heijnen, 1993).
Indirect biological oxidation refers to biological oxidation of aqueous ferrous iron to ferric iron,

18
which results in the chemical oxidation of the sulphide mineral with ferric iron. Complete
chemical (ferric iron as oxidant) oxidation of sulphide mineral will result in metal and sulphate
ions. The coupled process between biological ferrous oxidation and complete chemical
oxidation is illustrated in Figure 2.5.
r k AMS chem ox A chem MS surf, , ,− = ⋅ (2.31)
r Cx Fe Fe x, 2 2+ += ⋅µ (2.32)
rr
Ym C
Fe bio ox
x Fe
Fe xFe x2
2
2
2+
+
++− = + ⋅
,
,
,
(2.33)
Figure 2.5: Indirect biological leaching by ferric iron without diffusion limitation(adopted from Boon and Heijnen, 1993).
Incomplete chemical oxidation of the sulphide mineral will result in the formation of elemental
sulphur, which is followed by biological oxidation to sulphate. This is shown in Figure 2.6.
r Cx S S x, 0 0= ⋅µ (2.34)
rr
Ym C
S bio ox
x S
S xS x0
0
0
0,
,
,− = + ⋅ (2.35)
Figure 2.6: Indirect biological leaching by ferric iron and biological oxidation ofsulphide without diffusion limitation (adopted from Boon and Heijnen,1993).
A diffusive barrier could emerge if the formation rate of elemental sulphur exceeds the biological
oxidation rate of sulphur, or if the precipitation of ferric iron (Fe(OH)3) or jarosite
(KFe2(SO4)2(OH)6) takes place due to changes in environmental conditions, such as pH.
Chemical oxidation at the mineral surface is in series with diffusion of reactants and products
through the diffusive barrier. The overall coupling of diffusive transport and biological
oxidation process is illustrated in Figure 2.7.

19
Figure 2.7: Indirect biological leaching with diffusion limitation (adopted from Boon andHeijnen, 1993).
The overall sulphide dissolution rate is determined by the coupling of diffusion transport and
biological oxidation. The nature of the diffusive barrier will be discussed in a later section.
The biological oxidation of sulphide mineral can be considered as two distinct oxidation
processes, ferrous (Fe2+) oxidation and sulphide (S2-) oxidation. The biological oxidation of
ferrous iron has been studied extensively due to the important characteristics of ferric iron as
chemical oxidant in the oxidation of sulphide minerals (Pronk and Johnson, 1992; Ingledew,
1986; Pesic, 1993; Ahonen and Tuovinen, 1989; Nakamura et al, 1986; Jensen and Webb, 1995;
Toro et al, 1988). The significant increase in the biological oxidation of the reduced sulphur
species compared to the chemical oxidation, the bioenergetics of acidophilic Thiobacilli had
been studied extensively (Kuenen et al, 1993; Lorbach et al, 1993; Suzuki et al, 1990; Kulpa et
al, 1990; Sugio et al, 1992).
It was stated by Boogerd et al (1991) that ferric iron oxidation of pyrite did not result in the
accumulation of elemental sulphur at ferric iron concentrations less than 0.1 mM. In a biological
system, ferric iron concentrations often exceeded 0.1 mM. Under high ferric iron concentration,
formation of elemental sulphur or polysulphide, during mineral dissolution, was observed in
surface species analysis (Mustin et al, 1993a). The oxidation of sulphur by ferric iron was slow
compared to the release of metal ions. Electrochemical studies have shown that the bacterial
oxidation of elemental sulphur, formed from ferric iron oxidation of sulphide minerals, greatly
increases sulphide dissolution (Tributsch and Bennett, 1981a,b; Mehta and Murr, 1983; Choi et
al, 1993).
The oxidation of elemental sulphur and pyrite by Thiobacillus thiooxidans was investigated
based on oxygen consumption (Lizama and Suzuki, 1990). The oxidation of sulphide and

20
elemental sulphur was found to be competitively inhibited by increasing concentrations of cells.
The biological oxidation of pyrite with Thiobacillus ferrooxidans was investigated by Scharer et
al. (1991), and proposed the following rate equation.
[ ][ ]r b
Ye
O
K Obx s
E RTpH pH
a= ⋅+ + +
−− −
µ σmax.
2
0 22 5 4
1
1 10 10(2.36)
Bacterial oxidation of pyrrhotite was examined in airlift reactor by Scharer et al. (1993) and
Kwong (1995), the reaction rate was determined to be approximately 7×10⁻⁹ mol⋅m-2⋅s-1 with
respect to both iron and sulphate release. The equimolar production of iron and sulphate
suggested the importance of bacterial catalysis of sulphide oxidation, while abiotic oxidation
produced significant accumulation of sulphur species on the pyrrhotite surfaces.
The effects of pH, temperature and initial density of bacteria on the T. ferrooxidans oxidation of
ferrous iron was studied by Pesic et al. (1989). Using the continuous measurements of redox
potential, the rate equation for the biological oxidation of ferrous iron can be written as follows.
[ ] [ ][ ]− = × ⋅ ⋅ ⋅ ⋅+
+ + −d Fe
dtC H Fe P ebacteria O
RT
2
11 2 58 77162 102
. . (2.37)
where:Cbacteria concentration of bacteriaPO2 partial pressure of oxygen
The biological growth rate of heterotrophic acidophiles generally followed Monod type growth
kinetics (Equation 2.38). The growth kinetics were found to depend on substrate, such as ferrous
iron (Fe2+), elemental sulphur (S0) or sulphide minerals (Suzuki et al., 1990). T. ferrooxidans
grown on sulphide ore and elemental sulphur showed good ferrous and elemental oxidation
activities, while cells grown on ferrous iron had mixed results on S0 and Fe2+ activities when
transferred to sulphur substrate system.
( )bY
f substrates productsx s
µ σmax ,⋅
(2.38)
where:b biological scaling factorµmax specific growth rate (s-1)σ specific surface coverage (g⋅m-2)
21
Yx/s growth yield (g⋅mol-1)
There is evidence for the direct oxidation of sulphur moiety of pyrite by T. ferrooxidans
(Arkesteyn, 1979). Bacterial oxidation of Fe2+ to Fe3+ was negligible at pH 5 or above, while
pyrite and elemental sulphur utilization continued above this pH. Carbon dioxide fixation (per
mole of oxygen consumed) was highest at pH 4 for sulphur metabolism while lowest for ferrous
metabolism. This is consistent with direct oxidation of sulphide sulphur by T. ferrooxidans.
Oxygen is essential for bacterial catalysis and growth (Nagpal et al., 1993). Bacterial growth
was inhibited at dissolved oxygen concentrations less than 0.20 mg⋅L-1 (Liu, 1988; Hansford and
Bailey, 1993). Reduction in the dissolved oxygen concentration below optimal levels leads to
reduced oxidation rate and bacterial growth.
The bacterial growth rate and sulphide dissolution rate were found to increase linearly with
increasing aqueous carbon dioxide concentration (Liu et al, 1988), which was consistent with
data obtained by Torma et al (1972). However, a study performed by Nagpal (1993) in a
continuous stirred tank reactor showed that the bacterial activities increased from zero carbon
dioxide to an optimal aqueous phase carbon dioxide concentration of 3 to 7 mg⋅L-1, and
concentrations above 10 mg⋅L-1 were found to be inhibitory. Based on Monod kinetics, Nagpal
proposed the following equation for the uptake of carbon dioxide.
QX
K
C
C
K
CO
CO
CO2
2
21 1
2
=⋅
+ +
µ max (2.39)
The parameters were determined to be K1 = 4.29 mg⋅L-1 and K2 = 5.81 mg⋅L-1 and µmax⋅X was a
function of the growth conditions.
Although glucose was reported to be inhibitory to Thiobacillus ferrooxidans growth, controlled
amount of glucose in the growth medium gave a 7-fold population increase (Kai et al., 1996).
The toxicity of metal ions in acid mine drainage on Thiobacillus ferrooxidans had been studied
by Kamarov et al, 1993. The study showed that the bacterium could withstand metal
concentration of up to 10 g⋅L-1 copper, 20 g⋅L-1 iron, 25 g⋅L-1 nickel and 10 g⋅L-1 sulphuric acid
(H2SO4).
T. ferrooxidans are able to grow at pH values between 1 and 6 (Jensen and Webb, 1995), the

22
optimal pH is generally accepted to be between 2.0 and 2.3 for ferrous iron and somewhat higher
for sulphide mineral substrates (Arkesteyn, 1979). However, there were discrepancies
concerning the pH effects in attached growth environment, such as the biofilm system.
Nakamura et al. (1986) found that the ferrous iron oxidation rate remained constant for pH
values ranging from 1.5 to 2.5, but there were significant effects outside this pH range. The
biological growth and oxidation activities were found to follow Arrhenius relationship (Ahonen
and Tuovinen, 1989 & 1991). The activation energies for the oxidation of pyrrhotite and pyrite
were determined to be 40 and 95.5 kJ⋅mol-1 respectively. The activation energy for the ferrous
iron oxidation was found to be 83 kJ⋅mol-1.
When two sulphide minerals are in electrical contact in an acid-aqueous solution, the mineral
with lower electrode potential dissolves preferentially while the higher member is galvanically
protected (Mehta and Murr, 1983; Lizama and Suzuki, 1987). Under rapid galvanic dissolution,
sulphide sulphur is often partially converted to elemental sulphur on the mineral surface.
Bacteria can enhance the removal of elemental sulphur and other sulphur constituents by
oxidation to sulphate (Mehta and Murr, 1982). The combination of bacterial catalysis and
galvanic interaction of sulphide minerals enhances the dissolution of sulphide mineral with lower
electrode potential.
In the absence of bacterial activity, surface buildup of sulphur constituents will result in mass
transport limitation and reduction in galvanically induced reactions (Mehta and Murr, 1983).
Therefore, without bacterial catalysis of elemental sulphur to sulphate, galvanic interaction is
less significant.
The difficulties in studying the bacterial catalysis of sulphide oxidation is the attachment of
bacteria on solid surfaces (Suzuki et al., 1990). Amaro et al. (1993) showed that phosphate
starvation of T. ferrooxidans increased the extent of attachment to sulphide and elemental
sulphur surfaces. Cell attachment potentially reduced the accuracy of cell enumeration, and free
cells might have shown different oxidation activities compared to attached cells.
TRANSPORT PROCESSES AND GEOCHEMISTRY IN MINE TAILINGS
There are many other processes occurring in mine tailings in conjunction with sulphide
oxidation. Transport processes and equilibrium reactions are coupled with kinetic. A brief
review of these is presented below. The simplified schematic in Figure 1.1 has shown the

23
vertical transport of liquid and gaseous constituents in the unsaturated zone of a tailings column.
In addition to liquid and gas transport, there are also buffering reactions, silicate weathering,
formation and dissolution of secondary minerals (precipitates) and adsorption processes
occurring in mine tailings.
Gaseous Transport - Fick’s Law Diffusion
The most important gaseous transport in mine tailings is the penetration of oxygen into the inter-
particle pore space of the tailings. Both diffusion and advection transport of oxygen can occur in
tailings. There are three basic transport processes for oxygen movement in tailings: (1)
barometric pumping, (2) dissolved oxygen transport in infiltrating water and (3) diffusion in the
gas phase.
The change in barometric pressure can create advective transport of gas into the unsaturated
materials. The atmospheric pumping was related to the thickness of materials and change in
barometric pressure by Massmann and Farrier (1992).
∆ ∆∆
Z
Z
P
P Po0
=+
(2.40)
where:Z0 depth to saturated zone∆Z depth of penetrationP0 initial barometric pressure∆P changes in barometric pressure
The magnitude of barometric pumping was found to be insignificant for mine tailings when
changes in pressure were less than 3 % and shallow unsaturated depth.
The transport of oxygen via dissolved oxygen in infiltrating water follows the Henry’s law
equilibrium for oxygen partition between gas and liquid phases.
( )F Q P KO O H2 2= ⋅ (2.41)
where:FO2 flux of oxygen transportQ rate of water infiltrationPO2 partial pressure of oxygen in gas phaseKH Henry’s law constant for oxygen
The low solubility of oxygen in water reduces the effectiveness of oxygen transport by this
transport mechanism.

24
The predominant mechanism for oxygen transport is based on diffusion (Jaynes et al, 1984;
Nicholson et al, 1989). The one-dimensional diffusion transport estimated by Fick’s law can be
written as follows.
F DdC
dzO effO
2
2= − (2.42)
where:Deff effective diffusion coefficientdCo2 / dz oxygen concentration gradient
The effective diffusion coefficient is the combination of diffusion of oxygen in both gas and
liquid phases. Diffusion in gas phase depends on the diffusion coefficient for oxygen in air,
available gas-filled pore-space and tortuosity (Collin and Rasmuson, 1988). Using data from
Reardon and Moddle (1986), a correlation calculating the effective diffusion coefficient was
reported by David (1993).
( )H
waeff K
DSSDD
′τ
+−τ= α0
0 1 (2.43)
where:Da
0 coefficient of free diffusion for oxygen in airDw
0 diffusion coefficient of oxygen in waterS degree of saturationτ, α parameters derived from non-linear regression (0.273 and 3.28 respectively)K’ H unitless Henry’s law constant (23.6 at 10 °C)
Neutralizing Reactions and Formation / Dissolution of Secondary Minerals
The presence of buffering minerals will maintain higher pH in the mine tailings even if
significant sulphide oxidation occurs. The most common buffering minerals present in mine
tailings are calcite (CaCO3), dolomite (CaMg(CO3)2), siderite (FeCO3), amorphous aluminum
hydroxide (Al(OH)3) and gibbsite and amorphous ferric hydroxide (Fe(OH)3) and goethite.
The buffering capacity results from the consumption of protons (H+) during dissolution.
Dissolution of the buffering minerals are shown below:
CaCO H Ca H CO32
2 32+ → ++ + (2.44)

25
( )CaMg CO H Ca Mg H CO3 22 2
2 34 2+ → + ++ + + (2.45)
FeCO H Fe H CO32
2 32+ → ++ + (2.46)
( )Al OH H Al H O3
323 3+ → ++ + (2.47)
( )Fe OH H Fe H O3
323 3+ → ++ + (2.48)
The formation and dissolution of secondary minerals are based on solid-liquid equilibrium in the
aqueous phase. The general formula for the solid-liquid equilibrium is based on the solubility
products of the secondary minerals. Table 2.4 provided solubility products data for carbonate
buffering minerals.
[ ] [ ]K metal ligandsp aq aq= ⋅ (2.49)
where:Ksp solubility product constant
Table 2.4: Solubility products of secondary minerals in mine tailings (Stumm, 1992;Brownlow, 1996)
Minerals -log Ksp
Calcite CaCO3 8.42
Magnesite MgCO3 7.46
Dolomite CaMg(CO3)2 17.09
Siderite FeCO3 10.68
Gypsum CaSO4⋅2H2O 4.6
Ferric hydroxide Fe(OH)3 38.7
Weathering of Rock-Forming Minerals
The are numerous silicate and phosphate minerals that can be found with mine tailings materials,
but only a few minerals appear to have any significant effects on the major ion chemistry and pH
of mine drainage. Table 2.5 illustrates silicate and phosphate minerals that provide neutralizing
capacities when dissolved in acidic environment.
The weathering reaction rates of silicate and phosphate minerals are generally 10-3 to 10-10

26
slower than the oxidation rate of sulphide minerals. Therefore, the dissolution of such minerals
will not buffer the pH at higher value, but will have some effect on the overall chemistry of the
mine drainage.
Table 2.5: Silicate and phosphate minerals that provide buffering capacities at 25°C(Lowson and Brown, 1996).
Mineral Weathering Reaction Rate Constant
(mol⋅dm-2⋅s-1)
Muscovite /Mica
2KAl2(AlSi3O10)(OH)2 +2H+ + 3H2O → 2K+ +3Al2Si2O5(OH)4
2.5×10⁻¹⁵
(mol0.63⋅dm-0.89⋅s-1)
Kaolinite 3Al2Si2O5(OH)4 + 6H+ → 2Al3+ + 2H4SiO4 + H2O 1.8×10⁻¹⁵
Chlorite (Mg,Fe2+,Fe3+)6AlSi3O10(OH)8 + 16H+ →6(Mg,Fe2+,Fe3+) + Al3+ + 3H4SiO4 + 6H2O
1.8×10⁻¹⁶
Feldspar 2KAlSi3O8 +2H+ + 9H2O → 2K+ + 4H4SiO4 +Al 2Si2O5(OH)4
1.6×10⁻¹⁵
Apatite Ca5(PO4)3F + 9H+ → 5Ca2+ + 2H3PO4 + F- 4.9×10⁻⁸
Pyroxene CaMg(SiO3)2 + 4H+ + 2H2O → Ca2+ + Mg2+ +2H4SiO4
3.0×10⁻¹³
(mol0.5⋅dm-0.5⋅s-1)

27
MATERIALS AND METHODS
The laboratory experiments included physical methods (particle size and specific surface area),
physico-chemical methods (mineral composition), wet chemical methods (water chemistry), and
microbiological methods (bacterial inoculum, enumeration). The methods are presented below.
MATERIAL CHARACTERIZATION
Museum (or specimen) grade pyrrhotite samples were obtained from several mineral supply
companies across North America. Sample locations included Abitibi Quebec, Northern Ontario,
Virginia, Montana, New York, and Eastern Quebec. Table 3.1 lists the descriptions of the
various pyrrhotite samples, the localities where the pyrrhotite samples were obtained, and the
mineral supply companies where the pyrrhotite samples were purchased.
Table 3.1: Descriptions, suppliers, and localities of the twelve pyrrhotite samples.
Sample ID Pyrrhotite
Description
Supplier Locality
Po-M-1-93 Massive Hawthorneden D’Alambert, AbitibiPo-M-2-94 Massive Mineralogical
Research Co.Near Crown Pt. AdirondackMts. Essec Co. NY
Po-M-3-94 Massive ContinentalMinerals
Cable Mine Deer Lodge Co.Montana
Po-M-4-94 Massive ContinentalMinerals
Movat Mine Nye, StillwaterCo. Montana
Po-C-5-94 Crystalline Hawthorneden Mina Potasi, Santa Eulalia,Chihuahua, Mexico
Po-M-6-94 Massive Hawthorneden Cornog, PAPo-M-7-94 Massive Hawthorneden GaspePo-M-8-93 Massive unknown UnknownPo-M-9-91 Massive unknown UnkownPo-M-15-93
Massive Wards Sci. Virgina
Po-M-17-93
Massive Hawthorneden Northern Ontario
Po-M-19-94
Massive Hawthorneden Eastern Township, Quebec
Pyrrhotite samples were visually inspected for any apparent impurities. On two samples, visual
impurities were chipped away before crushing. Samples were crushed in a jaw crusher and

28
further ground in a ceramic ball mill. A single sample was ground first in a jaw crusher, equally
subdivided and size reduced by a sledge hammer, shatterbox, and ball mill to assess the effects of
grinding method on specific surface area. The ball mill samples were reduced by a wet and dry
grind, and a grind with increased rotational speed.
Pyrrhotite concentrates were collected from Inco Limited Copper Cliff Mill in December 7,
1995. The pyrrhotite concentrates were collected prior to discharge and therefore can be
assumed to represent the waste materials in the pyrrhotite tailings.
Particle Size Distribution
A typical 200 gram sample was wet sieved through a 45 µm (325 mesh) Tyler screen pan to
remove very fine particles (clay-sized material). The minus 45 µm sample was collected for
weight measurement. The larger size fraction was sieved through five screen pans with openings
of 45 µm, 63 µm (250 mesh), 90 µm (170 mesh), 125 µm (120 mesh) and 180 µm (80 mesh),
using a Rototap shaker. The weight of each size fractions was measured to determine the
particle size distribution.
Chemical Composition
The chemical composition of the pyrrhotite concentrate was determined using neutron activation
analysis (INAA) and inductively coupled plasma emission spectrometry (ICP).
The pyrrhotite samples were submitted for quantitative analysis of cations and total sulphur.
The analysis of cations utilizes both INAA and 4 acids digestion followed by ICP. This
analytical protocol gave reliable cation compositions at a reasonable cost. The total sulphur
content was measured using a Leco Carbon-Sulphur analyzer, which uses an infrared
spectrometry technique.
Mineralogical Composition
A Siemens Diffractometer D-500 was used for all X-ray diffraction (XRD) measurements.
Standard X-ray powder techniques were employed using CuKα radiation (λ=1.5418 Å) generated
at 40 kV and 30 mA. Scans of the pyrrhotite samples were taken between 43° and 45°, 2θ (d-
spacing=2.103 to 2.015 Å) to determine hexagonal and monoclinic composition employing
techniques similar to those reported by Graham (1969) and Arnold (1966). The resulting spectra
between 43° and 45°, 2θ were separated using a peak fitting computer program employing

29
Gaussian techniques. The hexagonal variety produces a sharp single peak at about 43.8°, 2θ
(d-spacing=2.066 Å) while monoclinic pyrrhotite gives doublets of approximately equal intensity
at about 43.9°, 2θ (d-spacing=2.064 Å) and 44.1°, 2θ (d-spacing=2.054 Å). Troilite produces a
single peak at 43.2°, 2θ (d-spacing =2.093 Å). A second random powder scan between 3° and
90°, 2θ (d-spacing=29.450 to 1.090 Å) on the pyrrhotite samples was used to determine the
presence of mineral impurities.
The X-ray diffraction measurements can identify qualitatively the presence of minerals in the
pyrrhotite sample, but cannot provide an accurate quantitative value. Given the knowledge of
the mineral present, an estimate of the mineralogical composition can be made using the cations
and sulphur concentration based on the theoretical mass balance (such as: chalcopyrite as CuFeS,
pentlandite as Ni5Fe4S8 (with 1.2% trace cobalt), galena as PbS, pyrrhotite as Fe7S8 (with 0.8%
trace nickel), pyrite as FeS2 and sphalerite as ZnS(with 1.2% trace iron)) listed in Table 3.2.
Table 3.2: Theoretical chemical compositions of sulphide mineral in Sudbury, ON.Mineral Composition (%)
Cu Co Ni Pb Zn Fe S
Chalcopyri
te
34.62 30.43 34.95
Pentlandite 1.20 35.80 29.80 33.20
Galena 86.58 13.42
Sphalerite 65.90 1.20 32.90
Pyrrhotite cNiPo(0.80)
59.60 39.60
Pyrite 46.55 53.45
Microprobe Analysis
Trace metals in the pyrrhotite matrix were determined for the twelve pyrrhotite samples using a
JOEL JXA-8600 SUPERPROBE. The samples were measured on a faraday cup with an
accelerating voltage of 25 kV and probe current of 50 nanoamps. The probe counted 20 seconds
on both the peak and background for iron and sulphur, and 30 seconds on the peak and
background for the trace elements. The elements analyzed, with their detection limits expressed

30
as weight percent, were: Mn, 0.013 %; Co, 0.014 %; Ni, 0.015 %; and Cu, 0.018%. The
standards for calibration were stoichometric FeS for Fe and S, millerite (NiS) for nickel,
chalcopyrite (CuFeS2) for copper, pure Co metal for Co and pure Mn metal for Mn.
Specific Surface Area
Specific surface area values were determined for most size fractions for the twelve pyrrhotite
samples using a GEMINI II 2375 BET surface area analyzer. The samples were evacuated on
the GEMINI sample preperation unit for 24 hours or until the gas pressure inside the chamber
tube fell below 25 millitorr. The instrument’s detection limit quoted by the manufacturer is 0.01
m2⋅g-1 with nitrogen used as the adsorptive gas. Approximately 12 grams of sample were used in
each analysis. A five point BET measurement was used to calculate the specific surface area.
DETERMINATION OF INTRINSIC KINETICS
Kinetic experiments were performed under four different conditions: i) oxidant-free (anoxic and
without chemical oxidant), ii) chemical oxidation (anoxic and ferric iron as oxidant), iii) abiotic
oxidation (aerobic and molecular oxygen as primary oxidant) and iv) biotic oxidation (aerobic
and bacterial catalysis). Experiments were performed under various physio-chemical conditions
of pH and temperature to examine the effects of these variables on oxidation kinetics. Chelating
agents such as EDTA were used in the abiotic experiments to clarify the effects of oxidation of
ferrous to ferric iron by molecular oxygen without hydroxide precipitation.
The pyrrhotite samples were wet sieved through 45 µm screen pan to remove very fine particles
(clay-sized material). Materials larger than 45 µm will then be sieved through five sieves using a
rototap shaker for 30 minutes. The mass fractions sized between 63 and 90 µm (75 µm nominal
particle diameter), and 90 and 125 µm (106 µm nominal particle diameter) was used for the
kinetic studies.
Individual size fractions were cleaned to remove residual fine particles and oxidation products in
the following way. The sieved sample was suspended in methanol by stirring repeatedly until a
clear supernatant was obtained. The sample was then cleaned for 30 to 45 seconds in an
ultrasonic cleaner. The sample was rinsed in methanol repeatedly until the supernatant appeared
clear and colourless. The sample was further washed with 6N HCl followed by distilled water,
and rinsed several times with fresh methanol and air dried.

31
The washed pyrrhotite samples were be re-sieved to obtain the size fraction between 63 and 90
µm and size fraction between 90 and 125 µm.
Reactor Configurations
Kinetic studies were conducted using two type of reactor systems. Majority of the kinetic
experiments were conducted using 0.65 L internal split-flow airlift reactors. The second reactor
system was a continuous stirred tank reactor.
Internal Split-Flow Airlift ReactorThe internal split-flow airlift reactor system was used to determine the effect of each controlling
factor (pH, temperature, bacterial catalysis) on the rate of pyrrhotite oxidation. The reactors had
a total volume of 0.65 L, and consisted of an internal diameter of 5.6 cm and a height to diameter
aspect ratio of 7 (Figure 3.1). Each reactor was water jacketed to maintain a constant
temperature set between 4°C to 40°C ±0.1°C. Oxygen transfer and fluid mixing were provided
by sparging air or nitrogen through a 110 µm sintered glass sparger at the bottom of the reactor.
The solids loading varied from 1.67 g/L (1 g in 0.6 L) to 8.33 g/L (5 g in 0.6 L). The airlift
reactor was operated under continuous flow-through mode, fresh medium was continuously
delivered into the airlift reactor at a rate of 30 mL⋅hr-1 while the effluent was withdrawn from the
top of the reactor at the same flow rate. Solids were retained in the reactor by cotton filters
installed at the inlet and outlet ports. Under continuous operation, the pseudo steady-state extent
of the pyrrhotite oxidation could be obtained from the difference in dissolved sulphate and iron
concentrations between the inlet and outlet streams.

32
Figure 3.1: Internal spilt-flow airlift reactor
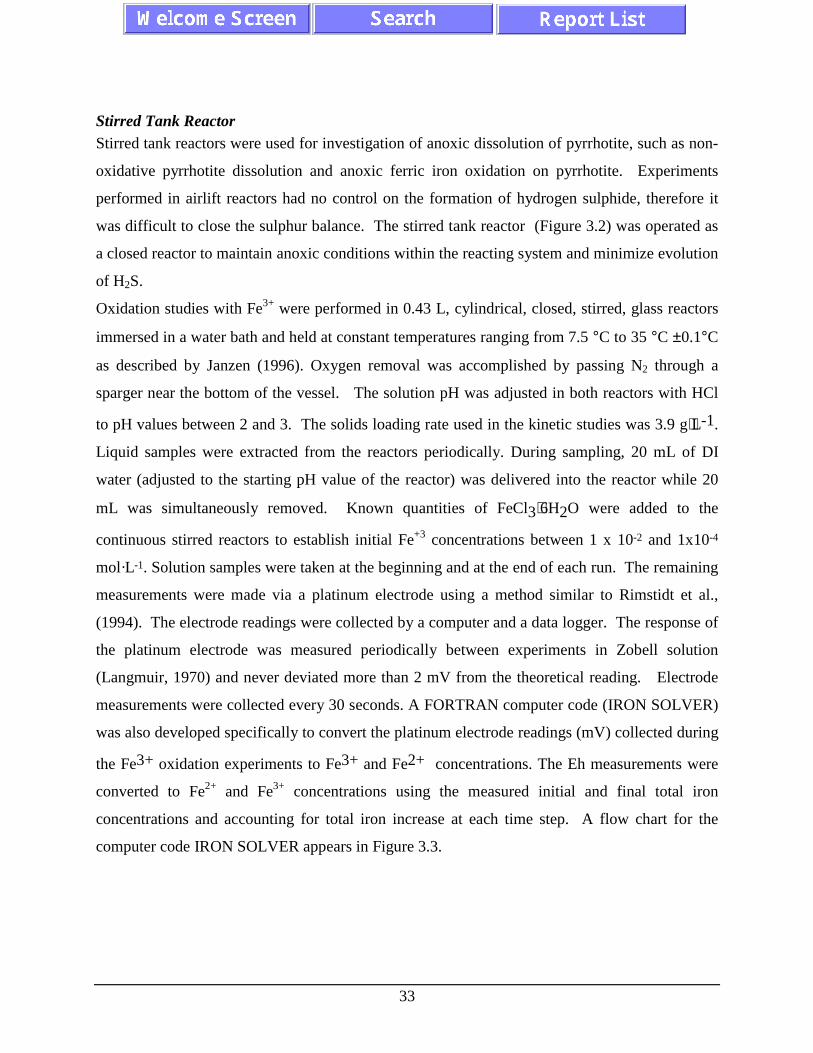
33
Stirred Tank ReactorStirred tank reactors were used for investigation of anoxic dissolution of pyrrhotite, such as non-
oxidative pyrrhotite dissolution and anoxic ferric iron oxidation on pyrrhotite. Experiments
performed in airlift reactors had no control on the formation of hydrogen sulphide, therefore it
was difficult to close the sulphur balance. The stirred tank reactor (Figure 3.2) was operated as
a closed reactor to maintain anoxic conditions within the reacting system and minimize evolution
of H2S.
Oxidation studies with Fe3+ were performed in 0.43 L, cylindrical, closed, stirred, glass reactors
immersed in a water bath and held at constant temperatures ranging from 7.5 °C to 35 °C ±0.1°C
as described by Janzen (1996). Oxygen removal was accomplished by passing N2 through a
sparger near the bottom of the vessel. The solution pH was adjusted in both reactors with HCl
to pH values between 2 and 3. The solids loading rate used in the kinetic studies was 3.9 g⋅L-1.
Liquid samples were extracted from the reactors periodically. During sampling, 20 mL of DI
water (adjusted to the starting pH value of the reactor) was delivered into the reactor while 20
mL was simultaneously removed. Known quantities of FeCl3⋅6H2O were added to the
continuous stirred reactors to establish initial Fe+3 concentrations between 1 x 10⁻² and 1x10⁻⁴
mol·L-1. Solution samples were taken at the beginning and at the end of each run. The remaining
measurements were made via a platinum electrode using a method similar to Rimstidt et al.,
(1994). The electrode readings were collected by a computer and a data logger. The response of
the platinum electrode was measured periodically between experiments in Zobell solution
(Langmuir, 1970) and never deviated more than 2 mV from the theoretical reading. Electrode
measurements were collected every 30 seconds. A FORTRAN computer code (IRON SOLVER)
was also developed specifically to convert the platinum electrode readings (mV) collected during
the Fe3+ oxidation experiments to Fe3+ and Fe2+ concentrations. The Eh measurements were
converted to Fe2+ and Fe3+ concentrations using the measured initial and final total iron
concentrations and accounting for total iron increase at each time step. A flow chart for the
computer code IRON SOLVER appears in Figure 3.3.

34
Figure 3.2: Stirred tank reactor

35
Figure 3.3: Flow chart for the program IRON SOLVER

36
BACTERIAL INOCULUM
The biological inoculum for the biological studies was obtained from acid mine drainage at Elliot
Lake, Ontario, Canada. After one year of acclimatization with pure pyrrhotite, an essentially
monotypic culture of Thiobacillus ferrooxidans was attained. The pyrrhotite samples used for
bacterial enumeration experiments were wet sieved through 45 µm screen pan and washed with
methanol to minimize biological growth on the sample during storage.
The aqueous medium used for the growth of Thiobacillus ferrooxidans was essentially identical
to the standard medium used by other researchers, except the 9K medium used for the studies
was comparatively more diluted. The modified 9K medium used for the biological studies was
designed to be as simple as possible. The chemical composition of the aqueous medium is
shown in Table 3.3.
Table 3.3: Chemical composition of aqueous growth media for Thiobacillus ferrooxidans
Components Modified 9K medium(per litre)
Starkey medium(per litre)
(NH4)2SO4 0.25 g 0.30 g
MgSO4⋅7H2O 0.04 g 0.5 g
K2HPO4 0.125 g
KH2PO4 3.5 g
CaCl2⋅2H2O 0.25 g
H2SO4 (pH adjustment) to pH = 2 or 3 to pH = 4.5
Energy Source 50 g of FeSO4,or 50 g of pyrrhotite
10 g of precipitated sulphur

37
Figure 3.4: Column layout

38
The ingredients potassium chloride (KCl) and calcium nitrate (Ca(NO3)) were omitted from the
modified 9K medium used in the biological oxidation of ferrous and mineral sulphide.
Potassium and chloride ions were supplied as K2HPO4 and CaCl2, respectively. The nitrogen
requirement is met by (NH4)2SO4, therefore, no addition of Ca(NO3)2 is necessary.
Double de-ionized water was used for the preparation of the biological media. The media were
heat sterilized before the addition of an ‘energy source’, at 120 °C and 1.2 atm for approximately
15 minutes. The inoculum size ranged from 10 % (by volume) for cell culture and 5 % (by
volume) for kinetic testing.
Shake flask cultures (500 mL ) with 10 % inoculum (v/v) were grown in 1 L Erlenmeyer flasks
at ambient temperature on a rotary shaker at 175 rpm for 21 days.
COUPLING OF MASS TRANSFER WITH OXIDATION KINETICS
Column Configurations
Altogether 6 columns packed with tailings analogues were employed. Each packed column had
an internal diameter of 7.62 cm and a height of 1.05 metres (Figure 3-4). Each column was
equipped with four liquid sampling ports and four gas sampling ports for measurement of
porewater concentrations and oxygen concentrations at different heights in the column. The
moisture content in the column was adjusted using a porous ceramic disk installed at the bottom
of the column.
The column was packed to a height of 1 metre and contained approximately 4.56 litres of solids
in bulk volume. Inco pyrrhotite concentrate was used as the sulphide component of the solids in
the column. The pyrrhotite concentrate was pre-sieved through a 45 µm sieve to remove fine
particles. Quartz sand was mixed with the pyrrhotite concentrate to lower the sulphide content
(2 % and 6 %) in order to accelerate the profile development in the packed column. Each of the
six columns was set to a different condition to investigate different scenarios that may be
encountered in the field. The combinations used in each of the six columns are listed in
Table 3.4.

39
Table 3.4: Conditions used in packed columns.Condition Designation Approximate
Sulphur Content(%)
Special Conditions
#1 Base Case 6 None
#2 2 % S2- 2 None
#3 Bacterial
inoculated
6 with Thiobacillus ferrooxidans
inoculations
#4 1% Calcite 6 with 1 % calcite buffer
#5 5 % Enstatite 6 with 5 % buffering silicate (Enstatite)
#6 With Fines 6 with minus 45 µm particles
The packed column was designed to investigate the coupling of oxidation kinetics with
geochemical and transport processes, such as diffusion of oxygen, buffering reactions,
precipitation and adsorption. These processes were measured using overall contaminant loading
data, headspace oxygen consumption measurements, porewater chemistry and pore-space
oxygen concentration profiles. Sampling was performed biweekly to allow sufficient time for
sulphide oxidation to occur between samples.
Contaminant LoadingOverall contaminant loading was obtained by flooding the column from the bottom until a 16 cm
water head was obtained above the top of the soil surface (a special column extension is used for
the flooding of the column). Flooding from the bottom of the column prevented entrapment of
air pockets in the column. The column was allowed to drain with the water table set at vertical
distance of 1.5 m below the bottom of the column. The column was allowed to drain for 1 to 2
days before the water table was reset to the operating level (bottom of the column).
The drained liquid was analysed for pH, total iron, nickel, and sulphate concentrations. Since the
environment was not anoxic, the use of Eh conjunction with the computer program
IRONSOLVER was not applicable.
Headspace Oxygen ConsumptionHeadspace oxygen consumption measurements can provide data for maximum sulphide
oxidation rates with no prior knowledge of the diffusion coefficient for oxygen in the column. A

40
special cap equipped with a galvanic oxygen sensor to provide oxygen concentration decline in
the fixed headspace gas volume was designed. An o-ring was installed in the sensor cap to
ensure that no gas transfer occurs during measurement. The sensor cap is shown on Figure 3.5.
The sensor cap, with the venting valve open, was placed on the column after a pseudo steady-
state condition was achieved between flooding. All flooding and drainage tubes were closed to
prevent any atmospheric pressure effect during sampling. Measurement was initiated by closing
the venting valve. The oxygen concentration data were obtained using a multi-channel voltmeter
connected to a computer.
Porewater Concentration ProfilesFour suction lysimeters were installed in the column at a distance of 20 cm apart. The lysimeter
employed a porous ceramic cap that allows liquid passage only, without gas entry up to a suction
pressure of 0.5 bar (approximately 50 kPa). The lysimeter is shown in Figure 3.6. The
lysimeters were connected to a vacuum pump at 36 kPa suction pressure. Approximately 5 to 10
mL of porewater was drawn through the lysimeter into a sample bottle from each of the sampling
ports. The porewater samples were analyzed for pH, total iron, ferrous iron, nickel and sulphate
concentrations. The presence of dissolved oxygen in some of the samples precluded the
application of the IRONSOLVER program. These data provide a concentration-height profile
for each contaminant, which was used for estimation of precipitation and adsorption reactions in
the column.
Pore-space Oxygen Concentration ProfilesTo identify the location of the oxidation zone and buffering region in the column, the pore-space
oxygen concentration data could be used to indicate the region where highest oxygen
consumption occurred. A galvanic oxygen sensor cell was installed with a connecting unit, and
was attached to the gas sampling port (20 cm apart) along the column. The detection cell is
shown in Figure 3.7. After the sensor was attached to the column, 5 mL of gas was drawn off
the remove oxygen in the stagnant space adjacent to the sensor. This significantly shortens the
time necessary for the measurement. The duration of each measurement was approximately 3
hours. The oxygen data were logged using a multi-channel voltmeter connected to a computer.
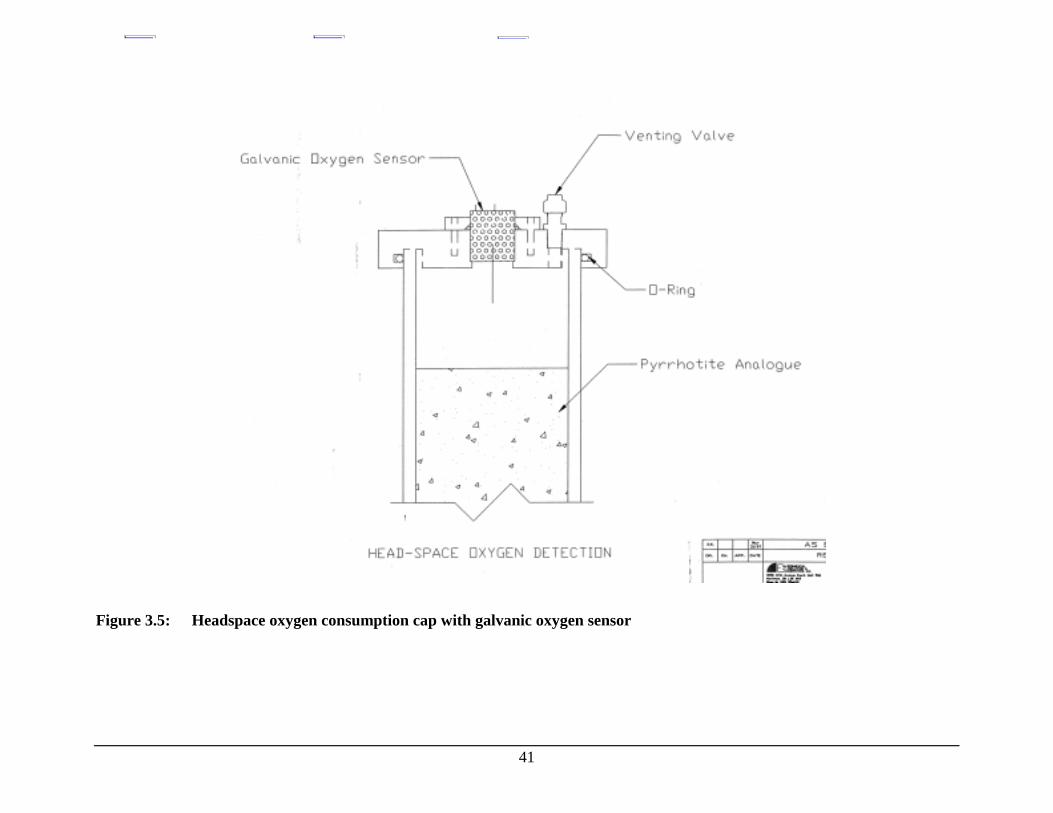
41
Figure 3.5: Headspace oxygen consumption cap with galvanic oxygen sensor

42
Figure 3.6 Lysimeter for porewater extraction

43
Figure 3.7 Oxygen profile sampling port with galvanic oxygen sensor

44
ANALYTICAL TECHNIQUES
Liquid samples taken during the kinetics and column experiments were analyzed for dissolved
ferrous (Fe2+), total dissolved iron, dissolved nickel (Ni2+) and sulphate (SO42-). Selected solid
samples after experimentations were sent for chemical compositions and surface textures by
scanning electron microscopy.
Ferrous Iron (Fe2+) Analysis - Bathophenanthroline Method
The ferrous iron concentration in the liquid samples were determined colorimetrically using
bathophenanthroline (4,7-phenyl-1,10-phenanthroline) reagent as described by Lee and Stumm
(1960). This non-oxidative method is reported to be specific for ferrous iron. The presence of
other transient metal ions in their lower oxidation state such as manganese, reduced dissolved
sulphur compounds (sulphide, thionates, thiosulphates) and dissolved organics (EDTA, products
of bacterial activity) preclude the use of methods based on titration by an oxidizing agent.
Liquid samples ranging from 0.5 to 1.0 mL are pipetted into a 125 mL separatory funnel and 4
mL of 10 % (wt / vol) sodium acetate (NaC2H3O2) solution was then added to buffer the pH at
approximately 4. Approximately 15 mL of 0.001M bathophenanthroline was added to complex
with the ferrous iron to give a red colour. The iron-bathophenanthroline complex was then
extracted from the aqueous phase into an organic phase by adding 10 mL of n-hexanol
(C6H13OH). The separatory funnel was then thoroughly shaken and allowed to separate for at
least 5 minutes after mixing. The aqueous phase was then drawn off and discarded, while the
organic phase was drawn into a 25 mL volumetric flask. The separatory funnel was rinsed with
2 to 3 mL of ethanol to ensure all iron-bathophenanthroline complexes were washed into the
volumetric flask. The organic solution was diluted with ethanol to a 25 mL volume.
The colorimetric measurement is based on the absorbance of the organic solution at a wavelength
of 533 nm. The relationship between absorbance and ferrous concentration conforms to Beer’s
law (i.e. absorbance is directly proportional to iron concentration). Ethanol was be used as a
blank for the analysis and calibration line was obtained using known concentrations of ferrous
ammonium sulphate (Fe(NH4)2(SO4)2) solution.
Total Iron Analysis
There were two analytical methods used for the determination of total dissolved iron. For liquid

45
samples that had volume greater than 5 mL, atomic absorption analysis was used.
Bathophenanthroline analysis was used for liquid samples that had volume less than 5 mL, such
as porewater samples extracted from the column experiments.
Atomic AbsorptionThe atomic absorption spectrometric measurements were performed on an atomic absorption
spectrometer (Perkin Elmer Atomic Absorption Spectrometer 3100) employing air as oxidant
and acetylene as fuel. The absorption wavelength was set at 279.3 nm with detection slit setting
was set at 0.2 and high. Each analysis was performed in triplicate. The absorbance was
automatically recorded and integrated by a software package installed on an on-line personal
computer. The absorption to concentration relationship follows Beer’s law and the calibration
curve was obtained using known dilution of iron atomic adsorption standard.
Bathophenanthroline MethodThe procedures used to determine the total dissolved iron by bathophenanthroline was the same
as those used for ferrous analysis, except ferric iron was reduced to ferrous prior to addition of
sodium acetate. The reduction of ferric iron to ferrous was done by the addition of 2 mL of
hydroxylamine hydrochloride.
Nickel (Ni2+) Analysis - Atomic Absorption
The nickel analysis procedure was similar to that used for total iron analysis by atomic
absorption. The absorption wavelength for nickel is 232.0 nm with detection slit setting at 0.2
and high. The absorption to concentration relationship follows Beer’s law and the calibration
curve was obtained using known dilution of nickel atomic adsorption standard.
Sulphate (SO42-) Analysis - Ion Chromatography
Ion Chromatography with a conductivity detector was used to determine sulphate concentration
in liquid samples. The anions separation was achieved by using a Dionex IonPac AS4A anion
separation column with carbonate / bicarbonate buffer eluent (0.18mM sodium carbonate
(Na2CO3) and 0.17mM sodium bicarbonate (NaHCO3)). A post column suppressor (Dionex
Anion Micro-Membrane Suppressor) was used to reduce solution background conductivity due
to carbonate / bicarbonate eluent. Conductivity measurements were performed on at least 10
concentrations in the range between 0 to 50 mg⋅L-1 to verify linearity. The conductivity-
concentration relationship was calibrated using double de-ionized water as blank and a 50 mg⋅L-1

46
of sulphate standard (prepared from ferrous ammonium sulphate). The standard conductivity
measurements were stored internally by a computer program and used to estimate the
concentrations of subsequent samples by employing software supplied by the manufacturer.
Surface Texture - Scanning Electron Microscopy (SEM)
Surface characteristics of the pyrrhotite particles before and after dissolution were investigated
using scanning electron microscopy. Dry particles were secured onto a conductive sample stud
using a conductive double-sided adhesive tape. Sample studs were coated with gold at a
thickness of 120 Å. The gold coating provided additional secondary electrons for better imaging.

47
RESULTS AND DISCUSSION
PHYSICAL AND CHEMICAL CHARACTERISTICS OF PYRRHOTITE SAMPLES
Detailed characterization of pyrrhotite materials was performed on several specimen-grade
pyrrhotite samples in order to access potential effects on reaction rates. Based on those results, a
more focused characterization of the pyrrhotite tailings (concentrate) was conducted for
materials used in the column experiments.
Specimen-Grade Pyrrhotite Samples
Specific Surface AreaPlots of P/Po versus N2 adsorbed were used to determine the linear range of the isothermal
adsorption of N2 on pyrrhotite. A sample plot appears in Figure 4.1. The linear range was
determined to be valid from 0.1 to 0.3 relative pressure. Isothermal adsorption of N2 varies from
one material to the next. For example, the linear range of the isothermal adsorption of N2 on
synthetic goethite appears to be valid from 0.1 to 0.25 (Davis and Kent, 1990). N2 adsorption on
goethite appears to be quite different from pyrrhotite illustrating that the linear range of the
isothermal adsorption of N2 needs to be determined for different materials since points in the
linear range are used in calculating BET specific surface area (area per unit mass).
Specific surface area measurements are compared graphically to the theoretical geometric
specific surface area (based on spheres) and to the specific surface area of cleaned pyrite
particles on a log-log plot in Figure 4.2. As the grain fraction decreases in size, the specific
surface area of the pyrrhotite increases. Both the pyrite and pyrrhotite specific surface areas were
higher than the predicted geometric specific surface areas. This plot clearly shows an envelope
for the specific surface areas of pyrrhotite particles that follows a slope similar to the calculated
geometric specific surface area. The measured pyrrhotite specific surface areas are a factor of 6-
40 times greater than the theoretical geometric specific surface area and a factor of 2-10 times
greater than the measured specific surface area of pyrite.

48
0
0.01
0.02
0.03
0.04
0.05
0.06
0.07
0 0.1 0.2 0.3 0.4 0.5 0.6 0.7
Relative Pressure
Vol
ume
N2
Ads
orbe
d (c
c/g
STP
)
Figure 4.1: Adsorption isotherm for N2 gas, at 77.4°K, on pyrrhotite.
-2.5
-2
-1.5
-1
-0.5
0
1.6 1.7 1.8 1.9 2 2.1 2.2 2.3 2.4
Geometric mean grain size (log µm)
Sp
ecif
ic s
urf
ace
area
(lo
g m
2 g-1
)
Geometric specific surface area
Pyrite specific surface area
Pyr
rho
tite
sam
ple
ssp
ecif
ic s
urf
ace
area
Figure 4.2: Specific surface area comparisons among the twelve pyrrhotite samples, apyrite sample from Colorado, and the theoretical geometrical specific surfacearea based on particle size plotted on a log - log axis.

49
The effects of different grinding techniques on specific surface of pyrrhotite were evaluated
since some of the original samples were crushed by unknown techniques by previous
investigations. The results are shown in Figure 4.3. The specific surface areas of pyrrhotite
treated by various grinding methods converge at grain size 212 µm - the initial starting grain size
used before applying separate crushing techniques. However as the particles were further
reduced in size and become more characteristic of the different size reduction methods, the
specific surface area values of the pyrrhotite samples diverge. A maximum factor of three
separating the largest and smallest surface area values for the various crushing techniques. SEM
pictures confirmed that the particles were thoroughly cleaned of fine particles prior to surface
area analysis. Therefore, it appears that as different forces and strains are imposed on the
pyrrhotite sample by different size reduction methods, the specific surface area of pyrrhotite for a
given grain size may change.
0
0.2
0.4
0.6
0.8
1
1.2
1.4
75.3 127.3 212.1
Mean geometric grain size (µm)
Spec
ific
Sur
face
Are
a (m
2 g-1
)
Ball Mill - Wet Grind
Ball Mill - Dry Grind
Ball Mill - 3X Rotational Speed
Hammer reduction
Shatterbox Grind
Jaw Crusher Fall out
Figure 4.3: The effects of grinding techniques on pyrrhotite specific surface area.
The change in surface area from long term pyrrhotite oxidation by oxygen in air during storage is
illustrated in Table 4.1. After 15 months of storage in a dessicator, the specific surface areas of
two pyrrhotite samples were re-examined. The specific surface area of both pyrrhotite samples
decreased noticeably. Cleaning the pyrrhotite samples in an acid solution revealed that iron
oxides/hydroxides formation had occurred on the pyrrhotite surface. The colorless washing

50
solution turned a rusty brown colour that was characteristic of iron oxides. After cleaning, the
surface area for both samples increased.
Table 4.1: Specific surface area of two pyrrhotite samples after 15 months of oxidation.Sample
IDCondition Specific Surface
Area (m2 g-1)% of Original
Area
Po-M-4-94 Initial specific surfacemeasurement
1.78 -
Po-M-4-94 Air dried sample undergoes O2
oxidation in storage for 15 months0.20 11
Po-M-4-94 Sample re-cleaned in HCl acidsolution
0.45 25
Po-M-15-93
Initial specific surfacemeasurement
2.10 -
Po-M-15-93
Air dried sample undergoes O2
oxidation in storage for 15 months0.32 15
Po-M-15-93
Sample re-cleaned in HCl acidsolution
1.81 86
Significant variations in measured specific surface area existed among the pyrrhotite samples,
ranging from 0.17 to 2.1 m2⋅g
-1, for particles in the grain fraction 125-180 µm. Initially, it was
thought that the pyrrhotite particles were improperly cleaned (i.e. fine particles remained
adhering to the larger particles after cleaning). Secondary particles or "dust" may partially cover
larger particles increasing the apparent specific surface area (Nicholson et al., 1988). The fine
particles, if not removed, will oxidize more rapidly leading to apparent non-linear rates and
misinterpretation of kinetic results. After rigorous cleaning, however, SEM photographs revealed
clean surfaces. Surface roughness and fractures are the cause of the higher than expected
specific surface areas for pyrrhotite samples (Figure 4.4 to Figure 4.7). The fractures seem to
vary in thickness and occur along cleavage planes of the pyrrhotite particles. The fractures are
not merely near surface effects; rather, the fractures were found to extend into the pyrrhotite
grains (Janzen, 1996). Pyrite surfaces are smooth and absent of fractures (see Figure 4.8) in
comparison to the surface morphology of pyrrhotite. These features resulted in a measured
specific surface areas for particles of pyrite that were 2-10 times smaller than pyrrhotite particles
of a similar size range. Specific surface area was compared graphically to crystal structure and
trace metal content (Janzen, 1996). It appears that specific surface area is not related to crystal
structure or trace metal content (Janzen, 1996). However, this study has shown that grinding
method

Figure 4.4: SEM photograph ofa pyrrhotite grain
Figure 4.5:
Figure 4.6:
Figure 4.7:
Figure 4.8: SEM photograph of a pyritegrain
SEM photograph ofa pyrrhotite grainillustratingfractures
51
Polished section of a pyrrhotitegrain illustrating extendedfracture network
SEM photograph of a pyrrhotitegrain illustrating fracturesurface
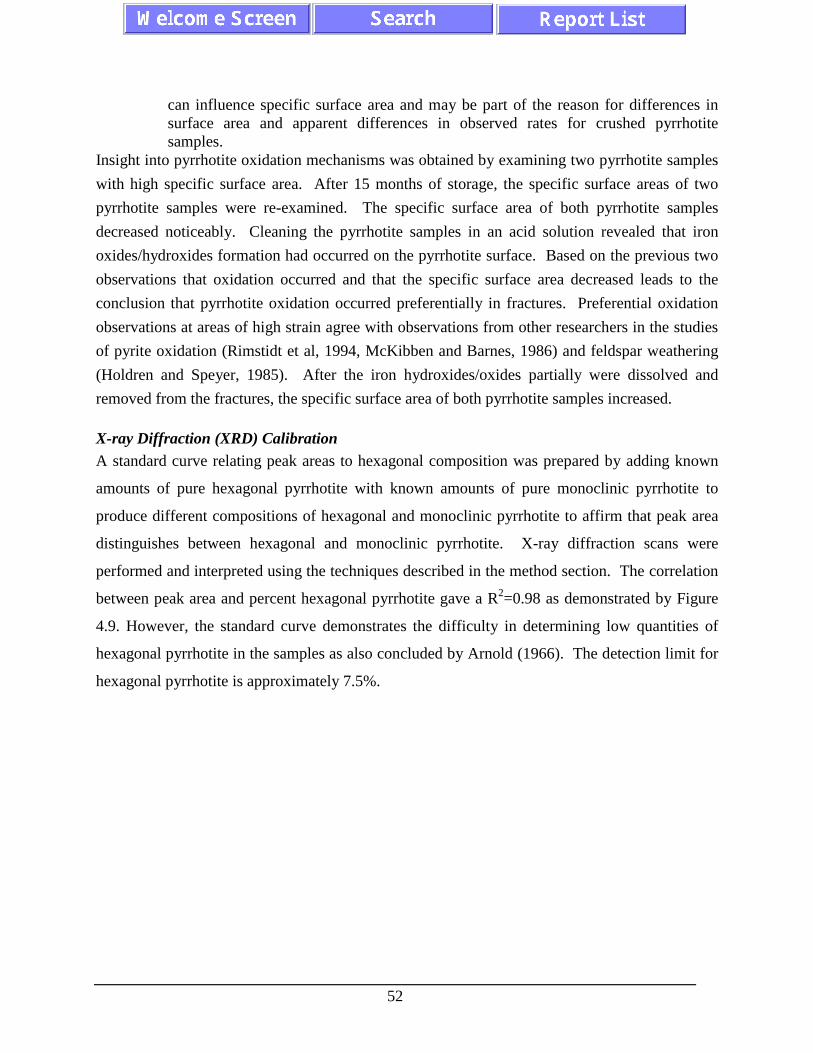
52
can influence specific surface area and may be part of the reason for differences insurface area and apparent differences in observed rates for crushed pyrrhotitesamples.
Insight into pyrrhotite oxidation mechanisms was obtained by examining two pyrrhotite samples
with high specific surface area. After 15 months of storage, the specific surface areas of two
pyrrhotite samples were re-examined. The specific surface area of both pyrrhotite samples
decreased noticeably. Cleaning the pyrrhotite samples in an acid solution revealed that iron
oxides/hydroxides formation had occurred on the pyrrhotite surface. Based on the previous two
observations that oxidation occurred and that the specific surface area decreased leads to the
conclusion that pyrrhotite oxidation occurred preferentially in fractures. Preferential oxidation
observations at areas of high strain agree with observations from other researchers in the studies
of pyrite oxidation (Rimstidt et al, 1994, McKibben and Barnes, 1986) and feldspar weathering
(Holdren and Speyer, 1985). After the iron hydroxides/oxides partially were dissolved and
removed from the fractures, the specific surface area of both pyrrhotite samples increased.
X-ray Diffraction (XRD) CalibrationA standard curve relating peak areas to hexagonal composition was prepared by adding known
amounts of pure hexagonal pyrrhotite with known amounts of pure monoclinic pyrrhotite to
produce different compositions of hexagonal and monoclinic pyrrhotite to affirm that peak area
distinguishes between hexagonal and monoclinic pyrrhotite. X-ray diffraction scans were
performed and interpreted using the techniques described in the method section. The correlation
between peak area and percent hexagonal pyrrhotite gave a R2=0.98 as demonstrated by Figure
4.9. However, the standard curve demonstrates the difficulty in determining low quantities of
hexagonal pyrrhotite in the samples as also concluded by Arnold (1966). The detection limit for
hexagonal pyrrhotite is approximately 7.5%.

53
y = 0.9467x + 7.5818
R2 = 0.9823
0
10
20
30
40
50
60
70
80
90
100
0 10 20 30 40 50 60 70 80 90 100Percentage of Hexagonal Pyrrhotite
Per
cent
age
Are
a
Figure 4.9: XRD standardization - Correlation between peak area and hexagonalcomposition.
Only cobalt, nickel, and small amounts of copper and manganese were found to substitute for
iron in the pyrrhotite samples examined in this study, in agreement with the findings of Arnold
(1967), and Deer et al. (1992). Manganese and copper substitution were apparently not
significant in the pyrrhotite samples as Mn and Cu were not detected at levels much greater than
the detection limit during electron microprobe analysis. No other elements were likely present in
significant quantities in the pyrrhotite structure because the mass of iron, sulphur and the four
trace elements (not shown) accounted for practically 100% of the mineral composition taking
into account instrument error (electron microprobe). The increase in nickel substitution appears
to correspond with an increase in bulk nickel concentration (by chemical analysis) in the
pyrrhotite sample representing nickel present in accessory minerals plus nickel substituting for
iron in pyrrhotite. Cobalt substitution follows a similar trend whereas copper and manganese
substitution for iron do not follow this trend.
Bulk Chemical ImpuritiesThe results of the bulk chemical analysis determined by multi-acid extraction followed ICP-AES
measurement of the elements for the twelve pyrrhotite samples are plotted in Figure 4.10. Only
the major bulk impurities are plotted. The remaining elements are listed in Janzen, 1996. The
bulk chemical analysis of the twelve pyrrhotite samples, determined by multi-acid extraction and

54
ICP, demonstrated that pyrrhotite samples contain a range of impurities. The major impurities
were cobalt, copper, manganese, nickel, lead, and zinc (Figure 4.10).
0
5000
10000
15000
20000
25000
30000
35000
40000
45000
50000
Po-
M-1
-93
Po-
M-2
-94
Po-
M-3
-94
Po-
M-4
-94
Po-
C-5
-94
Po-
M-6
-94
Po-
M-7
-94
Po-
M-8
-93
Po-
M-9
-91
Po-
M-1
5-93
Po-
M-1
7-93
Po-
M-1
9-94
Pyrrhotite Sample
Co
nce
ntr
atio
n (
pp
m)
Co Cu Ni Mn Zn Pb
Figure 4.10: Impurity concentrations of the pyrrhotite samples.
Trace Metal Content from Electron Microprobe AnalysisThe average trace metal content of the twelve pyrrhotite samples analyzed by electron
microprobe appear in Table 4.2. Samples that had distinguishable differences in metal content
amongst the measured grains were separated into two groups (Po-M-2-94, Po-M-4-94, Po-C-5-
94 - the light, bright, and dark descriptions refer to the colour of the grains relative to one
another). It is clear from Table 4.2 that significant differences in trace metal content among the
twelve pyrrhotite samples exist. All pyrrhotite samples contain Co of varying proportions;
however, the range of Co composition was small, 513 to 2407 ppm, compared to the range Ni
values observed. The proportions of trace nickel in the pyrrhotite samples varied from 0 to 9450
ppm. Overall, the mean total trace metal content in the twelve pyrrhotite samples is 3055 ppm ±
3171 with a median of 1593 ppm.

55
Table 4.2: Trace metal contents of pyrrhotite samples.Sample Co
(mg/kg)Cu
(mg/kg)Mn
(mg/kg)Ni
(mg/kg)Total Trace Metals
(mg/kg)
Po-M-1-93 1414 462 24 54 1954Po-M-2-94bright
694 45 0 5 744
Po-M-2-94dark
1150 5 20 2898 4073
Po-M-2-94smoke
651 0 0 90 741
Po-M-3-94 935 5 5 63 1008Po-M-4-94dark
600 17 0 3477 4093
Po-M-4-94bright
640 0 100 130 870
Po-C-5-94dark
525 10 40 0 575
Po-C-5-94 light 520 0 100 0 620Po-M-6-94 2407 0* 0* 3810 6217Po-M-7-94 1577 0* 0* 27 1603Po-M-8-94 1583 0* 0* 0 1583Po-M-9-91 685 0* 0* 6794 7479Po-M-15-93 765 0* 0* 15 780Po-M-17-93 640 0* 0* 9450 10090Po-M-19-94 513 10 10 27 560where *= not measured
Accurately measured iron contents of the twelve pyrrhotite samples by the electron microprobe
permits a verification of the equation presented by Yund and Hall (1969) relating atomic percent
iron of hexagonal pyrrhotites and X-ray powder diffraction measurements.
X = 45.212 + 72.86(d102-2.0400) + 311.5(d102-2.0400)2 (4.1)
where X is the composition of hexagonal pyrrhotite in atomic percent iron, and d102 is the
strong refraction of hexagonal pyrrhotite (d-spacing=2.066 Å). In Figure 4.11, a comparison of
measured and predicted iron contents for each method is shown (error bars allow for one
standard deviation for each estimation technique). Only pyrrhotite samples with greater than
74% hexagonal pyrrhotite were used for the comparison since the equation predicts hexagonal
atomic percent iron for a pure hexagonal sample. Skinner and Luce (1971) stated that
appreciable quantities of nickel, cobalt, or manganese substituting for iron may invalidate
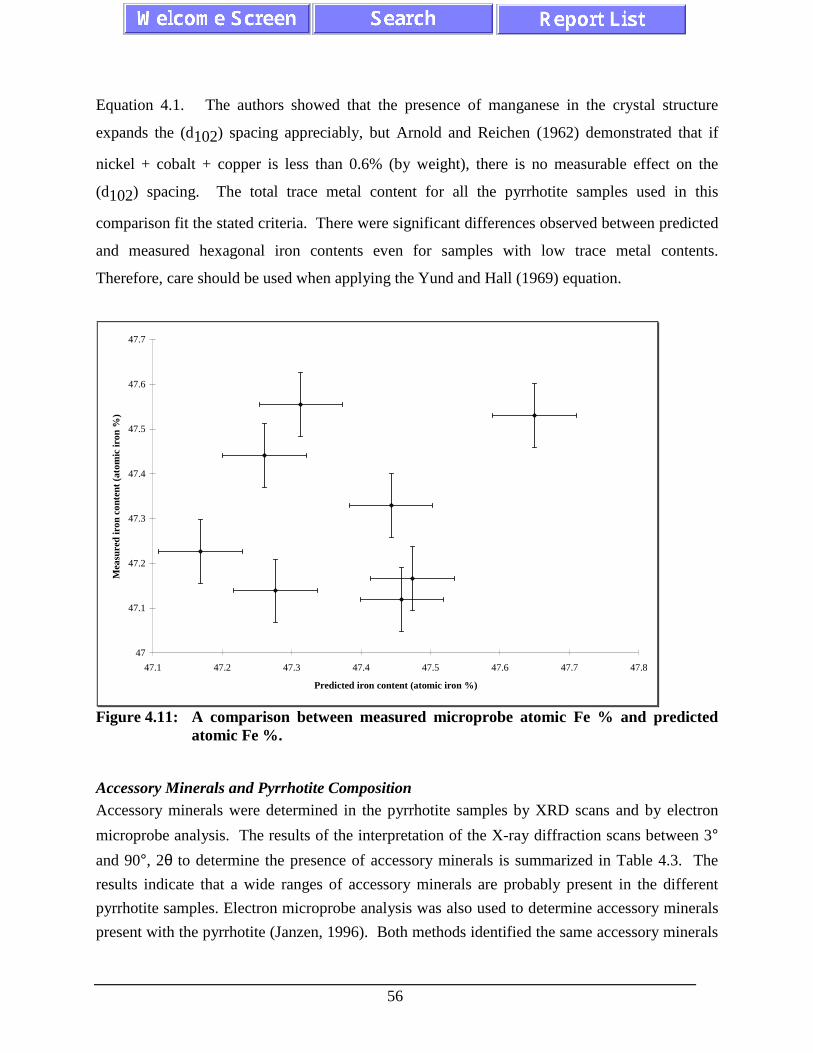
56
Equation 4.1. The authors showed that the presence of manganese in the crystal structure
expands the (d102) spacing appreciably, but Arnold and Reichen (1962) demonstrated that if
nickel + cobalt + copper is less than 0.6% (by weight), there is no measurable effect on the
(d102) spacing. The total trace metal content for all the pyrrhotite samples used in this
comparison fit the stated criteria. There were significant differences observed between predicted
and measured hexagonal iron contents even for samples with low trace metal contents.
Therefore, care should be used when applying the Yund and Hall (1969) equation.
47
47.1
47.2
47.3
47.4
47.5
47.6
47.7
47.1 47.2 47.3 47.4 47.5 47.6 47.7 47.8
Predicted iron content (atomic iron %)
Mea
sure
d ir
on c
onte
nt (
atom
ic ir
on %
)
Figure 4.11: A comparison between measured microprobe atomic Fe % and predictedatomic Fe %.
Accessory Minerals and Pyrrhotite CompositionAccessory minerals were determined in the pyrrhotite samples by XRD scans and by electron
microprobe analysis. The results of the interpretation of the X-ray diffraction scans between 3°and 90°, 2θ to determine the presence of accessory minerals is summarized in Table 4.3. The
results indicate that a wide ranges of accessory minerals are probably present in the different
pyrrhotite samples. Electron microprobe analysis was also used to determine accessory minerals
present with the pyrrhotite (Janzen, 1996). Both methods identified the same accessory minerals

57
in each sample with a few exceptions (Janzen, 1996).
Table 4.3: Accessory minerals present in the pyrrhotite samples.Sample ID Accessory Minerals
Po-M-1-93 Chalcopyrite (CuFeS2), Akaganeite (FeO(OH)β)Po-M-2-94 Bravoite ((Fe,Ni)S2), Magnetite (Fe3O4),Chalcopyrite (CuFeS2)Po-M-3-94 Chalcopyrite(CuFeS2), Pyrite (FeS2), Goethite (FeO(OH)α)Po-M-4-94 Pentlandite ((Fe,Ni)9S8)Po-C-5-94 Pyrite (FeS2), Quartz (SiO2), Galena (PbS)Po-M-6-94 Chalcopyrite (CuFeS2), Quartz (SiO2)Po-M-7-94 Chalcopyrite (CuFeS2)Po-M-8-93 Chalcopyrite (CuFeS2), Quartz (SiO2)Po-M-9-91 Pentlandite ((Fe,Ni)9S8), Silicates, CarbonatesPo-M-15-93 Chalcopyrite (CuFeS2), Pyrite (FeS2), Wurtzite (ZnS),
Goethite (FeO(OH)α), Dolomite (CaMg(CO3)2), Sphalerite
(β-ZnS), Silicates, Dolomite-ferroan (Ca(Fe,Mg)(CO3)2)Po-M-17-93 Pentlandite ((Fe,Ni)9S8), Chalcopyrite (CuFeS2),
Nickel Sulfide (Ni1-xS2)Po-M-19-94 Chalcopyrite (CuFeS2), Dolomite (CaMg(CO3)2), Sphalerite
(β-ZnS), Pyrite (FeS2), Teallite (PbSnS2)
The findings from the 43° to 45°, 2θ XRD scans are presented in Table 4.4. There is wide
compositional range between monoclinic and hexagonal pyrrhotite with two pyrrhotite samples
containing troilite (FeS). The compositions range from pure hexagonal (e.g. Po-M-1-93) to
nearly pure monoclinic (e.g. Po-C-5-94). Triolite presence was verified in sample Po-M-2-94
and Po-M-4-94 by electron microprobe. Sample plots for the 43° to 45°, 2θ scans are shown in
Figure 4.12. The figure show a nearly pure monoclinic pyrrhotite, a pure hexagonal pyrrhotite, a
mixture of hexagonal and monoclinic pyrrhotite, and a mixture of hexagonal, monoclinic and
troilite.

58
a) b)
c) d)
Figure 4.12: XRD intensity spectra for: (a) pure hexagonal pyrrhotite, (b) puremonoclinic pyrrhotite, (c) mixed hexagonal and monoclinic pyrrhotite, and(d) mixed hexagonal, monoclinic and troilite containing pyrrhotite
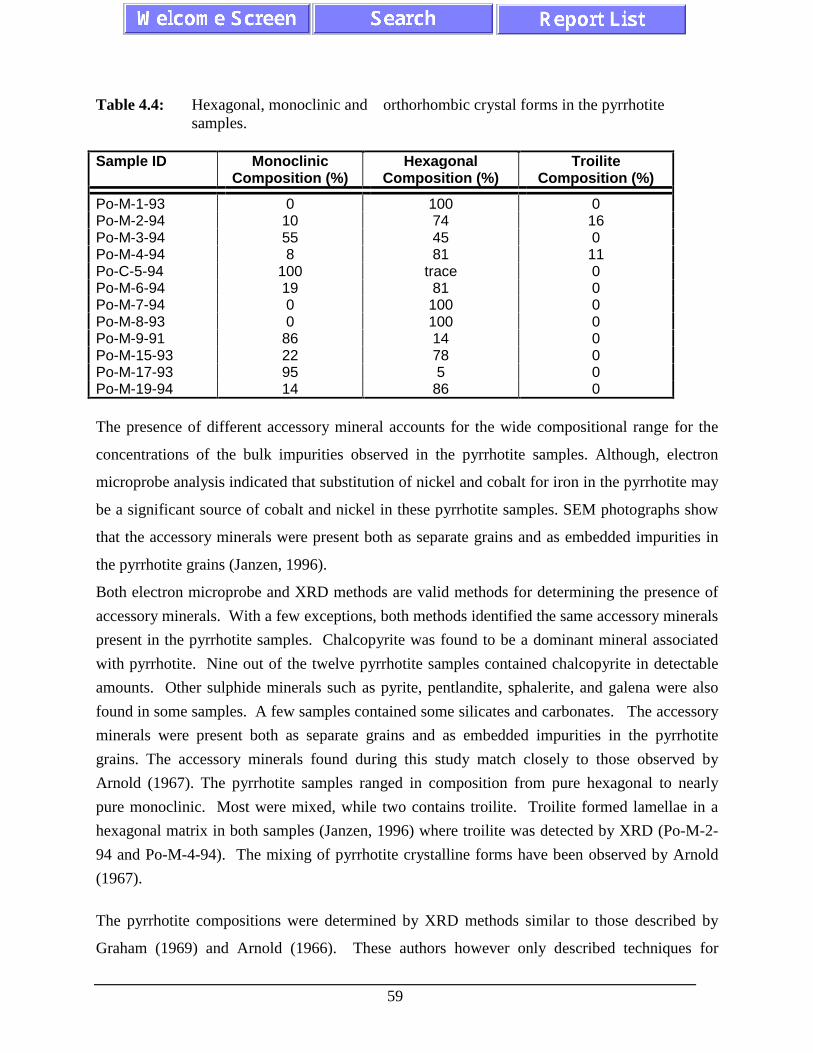
59
Table 4.4: Hexagonal, monoclinic and orthorhombic crystal forms in the pyrrhotitesamples.
Sample ID MonoclinicComposition (%)
HexagonalComposition (%)
TroiliteComposition (%)
Po-M-1-93 0 100 0Po-M-2-94 10 74 16Po-M-3-94 55 45 0Po-M-4-94 8 81 11Po-C-5-94 100 trace 0Po-M-6-94 19 81 0Po-M-7-94 0 100 0Po-M-8-93 0 100 0Po-M-9-91 86 14 0Po-M-15-93 22 78 0Po-M-17-93 95 5 0Po-M-19-94 14 86 0
The presence of different accessory mineral accounts for the wide compositional range for the
concentrations of the bulk impurities observed in the pyrrhotite samples. Although, electron
microprobe analysis indicated that substitution of nickel and cobalt for iron in the pyrrhotite may
be a significant source of cobalt and nickel in these pyrrhotite samples. SEM photographs show
that the accessory minerals were present both as separate grains and as embedded impurities in
the pyrrhotite grains (Janzen, 1996).
Both electron microprobe and XRD methods are valid methods for determining the presence of
accessory minerals. With a few exceptions, both methods identified the same accessory minerals
present in the pyrrhotite samples. Chalcopyrite was found to be a dominant mineral associated
with pyrrhotite. Nine out of the twelve pyrrhotite samples contained chalcopyrite in detectable
amounts. Other sulphide minerals such as pyrite, pentlandite, sphalerite, and galena were also
found in some samples. A few samples contained some silicates and carbonates. The accessory
minerals were present both as separate grains and as embedded impurities in the pyrrhotite
grains. The accessory minerals found during this study match closely to those observed by
Arnold (1967). The pyrrhotite samples ranged in composition from pure hexagonal to nearly
pure monoclinic. Most were mixed, while two contains troilite. Troilite formed lamellae in a
hexagonal matrix in both samples (Janzen, 1996) where troilite was detected by XRD (Po-M-2-
94 and Po-M-4-94). The mixing of pyrrhotite crystalline forms have been observed by Arnold
(1967).
The pyrrhotite compositions were determined by XRD methods similar to those described by
Graham (1969) and Arnold (1966). These authors however only described techniques for

60
separating monoclinic and hexagonal pyrrhotite, and did not discuss troilite composition.
Troilitic composition can be determined by examining the XRD peak of hexagonal pyrrhotite at
43.2°, 2θ(d-spacing=2.093 Å). Care must be taken though as other minerals have a peak at this
position (e.g. calcite, chromite). However, troilite confirmation can be obtained by examining
other peaks in a wider XRD scan (e.g. 3° to 90°, 2θ). The mineral composition of the samples
determined by powder diffraction was verified by electron microprobe analysis. Grains were
found in Po-M-2-94 and Po-M-4-94 that had a Fe to S atomic percent ratio very close to 1
confirming XRD data.
Inco Copper Cliff Pyrrhotite Tailings Concentrate
The particle size distribution of the Inco pyrrhotite tailings was determined for the estimation of
reactive surface area. The particle size distribution is shown in Figure 4.13. The particle size
distribution of the quartz sand (Barco 71) was provided by the manufacturer. The larger particle
size of quartz sand would significantly improve the drainage characteristics of the packed
column.
The quartz sand is coarser grained than the pyrrhotite tailings and was selected to provide a
higher hydraulic conductivity to enhance drainage. Because the columns were designed to be 1
m in length and gravity drained, it was desirable to allow drainage so that capillary forces did not
maintain near-saturated conditions which resulting low gas diffusion coefficients in the columns.
The chemical composition of the Inco's pyrrhotite concentrate was analyzed by the combination
of INAA and ICP [Activation Laboratories Ltd.]. The contents of major chemical elements in
the pyrrhotite concentrate are listed in Table 4-5.

61
Summary of Particle Size Distributions(Inco Copper Cliff Pyrrhotite Concentrate 07/12/95)
0.00
10.00
20.00
30.00
40.00
50.00
60.00
70.00
80.00
90.00
100.00
050100150200250300
Particle Size (um)
Per
cen
tag
e P
assi
ng
(%
)
SA002 SA003 SA004 SA005
SA006 SA007 Barco 71 Sand
Figure 4.13: Particle size distributions of pyrrhotite concentrate and quartz sand.
Table 4-5: Chemical composition of Inco Copper Cliff pyrrhotite concentrate.Fe S Co Cr Cu Mn Ni Pb Zn Ca Mg Al Na K
unit % % ppm
ppm
ppm
ppm
ppm
ppm
ppm
% % % % %
Po 52.9 22.8 200 260 680 432 9846 51 61 0.46 0.46 0.67 0.13 0.09
Mineralogical composition based on chemical composition of mineral outlined in Table 3.2, the
Inco pyrrhotite concentrate contained approximately 56 % pyrrhotite, 1.5 % pentlandite, 25 %
iron oxide and silicate minerals made up the rest. This yielded an average sulphur content of
23 %. The quartz sand used in the columns was reported to be essentially pure silicon oxide
(99.8 % SiO2) by the manufacturer.

62
FUNDAMENTAL KINETICS
Kinetic studies were conducted on specimen-grade pyrrhotite samples to assess the effects of
chemical and crystallographic differences on reaction rates. More detailed chemical and biologic
kinetic studies were then conducted on the pyrrhotite concentrate (Inco tailings) to provide
fundamental data on this material and to provide a basis for interpretation of the column studies
results.
Comparison of Kinetic Rates among Specimen Grade Samples
Non-Oxidative Dissolution of PyrrhotiteExperiments were performed to determine the contribution of non-oxidative dissolution to
ferrous iron release from pyrrhotite (Po) in acidic solutions. The experimental results for the
twelve pyrrhotite samples are summarized in Table 4.6. This table shows that all the pyrrhotite
samples seem to dissolve at roughly the same rate. The mean dissolution rate for the 12
pyrrhotite samples, as measured by Fe2+ release, was 5×10⁻¹⁰ (± 3×10⁻¹⁰) mol⋅m-2⋅s-1. The
non-oxidative dissolution rates ranged from 9.21×10⁻¹¹ to 9.20×10⁻¹⁰ mol⋅m-2⋅s-1 for the
twelve pyrrhotite samples (Janzen, 1996). The result of a typical non-oxidative dissolution
experiment is illustrated in Figure 4.14. As shown in Figure 4.14, the iron production rates were
constant during the experimental run conducted for over one week. Dissolved sulphate
concentrations were determined for a single non-oxidative run. It was found that while the
ferrous iron concentration increases linearly with time, sulphate values remain unchanged at
levels fluctuating around the detection limit (0.05 ppm). Sulphur from pyrrhotite therefore
appears to remain in a reduced state during dissolution as indicated by the lack of sulphate
production.

63
Table 4.6: Non-oxidative dissolution rates of the pyrrhotite samples.
0.00E+00
2.00E-05
4.00E-05
6.00E-05
8.00E-05
1.00E-04
1.20E-04
1.40E-04
0 1000 2000 3000 4000 5000 6000 7000 8000 9000
Time (min)
Fer
rous
Iro
n C
once
ntra
tion
[M
]
Figure 4.14: Non-oxidative dissolution at pH=2.75, 25°C for Po-M-7-94 measured inclosed stirred tank reactors.
Non-oxidative dissolution rates are variable and but are generally about 1-10% of the oxidative
rates. The non-oxidative dissolution rates observed in this study were comparable to the rates
Pyrrhotite Sample Pyrrhotite Dissolution(mol⋅m-2⋅s-1)
Po-M-1-93 8.24×10⁻¹⁰
Po-M-2-94 3.53×10⁻¹⁰
Po-M-3-94 4.72×10⁻¹⁰
Po-M-4-94 9.21×10⁻¹¹
Po-C-5-94 1.67×10⁻¹⁰
Po-M-6-94 6.11×10⁻¹⁰
Po-M-7-94 3.24×10⁻¹⁰
Po-M-8-94 9.32×10⁻¹⁰
Po-M-9-91 3.70×10⁻¹⁰
Po-M-15-93 9.20×10⁻¹⁰
Po-M-17-93 4.76×10⁻¹⁰
Po-M-19-94 4.75×10⁻¹⁰
Mean 5×10⁻¹⁰
Standard Deviation ofthe Mean
8.7×10⁻¹¹

64
observed by Tewari and Campbell (1976) for troilite dissolution in sulphuric acid (10-9 to 10-10
mol⋅m-2⋅s-1at pH = 2 to 5), however, they were considerably lower than the rates observed by
Nichol and Scott (1979) for pyrrhotite dissolution in perchloric acid (10-6 to 10-7 mol⋅m-2⋅s-1at
pH = 3). The reason for the differences in non-oxidative dissolution rates among the twelve
pyrrhotite samples at this time remains unknown. Attempts to correlate the reaction rates with
other variables were unsuccessful. No correlation between dissolution rate and crystal structure
or trace metal content was observed (Janzen, 1996). The differences in rates may be due to
surface features such as roughness and cleavages that are difficult to express quantitatively.
Pyrrhotite Oxidation by OxygenIn this study, oxygen was confirmed to be a significant oxidant in pyrrhotite oxidation. Table 4.2
lists the oxidation rates for the twelve pyrrhotite samples by oxygen for both Fe2+ and sulphate
release. Correlation coefficients for the linear regressions are also listed. The mean oxidation
rate based on ferrous iron release for the twelve pyrrhotite samples was 4×10⁻⁹ (± 6×10⁻¹⁰)
mol⋅m-2⋅s-1. The mean oxidation rate based on sulphate release for the twelve pyrrhotite samples
was 4×10⁻¹⁰ (± 6×10-11) mol⋅m-2⋅s-1 (Janzen, 1996). A sample run is illustrated in Figure
4.15. It is evident from the study that rates of oxidation based on iron release are more than one
order magnitude higher than the oxidation rates based on sulphate production. Table 4.7
illustrates not only differences in reaction rates but also the differences in correlation coefficients
between oxidation based on iron release and sulphate production. All correlation coefficients
between species concentrations and time for oxidation by oxygen based on ferrous iron release
were near 1, while the linear correlation coefficients for sulphate production ranged, with one
notable exception, from 0.810 to 0.999.

65
0
0.001
0.002
0.003
0.004
0.005
0.006
0.007
0.008
0.009
0.01
0 1000 2000 3000 4000 5000 6000
Time (min)
Fer
rous
Iro
n an
d Su
lpha
te C
once
ntra
tion
[M
]
Fe+2
Sulphate
Figure 4.15: Oxidation of pyrrhotite by oxygen at pH=2.75, 25°C for Po-M-15-93measured in internal split-flow airlift reactors.
Table 4.7: Rates of oxidation of the pyrrhotite samples by oxygen.Po Sample Oxidation rate
basedon iron release(mol⋅m-2⋅s-1)
R2 foriron
release
Oxidation rate basedon sulphate production
(mol⋅m-2⋅s-1)
R2 forsulphate
Production
Po-M-1-93 4.03×10⁻⁹ 0.997 2.70×10⁻¹¹ 0.999Po-M-2-94 4.73×10⁻⁹ 0.998 4.18×10⁻¹⁰ 0.810Po-M-3-94 9.76×10⁻⁹ 0.986 4.02×10⁻¹⁰ 0.956Po-M-4-94 3.53×10⁻⁹ 0.996 1.09×10⁻¹⁰ 0.850Po-C-5-94 1.58×10⁻⁹ 0.998 8.15×10⁻¹² 0.840Po-M-6-94 2.94×10⁻⁹ 0.996 4.15×10⁻¹¹ 0.848Po-M-7-94 4.22×10⁻⁹ 0.990 5.64×10⁻¹¹ 0.861Po-M-8-94 1.33×10⁻⁹ 0.999 1.38×10⁻¹¹ 0.975Po-M-9-91 1.60×10⁻⁹ 0.996 1.59×10⁻¹¹ 0.183
Po-M-15-93 3.07×10⁻⁹ 0.998 5.86×10⁻¹⁰ 0.998Po-M-17-93 1.65×10⁻⁹ 0.997 6.59×10⁻¹¹ 0.937Po-M-19-94 5.54×10⁻⁹ 0.996 4.31×10⁻¹⁰ 0.876
Mean 4×10⁻⁹ 2×10⁻¹⁰
StandardError of theMean
6×10⁻¹⁰ 6×10-11
In the case of pyrrhotite oxidation by oxygen, this study demonstrated that the rate of release of

66
ferrous iron does not equal the rate of production of sulphate as implied by the stoichometry of
the pyrrhotite oxidation reaction. Discrepancies between values for oxidation rates based on iron
release and sulphate production were also observed by Kwong (1995) who found that molecular
oxygen did not completely oxidize all the sulphide sulphur component in pyrrhotite to sulphate.
Based on ferrous iron release, only 37 % of the expected sulphur component were transformed to
sulphate. Partial oxidation of sulphide sulphur to sulphate and differences in ferrous and
sulphate ion release were anticipated. Numerous researchers have identified sulphur oxidation
products other than sulphate during pyrrhotite oxidation experiments (Steger 1982, Jambor 1986,
Plyusnin et al. 1990, Pratt et al. 1994 and others). Both elemental sulphur formation and sulphur
enrichment on the pyrrhotite surface (FeS2 formation) had been observed by other investigators.
No attempt was made to assess the surface products or sulphur species on the solid phase in this
study.
Pyrrhotite Oxidation by Ferric IronPublished reaction rate data for other sulphide minerals such as pyrite have shown that ferric iron
is a more reactive oxidizing agent than oxygen. Continuous-stirred closed reactors were used to
assess the oxidation rates by ferric iron. The standard oxidation rate tests at various pH values
and initial ferric iron concentrations are listed in Table 4.8. The mean oxidation rate for the
different conditions were: 3.5×10⁻⁸ mol Fe3+⋅m-2⋅s-1 (at pH = 2.75, with Fe3+int = 2×10⁻⁴ M);
3.1×10⁻⁸ mol Fe3+⋅m-2⋅s-1 (at pH = 2.50, with Fe3+int = 2×10⁻⁴ M), and 6.8×10⁻⁸ mol
Fe3+⋅m-2⋅s-1 (at pH = 2.50, with Fe3+int = 1×10⁻³ M) (Janzen, 1996). For comparison
purposes between pyrrhotite oxidation by oxygen and ferric iron, Janzen, (1996) demonstrated
that approximately 3 moles of ferric iron are required to oxidize 1 mole of pyrrhotite assuming
stoichometric pyrrhotite FeS.
Generally, the oxidation rate increased as the initial concentration of the oxidant, ferric ion
increased from 2×10⁻⁴ M to 1×10⁻³ M. Slight increases in the oxidation rates were also observed
with pH increases from pH = 2.5 tp pH = 2.75. Typical ferric iron oxidation data are shown in
Figure 4.16 and Figure 4.17. These figures illustrated, that initially, when the ferric ion
concentration is high, ferric ion consumption proceeds at a relatively constant rate. This is
consistent with a zero order dependence of the reaction rate on ferric ion. As the ferric ion
became exhausted, a distinct curvature in the plots becomes evident. Thus, the reaction rate

67
order changes continuously from order zero to order one. This change in order with reactant
(oxidant) concentration is characteristic of heterogeneous reactions involving solid surfaces and
is known as Langmuir-Hinshelwood mechanism. At high oxidant concentrations the surface is
saturated with the oxidant, hence, the reaction rate depends on the reacting surface only. Partial
saturation of the surface is expected to result in fractional order. The rate becomes first order at
very low limiting reactant concentrations. At low reactant concentrations, the surface is becomes
unsaturated with oxidant.
Table 4.8: Oxidation of the pyrrhotite samples by ferric iron.Po Sample Oxidation Rate by Ferric Iron (mol Fe3+⋅m-2⋅s-1)
Fe3+int=2×10⁻⁴[M]
pH=2.75, 25 °C
Fe3+int=2×10⁻⁴[M]
pH=2.50, 25 °C
Fe3+int=1×10⁻³[M]
pH=2.50, 25 °C
Po-M-1-93 3.51×10⁻⁸ 4.12×10⁻⁸ 5.34×10⁻⁸
Po-M-2-94 3.11×10⁻⁸ 2.71×10⁻⁸ 4.57×10⁻⁸
Po-M-3-94 3.04×10⁻⁸ 3.24×10⁻⁸ 8.53×10⁻⁸
Po-M-4-94 1.76×10⁻⁸ 1.69×10⁻⁸ 6.73×10⁻⁸
Po-C-5-94 1.96×10⁻⁸ 1.39×10⁻⁸ 2.46×10⁻⁸
Po-M-6-94 5.17×10⁻⁸ 4.03×10⁻⁸ 6.83×10⁻⁸
Po-M-7-94 4.06×10⁻⁸ 3.42×10⁻⁸ 3.96×10⁻⁸
Po-M-8-94 1.39×10⁻⁸ 1.32×10⁻⁸ 2.34×10⁻⁸
Po-M-9-93 2.83×10⁻⁸ 2.85×10⁻⁸ 4.16×10⁻⁸
Po-M-15-93 2.84×10⁻⁸ Not Analyzed 7.05×10⁻⁸
Po-M-17-93 5.49×10⁻⁸ 3.80×10⁻⁸ 1.08×10⁻⁷
Po-M-19-94 6.31×10⁻⁸ 5.26×10⁻⁸ 1.85×10⁻⁷
Mean 3.5×10⁻⁸ 3.1×10⁻⁸ 6.8×10⁻⁸
Standard Errorof the Mean
4.3×10⁻⁹ 3.5×10⁻⁹ 1.3×10⁻⁹
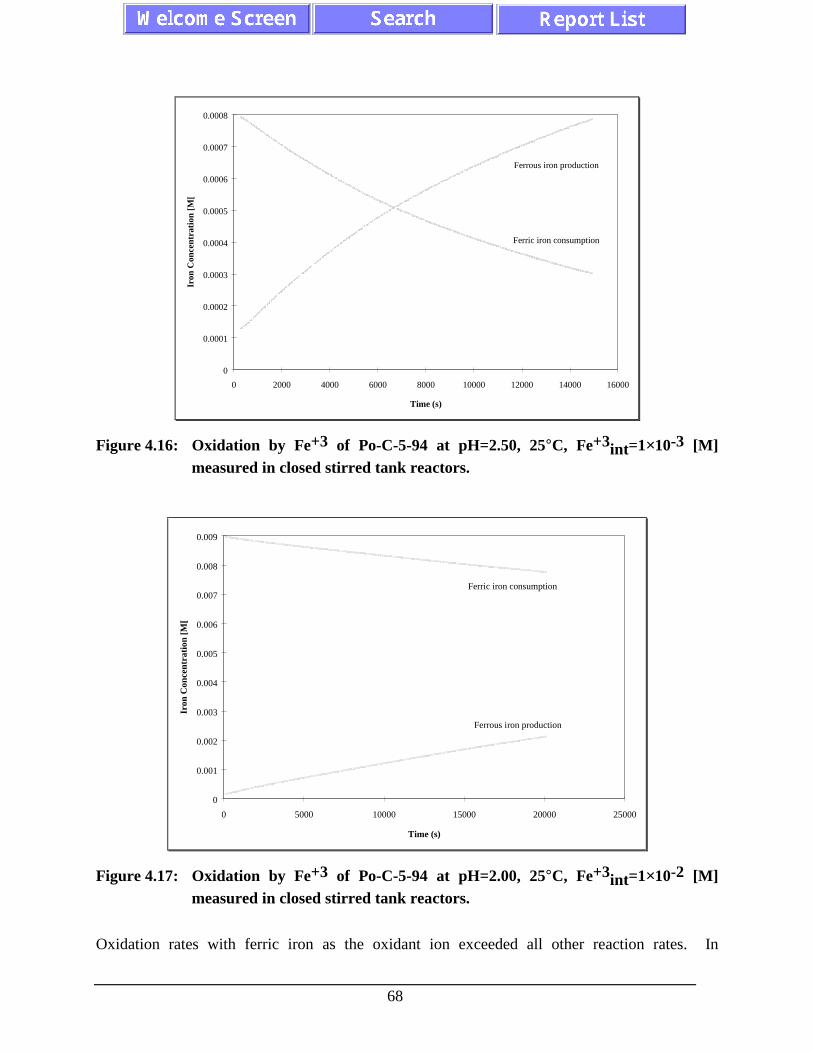
68
0
0.0001
0.0002
0.0003
0.0004
0.0005
0.0006
0.0007
0.0008
0 2000 4000 6000 8000 10000 12000 14000 16000
Time (s)
Iron
Con
cent
rati
on [
M[
Ferrous iron production
Ferric iron consumption
Figure 4.16: Oxidation by Fe+3 of Po-C-5-94 at pH=2.50, 25°C, Fe+3int=1×10⁻³ [M]measured in closed stirred tank reactors.
0
0.001
0.002
0.003
0.004
0.005
0.006
0.007
0.008
0.009
0 5000 10000 15000 20000 25000
Time (s)
Iron
Con
cent
rati
on [M
[
Ferric iron consumption
Ferrous iron production
Figure 4.17: Oxidation by Fe+3 of Po-C-5-94 at pH=2.00, 25°C, Fe+3int=1×10⁻² [M]measured in closed stirred tank reactors.
Oxidation rates with ferric iron as the oxidant ion exceeded all other reaction rates. In

69
accordance with the Langmuir-Hinshelwood adsorption mechanism for heterogeneous reactions,
there is an approximate half-order (i.e. fractional order) dependence on ferric iron concentration
at low levels (Figure 4.18). Numerous other plots using the same initial ferric concentration (2×
10-4 [M]) showed similar fractional order of dependence ranging from 0.45 to 0.66. Half order
dependence on ferric iron was also observed by McKibben and Barnes (1986) for pyrite
oxidation by ferric iron. However, as the initial ferric ion concentration increases, the half-order
dependence on concentration changes to a more complex rate dependence. At high initial ferric
iron concentrations (1×10⁻² [M]), zero-order dependence on ferric iron concentration was
observed, as shown by the constant slope of Fe3+ with time in Figure 4.19. Table 4.9 shows the
change in order with concentration for two pyrrhotite samples. The fractional order of
dependence generally implies a mechanism involving control by sorption or desorption
processes. This loss of half-order dependence and the change to a zero-order dependence
suggested that an adsorption mechanism apply to pyrrhotite oxidation by ferric iron.
y = 0.4865x - 5.5553
R2 = 0.9974
-9
-8.8
-8.6
-8.4
-8.2
-8
-7.8
-7.6
-7.4
-7.2
-7
-7 -6.5 -6 -5.5 -5 -4.5 -4 -3.5
Log Ferric Concentration
Log
Rat
e
Figure 4.18: The dependence of pyrrhotite oxidation on Fe+3 (Fe+3int=2×10⁻⁴ [M], 25°C,pH=2.75, Po-C-5-94).

70
Table 4.9: The rate order dependence of pyrrhotite oxidation on Fe3+ at pH=2.0.
Pyrrhotite Sample Fe3+int=2×10⁻⁴ [M] Fe3+int=1×10- 3[M] Fe3+int=1×10⁻² [M]
Po-M-2-94 .55 0.2 0
Po-C-5-94 0.6 0.4 0
An adsorption mechanism has been used to explain rate control phenomena for pyrite oxidation.
Williamson and Rimstidt (1994) suggested that a Freundlich non-site specific adsorption model
describe the pyrite oxidation by ferric iron. Alternatively, Smith et al. (1968) proposed that
pyrite oxidation by ferric iron follows a Hougen and Watson adsorption model. Similarly, Zheng
et al. (1986) proposed that pyrite oxidation by ferric sulphate can be represented by a dual-site
adsorption model. Initial rates were plotted for pyrrhotite samples that have three different
measured ferric iron concentrations and using a linearized Langmuir equation as suggested by
Nicholson et al. (1988) for oxidation of pyrite by oxygen.
R2 = 0.9987
0.0076
0.0078
0.008
0.0082
0.0084
0.0086
0.0088
0.009
0 5000 10000 15000 20000 25000
Time (s)
Fe+
3 [M
]
Figure 4.19: The dependence of pyrrhotite oxidation on Fe3+ (Fe3+int=1×10⁻² [M], 25°C,pH=1.99, Po-C-5-94).

71
C/R=1/(RmK) + C/Rm (4.2)
where R is the rate of oxidation, Rm is the rate based on maximum saturation of available
surface sites, K is the adsorption equilibrium constant for ferric iron on pyrrhotite, and C is the
concentration of ferric iron. Figure 4.20 suggests that the data is consistent with a Langmuir type
model. The calculated values, based on ferric iron consumption, gave Rm and K as 2.5×10⁻⁸
mol⋅m-2⋅s-1, and 972 M-1 respectively. Further measurements of rates at different ferric
concentrations would assist in this interpretation and confirm the adsorption mechanism.
y = 4E+07x + 41168R2 = 0.9998
0
50000
100000
150000
200000
250000
300000
350000
400000
450000
0.00E+00 1.00E-03 2.00E-03 3.00E-03 4.00E-03 5.00E-03 6.00E-03 7.00E-03 8.00E-03 9.00E-03 1.00E-02
C [M]
C/R
Figure 4.20: The linearized adsorption model (Po-M-2-94).
Pyrrhotite oxidation by ferric iron also exhibits incomplete transformation of the sulphide
sulphur to sulphate. A computer model (IRON SOLVER) was developed to quantify electron
transfer during the oxidation process. The use of an electron balance to assess reaction
completeness is a novel aspect of this study. Figure 4.21 illustrates different scenario’s for
pyrrhotite reaction completeness (for a simple zero order reaction). The quantity of ferrous iron
produced during pyrrhotite oxidation by ferric iron decreases with an increase in sulphate
production. Therefore indirectly from ferrous iron production, the extent of pyrrhotite oxidation

72
reaction completeness can be assessed. Based on the IRON SOLVER, pyrrhotite oxidation by
ferric iron was 18% complete with respect to sulphide sulphur oxidation to sulphate. Measured
sulphate values also indicated that not all the sulphide sulphur was oxidized to sulphate during
oxidation by ferric iron, although these values suggested even less transformation to sulphate
than values estimated by the computer model. Similar sulphate production rates were reported
by Kwong (1995), demonstrated that sulphate production lagged behind iron release. These
partial oxidation trends for pyrrhotite are consistent with the general oxidative mechanism
proposed by Loten and Wesker (1987) for mono-sulphide minerals. A single electron transfer
agent (e.g. Fe3+) should produce more elemental sulphur and less sulphate than a double
electron transfer agent (e.g. O2) since different hydrolysis reactions take place. Loten and
Wesker (1987) also proposed that a single electron transfer agent would react more rapidly than
a double electron transfer agent. This hypothesis is supported by the results of this study.
Although thiosalt production is possible, and products such thiosulphate and dithionate can form
as intermediate products as observed in many mill circuits, oxidation of these species is
relatively rapid in acidic solution and sulphate would be the major product in tailings.
Alternatively, thionates and thiosulphate are unstable under even mild acid conditions and
decompose to elemental sulphur and sulphate.

73
Time
Iro
n C
on
cen
trat
ion Fe+3 consumption
Fe+2 production
FeS SO4-2
FeS S0
FeS ?SO4-2 + ?S0
Figure 4.21: The use of ferrous iron production to predict pyrrhotite oxidationcompleteness.
Dependence of Oxidation Reactions on Controlling Factors
Dependence of Oxidation Reactions on pH
The dependence of the oxidation reactions on pH was assessed for oxidation reactions by ferric
iron. Generally, the rate appears to increase with increasing pH values for most samples, but the
results are not consistent for all pyrrhotite samples over the range of pH. Further research is
needed to explain these inconsistencies. Similar relationships between pH values and oxidation
rate have been shown during pyrite oxidation. Results of Williamson and Rimstidt (1994) and
McKibben and Barnes (1986) demonstrated that an increase in pH increases the rate of oxidation
of pyrite by ferric iron (in N2-purged system). The dependence of pyrrhotite reaction rate on pH
values suggests that H+ may be competing with Fe3+ (and possibly Fe2+) for adsorption sites on
the pyrrhotite surface.
Dependence of Oxidation Reactions on Temperature
Pyrrhotite oxidation rates by oxygen were measured at 25°, 35°, and 45°C. Activation energies
for oxidation by oxygen were calculated for 3 samples (Table 4.10) using Arrhenius type plots.
There are distinctive differences between the activation energies calculated from iron release
compared to the activation energy based on sulphate production. All activation energies have
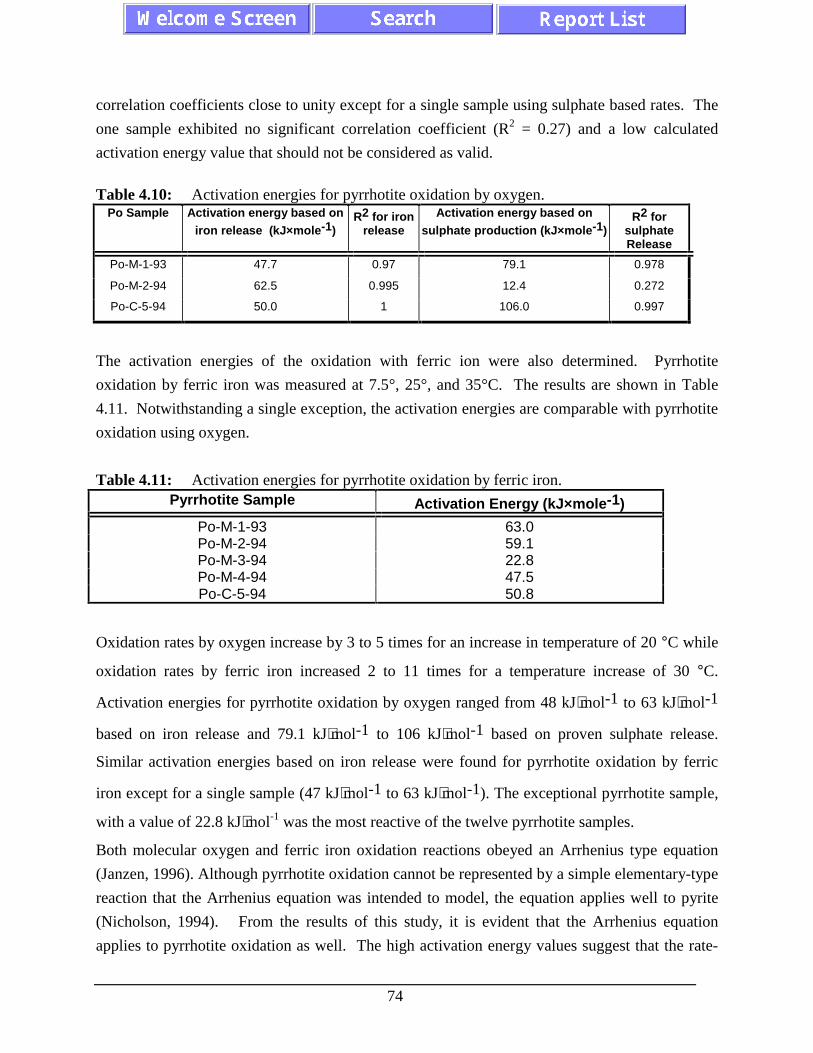
74
correlation coefficients close to unity except for a single sample using sulphate based rates. The
one sample exhibited no significant correlation coefficient (R2 = 0.27) and a low calculated
activation energy value that should not be considered as valid.
Table 4.10: Activation energies for pyrrhotite oxidation by oxygen.Po Sample Activation energy based on
iron release (kJ×mole -1)R2 for iron
releaseActivation energy based on
sulphate production (kJ×mole -1)R2 for
sulphateRelease
Po-M-1-93 47.7 0.97 79.1 0.978
Po-M-2-94 62.5 0.995 12.4 0.272
Po-C-5-94 50.0 1 106.0 0.997
The activation energies of the oxidation with ferric ion were also determined. Pyrrhotite
oxidation by ferric iron was measured at 7.5°, 25°, and 35°C. The results are shown in Table
4.11. Notwithstanding a single exception, the activation energies are comparable with pyrrhotite
oxidation using oxygen.
Table 4.11: Activation energies for pyrrhotite oxidation by ferric iron.Pyrrhotite Sample Activation Energy (kJ×mole -1)
Po-M-1-93 63.0Po-M-2-94 59.1Po-M-3-94 22.8Po-M-4-94 47.5Po-C-5-94 50.8
Oxidation rates by oxygen increase by 3 to 5 times for an increase in temperature of 20 °C while
oxidation rates by ferric iron increased 2 to 11 times for a temperature increase of 30 °C.
Activation energies for pyrrhotite oxidation by oxygen ranged from 48 kJ⋅mol-1 to 63 kJ⋅mol-1
based on iron release and 79.1 kJ⋅mol-1 to 106 kJ⋅mol-1 based on proven sulphate release.
Similar activation energies based on iron release were found for pyrrhotite oxidation by ferric
iron except for a single sample (47 kJ⋅mol-1 to 63 kJ⋅mol-1). The exceptional pyrrhotite sample,
with a value of 22.8 kJ⋅mol-1 was the most reactive of the twelve pyrrhotite samples.
Both molecular oxygen and ferric iron oxidation reactions obeyed an Arrhenius type equation
(Janzen, 1996). Although pyrrhotite oxidation cannot be represented by a simple elementary-type
reaction that the Arrhenius equation was intended to model, the equation applies well to pyrite
(Nicholson, 1994). From the results of this study, it is evident that the Arrhenius equation
applies to pyrrhotite oxidation as well. The high activation energy values suggest that the rate-
75
controlling step is a chemical reaction rather than control by transport processes (Nicholson,
1994). Reasons for the differences in activation energies between pyrrhotite oxidation rates by
oxygen based on iron and sulphate release are unknown at this time. However, it does suggest
that iron release and sulphate production are controlled by different mechanisms.
The activation energies for oxygen and ferric iron found in this study compare well with
published values. Nicholson and Scharer (1994) reported activation energies of 58.1 kJ⋅mol-1
and 52.4 kJ⋅mol-1 at pH=2 and pH=4 for oxygen oxidation of a pyrrhotite of unknown
composition and origin. Orlova et al. (1988) reported activation energies of 50.2 kJ⋅mol-1 and
46.2 kJ⋅mol-1 for oxidation of monoclinic and hexagonal pyrrhotite samples, respectively, by
oxygen.
Crystal Structure and Trace Metal Content
The findings from the 43° to 45°, 2θ XRD scans indicated that there is wide compositional range
between monoclinic and hexagonal pyrrhotite with two samples containing troilite among the
twelve pyrrhotite samples. The compositions range from pure hexagonal to nearly pure
monoclinic (Janzen, 1996). Numerous researchers have suggested that crystal structure of
pyrrhotite will affect oxidation rates (Orlova et al. 1988, Yakhontova et al. 1983). The results of
this study do not support this hypothesis. Figure 4.22 illustrates the effect of crystal structure on
pyrrhotite oxidation by oxygen. No apparent correlation is observed between pyrrhotite
oxidation by oxygen and crystal structure or between pyrrhotite oxidation by ferric iron and
crystal structure (Janzen, 1996). Using the Student “t” test, the regression of the oxidation rate
with respect to crystal structure was not statistically significant (see Figure 4.22).
Kwong (1993) observed visible corrosion of pyrrhotite samples of mostly monoclinic structure,
and concluded that samples with a relatively high trace metal content oxidized slower than
pyrrhotite with a lower trace metal content. Comparisons between oxidation rates and trace
metal contents were completed in this study to quantify this effect. Significant differences in
trace metal content amongst the 12 pyrrhotite samples exist (Janzen, 1996). As in the case of
crystal structure, trace metal content (individual metals and sum of trace metals) had no
statistically significant trend on the oxidation rate (Figure 4.23).
Orlova et al. (1988) argued that hexagonal pyrrhotite exhibited a significantly lower activation
energy than monoclinic pyrrhotite for oxidation by oxygen (46.2 kJ⋅mol-1 compared to 50.2 kJ⋅mol-1 respectively). However, the results of this study did not show any consistent trends of
activation energy related to pyrrhotite crystal form.
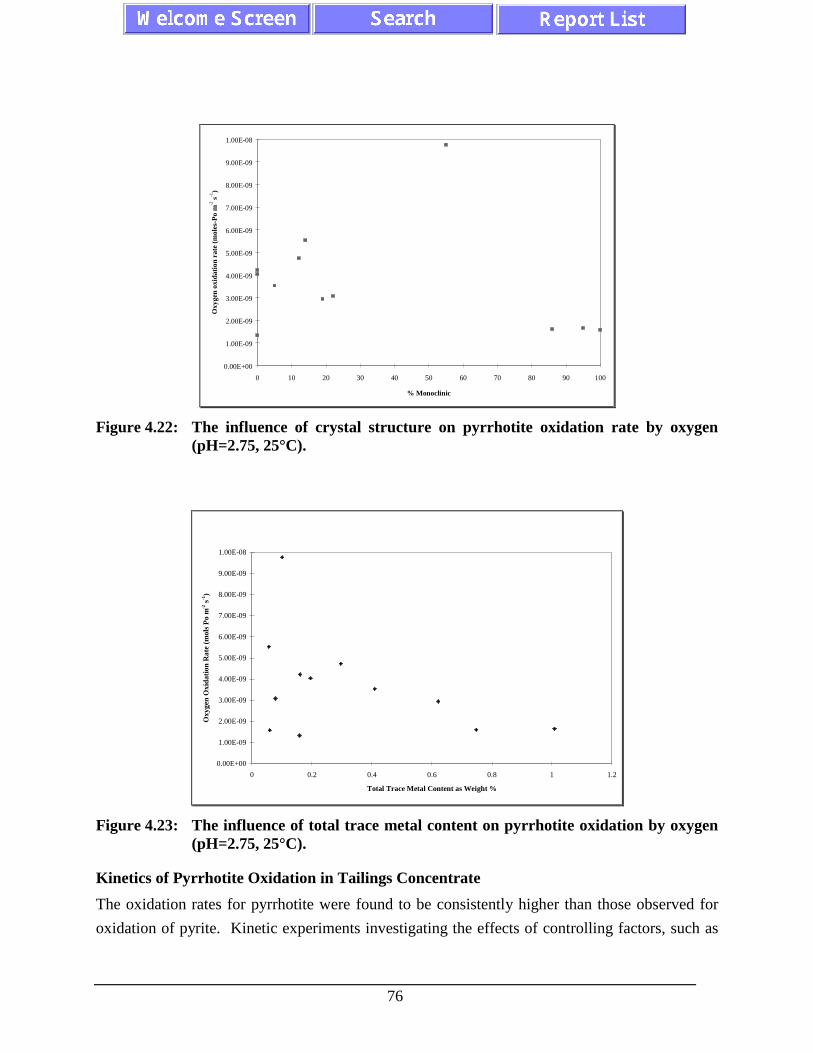
76
0.00E+00
1.00E-09
2.00E-09
3.00E-09
4.00E-09
5.00E-09
6.00E-09
7.00E-09
8.00E-09
9.00E-09
1.00E-08
0 10 20 30 40 50 60 70 80 90 100
% Monoclinic
Oxy
gen
oxid
atio
n ra
te (m
oles
-Po
m-2
s-1
)
Figure 4.22: The influence of crystal structure on pyrrhotite oxidation rate by oxygen(pH=2.75, 25°C).
0.00E+00
1.00E-09
2.00E-09
3.00E-09
4.00E-09
5.00E-09
6.00E-09
7.00E-09
8.00E-09
9.00E-09
1.00E-08
0 0.2 0.4 0.6 0.8 1 1.2
Total Trace Metal Content as Weight %
Oxy
gen
Oxi
dati
on R
ate
(mol
s P
o m
-2 s
-1)
Figure 4.23: The influence of total trace metal content on pyrrhotite oxidation by oxygen(pH=2.75, 25°C).
Kinetics of Pyrrhotite Oxidation in Tailings Concentrate
The oxidation rates for pyrrhotite were found to be consistently higher than those observed for
oxidation of pyrite. Kinetic experiments investigating the effects of controlling factors, such as

77
temperature, pH, addition of chelating agent and bacterial inoculation, for pyrrhotite oxidation by
oxygen has been performed. The effect of each controlling factor on the oxidation rate of
pyrrhotite is compared on the basis of sulphate, iron and nickel release rates. An example of the
sulphate release and iron release plots at 30 °C and various pH values are given in Figure 4.24
and Figure 4.25, respectively. The oxidation rates were calculated from the latter section of the
release data (after 1500 minutes), at which the sulphate loading rates tend to become constant.
The highest loading rate was observed at pH 4.
0.0E+00
1.0E-04
2.0E-04
3.0E-04
4.0E-04
5.0E-04
6.0E-04
0 1000 2000 3000 4000 5000 6000
Time (min)
Su
lph
ate
Lo
adin
gs
(mo
l)
pH 2 pH 3 pH 4 pH 6
Figure 4.24: Sulphate release under abiotic pyrrhotite oxidation at 30 °C and various pHvalues.
There was a significant difference in the effect of pH on the sulphate release compared to iron
release during oxidation of pyrrhotite. As shown in Figure 4.25, the maximum iron release rate
occurs at pH = 2.0. Ferric ion tends to precipitate as ferric hydroxide at pH values above 4.0,
hence, the apparent iron loading in the liquid phase decreases as the pH increases. In contrast,
sulphate is not expected to precipitate in the pH range of pH = 2.0 to pH = 6.0. Consequently,
the sulphate release data may be a better indicator of pyrrhotite oxidation than the iron release at
pH values above pH 3.0.
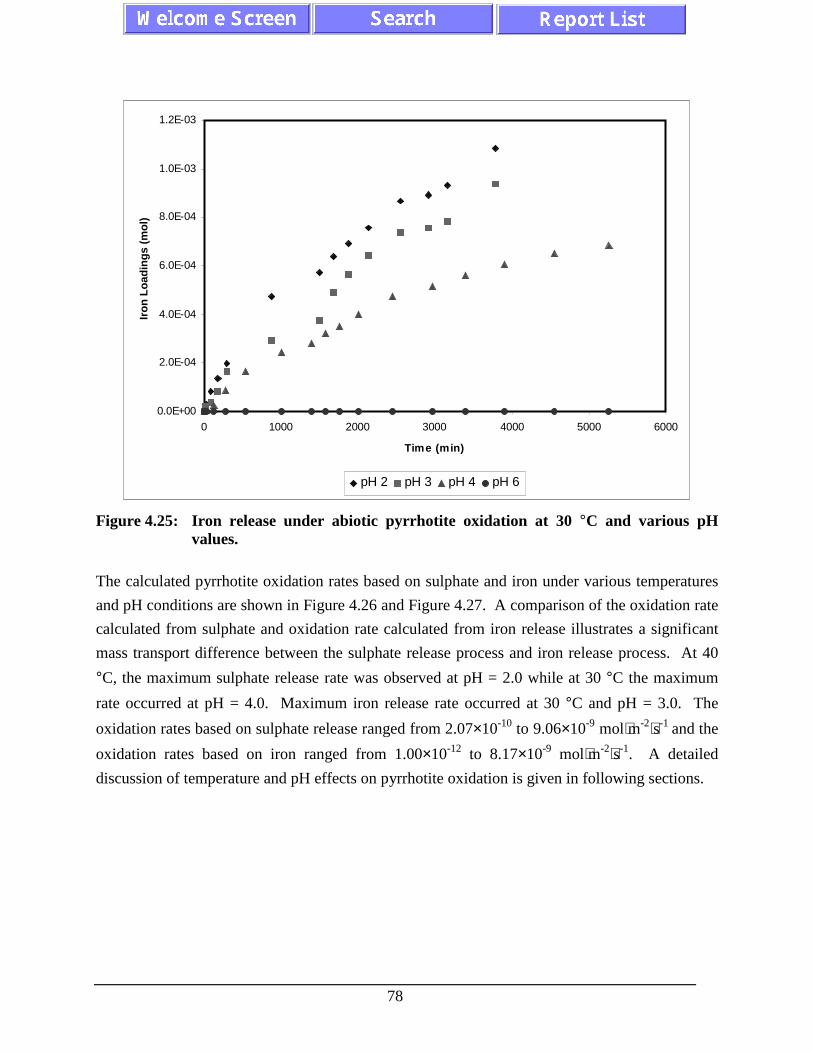
78
0.0E+00
2.0E-04
4.0E-04
6.0E-04
8.0E-04
1.0E-03
1.2E-03
0 1000 2000 3000 4000 5000 6000
Time (min)
Iro
n L
oad
ing
s (m
ol)
pH 2 pH 3 pH 4 pH 6
Figure 4.25: Iron release under abiotic pyrrhotite oxidation at 30 °C and various pHvalues.
The calculated pyrrhotite oxidation rates based on sulphate and iron under various temperatures
and pH conditions are shown in Figure 4.26 and Figure 4.27. A comparison of the oxidation rate
calculated from sulphate and oxidation rate calculated from iron release illustrates a significant
mass transport difference between the sulphate release process and iron release process. At 40
°C, the maximum sulphate release rate was observed at pH = 2.0 while at 30 °C the maximum
rate occurred at pH = 4.0. Maximum iron release rate occurred at 30 °C and pH = 3.0. The
oxidation rates based on sulphate release ranged from 2.07×10⁻¹⁰ to 9.06×10⁻⁹ mol⋅m-2⋅s-1 and the
oxidation rates based on iron ranged from 1.00×10⁻¹² to 8.17×10⁻⁹ mol⋅m-2⋅s-1. A detailed
discussion of temperature and pH effects on pyrrhotite oxidation is given in following sections.

79
2
3
4
6
10
20
30
40
0.00E+00
2.00E-09
4.00E-09
6.00E-09
8.00E-09
1.00E-08
Su
lph
ate
Pro
du
ctio
n R
ate
(mo
l/m2
s)
pH
Temperature (C)
Figure 4.26: The sulphate production rate for abiotic pyrrhotite oxidation by oxygen.

80
2
3
4
6
10
20
30
40
0.00E+00
2.00E-09
4.00E-09
6.00E-09
8.00E-09
1.00E-08
Iro
n P
rod
uct
ion
Rat
e(m
ol/m
2 s)
pH
Temperature (C)
Figure 4.27: The iron production rate for abiotic pyrrhotite oxidation by oxygen.
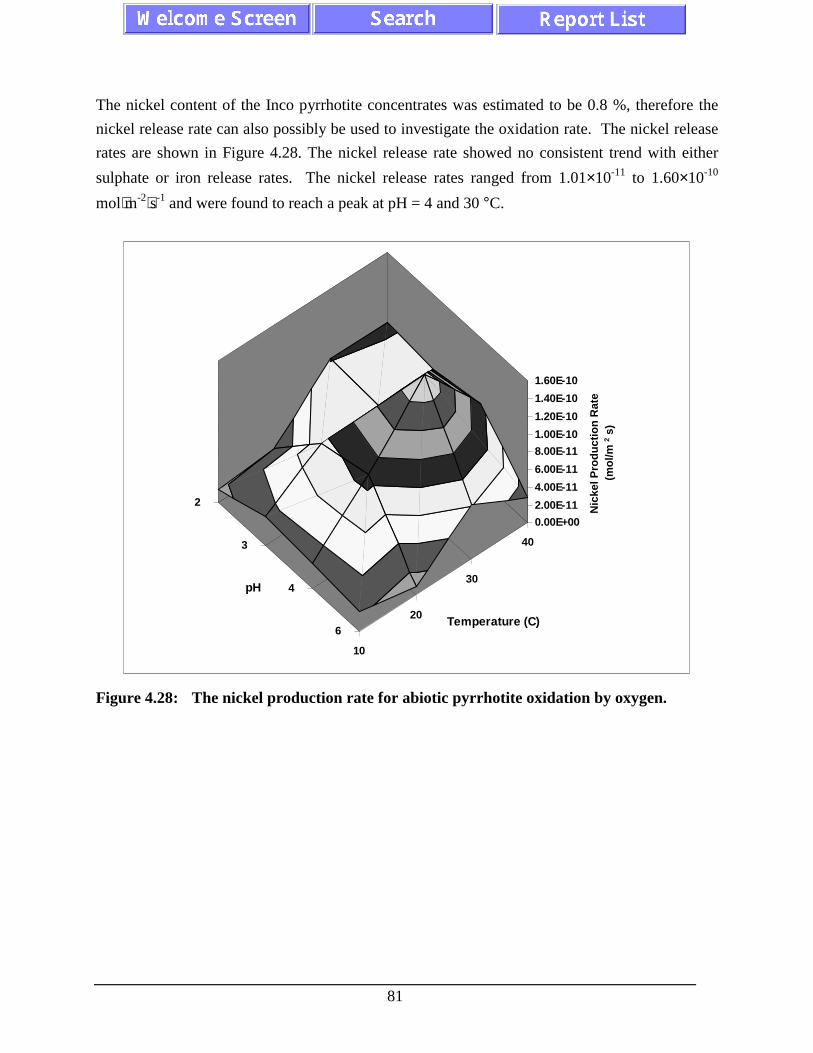
81
The nickel content of the Inco pyrrhotite concentrates was estimated to be 0.8 %, therefore the
nickel release rate can also possibly be used to investigate the oxidation rate. The nickel release
rates are shown in Figure 4.28. The nickel release rate showed no consistent trend with either
sulphate or iron release rates. The nickel release rates ranged from 1.01×10⁻¹¹ to 1.60×10⁻¹⁰
mol⋅m-2⋅s-1 and were found to reach a peak at pH = 4 and 30 °C.
2
3
4
6
10
20
30
40
0.00E+00
2.00E-11
4.00E-11
6.00E-11
8.00E-11
1.00E-10
1.20E-10
1.40E-10
1.60E-10
Nic
kel P
rod
uct
ion
Rat
e(m
ol/m
2 s)
pH
Temperature (C)
Figure 4.28: The nickel production rate for abiotic pyrrhotite oxidation by oxygen.

82
Effect of TemperatureThe effect of temperature on the pyrrhotite oxidation rate observed in Figure 4.26 was found to
be consistent with those observed for pyrite oxidation. The dependence of sulphate and iron
release rate on temperature under various pH conditions are shown in Figure 4.29 and Figure
4.30. The oxidation rates (based on sulphate release) were proportionally dependent on
temperature, i.e. higher oxidation rates at higher temperatures. However, the iron release rate
was found to be highest at 30 °C.
The Arrhenius plots for the abiotic oxidation of pyrrhotite (based on sulphate release) are shown
in Figure 4.31 and the activation energies at each pH are given in Table 4.12. The activation
energies obtained for pH = 2 and pH = 3 were 42.6 and 51.8 kJ⋅mol-1, respectively. Typically,
diffusion controlled reactions exhibit activation energies of 12 – 25 kJ⋅mol-1. Reactions
controlled by molecular collisions or chemical bond rearrangements usually have activation
energies in excess of 30 kJ⋅mol-1. The above activation energies indicate reaction processes as
the controlling mechanism and that the reactions are not diffusion controlled. The corresponding
activation energies for pH = 4 and pH = 6 were 14.5 and 23.7 kJ⋅mol-1, respectively, and are
consistent with mass transport or diffusion control. This change in controlling mechanism with
pH was not observed previously for pyrite oxidation.
Effect of pHThe pH seemed to affect the activation energies. Figure 4.29 and Figure 4.30 illustrated the
effect of pH on the sulphate and iron release rates under various temperatures. The overall trend
of oxidation rates (both sulphate and iron release) are inversely dependent on pH, i.e. higher
oxidation rates at lower pH values. The effect of pH on pyrrhotite oxidation rates was found to
converge to a more or less constant oxidation rate at pH = 6 at all temperature tested. At pH = 6,
the pyrrhotite oxidation rates appeared to be independent of temperature. It has been noted
above that there may be a change in reaction mechanism, hence temperature effects between pH
= 3 and pH = 4. At pH = 3 and below, the apparent reaction mechanism is controlled by
chemical processes, while at pH = 4 and above the rate controlling step appears to be diffusive
transport.

83
0.0E+00
1.0E-09
2.0E-09
3.0E-09
4.0E-09
5.0E-09
6.0E-09
7.0E-09
8.0E-09
9.0E-09
1.0E-08
1 2 3 4 5 6 7
pH
oxi
dat
ion
rat
e
10C 20C 30C 40C
Linear (10C) Linear (20C) Linear (30C) Linear (40C)
Figure 4.29: Effect of pH on abiotic pyrrhotite oxidation rates (based on sulphate release)at various temperatures.
0.0E+00
1.0E-09
2.0E-09
3.0E-09
4.0E-09
5.0E-09
6.0E-09
7.0E-09
8.0E-09
9.0E-09
1.0E-08
1 2 3 4 5 6 7
pH
oxi
dat
ion
rat
e
10C 20C 30C 40C
Linear (10C) Linear (20C) Linear (30C) Linear (40C)
Figure 4.30: Effect of pH on abiotic pyrrhotite oxidation rates (based on iron release) atvarious temperatures.

84
-23.0
-22.5
-22.0
-21.5
-21.0
-20.5
-20.0
-19.5
-19.0
-18.5
-18.0
0.00315 0.0032 0.00325 0.0033 0.00335 0.0034 0.00345 0.0035 0.00355
1 / T (1/K)
ln(o
xid
atio
n r
ate)
pH 2 pH 3 pH 4 pH 6
Linear (pH 2) Linear (pH 3) Linear (pH 4) Linear (pH 6)
Figure 4.31: Arrhenius plots of abiotic pyrrhotite oxidation rates (based on sulphate) withtemperature at various pH values.
Table 4.12: Activation energies for abiotic pyrrhotite oxidation (based on sulphate release).
ActivationEnergy
(J/mol⋅K)
pH
2 3 4 6
51851 42606 14509 23761
Effect of Chelating AgentThe addition of chelating agent, such as EDTA, was used to prevent the precipitation of ferric
hydroxide, which, in turn, was used to investigate the significance of transport limitation in the
kinetic experiments. The addition of EDTA did not have any significant effect on the iron
release for pH ≤ 4 (Figure 4.32). Despite the addition of EDTA, which could potentially act as a
leaching agent, there was no significant increase of iron release with EDTA compared to the
experiments without EDTA. Therefore, the lower rates and lower activation energy values at pH

85
values of 4 and 6 that implied mass transport control of the pyrrhotite oxidation (discussed in
previous sections) did not result from the precipitation of ferric hydroxide on the particle surface.
The combined results strongly indicate that the controlling mechanism at pH 2 and 3 is kinetic
oxidation, while at pH 4 and 6, the controlling mechanism is possibly due to dissolution reaction
at pyrrhotite particles.
The nickel release rates in Figure 4.33 also showed no significant differences between tests withor without EDTA.
Effect of Bacterial InoculationThe presence of bacteria, such as Thiobacillus ferrooxidans, is known to accelerate the oxidation
of sulphide minerals. The effects of bacteria on pyrrhotite oxidation rates are shown in Figure
4.34 and Figure 4.35 based sulphate release and iron release. The sulphate release rates with
bacteria were significantly higher than those that were not inoculated. The maximum biological
rate at 40 °C was observed at pH 4 (3.53×10⁻⁸ mol⋅m-2⋅s-1), and was approximately 10 times
higher than the abiotic oxidation rate (2.92×10⁻⁹ mol⋅m-2⋅s-1).
Despite significant increase of sulphate release rates, however, the inoculation with bacteria had
no effect on the iron release rates during pyrrhotite oxidation (Figure 4.34). Therefore, the
importance of bacteria during pyrrhotite oxidation appears to be related to the sulphide
metabolism. Even ignoring the results at pH = 6, for which bacteria are not expected to be
important and ferric iron should precipitate, it is evident that bacterial catalysis is different for
the sulphate and iron components of the oxidation reaction. These results suggest that sulphate
release rates may increase by a factor of 10 as a result of bacterial involvement.

86
0 .0 0 E +0 0
1 .0 0 E -0 9
2 .0 0 E -0 9
3 .0 0 E -0 9
4 .0 0 E -0 9
5 .0 0 E -0 9
6 .0 0 E -0 9
7 .0 0 E -0 9
8 .0 0 E -0 9
9 .0 0 E -0 9
1 2 3 4 5 6 7
pH
Oxi
dat
ion
Rat
e (m
ol /
m2
s)
with EDTA without EDTA
Figure 4.32: Effect of chelating agent (EDTA) on abiotic pyrrhotite oxidation rate (basedon iron release).
0 .0 0 E +0 0
5 .0 0 E -1 1
1 .0 0 E -1 0
1 .5 0 E -1 0
2 .0 0 E -1 0
2 .5 0 E -1 0
3 .0 0 E -1 0
1 2 3 4 5 6 7
pH
Oxi
dat
ion
Rat
e (m
ol /
m2
s)
with EDTA without EDTA
Figure 4.33: Effect of chelating agent (EDTA) on abiotic pyrrhotite oxidation rate (basedon nickel release).

87
0 .0 0 E +0 0
5 .0 0 E -0 9
1 .0 0 E -0 8
1 .5 0 E -0 8
2 .0 0 E -0 8
2 .5 0 E -0 8
3 .0 0 E -0 8
3 .5 0 E -0 8
4 .0 0 E -0 8
1 2 3 4 5 6 7
pH
Oxi
dat
ion
Rat
e (m
ol /
m2
s)
with bacteria without bacteria
Figure 4.34: Effect of bacterial inoculation on pyrrhotite oxidation rate (based onsulphate release).
0 .0 0 E +0 0
5 .0 0 E -1 0
1 .0 0 E -0 9
1 .5 0 E -0 9
2 .0 0 E -0 9
2 .5 0 E -0 9
3 .0 0 E -0 9
3 .5 0 E -0 9
4 .0 0 E -0 9
4 .5 0 E -0 9
1 2 3 4 5 6 7
pH
Oxi
dat
ion
Rat
e (m
ol /
m2
s)
with bacteria without bacteria
Figure 4.35: Effect of bacterial inoculation on pyrrhotite oxidation rate (based on ironrelease).
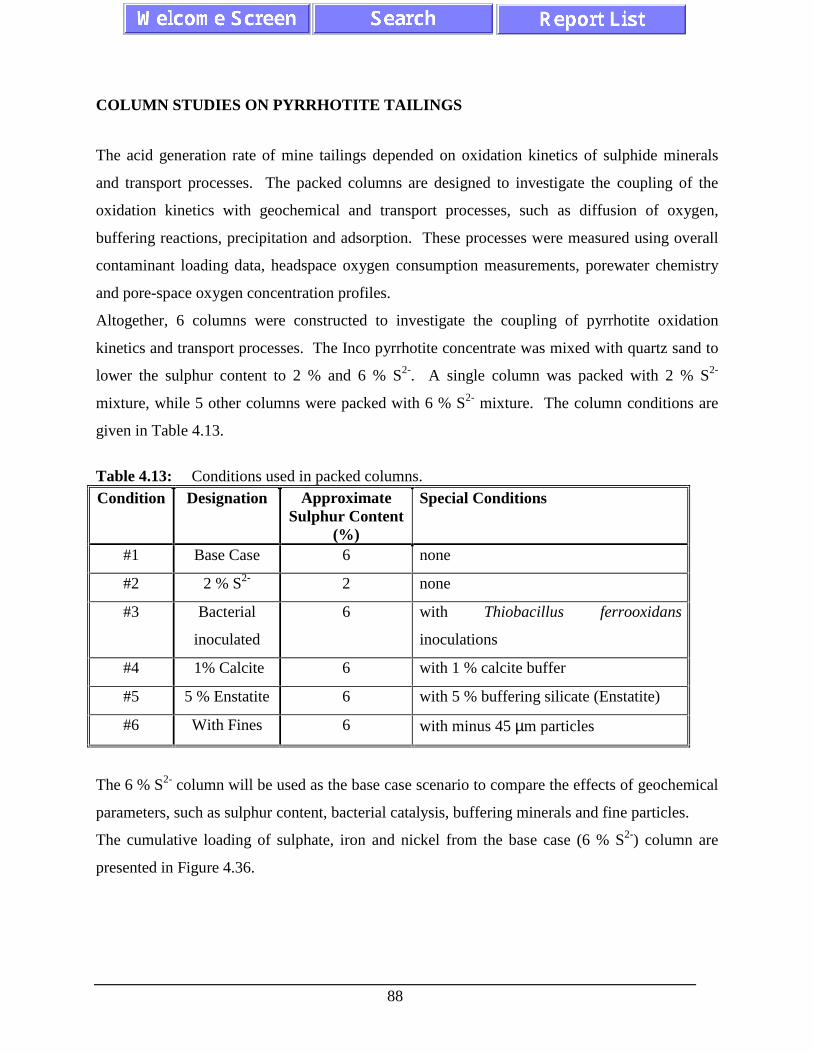
88
COLUMN STUDIES ON PYRRHOTITE TAILINGS
The acid generation rate of mine tailings depended on oxidation kinetics of sulphide minerals
and transport processes. The packed columns are designed to investigate the coupling of the
oxidation kinetics with geochemical and transport processes, such as diffusion of oxygen,
buffering reactions, precipitation and adsorption. These processes were measured using overall
contaminant loading data, headspace oxygen consumption measurements, porewater chemistry
and pore-space oxygen concentration profiles.
Altogether, 6 columns were constructed to investigate the coupling of pyrrhotite oxidation
kinetics and transport processes. The Inco pyrrhotite concentrate was mixed with quartz sand to
lower the sulphur content to 2 % and 6 % S2-. A single column was packed with 2 % S2-
mixture, while 5 other columns were packed with 6 % S2- mixture. The column conditions are
given in Table 4.13.
Table 4.13: Conditions used in packed columns.Condition Designation Approximate
Sulphur Content(%)
Special Conditions
#1 Base Case 6 none
#2 2 % S2- 2 none
#3 Bacterial
inoculated
6 with Thiobacillus ferrooxidans
inoculations
#4 1% Calcite 6 with 1 % calcite buffer
#5 5 % Enstatite 6 with 5 % buffering silicate (Enstatite)
#6 With Fines 6 with minus 45 µm particles
The 6 % S2- column will be used as the base case scenario to compare the effects of geochemical
parameters, such as sulphur content, bacterial catalysis, buffering minerals and fine particles.
The cumulative loading of sulphate, iron and nickel from the base case (6 % S2-) column are
presented in Figure 4.36.

89
0.0E+00
5.0E-02
1.0E-01
1.5E-01
2.0E-01
2.5E-01
0 50 100 150 200 250
Time (day)
Lo
adin
g (
mo
le)
Sulphate Iron Nickel
Figure 4.36: The sulphate, iron and nickel production loading in base case column.
The sulphate loading data above show the cumulative sulphate generation for a period of
approximately 220 days. The corresponding sulphate generation rate ranged from 1.90×10⁻⁴ to
2.48×10⁻³ mol⋅day-1. The iron production rate ranged from 1.63×10⁻⁴ to 2.61×10⁻³ mol⋅day-1.
The nickel loading rates were significantly lower than those of sulphate and iron, and ranged
from 1.59×10⁻⁶ to 2.82×10⁻⁴ mol⋅day-1.
The ratios of iron to sulphate production rate are shown in Figure 4.37. The average iron to
sulphate ratio of 0.899 is slightly lower than the stoichiometric ratio of iron to sulphide in
pyrrhotite. A ratio of iron to sulphate production rate below unity indicates accumulation of iron
(in form of ferric hydroxide) in the column. The corresponding ratio between nickel production
rate and sulphate production rate decreased from 0.11 at start to 0.01. The time profile of the
nickel to sulphate production ratio is given in Figure 4.38. The nickel to sulphate ratios
combined with loading data of nickel indicate the nickel release was not proportional to the
pyrrhotite oxidation rate over the first 50 days.

90
0.00
0.20
0.40
0.60
0.80
1.00
1.20
1.40
0 50 100 150 200 250
Time (day)
Iro
n /
Su
lph
ate
Rat
io
Figure 4.37: Iron to sulphate production ratio in the column.
0.00
0.02
0.04
0.06
0.08
0.10
0.12
0.14
0 50 100 150 200 250
Time (day)
Nic
kel /
Su
lph
ate
Rat
io
Figure 4.38: Nickel to sulphate production ratio in the column.
Based on the nickel production rate for Inco pyrrhotite (0.8 % nickel content by mass), the

91
theoretical ratio of the nickel production rate to sulphate production rate is 0.014. The observed
ratio of nickel to sulphate production rate at the start was significantly higher than the theoretical
ratio. The higher nickel production rate at the early stage was likely as the result of pentlandite
oxidation (approximately 0.25 % by mass in the base case column). As pentlandite was depleted
from the reactive surface, the nickel production rate decreased. After 50 days, the nickel to
sulphate production ratios varied close to the theoretical ratio related to the nickel content of the
pyrrhotite. Co-precipitation and adsorption of nickel to ferric hydroxide may have contributed to
the lower nickel release rates.
The oxygen consumption rate data yielded results comparable to those observed from the loading
rates. A plot of the oxygen consumption rates with time for the base case is shown in Figure
4.39. The oxygen consumption rates in the column decreased with time, from an initial high of
1.52×10⁻² to low of 4.42×10⁻³ mol⋅day-1, which indicated a possible switch from kinetic to mass
transport control. As pyrrhotite content depleted at the surface layer of the column, the reactive
layer migrated deeper into the column. Therefore, oxygen diffusion became more significant in
comparison to oxidation kinetics of pyrrhotite. The diffusion effect may also be enhanced with
precipitation of ferric hydroxide in the column, which can reduce the effective diffusion
coefficient of oxygen through the tailings or at the surface of the pyrrhotite particles.
The corresponding oxygen consumption flux obtained from the packed column ranged from
1218 initially to 354 mol O2⋅m-2⋅yr-1. These data are in the same range as those observed by
Tibble and Nicholson (1997) in field measurements on pyrrhotite tailings using similar
methodology. The field-measured oxygen consumption flux ranged 200 to 700 mol O2⋅m-2⋅yr-1
in tailings containing 15 % S as pyrrhotite. This demonstrated that the column experiment can
provide representative data for site characterization and the oxygen consumption technique is
suitable for both packed column and field measurements.
The theoretical ratios between the oxygen consumption rate and sulphate production rate are 2
for pyrrhotite oxidation to Fe2+ and SO42- and 2.25 for conversion to Fe3+ and SO4
2-. The
experimental ratio of oxygen consumption rate and sulphate production rate ranged from 33 to
2.64. The high ratios between oxygen consumption and sulphate production may be the result of
partial oxidation of sulphide S2- to elemental sulphur S0 or conversion of pyrrhotite to amorphous
FeS2 as suggested by other studies.

92
0.0E+00
2.0E-03
4.0E-03
6.0E-03
8.0E-03
1.0E-02
1.2E-02
1.4E-02
1.6E-02
0 50 100 150 200 250
Time (day)
Oxy
gen
Co
nsu
mp
tio
n R
ate
(mo
l O2/
day
)
Figure 4.39: The oxygen consumption rate in column.
The concentration profiles for the base case column did not change significantly during 220
days. Examples of the concentration profiles are given in Figure 4.40. Visual observation of the
column suggested hardpan formation in the upper layer if the column, which could the also seen
from the iron concentration profile. The significant reduction of nickel concentration between the
oxidation zone and the lower layer of the column indicated precipitation or adsorption of nickel
from the porewater. The measured porewater concentration of sulphate reached levels above
10000 mg⋅L-1. The sulphate concentration profile demonstrated no significant secondary
reaction, such as gypsum precipitation, occurring in the column with respect to sulphate. The
oxygen was consumed within the top 40 cm. Therefore, the zone of oxidation was restricted to
the top 40 cm in the column during the 200 days experiment.

93
pH Profile - 6 % S2-
(126 days)
0
10
20
30
40
50
60
70
80
90
100
2 3 4 5 6 7
pH
Co
lum
n H
eig
ht
fro
m B
ott
om
(cm
)
Iron Profile - 6 % S2-
(126 days)
010
2030
4050
6070
8090
100
0 5000
Iron Concentration (mg/L)
Co
lum
n H
eig
ht
fro
m B
ott
om
(cm
)
Nickel Profile - 6 % S2-
(126 days)
010
2030
4050
6070
8090
100
0 500
Nickel Concentration (mg/L)
Co
lum
n H
eig
ht
fro
m B
ott
om
(cm
)
(a) (b) (c)
Sulphate Profile - 6 % S2-
(126 days)
010
2030
4050
6070
8090
100
0 10000 20000
Sulphate Concentration (mg/L)
Co
lum
n H
eig
ht
fro
m B
ott
om
(cm
)
Oxygen Profile - 6 % S2-
(123 days)
0
10
20
30
40
50
60
70
80
90
100
0.00 0.20 0.40 0.60 0.80 1.00
N o r ma l i z e d O x y ge n C o n c e n t r a t i o n
(e)
Figure 4.40: Concentration profile in the base case column after 126 days: (a) pH profile,(b) iron concentration profile, (c) nickel concentration profile, (d) sulphateconcentration profile, and (d) normalized oxygen gas concentration profile.

94
Effect of Sulphur Content
The sulphate generation rate in a tailings mass is expected to be proportional to the sulphur
content in the absence of other reaction controls, such as gas diffusion. The sulphate production
rate obtained from the 2 % S2- column ranged from 1.63×10⁻³ to 6.14×10⁻⁴ mol⋅day-1. These
production rates were within the range of those obtained for the base case column. Figure 4.41
and 4.42 provide a comparison of sulphate and iron loading between the 2 % S2- and base case
columns. Production rate is the first derivative (i.e. the local slope) of the loading data. The
average iron to sulphate production ratio in the 2 % S2- column was 0.955. The higher iron to
sulphate ratio indicated less iron accumulated as ferric hydroxide in the 2 % S2- column.
0.0E+00
5.0E-02
1.0E-01
1.5E-01
2.0E-01
2.5E-01
0 50 100 150 200 250
Time (day)
Lo
adin
g (
mo
le)
Base Case 2 % Column
Figure 4.41: Comparison of sulphate loading between the base case and the 2 % S2-
columns.

95
0.0E+00
5.0E-02
1.0E-01
1.5E-01
2.0E-01
2.5E-01
0 50 100 150 200 250
Time (day)
Lo
adin
g (
mo
le)
Base Case 2 % Column
Figure 4.42: Comparison of iron loading between the base case and the 2 % S2- columns.
The sulphate and iron generation rates in the 2 % S2- column (6.1×10⁻⁴ to 1.6×10⁻³mol⋅day-1)
were comparable to those of the base case column (1.9×10⁻⁴ to 2.3×10⁻³mol⋅day-1). The lower
sulphide content in the 2 % S2- column allowed deeper oxygen penetration and resulted in a
deeper oxidation zone. The 2 % S2- column also retained less water under gravity because it
contained less fine-grained tailings concentrate and there would be expected to have a higher gas
diffusion coefficient. The oxygen concentration profile for 2 % S2- column is given in Figure
4.43. The profile demonstrated that oxygen penetrated the entire column, which indicated the
importance of mass transport control in tailings with higher gas diffusion coefficients (better
drained) or with a lower sulphide content.

96
Oxygen Profile - 2 % S2-
(138 days)
0
10
20
30
40
50
60
70
80
90
100
0.00 0.20 0.40 0.60 0.80 1.00
Nor mal i z ed Ox ygen Concent r at i on
Figure 4.43: Oxygen concentration profile in the 2 % S2- column after 138 days.
Despite the high oxygen penetration in the 2 % S2- column, the lower sulphide content resulted in
significantly lower oxygen consumption initially. The oxygen consumption profiles are shown
in Figure 4.44. The rates of oxygen consumption declined continually in the base case column.
In contrast, the oxygen consumption rates were lower, but remained relatively constant in the 2
% S2- column. This implies, that at the lower sulphide content pyrrhotite oxidation remained
under kinetic control, while at higher sulphide concentrations a gradual transition from kinetic
control to diffusive control occurred. The stoichiometric molar ratio for oxygen consumption
and sulphate production for pyrrhotite is approximately 2.5. The experimentally observed ratio
ranged from 1.51 to 6.53. Any ratio greater than 2.5 implies incomplete sulphide-sulphur
oxidation, while a ratio less than 2.5 implies the presence and complete oxidation of elemental
sulphur as well as the complete oxidation of pyrrhotite. It is noteworthy that the theoretical
lower limit of the ratio of oxygen consumption to sulphate production is 1.5 in a pyrrhotite-
sulphur environment. The ratio between oxygen consumption rate and sulphate production rate
ranged from 6.53 to 1.51. The lower oxygen consumption / sulphate production ratio and
comparable sulphate production rate with the base case indicated higher percentage conversion
of sulphide (S2-) to sulphate (SO42-).
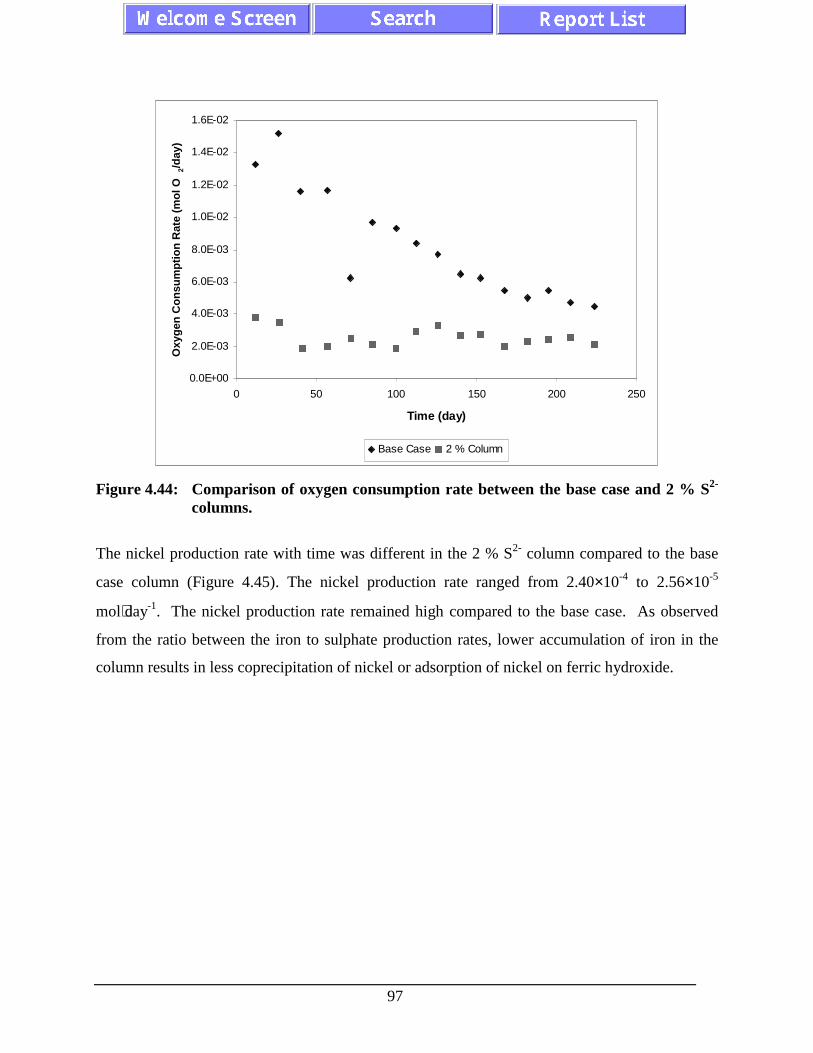
97
0.0E+00
2.0E-03
4.0E-03
6.0E-03
8.0E-03
1.0E-02
1.2E-02
1.4E-02
1.6E-02
0 50 100 150 200 250
Time (day)
Oxy
gen
Co
nsu
mp
tio
n R
ate
(mo
l O2/
day
)
Base Case 2 % Column
Figure 4.44: Comparison of oxygen consumption rate between the base case and 2 % S2-
columns.
The nickel production rate with time was different in the 2 % S2- column compared to the base
case column (Figure 4.45). The nickel production rate ranged from 2.40×10⁻⁴ to 2.56×10⁻⁵
mol⋅day-1. The nickel production rate remained high compared to the base case. As observed
from the ratio between the iron to sulphate production rates, lower accumulation of iron in the
column results in less coprecipitation of nickel or adsorption of nickel on ferric hydroxide.

98
0.0E+00
5.0E-03
1.0E-02
1.5E-02
2.0E-02
2.5E-02
0 50 100 150 200 250
Time (day)
Lo
adin
g (
mo
le)
Base Case 2 % Column
Figure 4.45: Comparison of nickel loading between the base case and the 2 % S2- columns.
Effect of Bacterial Inoculation
Bacteria such as Thiobacillus ferrooxidans, can significantly enhance the sulphide S2- conversion
to SO42-. Sulphate loading in the base case column is compared with the inoculated column in
Figure 4.46. There were no significant differences between the sulphate production rate between
the bacterial inoculated column and the base case. Similar observation was also true for the iron
production rate. The nearly exponential increases of sulphate loading followed by a constant rate
suggest the development of steady state bacterial population. The definite inflection point after
120 days and the essentially identical sulphate production rates suggest a possible cross
contamination of the base case column with bacteria. The oxygen consumption rate for the
bacterial inoculated column was found to be the essentially the same as the base case (Figure
4.47). The continuous decline of the oxygen consumption rate in both the base case and the
inoculated column indicates the increasing importance of mass transfer (i.e. diffusion) as time
progresses.
The average ratio of the iron to sulphate production rate was 0.789. The lower iron to sulphate
ratio indicated bacterial catalysis of Fe2+ to Fe3+ reaction and higher ferric hydroxide
accumulation in the bacterial inoculated column. The ratios between oxygen consumption to
sulphate production were in the same range as those observed in the base case column.
Concentration profiles in the inoculated column were similar to those of the base case. The

99
sulphate concentration in the oxidation layer reached a level of 12000 mg⋅L-1 (see Appendix E).
Similarity of concentration profiles between the bacterial inoculated column and the base case
column confirmed mass transfer of oxygen as the controlling factor.
The nickel production rates in the inoculated column were significantly lower than those in the
base case column (Figure 4.48). The higher accumulation of iron in the form of ferric hydroxide
likely retained the nickel in the column through coprecipitation and adsorption processes.
0.0E+00
5.0E-02
1.0E-01
1.5E-01
2.0E-01
2.5E-01
3.0E-01
0 50 100 150 200 250
Time (day)
Lo
adin
g (
mo
le)
Base Case Inoculated
Figure 4.46: Comparison of sulphate loading between the base case and the inoculatedcolumns.

100
0.0E+00
2.0E-03
4.0E-03
6.0E-03
8.0E-03
1.0E-02
1.2E-02
1.4E-02
1.6E-02
0 50 100 150 200 250
Time (day)
Oxy
gen
Co
nsu
mp
tio
n R
ate
(mo
l O2/
day
)
Base Case Inoculated
Figure 4.47: Comparison of oxygen consumption rate between the base case and theinoculated columns.
0.0E+00
5.0E-02
1.0E-01
1.5E-01
2.0E-01
2.5E-01
0 50 100 150 200 250
Time (day)
Lo
adin
g (
mo
le)
Base Case Inoculated
Figure 4.48: Comparison of nickel loading between the base case and the inoculatedcolumns.

101
Effect of Neutralizing Minerals
The addition of neutralizing minerals gives rise to higher pH values in the packed column
compared to base case column. Calcite and enstatite were added to two packed columns to
investigate the effect of these minerals on the contaminant release. The presence of buffering
minerals had little effect on the sulphate production rate and the oxygen consumption rate. The
time profiles of sulphate production rate and oxygen consumption rate are shown in Figure 4.49
and Figure 4.50, respectively. The measured ratios between oxygen consumption and sulphate
production for both calcite and enstatite columns are in the same range as those observed for the
base case column. Oxidation kinetics of pyrrhotite is inversely dependent on pH, therefore
higher pH should result in lower oxidation rate. The approximately identical sulphate production
rates suggest that kinetic control was not significant in the packed column. The general trends of
the sulphate and oxygen concentration profiles in the buffered columns were similar to those of
the base case column. The lack of inflection point in the 5 % enstatite and the 1 % calcite
column indicates no effects from bacterial cross-contamination or from bacterial effects.
However, the highest sulphate concentration reached in the calcite buffering column was only
5000 mg⋅L-1 (see Appendix E), which was approximately one half the highest concentration
measured in the base case column. The lower porewater sulphate concentration and identical
sulphate production rate indicated the formation of gypsum in the pore-space that likely
dissolved during the flooding and flushing process.
0.0E+00
5.0E-02
1.0E-01
1.5E-01
2.0E-01
2.5E-01
3.0E-01
0 50 100 150 200 250
Time (day)
Lo
adin
g (
mo
le)
Base Case 1 % Calcite 5 % Enstatite

102
Figure 4.49: Comparison of sulphate loading between the base case and the mineralbuffered columns.
0.0E+00
2.0E-03
4.0E-03
6.0E-03
8.0E-03
1.0E-02
1.2E-02
1.4E-02
1.6E-02
0 50 100 150 200 250
Time (day)
Oxy
gen
Co
nsu
mp
tio
n R
ate
(mo
l O2/
day
)
Base Case 1 % Calcite 5 % Enstatite
Figure 4.50: Comparison of oxygen consumption rate between in the base case and themineral buffered columns.
Although the presence of buffering minerals had little effect on the sulphate production rate and
the oxygen consumption rate, the iron and nickel production rates were significantly lower in the
calcite buffered columns. The iron production rate from the 5 % enstatite column over the first
100 days was also slight lower than that in the base case column. Since the nickel production
rate was shown previously to depend on accumulation of iron in the packed column, the major
increase in iron accumulation should reduce nickel production rates. Th iron and nickel
production rates are given in Figure 4.51 and Figure 4.52.
Majority of the iron in the 1 % calcite column was precipitated as ferric hydroxide due to high
porewater pH (approximately 7.0). The high iron accumulation resulted in significant nickel
retention in the column through either entrainment of nickel in the ferric hydroxide matrix or
adsorption on the surface of the ferric hydroxide precipitate. The porewater concentration
profiles for iron and nickel (Figure 4.53) also confirmed the accumulation of nickel in secondary
iron precipitates. The enstatite resulted in porewater pH values of 4 to 5 and therefore less iron
precipitated than the calcite column. This resulted in nickel loadings that were intermediate
between the base case and the 1 % calcite column.

103
0.0E+00
5.0E-02
1.0E-01
1.5E-01
2.0E-01
2.5E-01
0 50 100 150 200 250
Time (day)
Lo
adin
g (
mo
le)
Base Case 1 % Calcite 5 % Enstatite
Figure 4.51: Comparison of iron loading between the base case and the mineral bufferedcolumns.
0.0E+00
2.0E-03
4.0E-03
6.0E-03
8.0E-03
1.0E-02
1.2E-02
1.4E-02
0 50 100 150 200 250
Time (day)
Lo
adin
g (
mo
le)
Base Case 1 % Calcite 5 % Enstatite
Figure 4.52: Comparison of nickel loading between the base case and the mineralbuffered columns.
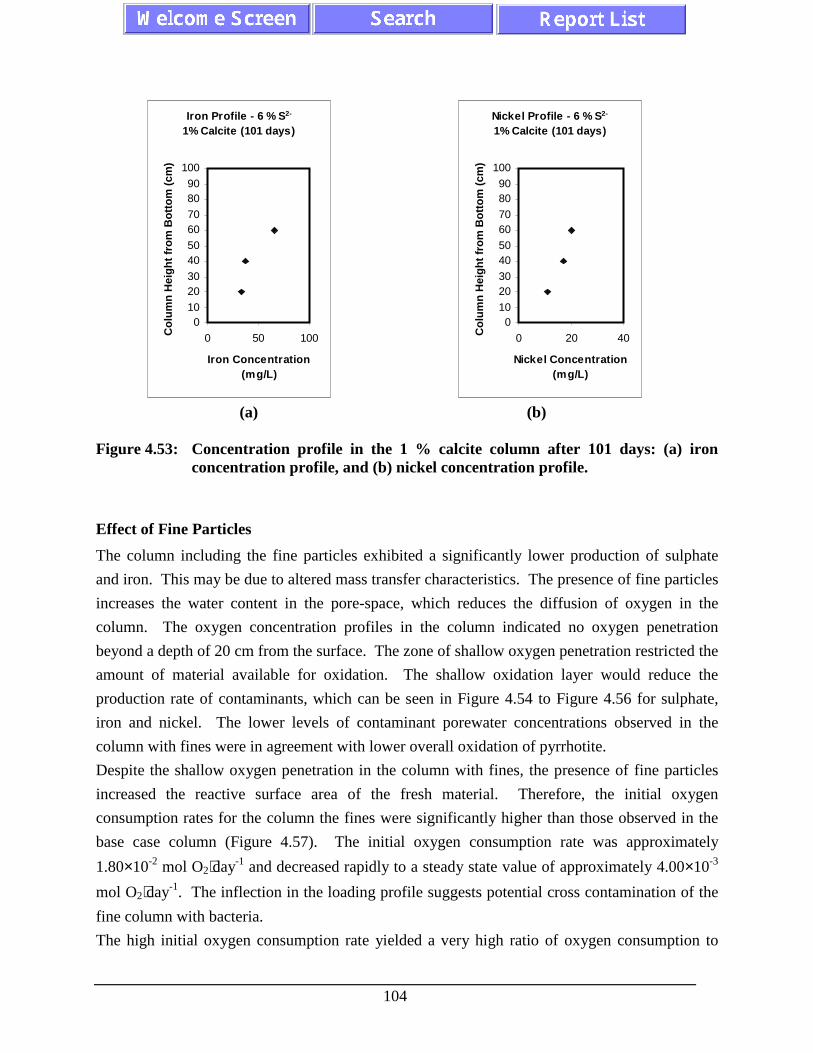
104
Iron Profile - 6 % S2-
1% Calcite (101 days)
010
2030
4050
6070
8090
100
0 50 100
Iron Concentration (mg/L)
Co
lum
n H
eig
ht
fro
m B
ott
om
(cm
)
Nickel Profile - 6 % S2-
1% Calcite (101 days)
010
2030
4050
6070
8090
100
0 20 40
Nickel Concentration (mg/L)
Co
lum
n H
eig
ht
fro
m B
ott
om
(cm
)
(a) (b)
Figure 4.53: Concentration profile in the 1 % calcite column after 101 days: (a) ironconcentration profile, and (b) nickel concentration profile.
Effect of Fine Particles
The column including the fine particles exhibited a significantly lower production of sulphate
and iron. This may be due to altered mass transfer characteristics. The presence of fine particles
increases the water content in the pore-space, which reduces the diffusion of oxygen in the
column. The oxygen concentration profiles in the column indicated no oxygen penetration
beyond a depth of 20 cm from the surface. The zone of shallow oxygen penetration restricted the
amount of material available for oxidation. The shallow oxidation layer would reduce the
production rate of contaminants, which can be seen in Figure 4.54 to Figure 4.56 for sulphate,
iron and nickel. The lower levels of contaminant porewater concentrations observed in the
column with fines were in agreement with lower overall oxidation of pyrrhotite.
Despite the shallow oxygen penetration in the column with fines, the presence of fine particles
increased the reactive surface area of the fresh material. Therefore, the initial oxygen
consumption rates for the column the fines were significantly higher than those observed in the
base case column (Figure 4.57). The initial oxygen consumption rate was approximately
1.80×10⁻² mol O2⋅day-1 and decreased rapidly to a steady state value of approximately 4.00×10⁻³
mol O2⋅day-1. The inflection in the loading profile suggests potential cross contamination of the
fine column with bacteria.
The high initial oxygen consumption rate yielded a very high ratio of oxygen consumption to

105
sulphate production (24 to 63). The combination of low sulphate production rate and high
oxygen consumption rate suggested highly significant partial oxidation of pyrrhotite occurred in
the column with fines.
0.0E+00
5.0E-02
1.0E-01
1.5E-01
2.0E-01
2.5E-01
0 50 100 150 200 250
Time (day)
Lo
adin
g (
mo
le)
Base Case w ith Fines
Figure 4.54: Comparison of sulphate loading between the base case and the column withfines.

106
0.0E+00
5.0E-02
1.0E-01
1.5E-01
2.0E-01
2.5E-01
0 50 100 150 200 250
Time (day)
Lo
adin
g (
mo
le)
Base Case w ith Fines
Figure 4.55: Comparison of iron loading between the base case and the column with fines.
0.0E+00
2.0E-03
4.0E-03
6.0E-03
8.0E-03
1.0E-02
1.2E-02
1.4E-02
0 50 100 150 200 250
Time (day)
Lo
adin
g (
mo
le)
Base Case w ith Fines
Figure 4.56: Comparison of nickel loading between the base case and the column withfines.
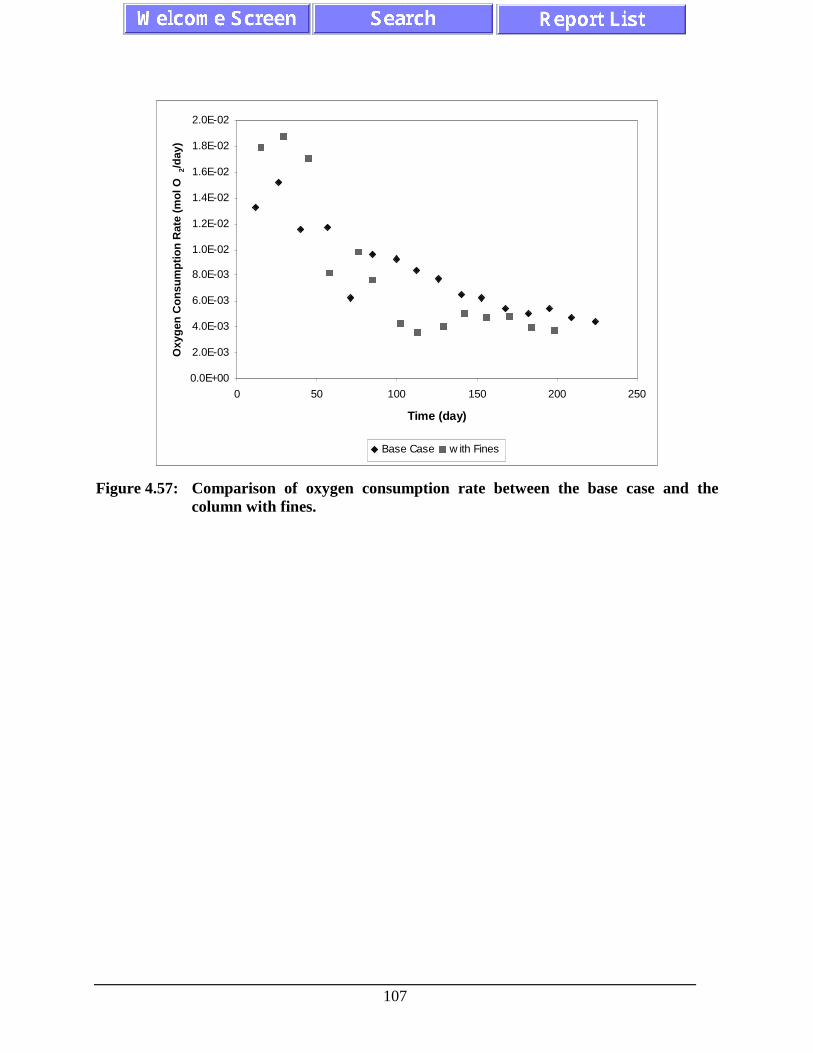
107
0.0E+00
2.0E-03
4.0E-03
6.0E-03
8.0E-03
1.0E-02
1.2E-02
1.4E-02
1.6E-02
1.8E-02
2.0E-02
0 50 100 150 200 250
Time (day)
Oxy
gen
Co
nsu
mp
tio
n R
ate
(mo
l O2/
day
)
Base Case w ith Fines
Figure 4.57: Comparison of oxygen consumption rate between the base case and thecolumn with fines.

108
1 CONCLUSIONS
1. There is considerable variation among the specific surface area values for different pyrrhotite
samples. Differences in specific surface area values among pyrrhotite samples appear
random and not correlated to crystal structure or trace metal substitution for iron in the
pyrrhotite matrix. Preferential oxidation appears to occur at areas of high strain on the
pyrrhotite surface. In granular material such as tailings, surface area may be influenced by
method of size reduction. Specific surface area values calculated from a spherical geometry
are poor estimators for BET measured specific surface areas. Measured pyrrhotite specific
surface areas were 6 to 40 times greater than the theoretical specific surface area. Fractures
along cleavage planes and surface roughness cause the specific surface area of pyrrhotite to
be higher than the theoretical geometrical specific surface area and pyrite specific surface
area. The fractures are not simply near-surface features, but appear to extend into the
pyrrhotite structure. Pyrrhotite can have specific surface area values as much as 10 times
higher than pyrite. Pyrite does not exhibit crystallographic cleavage like pyrrhotite. Accurate
BET measured specific surface areas on site specific pyrrhotite samples are therefore
required to properly assess oxidation rates in mine tailings containing pyrrhotite.
2. There are differences in bulk impurity compositions (determined by multi-acid extraction and
ICP-AES analysis) among the twelve pyrrhotite samples. The major impurities included
were cobalt, copper, manganese, nickel, lead, and zinc. The concentrations of impurities
were attributed to accessory minerals present with pyrrhotite. Cobalt substituted for iron in
all twelve pyrrhotite samples. Nickel content varied more widely than cobalt in the twelve
pyrrhotite samples. Manganese and copper substitution were not significant in the twelve
pyrrhotite samples. Both XRD and electron microprobe analysis are effective techniques for
identifying accessory minerals associated with the pyrrhotite particles. Chalcopyrite was the
dominant accessory mineral associated with pyrrhotite and was present in detectable amounts
for 9 of 12 samples. The twelve samples varied in composition from pure hexagonal to pure
monoclinic. XRD Peak area is a valid method to determine the composition of hexagonal and
monoclinic pyrrhotite. The limit of detection for hexagonal pyrrhotite is close to 8 %. Care
should be used when applying the Yund and Hall (1969) equation to estimate atomic percent
iron in pyrrhotite samples.
3. Several different aspects of pyrrhotite oxidation were examined in this study. The mean non-
oxidative dissolution rate of pyrrhotite for twelve pyrrhotite samples was 5×10⁻¹⁰ mol⋅m-2⋅s-1.
The reasons for the variation in dissolution rates remain unclear. Pyrrhotite crystal structure
and trace metal content do not appear to have a consistent effect on the control of pyrrhotite

109
oxidation rates by either oxygen or ferric iron. Non-oxidative dissolution of pyrrhotite
appears to be a potentially significant contributor of ferrous iron release in pyrrhotite
weathering in acidic solutions. These rates should be considered in prediction models that
include pyrrhotite weathering in tailings. The mean oxidation rate of pyrrhotite by oxygen
for the twelve pyrrhotite samples was 4×10⁻⁹ mol⋅m-2⋅s-1. Oxidation by ferric iron exhibited
more rapid rates than oxidation of pyrrhotite by oxygen. At pH=2.75 with an initial Fe3+
concentration of 2×10⁻⁴ M, the mean oxidation rate by ferric iron for the twelve pyrrhotite
samples was 3.5×10⁻⁸ mol Fe3+⋅m-2⋅s-1. Pyrrhotite oxidation by ferric iron appears to follow
an adsorption type of mechanism. In spite of the high sample variances, the difference
between mean non-oxidative reaction rates was significant at the 5 % significance level.
4. Oxidation reactions of pyrrhotite by either ferric iron or oxygen resulted in incomplete
oxidation for some of the sulphide sulphur with only partial transformation to sulphate.
Sulphur enrichment on particle surfaces and elemental sulphur formations are likely reasons
for the incomplete oxidation of sulphide sulphur to sulphate.
5. Calculated activation energies for pyrrhotite oxidation by oxygen ranged from 47 kJ⋅mol-1 to
63 kJ⋅mol-1 based on iron release. Similar activation energies were found for ferric iron
oxidation. Surface area is a controlling factor in reaction kinetics. Accurate BET measured
specific surface areas on location-specific pyrrhotite samples are therefore required to
properly assess oxidation rates in mine tailings containing pyrrhotite. The high reactivity of
pyrrhotite on the mass basis as reported in previous papers is attributable to the high specific
surface area of pyrrhotite in comparison to the other minerals.
6. Detailed kinetic studies on the pyrrhotite tailings concentrate indicated that; a) oxidation rates
varied consistently with temperature, b) abiotic rates were higher at pH = 2 and lower at pH
= 6, c) bacterial catalysis of pyrrhotite oxidation enhanced sulphate but not iron production
rates, and d) nickel release rates reflected iron release rates for pH values of 2, 3 and 4.
7. The results of the column studies showed that; a) oxygen consumption rates were higher than
expected from the release rates for sulphate. This may be due to the partial oxidation of
sulphide in the pyrrhotite, b) iron and sulphate release rates were close to the stoichiometric
ratio of 1 : 1 even though precipitation of ferric hydroxide was evident and lower iron :
sulphate ratios were expected, c) oxidation rates in the 6 % S columns generally decreased
with time, reflecting sulphide depletion and an increasing importance of oxygen diffusion

110
controls with time, d) sulphate release rates in the 2 % S column were only slightly lower
than those in the 6 % S column, e) nickel release rates were higher in the 2 % S column, f)
the precipitation of ferric hydroxide solids in the tailings was responsible for attenuating the
release of nickel from the tailings porewater, g) although carbonate buffering did not
significantly affect the rates of pyrrhotite oxidation as exhibited by sulphate production and
oxygen consumption rates, iron and nickel release was significantly lower as a result of
enhanced ferric hydroxide precipitation, h) silicate (enstatite) provided a partial buffering that
resulted in iron and nickel loadings that were lower than the non-buffered columns, and i) the
presence of pyrrhotite “fines” in the tailings, with the potential for higher reactivity than the
coarse pyrrhotite actually resulted in lower rates because of the increased moisture retention
and decreased gas diffusion coefficient that controls oxygen transport.
It is evident that kinetic data are required to assess pyrrhotite oxidation rates in tailings.
However, because most of the variation in rates is due to the variation in specific surface area of
pyrrhotite particles, this parameter should be measured on location-specific samples. The results
of this study have shown that oxygen diffusion (or mass transfer) has a significant and overriding
effect on the observed rates in tailings that becomes increasingly significant with time. This
implies that uncertainties in oxidation rate kinetics will result in less uncertainty in rate
predictions when both kinetics and mass transport are considered in tailings oxidation
calculations. This means that small uncertainties in the estimates of kinetic parameters may not
significantly affect long-term predictions of loading rates of pyrrhotite oxidation products. This
is a positive outcome in that detailed long-term kinetic testing is not required for model input
data to evaluate long-term behaviour of pyrrhotite tailings. By inference, and the less complex
nature of pyrite oxidation, similar conclusions likely hold for pyrite oxidation.

111
REFERENCES
Ahonen L. and O.H. Tuovinen. 1989. Microbiological oxidation of ferrous iron at lowtemperatures. Applied and Environmental Microbiology 55:312-316.
Ahonen L. and O.H. Tuovinen. 1991. Temperature effects on bacterial leaching of sulfideminerals in shake flask experiments. Applied and Environmental Microbiology 57:138-145.
Amaro, A. M., Seeger, M., Arredondo, R., Moreno, M., and Jerez, C. A. The growthconditions affect Thiobacillus ferrooxidans attachment to solids. 2, 577-585. 1993.Proceedings of International Biohydrometallurgy Symposium.
Arkesteyn G.J.M.W. 1978. Pyrite oxidation by Thiobacillus ferrooxidans with special referenceto the sulphur moiety of the mineral. Antonie van Leeuwenhoek 45:423-435.
Arnold R.G. and L.E. Reichen. 1962. Measurement of the metal content of naturally occurring,metal-deficient, hexagonal pyrrhotite by an x-ray spacing method. The AmericanMineralogist 47:105-111.
Arnold R.G. 1966. Mixtures of hexagonal and monoclinic pyrrhotite and the measurement ofthe metal content of pyrrhotite by x-ray diffraction. The American Mineralogist 51:1221-1227.
Arnold R.G. 1967. Range in composition and structure of 82 natural terrestrial pyrrhotites.Canadian Mineralogy 9:31-50.
Boogerd F.C., C. van den Beemd, T. Stoelwinder, P. Bas and J.G. Kuenen. 1991. Relativecontributions of biological and chemical reactions to the overall rate of pyrite oxidation attemperatures between 30ºC and 70ºC. Biotechnology and Bioengineering 38:109-115.
Boon, M. and Heijnen, J. J. Mechanisms and rate limiting steps in bioleaching of sphalerite,chalcopyrite and pyrite with thiobacillus ferrooxidans. 1, 217-235. 1993. Proceedings ofInternational Biohydrometallurgy Symposium
Brownlow A.H. 1996. Geochemistry. Prentice-Hall, Inc.,
Bugajski J. and H. Gamsjager. 1982. The kinetics of the dissolution of monoclinic pyrrhotitein aqueous acidic solutions. Monatshefte fur Chemie 113:1087-1092.
Choi W.K., A.E. Torma, R.W. Ohline and E. Ghali. 1993. Electrochemical aspects of zincsulphide leaching by Thiobacillus ferrooxidans. Hydrometallurgy 33:137-152.
Collin M. and A. Rasmuson. 1988. A comparison of gas diffuivity models for unsaturatedporous media. Soil Sci.Soc.Am.J. 53:1559-1565.
David, D. J. and Nicholson, R. V. Field measurements for determing rates of sulphideoxidation. 1, 201-210. 1995. Proceeding of Sudbury'95. 1995.

112
Davis, J. A. and Kent, D. B. Surface complexation modeling in aqueous geochemistry.Hochella, M. F. Jr. and White, A. F. (23), 87-128. 1990. Mineralogical Society of America.Reviews in Mineralogy - Mineral-Water Interface Geochemistry.
de Haan S.B. 1991. A review of the rate of pyrite oxidation in aqueous systems at lowtemperature. Earth Sciencr Review 31:1-10.
Deer W.A., R.A. Howie and J. Zussman. 1992. An introduction to the rock-forming minerals.Longman Scientific & Technical,
Evangelou V.P. and Y.L. Zhang. 1995. A review: pyrite oxidation mechanisms and acid minedrainage prevention. Critical Reviews in Environmental Science and Technology 25:141-199.
Graham R.A. 1969. Quantitative determination of hexagonal and monoclinic pyrrhotites by x-ray diffraction. The Canadian Mineralogist 10:4-24.
Hamilton I.C. and R. Woods. 1981. An investigation of surface oxidation of pyrite andpyrrhotite by linear potential sweep voltammetry. Journal of Electroanalytical Chemistry118:327-343.
Hansford, G. S. and Bailey, A. D. Oxygen transfer limitation of bio-oxidation at high solidsconcentration. 1, 469-478. 1993. Biotechnological Technologies - Proceedings ofinternational biohydrometallurgy symposium.
Holdren G.R. and P.M. Speyer. 1985. Reaction rate - surface area relationships during theearly stages of weathering - I. initial observations. Geochimica et Cosmochimica Acta49:675-681.
Ingledew W.J. 1986. Ferrous iron oxidation by Thiobacillus ferrooxidans. Biotechnology andBioengineering Symp. 16:23-33.
Jambor, J. L. Detailed mineralogical examination of alteration products in core WA-20 fromWaite Amulet tailings. CANMET Division Report MSL 86-137(IR). 1986. Dept. EnergyMines Resources Canada.
Jambor J.L. 1994. Mineralogy of sulfide-rich tailings and their oxidation products. In: JamborJ.L. and D.W. Blowes, eds. Geochemistry of Sulfide Mine Wastes. Mineralogical Society ofAmerica. 59-102.
Janzen, M. P. Role of ferric iron, trace metal content and crystal structure on pyrrhotiteoxidation. 1996. University of Waterloo. 1996.
Jaynes D.B., H.B. Pionke and A.S. Rogowski. 1984. Acid mine drainage from reclaimed coalstrip mines, 2. simulation results of model. Water Resour.Res. 20:243-250.
Jensen A. and C. Webb. 1995. Ferrous sulphate oxidation using Thiobacillus ferrooxidans: areview. Process Biochemistry 30:225-236.

113
Johnson, D. B. Diversity of microbial life highly acidic, mesophilic environments. 1991.Elsvier Science B.V. Diversity of Environmental Biogeochemistry.
Jones C.F., S. LeCount, R.St.C. Smart and T.J. White. 1992. Compositional and structuralalteration of pyrrhotite surfaces in solution : XPS and XRD studies. Applied Surface Science55:65-85.
Kuenen, J. G., Pronk, J. T., Hazeu, W., Meulenberg, R., and Bas, P. A review ofbioenergetics and enzymology of sulfur compound oxidation by acidophilic Thiobacillui. 2,487-494. 1993. Proceedings of International Biohydrometallurgy Symposium. 1993.
Kulpa C.F.Jr., N. Mjoli and M.T. Roskey. 1986. Comparison of iron and sulfur oxidation inThiobacillus ferrooxidans: inhibition of iron oxidation by growth on sulfur. Biotechnologyand Bioengineering Symp. 16:289-295.
Kwong, E. C. M. Abiotic and biotic pyrrhotite dissolution. 1-101. 1995. 1995.
Kwong, J. Y. T. Prediction and prevention of acid rock drainage from a geological andmineralogical perspective. Mend Project 1.32.1. 1993.
Leduc L.C. and G.D. Ferroni. 1994. The chemolithotrophic bacterium Thiobacillusferrooxidans. FEM Microbiology Reviews 14:103-120.
Liu M.S., R.M.R. Branion and D.W. Duncan. 1988. The effects of ferrous iron, dissolvedoxygen , and inert solids concentrations on the frowth of Thiobacillus ferrooxidans. TheCanadian Journal of Chemical Engineering 66:445-451.
Lizama H.M. and I. Suzuki. 1988. Bacterial leaching of a sulfide ore by Thiobacillusferrooxidans and Thiobacillus thiooxidans: I. shake flask studies. Biotechnology andBioengineering 32:110-116.
Lizama H.M. and I. Suzuki. 1990. Kinetics of sulfur and pyrite oxidation by Thiobacillusthiooxidans. Competitive inhibition by increasing concentrations of cells. Canadian Journalof Microbiology 37:182-187.
Lorbach, S. C., Buonfiglio, V., Bauld, J. M., and Shively, J. M. Oxidation of reduced sulfurcompounds by Thiobacillus ferrooxidans23270 and Thiobacillus ferrooxidans F.C. 2, 443-452. 1993. Biohydrometallurgical Technologies - Proceedings of internationalbiohydrometallurgy symposium. 1993.
Loten J.P. and E. Wesker. 1987. The behaviour of sulphur in the oxidative leaching ofsulphidic minerals. Hydrometallurgy 18:39-54.
Lowson R.T. 1982. Aqueous oxidation of pyrite by molecular oxygen. Chemical Reviews82:461-497.
Massmann J. and D.F. Farrier. 1992. Effects of atmospheric pressures on gas transport in thevadose zone. Water Resour.Res. 28:777-791.

114
McGinness S. and D.B. Johnson. 1993. Seasonal variations in the microbiology and chemistryof an acid mine drainage stream. The Science of the Total Environment 132:27-41.
McKibben M.A. and H.L. Barnes. 1986. Oxidation of pyrite in low temperature acidicsolutions: rate laws and surface textures. Geochimica et Cosmochimica Acta 50:1509-1520.
Mehta A.P. 1982. Kinetic study of sulfide leaching by galvanic interaction betweenchalcopyrite, pyrite, and sphalerite in the presence of T. ferrooxidans (30ºC) and athermophilic microorganism (55ºC). Biotechnology and Bioengineering 24:919-940.
Mehta A.P. and L.E. Murr. 1983. Fundamental studies of the contributioin of galvanicinteraction to acid-bacterial leaching of mixed metal sulfides. Hydrometallurgy 9:235-256.
Morimoto N., A. Gyobu, H. Mukaiyama and E. Izawa. 1975. Superstructure andnonstoichiometry of intermediate pyrrhotite. Am.Mineral. 60:240-248.
Moses C.O., D.K. Nordstrom, J.S. Herman and A.A. Mills. 1987. Aqueous pyrite oxidationby dissolved oxgen and ferric iron. Geochimica et Cosmochimica Acta 51:1561-1571.
Moses C.O. and J.S. Herman. 1991. Pyrite oxidation at circumneutral pH. Geochimica etCosmochimica Acta 50:1509-1520.
Mustin, C., de Donato, Ph., and Berthelin, J. Surface oxidized species, a key factor in thestudy of bioleaching processes. Part II: investigation of superficial oxidized species developedduring the bacterial oxidation of pyrite by Thiobacillus ferrooxidans. 1, 175-184. 1993.Biohydrometallurgical Technologies - Proceedings of international biohydrometallurgysumposium. 1993.
Nagpal E., D. Dahlstrom and T. Oolman. 1993. Effect of carbon dioxide concentration on thebioleaching of a pyrite-arsenopyrite ore concentrate. Biotechnology and Bioengineering41:459-464.
Nakamura K., T. Noike and J. Matsumoto. 1986. Effect of operation conditions on biologicalFe2+ oxidation with rotating biological contactors. Water Resources 20:73-77.
Nichol M.J. and P.D. Scott. 1979. The kinetics and mechanism of the non-oxidative dissolutionof some iron sulphides in aqueous acidic solutions. Journal of the South African Institute ofMining and Metallurgy 298-305.
Nicholson R.V., R.W. Gillham and E.J. Reardon. 1988. Pyrite oxidation in carbonate-bufferedsolution: I. experimental kinetics. Geochimica et Cosmochimica Acta 52:1077-1084.
Nicholson R.V., R.W. Gillham and E.J. Reardon. 1989. Pyrite oxidation in carbonate-bufferedsolution: II. rate control by oxide coatings. Geochimica et Cosmochimica Acta 54:395-402.
Nicholson R.V. 1994. Iron-sulfide oxidation mechanisms: laboratory studies. In: Jambor J.L.and D.W. Blowes, eds. Environmental Geochemistry of Sulfide Mine-Wates. MineralogicalSociety of America. 163-183.
115
Nickel E.H., J.R. Ross and M.R. Thornber. 1974. The supergene alteration of pyrrhotite-pentlandite ore at Kambalda, Westen Australia. Economic Gelogy 69:93-107.
Olson G.J. and R.M. Kelly. 1986. Microbiological metal transformations. BiotechnologyProgress 2:1-15.
Orlova T.A., V.M. Stupnikov and A.L. Krestan. 1988. Mechanism of oxidative dissolution ofsulphides. Zhurnal Prikladnoi Khimii 61:2172-2177.
Pesic, B. Redox potential technique to study the factors of importance during reactions of T.ferrooxidans with Fe3+. 1, 545-560. 1993. Biohydrometallurgical Technologies - Proceedingsof international biohydrometallurgy symposium. 1993.
Plysunin A.M., A.G. Mironov, N.V. Belomestrova and S.Ye. Chernigova. 1990. Laboratorystudies on gold-bearing sulfide oxidation. Geokhimya 1:51-60.
Pratt A.R., H.W. Nesbitt and I.J. Muir. 1994. Generation of acids from mine waste: oxidativeleaching of pyrrhotite in dilute H2SO4 solutions at pH 3.0. Geochimica et CosmochimicaActa 58:5147-5159.
Pratt A.R., I.J. Muir and H.W. Nesbitt. 1994. X-ray photoelectron and Auger electronspectroscopic studies of pyrrhotite and mechanism of air oxidation. Geochimica etCosmochimica Acta 58:827-841.
Pronk J.T. and D.B. Johnson. 1992. Oxidation and reduction of iron by acidophilic bacteria.Geomicrobiology Journal 10:153-171.
Reardon E.J. and P.M. Moddle. 1985. Gas diffusion coefficient measurements on uranium milltailings: implications to cover layer design. Uranium 2:111-131.
Rimstidt, J. D., Chermak, J. A., and Gagen, P. M. Rates of reaction of galena, shpalerite,chalcopyrite, and arsenopyrite with Fe(III) in acidic solutions. 2-13. 1994. EnvironmentalGeochemistry of Sulfide Oxidation.
Sand W., K. Rohde, B. Sobotke and C. Zenneck. 1992. Evaluation of Leptospirillumferrooxidans for leaching. Applied and Environmental Microbiology 58:85-92.
Scharer, J. M., Garga, V., Smith, R., and Halbert, B. E. Use of steady state models forassessing acid generation in pyritic mine tailings. 2, 211-230. 1991. Proceeding of 2ndICARD. 1991.
Scharer, J. M., Byerley, J. J, Kwong, E. C. M., and Nicholson, R. V. Role of biologicallyassisted pyrrhotite oxidation in acid mine drainage. 2, 255-265. 1993. Proceedings ofInternational Biohydrometallurgy Symposium. 1993.
Scharer, J. M., Annable, W. K., and Nicholson, R. V. WATAIL 1.0 user’s manual - a tailingsbasin model to evaluate transient water quality of acid mine drainage. (1.0). 1993. Universityof Waterloo.

116
SENES Consultants Limited. Waste rock sampling manual. MEND Project 4.5.1. 1998.
Singh G. and M. Bhatnagar. 1985. Bacterial formation of acid mine drainage: causes andcontrol. Journal of Scientific and Industrial Research 44:478-485.
Skinner B.J. and F.D. Luce. 1971. Stabilities and compositions of dmeykite and algodonite.Economic Geology 66:133-139.
Smith, E. E., Svanks, K., and Shumate, K. Sulphide to sulphate reaction studies. 1-10. 1968.Proceeding of 2nd Symposium on Coal Mine Drainage Research.
Steger H.F. and L.E. Desjardins. 1978. Oxidation of sulpfide minerals, 4. pyrite, chalcopyriteand pyrrhotite. Chemical Geology 23:225-237.
Steger H.F. 1982. Oxidation of sulfide minerals VII. effect of temperature and relative humidityon the oxidation of pyrrhotite. Chemical Geology 35:281-295.
Stumm W. 1992. Chemistry of the solid-water interface - processes at the mineral-water andparticle-water interface in natural systems. John Wiley & Sons, Inc.,
Sugio T., K.J. White, E. Shute, D. Choate and R.C.II. Blake. 1992. Existance of hydrogensulfide: ferric ion oxidoreductase in iron-oxidizing bacteria. Applied and EnvironmentalMicrobiology 58:431-433.
Suzuki I., T.L. Takeuchi, T.D. Yuthasastrakosol and J.K. Oh. 1990. Ferrous iron and sulfuroxidation and ferric iron reduction activities of Thiobacillus ferrooxidans are affected bygrowth on ferrous iron, sulfur, or a sulfide ore. Applied and Environmental Microbiology56:1620-1626.
Tewari P.H. and A.B. Campbell. 1976. Dissolution of iron sulphide (troilite) in aqueoussulphuric acid. Journal of Physical Chemistry 80:1844-1848.
Thornber M.R. 1975. Supergene alteration of sulphides, II. a chemical study of the Kambaldanickel deposits. Chemical Geology 15:117-144.
Thornber M.R. 1975. Supergene alteration of sulphides, I. a chemical model based on massivenickel sulphide deposits at Kambalda, Western Australia. Chemical Geology 15:1-14.
Thornber M.R., P.D. Allchurch and E.H. Nickel. 1981. Variations in gossen geochemistry atthe preseverance nickel sulfide deposit, Western Australia: a descriptive and experimentalstudy. Economic Gelogy 76:1764-1774.
Torma A.E., C.C. Walden, D.W. Duncan and R.M.R. Branion. 1972. The effect of carbondioxide and particle surface area on themicrobiological leaching of a zinc sulfide concentrate.Biotechnology and Bioengineering 14:777-786.
Toro L., B. Paponetti and C. Cantalini. 1988. Precipitate formation in the oxidation of ferrousions in the presence of Thiobacillus ferrooxidans. Hydrometallurgy 20:1-9.

117
Toulmin P. and P.B. Barton. 1964. A thermodynamic study of pyrite and pyrrhotite.Geochimica et Cosmochimica Acta 28:641-671.
Tributsch H. and J.C. Bennett. 1981. Semiconductor-electrochemical aspects of bacterialleaching. 1. oxidation of metal sulphides with large energy gaps. Journal of ChemicalTechnology and Biotechnolog 31:565-577.
Tributsch H. and J.C. Bennett. 1981. Semiconductor-electrochemical aspects of bacterialleaching. 2. survay of rate-controlling sulphide properties. Journal of Chemical Technologyand Biotechnolog 31:627-635.
Tuovinen O.H. 1986. Acid leaching of uranium ore materials with microbial catalysis.Biotechnology and Bioengineering Symp. 16:65-72.
van Weert G., K. Mah and N.L. Piret. 1974. Hydrochloric acid leaching of nickerliferouspyrrhotites from the Sudbury district. CIM Bulletin 97-103.
Vaughan D.J. and J.R. Craig. 1978. Mineral chemistry of metal sulfides. CambridgeUniversity Press,
Williamson M.A. and J.D. Rimstidt. 1994. The kinetics and electrochemical rate-determiningstep of aqueous pyrite oxidation. Geochimica et Cosmochimica Acta 58:5443-5454.
Woods T.L. and R.M. Garrels. 1987. Thermodynamics values at low temperature for naturalinorganic materials - an uncritical summary. Oxford University Press,
Wuensch B.J. 1963. Ont the suoerstructure and twinning of pyrrhotite.Mineral.Soc.Am.Spec.Pap. 1:157-163.
Yakhontova L.K., L.G. Nesterovich and A.P. Grudev. 1983. New data on natural oxidation ofpyrrhotite. Vestnik Moskovskogo Universiteta Geologiya 38:41-44.
Yund R.A. and H.T. Hall. 1969. Hexagonal and monoclinic pyrrhotite. Economic Gelogy64:420-423.
Zheng C.Q., C.C. Allen and R.G. Bautista. 1986. Kinetic study of the oxidation of pyrite inaqueous ferric sulphate. Ind.Eng.Chem.Process Des.Dev. 25:308-317.