labour market partnership: phase 2 – final labour market
TRANSCRIPT

Report Submitted: August 22, 2016
Labour Market Partnership: Phase 2 – Final Labour Market Information Research Report

2 | P a g e
Table of Contents List of Tables .............................................................................................................................................................................. 3
List of Figures ............................................................................................................................................................................ 3
Acknowledgements ................................................................................................................................................................ 5
Executive Summary ................................................................................................................................................................ 6
1. Introduction - About this Report ............................................................................................................................. 9
2. Overview of the LMI Research Project .................................................................................................................. 9
2.1. Research Methodology ....................................................................................................................................... 9
2.2. Research Questions ............................................................................................................................................. 9
2.3. Sector Analysis: Background Research ......................................................................................................... 11
2.4. Selected Research Literature ........................................................................................................................ 11
2.4.1. Canada ........................................................................................................................................................... 11
2.4.2. United States ............................................................................................................................................... 12
2.4.3. Europe ........................................................................................................................................................... 13
2.4.4. Australia and New Zealand ................................................................................................................... 15
2.5. Secondary Background Data ......................................................................................................................... 16
2.5.1. Number and Size of Manufacturing Companies ........................................................................... 16
2.5.2. Employment in Manufacturing ........................................................................................................... 18
2.5.3. Economic Data ........................................................................................................................................... 22
2.6. Sample Company Profiles ............................................................................................................................... 23
2.6.1. Viking (Victoria) (Transportation Equipment Manufacturing – NAICS 336) .................. 23
2.6.2. Reliable Controls (Victoria) (Computer and Electronic Product Manufacturing –
NAICS 334) ..................................................................................................................................................................... 24
2.6.3. VMAC (Nanaimo) (Machinery Manufacturing – NAICS - 333) ............................................... 24
2.6.4. Nanaimo Forest Products (Nanaimo) (Wood Product Manufacturing – NAICS 321) .. 24
2.6.5. Town Site Brewing (Powell River) (Beverage & Tobacco Product Manufacturing –
NAICS 312) ..................................................................................................................................................................... 25
2.6.6. Plastics Plus Fabricating (Campbell River) (Plastics & Rubber Products
Manufacturing – NAICS 326) ................................................................................................................................... 25
3. Primary Research: Employer Survey and Interviews .................................................................................. 26
3.1. Online Survey Results ....................................................................................................................................... 26

3 | P a g e
3.1.1. Background of Companies Responding to the Survey .............................................................. 26
3.1.2. Characteristics of the Workforce ....................................................................................................... 29
3.1.3. Employer Training ................................................................................................................................... 32
3.1.4. Projected Growth ...................................................................................................................................... 37
3.1.5. Labour and Skill Shortages ................................................................................................................... 39
3.1.6. Strategies to Address Skill Shortages ............................................................................................... 42
3.2. Summary of Themes Emerging from Employer Interviews ............................................................. 45
4. Summary: Key Issues and Strategies .................................................................................................................. 52
4.1. Key Issues .............................................................................................................................................................. 52
4.2. Strategies to Address Issues .......................................................................................................................... 54
Appendix 1: Vancouver Island/Coastal Region Manufacturing Company Database ........................... 56
Appendix 2: List of Companies Interviewed ........................................................................................................ 63
Bibliography ............................................................................................................................................................................ 64
List of Tables Table 1: Manufacturing Industry by NAICS Codes .................................................................................................. 16
Table 2: Number and Size of Manufacturing Companies in Canada by Province ....................................... 17
Table 3: VI/Coastal Region Manufacturing Sector Employment 2010 – 2015 (in thousands) ............ 20
Table 4: Gross Domestic Product and Growth ......................................................................................................... 22
Table 5: Vancouver Island/Coastal Region Manufacturers Responding to the Online Survey ............ 26
Table 6: Trades Designations Reported by VI/Coastal Manufacturing Companies .................................. 30
Table 7: Employer Comments about the Effectiveness of Training ................................................................ 35
Table 8: Employer Comments Concerning Employment Growth of Decline ............................................... 37
Table 9: Difficult to Fill Positions ................................................................................................................................... 39
Table 10: Summary of Employer Comments Concerning Sectoral Strategies ............................................ 43
Table 11: Themes Emerging from Interviews with Vancouver Island/Coastal Region Manufacturing
Companies ................................................................................................................................................................................ 47
List of Figures Figure 1: Length of Time in Operation in the VI/Coastal Region ..................................................................... 28
Figure 2: Number of Workers Employed by Companies Responding to the Survey ................................ 28
Figure 3: Credentials or Professional Designations Required by Companies ............................................. 29
Figure 4: Age Range of Workforce .................................................................................................................................. 31
Figure 5: Reasons for Staff Turnover ........................................................................................................................... 32
Figure 6: Training Provided to Manufacturing Operations Employees ......................................................... 33
Figure 7: Training Providers ............................................................................................................................................ 33

4 | P a g e
Figure 8: Training for Administration and Manufacturing Support Employees ........................................ 34
Figure 9: Effectiveness Ratings for Training Activities ......................................................................................... 35
Figure 10: Employment Growth or Decline over the past 3 years ................................................................... 37
Figure 11: Anticipated Employment Levels in Next 3 Years .............................................................................. 37
Figure 12: Difficulty in Hiring Qualified Workers ................................................................................................... 39
Figure 13: Reasons for Failure of Job Applicants to Meet Position Requirements ................................... 41
Figure 14: Factors Contributing to Future Skill Shortages ................................................................................. 42
Figure 15: Actions to Address Skill Shortages .......................................................................................................... 43

5 | P a g e
Acknowledgements Harbour Digital Media would like to thank the members of the Vancouver Island Manufacturing
Sector Advisory Board (VIMAB), executives and managers of the British Columbia Ministry of Jobs,
Tourism, and Skills Training (JTST) and regional based Economic Development representatives for
their advice and support related to this research.
VIMAB
Chuck Richardson, Pacific Energy
Mike Smothers, Nicholson Manufacturing
Jennifer Jacques and Lynn Brown, Schneider Electric
Mark Brajer and Michelle Philpott, Epicure
Stuart Coker and Chris Larsen, VMACC
Scott McKay, Pro Mac Manufacturing
Robin Ambrose, Viking Air
Colin Dobell, Inuktun Services
Doug Pauze, Coastland Wood Industries
Ministry of Jobs, Tourism, and Skills Training
Kendra Greek, Program Manager, Labour Market Programs Branch, JTST
Shannon Renault, Director, Sector & Project Based Programs. JTST
Regional Economic Development Representatives
Cheryl McLay. Regional Manager Vancouver Island/Coast, Regional Economic Operations, JTST
Peter McGee, Economic Development Coordinator, Nanaimo Economic Development Corporation
Jolynn Green, Executive Director, Community Futures Central Island
Andrea Knowles, Campbell River Community Economic Development
Scott Randolph, Manager of Economic Development, City of Powell River
Geoff Crawford, Business Development Manager, Comox Valley Economic Development Society
Line Robert, CEO, Island Coastal Economic Trust
The views and opinions expressed in this report are those of its author(s) and not the official
policy or position of the Government of British Columbia.

6 | P a g e
Executive Summary
This labour market information (LMI) report provides the results of research related to the
Vancouver Island/Coastal region manufacturing sector conducted from January – June 2016. The
research was undertaken as a part of Phase 2 of a labour market partnership (LMP) involving
companies in the sector and region with the support of the BC Ministry of Jobs, Tourism, and Skills
Training.
Phase 2 of the LMP for the region involved the analysis of existing labour market information, a
brief review of some pertinent research literature related to skills and training issues, and the
collection of data from employers in the region using an online survey tool and through a series of
interviews with key manufacturing sector executives and managers. This report provides
highlights of the key labour market issues that emerged from that research.
A database of 169 manufacturing companies (with 10 or more employees) was developed to
undertake the online survey research. A total of 64 responses were received representing a
completion rate of 40.25%. One hour interviews with 16 key company executives and senior
managers were conducted between April 25 and June 7, 2016. The companies involved in these
interviews represented a cross-section of the manufacturing sector in the region.
Based on the research conducted, the following key issues were identified for the manufacturing
sector in the VI/Coastal region:
1. Skill Shortages
The region's manufacturers identified a number of positions with skills that are difficult to
fill. Among the positions most often identified were machine operators (CNC and PLC),
qualified tradespersons (metal fabrication, machinists, heavy equipment operators), and
engineers with various specializations to name a few. Manufacturers in the region are also
challenged to find individuals with LEAN training or backgrounds and other specialized
skills related to electronics and a range of positions requiring soft skills (i.e. communication,
collaboration, teamwork, and cross-cultural negotiation).
There is also a general concern expressed by companies that there is a lack of qualified
candidates in the region with sufficient technical experience and education (e.g. electrical
and mechanical engineering and the operation of CNC and PLC equipment as noted above)
to effectively operate within local manufacturing environments.
2. Quality and Availability of Training
Manufacturers responding to the survey and providing comments through the interview
process are generally dissatisfied with the quality and availability of training in the region
and more broadly in the province. Manufacturers question the quality of graduates of BC's
educational institutions and their readiness to work on the job in a manufacturing

7 | P a g e
environment. As a result employers find themselves having to invest a great deal of time
and money for internal training which has an impact on productivity and, in some cases, on
profitability. Manufacturers cite a lack of collaboration on the part of BC's educational
institutions as a part of the problem and are concerned that institutions are not working
with industry to understand their needs and customize programs to address these needs.
It is important to note that in this phase of the labour market partnership sector partners
did not raise these issues with representatives from post-secondary institutions directly.
Given the importance of this issue to both the region's manufacturers and post-secondary
institutions, efforts to achieve greater communication and collaboration between industry
and the post-secondary education system will be initiated as a part of the work undertaken
in Phase 3.
3. The Changing Nature of the Workforce
Manufacturing companies in the region are feeling the impacts of working with a mix of
generations from 20 year olds to those beyond 65 and this presents significant operational
and training challenges. The ability of companies to adapt to the shifting expectations of a
diverse workforce while at the same time maintaining a culture that values high levels of
performance and quality is also a challenge. Attracting and retaining workers was also
mentioned as a significant issue that is impacting VI/Coastal manufacturers.
While the data collected as a part of this LMI research study suggests that VI/Coastal region
manufacturers are not entirely satisfied with post-secondary programs in the region companies
acknowledge the importance of defining their needs in ways which enable post-secondary
institutions to respond to their needs.
Regional manufacturers are very interested in working with BC institutions and involving them in
the design of offerings that address specific high priority needs. Companies recognize the
importance of speaking with a single voice so that post-secondary institutions are not trying to
respond to individual company needs. It has been difficult for institutions to adapt their programs
to meet the needs of individual companies since typically the volume that is necessary to justify the
development of customized training solutions has not been present.
To overcome the barriers that were identified through this LMI research project and to help the
manufacturing sector in the region grow and become more productive, it is important for
manufacturers, the region’s post-secondary institutions, and government to collaborate to address
the important skills gaps that have been identified. Collaboration needs to look different than it has
in the past. Industry must be seen as an equal partner with institutions. Government has (through
initiatives such the Canada-BC Job Grant Program) played an important role in providing support
and removing barriers that inhibit the creation of training programs that will address high priority
skills issues identified by industry. These efforts need to continue and expand.
Manufacturers in the region are action oriented and want to move forward on addressing the issues
that they raised. They suggested a number of strategies in three areas: improving the quality of

8 | P a g e
training, supporting and promoting regional manufacturers, and increasing collaboration among
regional manufacturers.
Preliminary strategies identified through this LMI research project including the potential
development of a Manufacturing Centre of Excellence can be used to create the collaborative
framework that is needed by the manufacturing sector in the region. Structures, mechanisms and
details concerning how to move forward on strategies will be undertaken as a part of Phase 3 of the
LMP with the VI/Coastal manufacturing sector.

9 | P a g e
1. Introduction - About this Report During 2015, Harbour Digital Media (HDM) collaborated with manufacturers on Vancouver Island
and with the support of the Ministry of Jobs, Tourism, and Skills Training established a labour
market partnership (LMP) for the Vancouver Island/Coastal region. During Phase 1 of this
partnership, the Vancouver Island Manufacturing sector Advisory Board (VIMAB) was established
as a part of the engagement strategy for the sector. The Advisory Board consists of manufacturers
from a number of manufacturing sub-sectors including food, metal, fabricated metal, machinery,
electrical, plastics, and transportation manufacturing.
Phase 2 of the LMP for the region involved the analysis of existing labour market information and
the collection of data from employers in the region using an online survey tool and through a series
of interviews with key manufacturing sector executives and managers. This report provides
highlights of the key labour market issues that emerged from that research.
2. Overview of the LMI Research Project
2.1. Research Methodology
Research undertaken in Phase 2 is consistent with best practice social science research methods
and survey design, and includes both quantitative and qualitative methods and analysis. The
approach involved a triangulation of primary and secondary data sources. This was done to
determine the degree to which the information from these sources provides a consistent view of
current labour market issues affecting the manufacturing sector of the Vancouver Island/Coastal
region.
The research approach taken for this project included:
A review of selected relevant literature;
A review of existing secondary data sources;
Development of a company database focused on companies with 10 or more employees1;
Development, administration, and analysis of an online survey; and
Development of an interview protocol including conduct and analysis of a set of interviews.
2.2. Research Questions
The following set of research questions was developed in consultation with the Vancouver Island
Manufacturing Advisory Board (VIMAB). These questions were used to frame both the secondary
and primary research and to frame the literature review.
1. What types of businesses are included in the Vancouver Island/Coastal region
manufacturing sector? How many people do they employ and what is the nature of the
economic activity that they engage in (i.e. output in terms of GDP)? What sub-sectors are
1 Although the target audience for the online survey was companies employing 10 or more employees it was often not possible to determine company size prior to approaching them to complete the survey.

10 | P a g e
included in the island/coastal region manufacturing sector? NOTE: Both NOC
(occupational) and NAICS (industry) codes will be used in this analysis.
2. What are the characteristics of the workforce that is employed in the manufacturing sector
in the Vancouver Island/Coastal workforce region? (Workforce characteristics include, age,
gender, education and training levels, certification requirements, workforce occupational
breakdown, length of service, etc.)
3. What are the current labour market conditions and outlook for the Vancouver
Island/Coastal region?
4. What are the short term and long term issues affecting the manufacturing sector in the
Vancouver Island/Coastal region?
5. What are the key trends affecting the skill requirements of employers in the region? What future trends will affect the labour market for manufacturers in the Vancouver Island/Coastal region?
6. What cross-generational issues are the region's employers observing in the workplace (i.e.
what are the differences attitude towards work that employers observe between long-term
and newer employees; what differences are observed in a multi-generational workplace;
how has the 'non-retirement' of the workforce affected productivity?)
7. To what extent are recruitment and retention issues for manufacturing sector employers in
the region?
8. What are the most common recruitment and retention barriers experienced by
manufacturing sector employers in the region?
9. What are the most common education, training, and skills gaps experienced by
manufacturing sector employers in the region?
10. To what extent do the region's employers observe skills gaps in their employees in the
following areas:
a. Business knowledge and/or business acumen?;
b. Knowledge and application of LEAN manufacturing processes?;
c. Ability to lead change?;
d. Ability to take accountability for actions?;
e. Ability to communicate effectively?; and
f. Ability to meet industry-specific trades requirements?.
11. What are the observed skills gaps?
12. How do employers intend on addressing the observed skills gaps?
13. To what extent are the region's employers interested in the development of a sector-wide,
customized, and coordinated approach to program development to address identified
needs?
14. Are manufacturing sector employers in the region interested in working with training
providers to establish:
a. Common metrics to assess return on training investment (i.e. assess the linkage
between training and improved efficiency and productivity)?;
b. Programs to deal with cross-generational issues in the workplace?; and
c. Sector information resources (i.e. information about and for the sector)?

11 | P a g e
2.3. Sector Analysis: Background Research
2.4. Selected Research Literature
An important part of research into the manufacturing sector in the Vancouver Island/Coastal
Region is a consideration of other recent studies and commentary, particularly those that consider
the relationship between skills gaps, training and learning, and company performance. This brief
review focuses on recent research from British Columbia, Canada, the United States, Australia, the
UK, New Zealand, and other international sources which looks at these issues. In the Canadian
context a range of other issues are also presented.
2.4.1. Canada
The most recent LMI research study directly related to the BC manufacturing sector was
undertaken in 2012 by the BC branch of the Canadian Manufacturers and Exporters organization.
While discussion concerning manufacturing in the Vancouver Island/Coastal region is limited there
are a number of the conclusions reached by the CME that are worth noting since they have
implications for manufacturers in the VI/Coastal region. The conclusions that are most relevant
are:
Employers, selected experts and secondary sources anticipate that conditions will likely
tighten somewhat over the next few years, which could create shortages amongst skilled
workers and semi-skilled workers. Growth of existing manufacturing operations and the
aging of the workforce are contributing factors. (Canadian Manufacturers and Exporters
British Columbia, 2012, p. iii);
Manufacturing in BC is growing at a rate of 1.3 to 3% per year in terms of employment and
this means that the sector will need to attract upwards of 88,000 new workers by 2020. (p.
iv);
Occupational skills shortages will likely be most significant in the trades (journeypersons),
managers and supervisor positions, technicians, engineers, and machine operators and
assemblers. (p. v);
Some shortages will result from simply not having enough workers with the needed
education, training or certifications (e.g. an anticipated shortage of engineers or
journeypersons in particular trades). However, most shortages will be a consequence of the
fit between the experience, education or training of applicants and the unique needs of the
employer. (p. vi); and
The future strength of the manufacturing sector in BC will be determined, in large part, by
the ability of the sector to attract, develop and retain skilled workers and improve
productivity. (p. vii)
Other Canadian studies have looked more broadly at the manufacturing sector in Canada and how it
has grown and evolved and the key issues that it faces. In spite of changing economic conditions
over the past eight years, Burt and Poulin's 2008 report on the economic and labour forces facing
Canada's manufacturing sector still contains a number of useful observations that should be
highlighted. The key issues highlighted are that:

12 | P a g e
Canada's manufacturing sector is "undergoing significant changes as a result of
...globalization....and the pace of technological change";
The sector faces human resources challenges including an aging workforce, a reduced
ability to attract young workers, and changing skill requirements; and
Manufacturers need to respond by undertaking more research and development and
making better use of their existing workforce. (Burt & Poulin, 2008, p. i)
2.4.2. United States
The American Society for Training and Development (ASTD) provides a number of useful insights
into the issue of skills gaps that many Amercian organizations including those in the manufacturing
sector are facing. In the US context, the ASTD has identified middle-skills industries such as
manufacturing, construction and healthcare as the ones facing the most significant skills shortages.
At the same time, high skills fields requiring engineering skills with at least an undergraduate
degree are also going to be in demand.
The trends noted by the ATSD in its report (2012) are not dissimilar to those playing out in Canada
in the manufacturing sector. Automation has transformed many manufacturing operations with the
resulted reduced demand for jobs in the sector. At the same time the types of jobs and the training
required to operate sophisticated computer driven and robotic machinery have grown. There is a
growing skills gap between the types of operational positions manufacturers have to offer and the
skills available in today's workforce.
Amercian employers are also seeing a "critical lack of soft skills – such as communication,
collaboration, creativity, and critical thinking in today's workforce" (p. 7). The kind of skills gaps
observed in the US context are very familiar to BC manufacturers. The four highest ranked skills
gaps found by the ASTD were:
Leadership and executive skills;
Managerial and supervisory skills;
Industry specific skills; and
Process and project management skills.
Other significant findings in the manufacturing sector included:
Skills deficiencies in production roles are impeding the sector's ability to expand and
improve productivity;
There is less of an interest in educational options that lead to careers in the manufacturing
sector; and
Manufacturing careers are not being promoted as a viable career choice by parents and
teachers.
As a result of findings such as these, the Manufacturing Extension Partnership within the US
Department of Commerce was established to address the skills gap and other related issues for the
manufacturing sector. They have been doing this through a series of leadership institutes that

13 | P a g e
teach "manufacturers and their key employees the importance of innovation and how to instill it in
to the culture of their company, so that every manufacturing employee is innovating in their job
every day". (p. 18)
2.4.3. Europe
A number of recent European studies have focused on the relationship between skills development
and business performance.
Patrignani and Conlon (2012), provided an overview of the impact of training undertaken at the
firm or company level on productivity. In their review of relevant research three studies were
found that demonstrated an impact on productivity that was greater than that on wages. Put
another way productivity increases at a company level were greater than the increase of wages for
better trained employees. While the link between productivity and training investment is often
intuitively thought to exist, the authors wanted to test the linkage through longitudinal research
over a timeframe of at least four years. At the time of writing this report, this research is still
underway but it does hold promise and would be useful to consider replicating it within the
Canadian manufacturing sector.
One longitudinal study that has considered the relationship between company training and
company profitability was reported in 2014 by Kim and Ployhart. Their study integrates research
from strategy, economics, and applied psychology to examine how organizations may leverage their
human resources to enhance company performance and competitive advantage.
The authors used 12 years of longitudinal profit data from 359 UK companies and concluded that
selective staffing and internal training directly and interactively influence company profit growth
through their effects on labour productivity. This finding implies that staffing and training
contribute to the generation of slack resources that helped the company buffer and then recover
from the effects of the Great Recession. The study also concluded that internal training that creates
specific human capital resources is more beneficial for prerecession profitability, but staffing is
more beneficial for post-recession recovery, apparently because staffing creates generic human
capital resources that enable firm flexibility and adaptation. Staffing and training are key human
resource management practices that can be used to achieve company performance through
acquiring and developing human capital resources.
Gosling (2009) in a position paper for the City and Centre for Skills Development (an independent
not-for-profit research centre) also explored the links between skills and business performance. It
also considers how training should be tailored, together with the way in which it interacts with
other factors impacting on business performance. In her paper, she cites the work of the New
Zealand Workplace Productivity Working Group (p. 2) and highlights a number of key drivers of
productivity. These are:
Building leadership capability to inspire others to pursue opportunities, and building
management capability to enable adaptation to a changing environment, including
organizational and management skills, people and communication skills, and learning
through experience;
14 | P a g e
Creating productive workplace cultures in which engaged employees are willing to ‘go the
extra mile’;
Encouraging innovation and the use of technology, leading to higher productivity, greater
market share and employment growth;
Investing in people and skills to enable innovative behaviour and the use of higher levels of
technology;
Organizing work to extract the greatest value out of firms’ investment in new technology
and skills, work processes and/or products and services, including ensuring that the
activities which create value within a firm are aligned with overall business strategy;
Networking and collaborating to help share good practice and improve the exchange of
knowledge and ideas; and
Measuring what matters; there ‘needs to be a commitment to measurement throughout the
firm(company) and to communicating the results in a transparent way that relates
individual and team performance to the overall business performance and helps employees
to take leadership roles in making appropriate changes to improve productivity’. (Harvey &
Harris, 2008, pp. 15-16)
Gosling (p. 4) also comments on a number of other aspects of training that are likely to have an
impact on business performance. These are:
The tailoring of staff training plans to business strategy;
The balance of training given between basic, soft, generic and technical skills development;
The extent to which training is bespoke/standard, delivered in-house/externally, is
delivered in conjunction with other businesses in the sector, whether it is directed at admin
staff/technicians/middle management/senior management;
The ability of managers to follow up on the training received by their team members both to
ensure it is being implemented and to identify what further training is needed;
Quality assessment given to training packages; and
The length and breadth of training, including whether it is incremental or one-off.
The International Labour Office (ILO) of the OECD has published numerous reports that link skills
and training to growth and development of various sectors of the economy. G20 partners have
adopted a framework for sustainable development and growth that acknowledges the role of skills
development. The G20 has been working with the ILO on a training and development strategy that
involves employers and workers. What is of greatest interest in relation to the current LMI
research is the sectoral approaches or strategies that the ILO has built through a consensus process.
The key elements of the strategies proposed are:
The importance of basing sectoral skills development strategies on close collaboration
between partners at the national and local levels;

15 | P a g e
Using sectoral councils to match a sector's demand for skills with training provision,
anticipate future labour market needs, and assess the quality and relevance of training
programs;
Recognize each stakeholder's roles, rights, and responsibilities in promoting a life-long
learning approach to meet the sector's skill needs; and
Embed sectoral approach to skills development with long-term national growth strategies.
This can effectively link national [or provincial and federal in the case of Canada] top-down
and sectoral bottom-up training strategies. (International Labour Office, 2010, p. 25)
2.4.4. Australia and New Zealand
Researchers and organizations in Australia and New Zealand have also been considering the
relationship between skills development, skills gaps and company productivity. Harvey and Harris
(2008), reviewed the literature related to links between skills, their application and productivity
and arrived at three conclusions:
Improved productivity and organizational performance has been attributed to a number of
“interventions”: better training, enhanced managerial capability, employee engagement,
improved employee recognition and reward, innovative production practices and more. The
key finding is that any one intervention is likely to have limited impact. In other words, the
additive effects of interventions must be recognized;
Interventions of this nature do add cost. They are more likely to add value in firms that have
a competitive strategy based on the delivery of high-value products and services, and to
have limited (or net negative) returns in high volume business models that rely on
minimizing cost; and
It is not just the nature of the interventions that matter, but the manner in which they are
deployed. (Harvey & Harris, 2008, p. 10)
The Australian Workforce and Productivity Agency has also undertaken a review of literature that,
among other issues, looked at the effect of learning/training on company productivity. The key
findings outlined by the Agency in its 2013 report are:
The association between learning and productivity is not as well established at the company
level but in general there is a positive correlation between learning and productivity;
Foundation skills are likely to have the largest impact on productivity. These skills provide
the basis for further learning and productive activity in workplaces. Studies examining
interventions designed to develop foundation skills highlight that they are also some of the
most difficult skills for adults to develop; and
Management and leadership skills contribute to productivity by improving resource
allocation within firms. In particular, research suggests that management and leadership
skills are associated with improved firm performance and rates of innovation. For example,
one way that good management contributes to productivity is by ensuring that skills are
properly utilized within workplaces and are complemented by technology.

16 | P a g e
2.5. Secondary Background Data
Secondary research using existing data sources was conducted as a way of describing the
manufacturing sector for British Columbia and to look for information that specifically referred to
the Vancouver Island/Coastal region. Documents used in this review process are listed in the
reference section of this document.
Secondary research provides useful background information that was used to inform the
development of the online survey and interview questions that were posed to manufacturers in the
Vancouver Island/Coastal region. The primary and secondary data taken together help to
determine the issues facing VI/Coastal region manufacturers and will be used as the basis for
developing strategies to address issues. These strategies will be developed as a part of the third
phase of this labour market partnership.
2.5.1. Number and Size of Manufacturing Companies
The North American Industry Classification System (NAICS) is used to classify the manufacturing
industry into a set of sub-sectors. These sub-sectors provide a useful way of considering the
breadth of manufacturing activity in the province. The following table provides a list of the NAICS
codes for the 20 manufacturing sub-sectors that were of interest in this LMI research project.
Table 1: Manufacturing Industry by NAICS Codes
Manufacturing Sub-sectors NAICS Codes2
Food manufacturing 311
Beverage and tobacco product
manufacturing
312
Textile mills 313
Textile product mills 314
Clothing manufacturing 315
Leather and allied product manufacturing 316
Wood product manufacturing 321
Paper manufacturing 322
Printing and related support activities 323
Petroleum and coal product manufacturing 324
Chemical manufacturing 325
Plastics and rubber products manufacturing 326
Non-metallic mineral product
manufacturing
327
Primary metal manufacturing 331
2 Source: Statistics Canada
http://www23.statcan.gc.ca/imdb/p3VD.pl?Function=getVD&TVD=118464&CVD=118465&CPV=31-
33&CST=01012012&CLV=1&MLV=5

17 | P a g e
Manufacturing Sub-sectors NAICS Codes2
Fabricated metal product manufacturing 332
Machinery manufacturing 333
Computer and electronic product
manufacturing
334
Electrical equipment, appliance and
component manufacturing
335
Transportation equipment manufacturing 336
Furniture and related product
manufacturing
337
Innovation, Science and Economic Development Canada (formerly Industry Canada) routinely
collects data on the number and size of companies according to their NAICS codes. The following
table3 shows the number of manufacturing businesses by province in four size categories. The
primary research for this project was targeted at a sub-set of BC manufacturing companies (i.e.
those with 10 or more employees). Estimating the size of the population of companies for the
Vancouver Island/Coastal region was challenging since region-specific data was not available.
More will be said about this later in the section of this report dealing with the online survey results.
Table 2: Number and Size of Manufacturing Companies in Canada by Province
Number of employer establishments by employment size category and province/territory: December 2014
Manufacturing (NAICS 31-33)
Province or Territory
Employment Size Category (Number of employees)
Micro 1-4
Small 5-99
Medium 100-499
Large 500+
Alberta 1,906 3,128 297 23
British Columbia 2,880 3,957 304 16
Manitoba 401 911 99 15
New Brunswick 314 486 72 7
Newfoundland and Labrador 144 240 44 3
Northwest Territories 1 14 0 0
Nova Scotia 370 594 69 5
Nunavut 1 4 0 0
Ontario 7,098 11,709 1,364 134
Prince Edward Island 75 124 18 0
3 Source: Innovation, Science and Economic Development Canada
https://www.ic.gc.ca/app/scr/sbms/sbb/cis/establishments.html?code=31-33&lang=eng

18 | P a g e
Number of employer establishments by employment size category and province/territory: December 2014
Manufacturing (NAICS 31-33)
Province or Territory
Employment Size Category (Number of employees)
Micro 1-4
Small 5-99
Medium 100-499
Large 500+
Quebec 4,536 8,111 817 71
Saskatchewan 358 673 60 2
Yukon Territory 13 17 0 0
CANADA 18,097 29,968 3,144 276
Percent Distribution 35.2% 58.2% 6.1% 0.5%
2.5.2. Employment in Manufacturing
Overall employment in the manufacturing sector in BC has been relatively stable over a 6 year
period (2011 – 2015) as reported by BC Stats4. As can be seen in the following table, food and wood
product manufacturers employ the greatest numbers. The annual average growth rate for the
manufacturing sector in British Columbia over the 6 year period was 1.5%. In the two years for
which sector data is available, the growth rate was 5.2%.
Table 3: BC Employment by Manufacturing Sub-sector (2010-2015) (in thousands)
Manufacturing Sub-sector 2010 2011 2012 2013 2014 2015
%age change (2014-15)
Food Manufacturing 20.6
22.6
24.6
21.9
21.9 26.6 21.5% Beverage and
Tobacco Product Manufacturing 4.3
6.1
4.4
4.8
6.2 6.4 3.2%
Textile Mills & Textile Product Mills 2.1
2.2
-
-
2.6 - -
Clothing Manufacturing & Leather & Allied Production 3.2
4.4
3.6
3.1
4.2 3.3 -21.4%
Wood Product Manufacturing 30.8
29.4
25.2
26.4
29.3 36.0 22.9%
Paper Manufacturing 9.4
8.7
11.4
10.5
12.2 10.1 -17.2% Printing and Related
Support Activities 6.0
7.3
7.9
6.5
5.5 8.5 54.5%
4 Source - BC Stats:
http://www.bcstats.gov.bc.ca/StatisticsBySubject/BusinessIndustry/BusinessCountsEmploymentByIndustry.aspx

19 | P a g e
Manufacturing Sub-sector 2010 2011 2012 2013 2014 2015
%age change (2014-15)
Petroleum and Coal Products Manufacturing 1.8 -
-
-
- - -
Chemical Manufacturing 4.8
4.4
6.5
6.5
7.1 8.7 22.5%
Plastics and Rubber Products Manufacturing 3.8
4.1
4.5
6.4
4.3 4.8 11.6%
Non-Metallic Mineral Product Manufacturing 6.7
6.8
5.8
4.6
5.1 5.0 -2%
Primary Metal Manufacturing 6.7
5.8
5.5
5.0
2.3 5.0 117.4%
Fabricated Metal Product Manufacturing 12.2
11.2
13.8
11.1
12.3 15.7 27.6%
Machinery Manufacturing 7.0
9.0
9.7
9.4
8.6 7.9 -8.1%
Computer and Electronic Product Manufacturing 6.9
6.2
7.0
6.2
8.0 7.2 -10%
Electrical Equipment, Appliance & Component Manufacturing 2.4
1.7
3.9
2.9
3.8 3.6 -5.3%
Transportation Equipment Manufacturing 8.6
8.8
10.9
8.5
9.6 8.2 -14.6%
Motor Vehicle, Body, Trailer & Parts Manufacturing 2.6
4.3
3.6
4.0
4.2 3.9 -7.1%
Other Transportation Equipment Manufacturing 6.0
4.5
7.3
4.5
5.4 4.3 -20.4%
Furniture and Related
Product Manufacturing
4.9
6.5
7.9
6.9
7.6
3.9
-48.7%
Miscellaneous Manufacturing 12.5
11.0
9.9
9.8
10.0 10.0 0%
Totals 163.3 165.0 173.4 159.0 170.2 179.1 5.2%

20 | P a g e
BC Stats5 reports provide limited data related to employment in manufacturing Vancouver
Island/Coastal region. The following table provides an overview of employment in the region for
four sub-sectors of manufacturing with the greatest employment. The percentage change over the
2014/15 timeframe is deceiving and should be interpreted cautiously given the lack of availability
of data from other sub-sectors. When only these four sub-sectors are considered the average
change in employment during this period is -1.0%. The growth rate over the 6 year period is -2.4%
which is less than the overall growth rate for the sector across the province. As noted above, the
average provincial annual growth rate for the sector was +1.5%.
Table 3: VI/Coastal Region Manufacturing Sector Employment 2010 – 2015 (in thousands)
Manufacturing Sub-sector 2010 2011 2012 2013 2014 2015
%age change (2014-15)
Food Beverage and Tobacco Product Manufacturing 2.9 2.0 2.8 1.7 3.1 2.7 -14.8%
Wood Product Manufacturing 3.3 4.0 3.1 2.6 3.4 2.9 -17.2%
Paper Manufacturing 3.5 3.3 3.1 3.0 3.4 2.5 -36.0% Transportation
Equipment Manufacturing 1.6 2.1 2.0 1.8 - 1.7 N/A
Totals 11.3 11.4 11.0 9.1 9.9 9.8 -1.0%
Employment in the manufacturing sector represents the four national occupation classification
categories (i.e. NOC skill levels A, B, C, and D). Percentages of employees in each category are
broadly known for the Canadian employed population but a breakdown for the manufacturing
sector is not available. In terms of the Canadian employed population, 29.9% are employed in
positions that require NOC skill level A (management and professional occupations requiring a
university degree), 31.5% in NOC skill level B positions (positions requiring college education or
apprenticeship training), 27.7% in NOC skill level C positions (secondary school or occupation-
specific training), and 11% in NOC skill level D positions (positions requiring on-the-job training)6.
The British Columbia 2025 Labour Market Outlook report7 indicates that many of the occupations
that manufacturing companies employ are ones where demand will be high over the next nine
years. These occupations include engineers (with various specializations), computer programmers,
and customer service representatives.
5 Source: BC Stats: http://www.bcstats.gov.bc.ca/StatisticsBySubject/BusinessIndustry/BusinessCountsEmploymentByIndustry.aspx 6 Sources: Statistics Canada: http://www12.statcan.gc.ca/nhs-enm/2011/as-sa/99-012-x/99-012-x2011002-eng.cfm - 2011 Census See also http://www.statcan.gc.ca/pub/12-583-x/12-583-x2011001-eng.pdf for detailed classification of occupations (NOC descriptions) 7 See (Government of British Columbia - WorkBC, 2016)

21 | P a g e
Overall, the British Columbia 2025 Labour Market Outlook report indicates that 52,200 job openings
(due primarily to replacement and a small amount of expansion (i.e. 900 jobs) can be expected in
the manufacturing sector across the province over the 2015 – 2025 period. Food manufacturing
and wood product manufacturing are expected to "post the largest numbers of job openings" in the
next 9 years (p. 18). The manufacturing sector in British Columbia represents 7.5% of total
employment or approximately 175,000 jobs.
The general outlook for the Vancouver Island/Coastal region in terms of job growth across all
sectors/industries is positive with an anticipated 147,900 job openings to 2025. However, the
number of jobs related manufacturing in the Vancouver Island/Coastal region is expected to decline
from 30,238 to 25,615 workers which is an 18% drop. A detailed review of the data underpinning
the British Columbia 2025 Labour Market Outlook report indicates that from 2016 through 2025, the
following manufacturing job categories are expected to experience the greatest decline in the
region:
Facility operations and maintenance (45% decline)
Industrial electricians (37% decline);
Wood processing machine operators (32% decline)
Wood products assemblers and inspectors (25% decline)
Power engineers and power systems operators (46% decline)
Pulp mill machine operators (50% decline)
Pulping, paper making and coating control operators (51% decline)
Sawmill machine operators (28% decline)
Supervisors, forest products processing (38% decline)
Many of the jobs listed above are in traditional manufacturing wood and pulp and paper industries.
A small number of job categories related to manufacturing are expected to grow in the region but
only very modestly over the timeframe outlined in the report. These include:
Administrative officers (3% growth)
Corporate sales managers (3% growth)
Fish and seafood plant workers (4% growth)
Industrial painters, coaters, and metal finishing process operators (3% growth)
Labourers in food, beverage and associated products processing (4 % growth)
Products assemblers, finishers and inspectors (4.5% growth)
Process control and machine operators (food and beverage) (4% growth)
Residential and commercial installers and servicers (3% growth)
Senior managers (3% growth)
Structural metal and platework fabricators and fitters (6% growth)
Technical sales specialists (3% growth)

22 | P a g e
Highlights of the British Columbia 2025 Labour Market Outlook report are also outlined on the
WorkBC8 website.
2.5.3. Economic Data
During the period of 2010 through 2015, the value of the manufacturing industry to the BC
economy has been constant with the 2014-15 year over year growth outpacing manufacturers in
the other major provinces (i.e. Alberta, Ontario, and Quebec) in Canada. The following table shows
the growth patterns in GDP for provinces and territories. As pointed out by Statistics Canada, GDP
is an important measure of the short term stability or instability of the economy.
Table 4: Gross Domestic Product and Growth
Gross Domestic Product by province: 2010 - 2015 Manufacturing (NAICS 31-33)9
Value in chained 2007 $ (millions)
% Change
Province or Territory 2010 2011 2012 2013 2014 2015 2014 - 2015
Newfoundland and Labrador
932
910
1,022
987
937
985 4.8%
Prince Edward Island
371
376
393
430
475
479 0.9%
Nova Scotia
2,705
2,763
2,651
2,562
2,532
2,626 3.6%
New Brunswick
2,884
2,870
2,794
2,883
2,746
2,864 4.1%
Quebec
43,237
43,849
43,944
43,858
45,250
45,720 1.0%
Ontario
72,846
74,958
76,494
75,567
78,399
79,572 1.5%
Manitoba
4,876
5,176
5,376
5,560
5,579
5,472 -2.0%
Saskatchewan -2.9%
8 See https://www.workbc.ca/Labour-Market-Information/Regional-Profiles/8#section-overview 9 Source: Statistics Canada. Table 379-0030 - Gross domestic product (GDP) at basic prices, by North American Industry
Classification System (NAICS), provinces and territories, annual (dollars)
http://www5.statcan.gc.ca/cansim/a26?lang=eng&id=3790030

23 | P a g e
Gross Domestic Product by province: 2010 - 2015 Manufacturing (NAICS 31-33)9
Value in chained 2007 $ (millions)
% Change
Province or Territory 2010 2011 2012 2013 2014 2015 2014 - 2015
3,306 3,506 3,710 3,965 3,940 3,830
Alberta
16,095
17,766
17,746
18,238
18,828
17,520 -7.5%
British Columbia
13,255
13,710
14,115
14,120
14,625
14,996 2.5%
Yukon
15
17
21
14
14
14 -0.7%
Northwest Territories
6
11
11
12
10
11 4.7%
Nunavut
3
2
7
8
8
8 -5.3%
2.6. Sample Company Profiles
Manufacturers in the Vancouver Island/Coastal region represent a diverse array of manufacturing
processes and products. The following company profiles illustrate the range of activity that is
taking place in the sector in the region.
2.6.1. Viking (Victoria) (Transportation Equipment Manufacturing – NAICS 336)
Viking is the manufacturer of the Series 400 Twin Otter, the best-selling next generation turbo-prop
aircraft in its class. Viking aircraft have been sold and delivered to 26 countries worldwide, with the
company providing OEM support for the global fleet of de Havilland legacy aircraft (DHC-1 through
DHC-7).
In 2012, Viking received the award for Exporter of the Year along with the Premier’s Award for Job
Creation at the BC Export Awards, hosted by the Canadian Manufacturer and Exporters (CME). With
a current production rate averaging one new aircraft delivered every 15 business days, the Twin
Otter Series 400 is now confirmed as the best-selling next generation 19-passenger aircraft
available today.

24 | P a g e
2.6.2. Reliable Controls (Victoria) (Computer and Electronic Product Manufacturing – NAICS
334)
Reliable Controls Corporation is a privately held, Canadian corporation that designs, develops, and
manufactures Internet-connected building controls. The products are used to monitor and control
the energy of mechanical and electrical equipment found in every kind of building.
The company has grown steadily as a high tech manufacturer, and currently serves over 150
Authorized Dealers in 20 countries around the world. In 2008, Reliable Controls Authorized Dealers
were awarded over 130 million dollars in controls contracts. Over 2 million points of measurement
and control are hardwired to Reliable Controls products.
2.6.3. VMAC (Nanaimo) (Machinery Manufacturing – NAICS - 333)
VMAC (Vehicle Mounted Air Compressors), founded in 1986, is the world-leading manufacturer of
truck mounted mobile air compressors, used in a wide spectrum of industries: oil and gas, mining,
transportation, mobile tire service, municipal operations and public works.
Their success comes from designing and manufacturing the most compact mobile air compressors
available, which provide high power and demonstrate extraordinary quality, durability and fuel-
efficiency.
The company operates globally and has a wide international network of 400 dealers, distributing
VMAC’s products to the Americas, Europe, the Middle East, Africa, Asia Pacific and Australia.
2.6.4. Nanaimo Forest Products (Nanaimo) (Wood Product Manufacturing – NAICS 321)
Harmac Pacific operates a Northern Bleached Softwood Kraft (NBSK) pulp mill located on the east
coast of Vancouver Island near Nanaimo, British Columbia. Nanaimo Forest Products Ltd., the
owner of the Harmac Pacific trademark, restarted the mill with a single production line on October
3, 2008, producing NBSK at the rate of 226,000 tonnes per year. In 2009, a second production line
was restarted and capital upgrades in 2010 and 2011 brought the mill's production capacity up to
365,000 tonnes of pulp per year.
The Harmac mill produces high quality craft pulps made from custom blends of Douglas fir,
western hemlock, balsam fir, interior SPF and western red cedar. The pulp is sold in Asia, Europe,
North America, and Latin America. With its strategic location on a deep water port, the mill is well
situated for cost effective export of pulp and receipt of raw materials such as wood fiber.
25 | P a g e
2.6.5. Town Site Brewing (Powell River) (Beverage & Tobacco Product Manufacturing –
NAICS 312)
Townsite Brewing Inc. is a microbrewery located in the historic Townsite district of Powell River, at
the top of the Sunshine Coast.
Townsite Brewing is a local manufacturer that makes, sells, and distributes high quality craft beer
with a Belgian influence. This Powell River brewer manufactures a number of craft beers that have
received numerous awards in the highly competitive craft beer sector.
Townsite started operations in 2012 in an industry that is highly competitive but has been able to
acquire a loyal following and has grown along with the industry. B.C.’s microbreweries have
enjoyed sustained growth of more than 20 per cent a year since 2006.
2.6.6. Plastics Plus Fabricating (Campbell River) (Plastics & Rubber Products Manufacturing –
NAICS 326)
Plastics Plus Fabricating is an industry leader in all types of plastics fabrication offering design,
fabrication, rebuilds and repairs. The Campbell River based manufacturer has provided plastics
custom fabricating services since 1999 and has grown to become the most diversified plastic shop
on Vancouver Island that serves all of Canada.
Along with fabricating plastics, HDPE pipe docks and projects for their clientele they cut precision
plastic parts, create 2D & 3D plastic signage and business features with their Z7 CNC Machine.

26 | P a g e
3. Primary Research: Employer Survey and Interviews To undertake primary survey and interview research for the manufacturing sector in the
Vancouver Island/Coastal region it was necessary to first develop a database of manufacturing
companies operating in the region, their size (in terms of number of employees), and the type of
manufacturing conducted (as defined by the North American Industry Classification System or
NAICS). Developing the database involved contacting all of the municipal authorities, Chambers of
Commerce and Economic Development Agencies in the region to acquire lists of licensed
businesses. These lists were then reviewed and potential manufacturers that could be contacted
(i.e. an email, web URL and/or telephone number could be found) were included in a final list. This
list was used as the basis for email contact with key personnel concerning the online survey. A total
of 169 companies were included in the list as potential respondents to the online survey or for in-
person interviews (see Appendix 1 for a list of the companies in the database and their location).
An initial email was sent on April 25, 2016 to the manufacturers included in the database. This was
followed by reminder emails and phone calls on a weekly basis until June 2, 2016. The online
survey was closed on June 10, 2016. A total of 64 responses10 were received to the online survey
which took respondents 45 minutes on average to complete. This resulted in a completion rate of
40.25%11 which given the nature of the business operations surveyed and their size is quite high.
One hour interviews with 16 key company executives and senior managers were conducted
between April 25 and June 7, 2016. The companies involved in these interviews represented a
cross-section of the manufacturing sector in the region. A list of the companies involved in the
interviews is provided in Appendix 2.
3.1. Online Survey Results12
3.1.1. Background of Companies Responding to the Survey
The 64 individuals completing the online survey represented companies in 14 sub-sectors of the
manufacturing sector as shown in Table 1 below.
Table 5: Vancouver Island/Coastal Region Manufacturers Responding to the Online Survey
Manufacturing Sub-sectors by NAICS code
Number of Respondents13
Percentage of Respondents
Food manufacturing (311) 5 6.25
Beverage and tobacco product manufacturing (312)
2 2.5
10 In two cases more than one contact from a company completed the survey. Review of these cases suggested that the responses were unique and so they were retained in the database of responses. One company did not self identify. 11 The Canadian Manufacturers and Exporters (albeit with a larger province-wide sample) reported a survey completion rate of approximately 16% (see (Canadian Manufacturers and Exporters British Columbia, 2012)) 12 It is important to note that in some cases the number of respondents for a specific question is less than the total number of respondents to the survey as a whole (i.e. although there were 64 company responses some questions were responded to by less than that number; graphs and tables reflect the actual number of responses received) 13 Respondents could select more than one sub-sector so the total number of respondents exceeds the number of companies responding to the survey.

27 | P a g e
Manufacturing Sub-sectors by NAICS code
Number of Respondents13
Percentage of Respondents
Clothing manufacturing (315) 2 2.5
Wood product manufacturing (321) 6 7.5
Chemical manufacturing (325) 1 1.25
Plastics and rubber products manufacturing (326)
1 1.25
Non-metallic mineral product manufacturing (327)
1 1.25
Fabricated metal product manufacturing (332)
10 12.5
Machinery manufacturing (333) 12 15
Computer and electronic product manufacturing (334)
7 8.75
Electrical equipment, appliance and component manufacturing (335)
6 7.5
Transportation equipment manufacturing (336)
4 5
Furniture and related product manufacturing (337)
1 1.25
Miscellaneous manufacturing (339) 4 5
Other 18 22.5
Total 80 100
The most predominant types of manufacturing activity reported are machinery manufacturing
(15%) and fabricated metal product manufacturing (12.5%). Respondents who indicated 'other'
included manufacturers that are engaged in the following types of manufacturing activities:
Aquaculture net manufacturing
Aerospace
Biotech equipment manufacturing
Window manufacturing
Personal care products
Semi-conductor sensor manufacturing
Plastic fabrication
Ship building/manufacture
Manufacturing companies in the region have generally been in operation in the region for some
time with most reporting that they have been in business for over 20 years. The following figure
provides an overview of the time companies have been operating in the region.

28 | P a g e
Figure 1: Length of Time in Operation in the VI/Coastal Region
Company size varied from large operations with over 500 employees to smaller companies with 13
reporting that they have fewer than 10 employees. Although these companies were not originally
part of the target audience, they represent a number of unique manufacturing sub-sectors so they
were retained as a part of the analysis. The following figure illustrates the range of manufacturing
company size in the region.
Figure 2: Number of Workers Employed by Companies Responding to the Survey
7
9
3
9
35
0 5 10 15 20 25 30 35 40
Less than 5 years
5 to 9 years
10 to 14 years
15 to 20 years
Over 20 years
Number of Companies
5
8
11
18
0
10
4
5
0 5 10 15 20
One to four
Five to nine
Ten to 19
20 - 49
50 - 99
100 - 199
200 - 499
500 or more
Number of Companies

29 | P a g e
3.1.2. Characteristics of the Workforce
Companies were also asked to provide a breakdown of the number of male and female workers
they employ. Companies responding reported employing a total of 3108 male workers and 733
female workers which represents a ratio of 4.2 males for every female employed in the sector.
Historically, manufacturing has been a male dominated industry so this finding is not surprising.
The average company workforce reported was 64.
Manufacturing companies in the region have an expectation that their workers are well qualified
and trained. The following figure indicates the types of credentials or professional designations
that are required for jobs in the sector. As can be seen, of the 60 companies responding to the
question about required qualifications 50% reported that they require engineering degrees and
over half require some other form of credential or professional designation for work in their
companies.
Figure 3: Credentials or Professional Designations Required by Companies
In addition to professional credentials and designations, companies were asked to indicate what
percentage of their workforce is working in an apprenticeable trade and have received or are
working toward a Canadian credential such as a Red Seal trades credential. Two-thirds of the
companies reported that up to 20% of their workers are apprentices. Half of the companies
reported that up to 20% of their workers are journeypersons. Over half of the companies also have
workers who are working in a trade but are neither a journeyperson nor apprentice.
Employers were also asked about the percentage of their workforce that has received a foreign
credential. 75% of employers indicated that up to 20% of their workforce has journeyperson
credentials from another country. Two-thirds of the employers reported that they have up to 20%
30
21
11
19
33
0 5 10 15 20 25 30 35
An engineering degree
An accounting designation
A degree in business administration or MBA
Other university degree
Other credential or professional designation
Number of Companies

30 | P a g e
of their workforce working in a trade with a foreign credential but the credential is not necessarily
related to a Canadian apprenticeable trade.
The most common trades reported by Vancouver Island/Coastal region manufacturers are listed in
the following table.
Table 6: Trades Designations Reported by VI/Coastal Manufacturing Companies
Number Responding Percentage Responding
Welder 21 35
Machinist 17 28.3
Industrial Mechanic (Millwright)
6 10
Metal Fabricator (Fitter) 14 23.3
Electrician 11 18.3
Heavy Duty Equipment Mechanic
4 6.7
Sheet Metal Worker 6 10 Industrial Instrument
Mechanic 1 1.7
Truck & Transport Mechanic 3 5
Heavy Equipment Operator 2 3.3
Mechanical Assembler 9 15
Companies were asked to report the age ranges of their workforce. It is not surprising that nearly
half of the companies responding to the survey reported between one and ten employees in each of
the age ranges. What is surprising is that 26 out of 60 companies (43%) indicated that they have
workers who are 65 or older. The figure on the next page shows the breakdown of age ranges
reported by companies.

31 | P a g e
Figure 4: Age Range of Workforce
Survey respondents indicated that a total of 242 of their staff (out of a total of 3,841) would likely
retire within the next 5 years. This represents 6.3% of the total number of workers in the sample.
It should be noted that one employer in the forest products sub-sector indicated that approximately
one-third of its 300 employees would be retiring in the next five years. This company was clearly
an outlier in terms of the anticipated impact of retirement on its workforce.
Companies generally do not experience high rates of turnover in their staff. Nearly 70% of the
companies indicated that their staff turnover was between 1 and 10% during the past year. When
asked about the factors that influence staff turnover, employers found most of the reasons listed as
unimportant or very unimportant. The issues that they found important reasons for turnover were
issues such as poor work performance or attitude, seasonal fluctuation in the volume of work, and
competition for workers from employers in other regions or provinces. The figure on the next page
provides a breakdown of how companies responded to the issue of staff turnover.
None One - 10 Eleven - 20 21 - 50 51 - 100 More than
100
Under 20 years old 26 18 1 0 1 0
20 - 29 7 31 16 3 1 0
30 - 39 2 32 7 12 2 1
40 - 54 3 29 7 11 2 2
55 - 64 4 37 7 2 1 2
65 or older 12 26 2 0 0 0
0
5
10
15
20
25
30
35
40 N
um
be
r o
f C
om
pa
nie
s

32 | P a g e
Figure 5: Reasons for Staff Turnover
Although one-third of employers surveyed do not track the prior employment status of new hires,
companies that do report that most often new employees are new to the workforce (63%), have
been working in another sector (63%), or working for another manufacturing employer in the
region (57%).
3.1.3. Employer Training
Employers were asked a number of questions related to their training activities. These questions
were broken out into training activities for manufacturing operations employees and
administration and manufacturing support employees. Questions were asked about the specific
type of training that employees receive and who provides the training. The figure on the following
page provides an overview of the types of training that manufacturing operations employees
receive. For example, 58 companies reported providing new employee training.
34 30
22
13
59
39 34
17
23
16
23 19 17
23 22 23
13 14
23
6 6 3
13 8
16 19
16
33
2
13 14
25
0
9
3
17
0
8
2
11
0
10
20
30
40
50
60
70
Competition for workers
from employers in other regions or provinces
Competition for workers
from employers within the
region
Worker dissatisfaction
with their position in the
company
Issues resulting in termination
(e.g. Poor work performance;
attitude)
Issues related to immigration
status
Retirement Health Issues Seasonal fluctuation in the volume of
work
Pe
rce
nta
ge
of
Co
mp
an
ies
Very unimportant Unimportant Unsure Important Very Important

33 | P a g e
Figure 6: Training Provided to Manufacturing Operations Employees
The following figure indicates that a strong majority of companies undertake needed training as an
in-house activity. This is particularly true for new employee training, harassment prevention,
company specific technical training, and team building. Only 23% of companies indicated that they
worked with a college or technical institute for trades training.
Figure 7: Training Providers
58
36
11
22
21
21
17
13
24
23
47
0 10 20 30 40 50 60 70
New employee training
Harassment prevention/respectful workplace …
Business knowledge or business acumen
Customer service training
Training related to LEAN manufacturing or …
Certification training for a designation
Leadership training
Communication skills training
Trades training (i.e. participation in apprenticeship …
Team building
Company-specific technical training
Number of Companies Responding
0 10 20 30 40 50 60 70 80 90 100
New employee training
Harassment prevention/respectful workplace …
Business knowledge or business acumen
Customer service training
Training related to LEAN manufacturing or …
Certification training for a designation
Leadership training
Communication skills training
Trades training (i.e. participation in …
Team building
Company-specific technical training
Percentage of Companies
N/A Other
A union A certifying body
A local college or technical institute A contracted external training company
Training is provided in-house
34 | P a g e
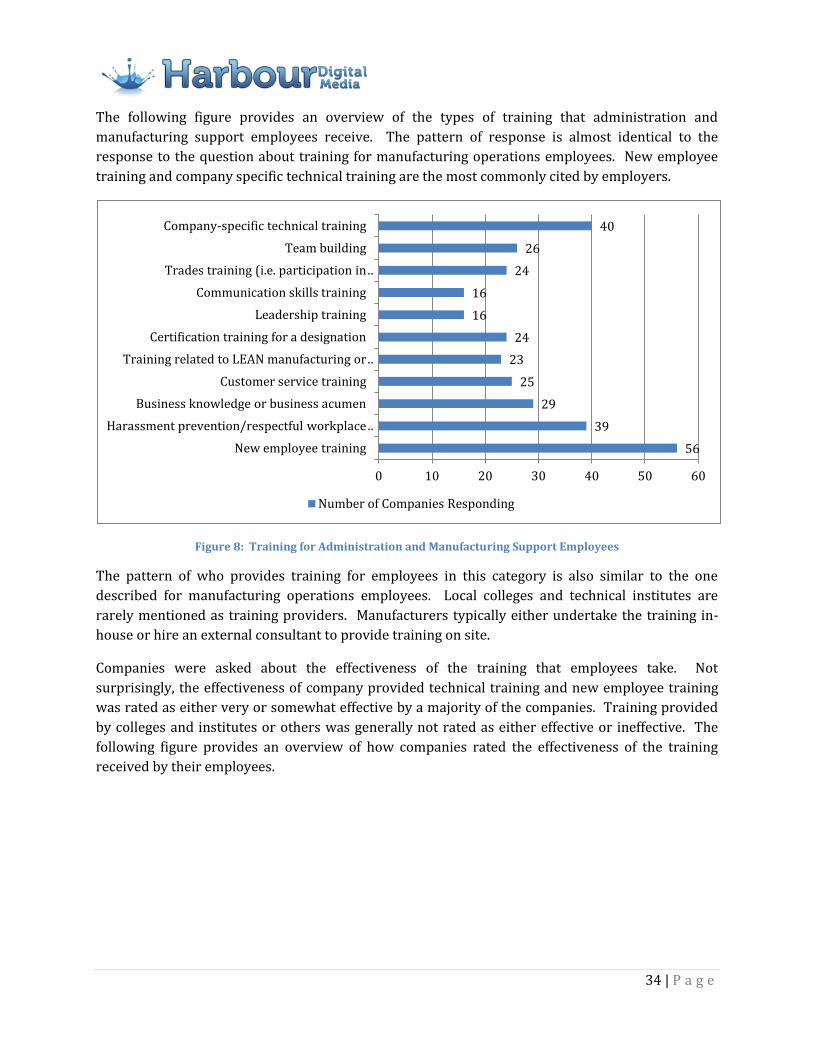
The following figure provides an overview of the types of training that administration and
manufacturing support employees receive. The pattern of response is almost identical to the
response to the question about training for manufacturing operations employees. New employee
training and company specific technical training are the most commonly cited by employers.
Figure 8: Training for Administration and Manufacturing Support Employees
The pattern of who provides training for employees in this category is also similar to the one
described for manufacturing operations employees. Local colleges and technical institutes are
rarely mentioned as training providers. Manufacturers typically either undertake the training in-
house or hire an external consultant to provide training on site.
Companies were asked about the effectiveness of the training that employees take. Not
surprisingly, the effectiveness of company provided technical training and new employee training
was rated as either very or somewhat effective by a majority of the companies. Training provided
by colleges and institutes or others was generally not rated as either effective or ineffective. The
following figure provides an overview of how companies rated the effectiveness of the training
received by their employees.
56
39
29
25
23
24
16
16
24
26
40
0 10 20 30 40 50 60
New employee training
Harassment prevention/respectful workplace …
Business knowledge or business acumen
Customer service training
Training related to LEAN manufacturing or …
Certification training for a designation
Leadership training
Communication skills training
Trades training (i.e. participation in …
Team building
Company-specific technical training
Number of Companies Responding

35 | P a g e
Figure 9: Effectiveness Ratings for Training Activities
The comments about training effectiveness revealed the rationale and thinking behind some of the
ratings. The following table provides a sample of the comments received in three categories:
comments about training providers, internal training, and LEAN and continuous improvement.
Table 7: Employer Comments about the Effectiveness of Training
Comments About Training Providers
As a provincial apprenticeship requirement our employees have to attend provincial training but
the value is not that great for what we do.
It would be nice to see a better quality standard from BC institutions.
We have had great success with UBC's Sauder School of Business for management courses. The
rest of our external training has been hit and miss.
Apprenticeship training is becoming less relevant every year. The training sessions are taking
employees away from home longer than ever before. There is no training available on Vancouver
Island in the machinist trade and the extra weeks spent in Vancouver is very expensive.
Trades training programs offered at local colleges are in need of significant updating to
contribute meaningfully to needs of employers. The Vancouver Island Construction Association
offers training that better fits our needs.
University Degree programs for professional designations provides very good preparation for
assuming job function responsibilities. Trades training provided by BC institutions develop very
New employee training
Harassment
prevention/respectful workplace
training
Business knowledge or business
acumen
Customer service training
Training related to
LEAN manufactur
ing or continuous improveme
nt
Certification training
for a designation
Leadership training
Communication skills training
Trades training
(i.e. participatio
n in apprentices
hip training)
Team building
Company-specific
technical training
Very Effective 58 30 16 22 8 20 9 13 28 17 47
Somewhat Effective 30 27 19 23 22 9 23 25 2 25 27
Neither Effective nor Ineffective 6 14 22 11 22 22 20 16 25 16 8
Somewhat Ineffective 0 0 0 0 0 0 0 2 2 2 0
Not Effective at All 0 2 3 3 5 6 5 5 6 5 2
0
10
20
30
40
50
60
70
Pe
rce
nta
ge
of
Co
mp
an
ies

36 | P a g e
good tradesmen when supported by in-house development programs. Correspondence training
for Power Engineers is effective at progressively developing individuals in this occupation. BC
has very good institutional training for defined occupations. The challenge for our business is
developing operators that run complex process control production systems. This training is done
all in-house.
Internal Training
The internal training is effective, though it has been somewhat parochial to this point. There is a
move afoot to help train line operators to complete changeovers to better utilize resources and
free-up mechanics time. This is also being done internally, and needs to be evaluated regularly.
The simple equipment set up here does not justify using external resources, except when new
equipment is installed.
We're continually having to 'in-house train' 80% of our new hires to do industry specific needs of
our company. For example, welding & fabricating. With Aluminum, the local trades and other
trades schools don't touch nearly enough on what is needed to weld, form & fabricate from
Aluminum. We also do not have access to any recent graduates locally from a Naval Architecture
program. So in turn we end up spending lots of resources & time on training engineers to adapt
to the marine manufacturing environment. All in all, the training that is provided externally for
us can end up costing us more to train new hires the way we need things to be done versus us
training in house.
Would consider going in with other companies for training to expand our training envelope and
keep costs down.
Training related to LEAN and Continuous Improvement
We have been on this Lean Journey for some time now and it seems to be taking hold finally after
splitting the company up into Value Streams, and somewhat due to a stable work force, not going
up and down with the cycles. We have had some really good training that has helped us move
down the path we want. We have a lot of resources available to us on line however very little on
the island in regards to Lean related training programs. Being a Union environment it has also
come with some challenges, specifically with the Boilermakers Union, very old school and
unfortunately it is rubbing off on the young people we have here.
Training is the key to continuous improvement. Workers who are trained to communicate and
share ideas are more likely to be hired. When you can rely on your workers to provide a safe and
effective learning environment for new workers, the company can grow and promote
experienced workers into managers who can be relied upon to carry out day to day operations.
Training is critical for any manufacturing business. We believe that although third party training
is extremely helpful, leadership on a day to day basis in terms of teaching and setting work ethic
and service (internal and external) are foundational to success. This means owners/managers
have to be well trained to ensure a healthy and successful work environment.
Many employers also stressed that on-the-job training that emphasized specific skills needed to do
a particular job were more effective than programs offered through institutions.

37 | P a g e
3.1.4. Projected Growth
Employers were asked to indicate employment growth (or decline) for their company over the past
three years. 58% indicated that employment had grown over the past three years. The breakdown
of responses to the question related to employment growth is found in the following figure.
Figure 10: Employment Growth or Decline over the past 3 years
At the same time, employers expressed optimism that their companies would, in general continue
to grow. The figure on the next page shows that more employers are expecting that the
employment levels of their company will be higher in 3 years time.
Figure 11: Anticipated Employment Levels in Next 3 Years
Employers were asked to comment on the reasons behind the growth or decline in their company's
employment. A sample of their comments is provided in the following table:
Table 8: Employer Comments Concerning Employment Growth of Decline
36
15
10
1
0 10 20 30 40
Higher than it was 3 years ago
The same as it was 3 years ago
Less than it was 3 years ago
Not sure what change has taken place
Number of Companies Responding
41
9
5
7
0 20 40 60
Higher in 3 years
The same as now
Lower in 3 years
Not sure what change will take place
Number of Companies Responding

38 | P a g e
Change in Business Model
In the past we did more manufacturing where in the future we will be doing more engineering
Business growth offset by better productivity
Company growth expanding our markets and our product lines.
Entering new markets + additional investment for R&D
Our whole premise to going to Value Streams and the Lean Journey was to be able to produce
more with the same. VELOCITY of product flow is important for us to achieve this goal. So we
have grown revenue with the same numbers we had 3 years ago and that was even with
purchasing a whole new product.
The employment is based on changing the basis of the organization through processes and
systems, to plan for a major growth initiative. This growth initiative has required some new
employees, and many with different skill sets learned elsewhere. The skill sets internally prior to
the addition of team members over the past two years were built internally, so preparing for
growth was difficult. In bring some extra resources, but certainly newer highly skilled resources
have allowed us to prepare for future growth.
Cost management; Evolution of our product line; Productivity improvements
Have added people to prepare for succession as the large demographic of aging employees moves
towards retirement.
Change in Sales
Sales growth
Increased sales
Lower sales, employee turnover
Margins have been thinner, so an increase in sales is necessary to stay in business and manage a
positive cash flow.
Increased product sales, which produce a higher demand on production.
Secured a long term contract with a particular customer which has ensured continuous work
during this period. Prior to this there was nothing tying customer to us specifically.
The housing market is strong with a lot on new and old homes selling. This generates window
sales.
General Aviation market has not fully recovered since 2009 leading to downsizing of
development staff in 2014.
Government Programs or Policy Initiatives
Government programs such as IRAP and NSERC contributed to employment growth.
The Ministry Of Forest Lands and Natural Resources has caused a major decline in our company.
We have found it harder and harder to secure fiber to support our operations and therefore had
to lay off a large number of our workers.
Company required more employees to meet work requirements for the main submarine project.
Organization is also growing in other areas/projects which required more staff as well.

39 | P a g e
3.1.5. Labour and Skill Shortages
While there appears to be a general climate of growth for the manufacturers in the region,
companies are finding it difficult to hire qualified employees in some positions. For example, 62%
of the companies reported having difficulty filling senior management positions and 56% had
similar challenges finding qualified journeypersons. Other positions that are difficult to fill are
technicians, supply chain workers, and production supervisors.
Figure 12: Difficulty in Hiring Qualified Workers
Employers indicated that they expect to have difficulty finding individuals with the required skills
in the positions outlined in the following table.
Table 9: Difficult to Fill Positions
Skill Categories Difficult to Fill Positions Journeypersons in the Trades
Journeyperson metal fabricators Carpenters Millwright Electricians Steel Fabricators Toolmakers Upholsterers
Senior Managers Experienced Plant Supervisors Senior managers
Production Supervisors Production Managers Technicians Administrative Technical Support
Sewing machine repair and seamstress CCTV Installation Technicians
Journeypersons in the
trades
Senior managers
Production supervisors
Technicians Engineers Supply chain
workers
Machine operators
and assemblers
Sales and customer
service representat
ives
Labourers Logistics
specialists Administra
tion
Not at all difficult 6 5 9 9 11 8 19 22 44 8 31
Somewhat difficult 31 31 45 42 19 45 28 27 27 27 38
Very difficult 25 31 17 11 20 8 9 16 3 13 11
Not applicable 17 16 11 20 23 17 25 16 6 30 8
0
5
10
15
20
25
30
35
40
45
50
Pe
rce
nta
ge
of
Co
mp
an
ies

40 | P a g e
Sign manufacturer Shop Manufacturer
Engineers Qualified Refrigeration Engineers and Refrigeration Mechanics
Electrical engineers Quality Engineers Aerospace avionics design engineers Embedded software (firmware) developers (software
engineers) Power Engineer Supervisors/Managers
Supply Chain Workers Supply chain specialists Supply Chain managers
Machine Operators and Assemblers
Machinists and mechanical technologists Machine Operators Fabricators AutoCAD operators
Sales and Customer Service Representatives
Sales people Customer Service Representatives
Labourers Log Scalers Logistics Specialists Logistics specialists Administration Administrative support
Quality Assurance/Food Safety Manager Project managers
Employers also selected areas that they believe prospective employees fail to meet the
requirements for positions offered by their companies. The most frequently mentioned reasons
that job applicants fall short relate to company-specific knowledge and skills and experience with a
specific manufacturing operation. When these issues are set aside applicants typically fall short in
terms of their attitude, business knowledge, and work experience. The following figure provides a
breakdown of the reasons job applicants fail to meet position requirements. These reasons apply to
all occupations offered by the region's manufacturers.

41 | P a g e
Figure 13: Reasons for Failure of Job Applicants to Meet Position Requirements
Employers were asked to consider a number of factors that they think will contribute to future skill
shortages that they expect to experience. While all of the factors listed were considered to impact
future skill shortages either a great deal or to some extent, employers seem to be most concerned
about the general skill shortage for the types of positions they have (82%), that relevant training
and education is not available in the region (76%), that other companies in the region and province
are competing for skilled workers (74%), and that the cost of living is a barrier to attracting
individuals from other parts of the province and the country in general (64%). The following figure
provides a breakdown of the factors that companies think will contribute to future skill shortages.
40
17
26
23
15
22
26
22
18
19
12
18
6
0 5 10 15 20 25 30 35 40 45
Experience with a specific manufacturing …
Management experience
The amount of work experience
Business knowledge or business acumen
Knowledge of and ability to apply LEAN …
Ability to lead change
Company specific trades requirements
Attitude or commitment towards work
Communication skills
Level of education, training, or certification
Ability to learn on the job
Ability to work with or manage people
Other essential skills
Number of Companies Responding

42 | P a g e
Figure 14: Factors Contributing to Future Skill Shortages
3.1.6. Strategies to Address Skill Shortages
The final section of the survey asked employers to consider actions that could be considered by the
manufacturing industry, training providers, or government to address identified and future skills
shortages. While there was general support for many of the actions listed in the survey, the top
three actions supported by employers were:
Increase the amount of internal training provided to employees
Increase the amount of formal training provided by external training providers
Develop initiatives to retain workers who are trained in the region to work within the
region
The following figure provides a breakdown of the responses from companies. It is also worth
noting that hiring temporary foreign workers to address anticipated skill shortages was the least
preferred strategy selected by companies.
There is a general
shortage of skilled
workers for the types of positions in
our company
Relevant training and education is not readily available in the region
Competition from other
companies in the
region and province
Retirement of skilled workers
The cost of training
available in the region is too high
The quality of training
in the region is
not sufficient to
meet our company's
needs
The cost of living in the region is a barrier to attracting
individuals from other parts of BC
or from other
provinces
Skilled workers are
not interested in the type of work we
have to offer
A great deal 41 41 22 19 13 27 30 6
To some extent 41 36 52 38 42 34 34 36
Not at all 9 13 14 28 33 23 25 44
41 41
22 19
13
27 30
6
41
36
52
38 42
34 34 36
9 13 14
28
33
23 25
44
0
10
20
30
40
50
60
Pe
rce
nta
ge
of
Co
ma
pn
ies

43 | P a g e
Figure 15: Actions to Address Skill Shortages
Employers also were asked to provide comments concerning strategies that Vancouver
Island/Coastal region manufacturers and government could initiate to increase the sector's
productivity. The following table provides a thematic summary of the comments provided.
Table 10: Summary of Employer Comments Concerning Sectoral Strategies
Develop industry specific training programs
Establish industry specific training programs that suit our business rather than through the BC
apprenticeship system and have a mechanism for them to become certified in our sector.
There is not enough support for LEAN Programs on the island. Training should be developed in
this area.
There is no training in Canada for the type of skilled workers we require and we look to
European trained workers to fill our requirements. We can train in house, but the government
training programs are for offsite training and don't help us.
We require more skills that are specific to e-commerce channel for our business. It is not hard for
us to find production workers. It is difficult to find workers who are interested in providing in-
house computer and administrative support.
For machinists, there will be a continued shortage of skilled labour. A lot of our machinists are
aging and apprenticeships need to be encouraged. Dockyard should be part of a machinist
training program (in addition to BCIT) where the facility is used to train new apprentices and
then release them after a specified timetable. As it is now we compete with our own government
to get and keep machinists in the local area. Not a good environment!
29
34
26
19
25
17
10
20
8
24
0 5 10 15 20 25 30 35 40
Increase the amount of internal training provided to employees
Increase the amount of formal training provided by external training providers
Develop initiatives to retain workers who are trained in the region to work within the region
Begin or enhance an existing LEAN training initiative
Begin or enhance an existing soft skills training initiative
Implement new technologies to reduce labour requirements (e.g. robotics, automation)
Contract out some functions or certain types of work
Hire new or recent skilled immigrants to fill job vacancies
Hire temporary foreign workers with the required skills
Market and promote job openings to specific target audiences
Number of Companies Responding

44 | P a g e
Lack of short duration skills upgrade courses such as electronic bench technician and electronic
assembly to IPC standards is a problem. Presently, the only option seems to be to pay for a
worker to travel to Washington state for several days to take an upgraded course or to hire a
(expensive) consultant to lead an in-house training session. The latter is too expensive to do for
just 1 or 2 people.
Improve local training
I think a key question is what are the pain points of small business in the region? What can be
done to address these pain points? On the training front, I have not found local training for my
employees. They may exist, but I have not found it easy to find information about them.
Promote and encourage soft skills training.
Affordable housing and transportation
Cost of housing is prohibitive for entry to mid-level employees. Better programs to accommodate
this population base would assist in attracting and retaining qualified staff.
Better public transportation is needed in the area. Higher frequency and extended hours.
Government support for local manufacturers
Government initiatives to increase manufacturing in the area would be very beneficial. An
increase in the manufacturing base would give us a larger pool of qualified candidates to draw
from.
Continue programs such as the Canada Job Grant to promote internal/external training and make
it cost effective.
Promote and profile the industry
Government and manufacturing associations could do a better job at highlighting and profiling
what manufacturing is going on here. We export to Asia and USA but when government does a
trade mission it seems to us that they are fronting for the big companies.
The government could help by advertising what coming to work in BC could mean to one's life, as
well as one's career. The scariest part of people wanting to come and work here is the limitation
of skilled worked on the island, or at least that is the perception. There may be a way to attract
companies and skilled employees through tax incentives, or other benefits to make the relocation
easier. The lack of individuals who have worked for larger organizations and can bring diverse
skills sets can hamper the growth and expansion efforts of the company as a whole. Have an
incentive to come to the island is a way to have growth of island companies. Bringing individuals
here who have diverse and advanced skills sets would raise the level of the organizations on the
island, and enhance that image of being on an island.
Promote networking in the industry
Promote and encourage a network within the manufacturing sector to share best practices and
make training cost effective.
Manufacturing organizations should consider forming a more formalized manufacturing

45 | P a g e
association that had meetings and worked on strategies to create an environment that attracts
skilled workers to Van Island - perhaps somewhat like VIATEC.
Organize a pool of recently retired industry veterans that could be available for ongoing
consulting/training within businesses. Tighter cooperation between industry and educational
institutions to serve each other's needs. Cooperation between employers to increase the pool of
local expertise and keep schools accountable.
Financial Incentives
Government should consider providing financial incentives for employers to make investments in
developing succession for employees in the manufacturing sector for the duration of the turnover
period, which will occur over the next 10 years.
3.2. Summary of Themes Emerging from Employer Interviews
As mentioned earlier, 16 interviews of key manufacturing sector executives and senior managers
were conducted during the April – June 2016 timeframe. A protocol (i.e. a set of interview prompts
and questions) was used to guide the interview process. The resulting interviews were
conversational in tone and interviewees were encouraged to express their opinions on a broad
range of topics affecting the manufacturing sector in the region. Interviewees were asked to
describe what they consider the 'burning issues' for their company and the sector, to describe any
trends they are seeing in relation to skill requirements and productivity for the sector, and to
suggest any strategies that might be undertaken by the sector in collaboration with other
companies and government to address the issues identified.
The results of the interviews were subjected to a content analysis. A series of themes emerged from
this analysis. Company executives and managers interviewed reported:
1. A general lack of qualified candidates when hiring for positions;
2. A number of skills areas that are hard to fill;
3. Issues of concern with the programs offered by BC institutions and the quality of graduates
from BC programs;
4. A number of factors affecting the recruitment and retention of workers;
5. A number of factors that have an impact on the productivity of their companies;
6. The need for more industry collaboration;
7. Immigration and foreign worker issues that impact their companies;
8. The need for more training that is specifically targeted at industry needs;
9. A number of workplace trends that they are observing; and
10. Strategies that could be considered to address issues in the sector.
1. Lack of Qualified Candidates
A number of those interviewed referenced the difficulty finding candidates who had sufficient
technical experience and education to operate equipment. This was particularly evident in the
electrical and mechanical areas and in the operation of CNC and PLC equipment.

46 | P a g e
2. Hard to Fill Skill Areas
Interviewees reported that the following skill areas or positions requiring these skills were
particularly difficult to fill:
Supply chain negotiation;
Purchasing and procurement across cultures;
Supporting electronic networks (firmware and software);
Leaders who can identify soft skills gaps;
Root cause analysis skills;
LEAN manufacturing issues and approaches; and
Complex electronic design and testing.
3. Issues with BC Training Institutions
Company executives and senior managers were generally concerned about the degree to which BC
training institutions were not addressing their needs for skilled workers. There were also concerns
expressed about the availability of programs that incorporate specific skills or knowledge (e.g.
LEAN, loss control measurement, communication skills). The quality of recent graduates was also
cited as an issue. A major issue identified related to what industry representatives consider a lack
of collaboration with manufacturers.
4. Factors Affecting Recruitment and Retention of Workers
A small number of interviewees mentioned issues that affect their ability to recruit and retain
workers. The issues mentioned relate primarily to the high cost of living on the island and the
ability (or inability) of workers to adapt to the workplace culture.
5. Factors Affecting Productivity
Two issues were frequently mentioned by interviewees as critical to their productivity. These were
supply chain issues which dealt with the lack of local suppliers and indirectly to the low Canadian
dollar. Challenges related to shipping products on and off the island and receiving supplies were
also mentioned. A number of manufacturers in the region are using various technologies to
automate aspects of their business operations to ensure that they remain competitive.
6. The Need for Industry Collaboration
Interviewees expressed the need for greater collaboration and cooperation among regional
manufacturers to address common problems. There was a general feeling that collaboration is
needed but there isn't currently a vehicle to ensure that this happens.
7. Immigration and Foreign Worker Issues
The majority of interviewees indicated that they do not use foreign workers through government
programs. The main reasons given are that the programs are too onerous to be worth the
investment of time, particularly for smaller companies and concerns about how the skills of
offshore workers have been validated.

47 | P a g e
8. Training to Meet Industry Needs
This theme is closely related to the issues raised about BC institutions. Interviewees are looking
first for the right attitude and approach to working in their companies and secondly for the right
skill set. Institutions do not appear to be addressing these issues.
9. Workplace Trends Observed
Interviewees were asked what trends they observed in terms of the workplace. The trends
mentioned were related to the need for employees to have a strong sense of work-life balance, the
challenges of managing in a multi-generational workplace and the need to ensure that new and
younger workers understand how to work within the culture of a manufacturing company.
10. Strategies to Address Sectoral Issues
Although the focus of the interviews was primarily on the identification of important issues and
trends, several interviewees did offer suggestions concerning strategies that could be used to
address specific issues. There was really no common theme that emerged but promotion of careers
in the sector and greater opportunity for secondary school students to participate in pre-
apprenticeship training related to the sector were both given as possible ways to address future
skill shortages in the sector.
Some illustrative comments for each of the themes noted above are provided in the following table.
Table 11: Themes Emerging from Interviews with Vancouver Island/Coastal Region Manufacturing Companies
Themes Sample Statements
1. Lack of qualified
candidates
Problem finding qualified candidates in the security
field
To remain competitive it is necessary to find qualified
individuals in the electrical/mechanical areas that will
qualify for work with military suppliers (ISO 10001
certified)
Need more qualified CNC (computer numerical
control) operators
PMP (Project Management Professional) certified staff
are needed but the programs are difficult to get into
There is a general labour shortage in the food industry
Production workers in the aerospace sector are in
short supply
It is hard to find application engineers/programmers
We need to automate to remain competitive but can't
find enough trained PLC (programmable logic
controller) operators. Consequently we rely on vendor
training to bring our staff up to speed on new
technologies.

48 | P a g e
Themes Sample Statements
Can't find enough journeyperson electricians to meet
our needs
There is a shortage of industrial sewing machine
operators - no college level training available so we
have to do it in-house. This could be an area where an
apprenticeship program would be helpful.
2. Skills that are hard to find We need people who are trained to do supply chain
negotiation
Individuals with professional purchasing certification
qualifications needed
Finding the right people for roles in supporting
electronic networks (firmware and software) is very
difficult
Leaders who are able to identify soft skills gaps is a
common problem across the manufacturing sector
Need high level of technical skills to deliver custom
solutions - key skill areas are in the design,
development and manufacture of train electronics
Skills to provide root cause analysis are lacking - have
to internally train staff to provide customer support
that is both customer centric and technical at the same
time
Procurement skill set is lacking - need individuals who
are able to both purchase and negotiate cost across
cultures
Need all staff to have a better understanding of LEAN
manufacturing issues and approaches
Difficulty getting the right skill set - semi-skilled to
highly skilled needed - 3 - 6 month training window for
new hires - challenge is find staff on short notice.
Testing is a high end skill set that is hard to find.
3. Issues with BC institutions At least one college is competing with industry (Note:
the interviewee offering this comment referred to the
use of the college's facilities and equipment to meet the
manufacturing needs of small companies in the region
which was viewed as being in direct competition with
companies that provide the same services)
Institutions are not listening to industry - collaboration
is missing.
Recent graduates from institutions are not aware of

49 | P a g e
Themes Sample Statements
what impacts profitability in manufacturing (also
knowledge of continuous improvement, LEAN and loss
control measurement are not taught or learned)
Institutions are validating their own perspectives and
as a result companies are addressing their own
training needs rather than relying on the post-
secondary system.
There are not enough apprenticeship seats on the
island.
Manufacturers expressed concerns about the quality of
grads in the steel/metal fabrication areas.
We look to Ontario (Conestoga College) and then
Germany for individuals who are trained in wood
manufacturing.
Students are learning 'old stuff' from 'old guys' - not
contemporary in terms of what industry is doing.
We need CNC operators and the colleges aren't training
them since there isn’t a program on the island.
We have to go to Ontario for tool maker training.
4. Factors affecting
recruitment and retention
of workers
Cost of living on the island is high (out of hundreds of
candidates only one or two will relocate
Candidates must fit the culture of the company
5. Factors affecting
productivity
Supply chain issues (shipping on and off the island is
challenging)
Supply chain issues re: industry requirements for
organic BC products to use in wine manufacturing
Regulatory changes need to continue to be made in the
wine industry in order for it to grow and become more
productive
Shipping on and off the island is an issue
Supply chain presents challenges given the low
Canadian dollar (most supplies are bought in US$)
Need to become more competitive through automating
processes
Business has changed so that we now have to import
raw and manufactured materials from upwards of 30
countries to make our products
We export most of our products but have to import
raw materials - duty is a serious concern for the long
term viability of our business.

50 | P a g e
Themes Sample Statements
6. The need for industry
collaboration
We have outgrown VIATEC and need another vehicle to
collaborate with industry partners
Need for collaboration among manufacturers
Needs to be more networking and collaboration in the
industry
Need to be able to tap into a broader training,
recruitment network to address the shortage of people
with the skills and the shortage of training available
7. Immigration and foreign
worker issues
Current foreign worker process doesn't lend itself to
easy hiring. We are not producing enough high tech
grads to satisfy demand unlike in the US
Immigration - need a good understanding of
immigration law to work in the sector
No direct hiring of immigrant or foreign workers
Immigration issues - Canadian based standards – need
to validate the skills of off-shore workers in relation to
Canadian standards. Applies to interprovincial as well
as offshore workers.
8. Training to meet industry
needs
Trades programs don't train for soft skills
We hire for attitude and train for the position
A 'can do' attitude is most important when hiring
On the island training is difficult to acquire - LEAN
training hard to find on the island - more costly
Recent graduates from institutions are not aware of
what impacts profitability in manufacturing (also
knowledge of continuous improvement, LEAN and loss
control measurement are not taught or learned)
9. Workplace trends
observed
Work-life balance
Managing in a cross-generational workplace
Scalability is based on the development of stable
workforce that work in project managed teams
A shift in culture is needed to accommodate a new
generation of workers
The Manufacturing culture is foreign to young island
employees
10. Strategies to address Cross-training workforce in a downsizing environment

51 | P a g e
Themes Sample Statements
sectoral issues Grow the capacity and infrastructure to establish
reliable supply chains for island/coastal manufacturers
Promotion of the manufacturing sector with young
people is needed to increase awareness of the range of
job opportunities that exist
There need to be more high school apprenticeship
programs related to the marine trades and more co-op
programs for the marine trades

52 | P a g e
4. Summary: Key Issues and Strategies The online survey and interviews conducted as a part of the this LMI research study revealed
several important training and skills development issues that are of general concern to
manufacturing companies in the Vancouver Island/Coastal region. While there are other issues
that are also of concern that affect the productivity of some companies such as supply chain issues
and the low Canadian dollar, the focus of this section of the report is on skills training and
development issues since that is the overall purpose behind the Labour Market Partnership project
with VI/Coastal region manufacturers.
4.1. Key Issues
The skills training and development issues that are seen as important to the future development
and growth of the manufacturing sector in the region can be summarized as follows:
1. Skill Shortages
The region's manufacturers identified a number of positions with skills that are difficult to
fill. These included: supply chain positions involving negotiation with offshore suppliers,
procurement positions requiring purchasing and negotiation across cultures, a variety of
management and operational positions requiring knowledge and application of LEAN
manufacturing principles (including root cause analysis), positions involving complex
electronic design and testing, and a range of positions requiring soft skills (i.e.
communication, collaboration, teamwork, etc.). Design and other types of engineers, project
managers, machinists, metal fabricators, and machine operators (CNC and PLC) were also
difficult to find.
There is also a general concern expressed by companies that there is a lack of qualified
candidates in the region with sufficient technical and education experience (e.g. electrical
and mechanical engineering and the operation of CNC and PLC equipment were often
mentioned as skill sets that were difficult to find) to effectively operate within local
manufacturing environments. As a result companies have had to train internally (or in
some cases use vendor or third party consultants and trainers) to address skills issues since
educational institutions do not appear to be offering programs and training that matches
industry needs.
2. Quality and Availability of Training
Both the survey results and the interviews revealed a general dissatisfaction with the
quality and availability of training in the region and more broadly in the province. Concerns
were expressed about the quality of graduates of BC's institutions and their readiness to
work on the job in a manufacturing environment. Some concerns focused on technical
preparedness (i.e. prospective employees did not have the requisite technical skills) while
at other times it was a question of fit with the culture of the company and attitude.

53 | P a g e
As mentioned earlier in this report, companies in the region are generally concerned about
the degree to which BC training institutions are addressing their need for skilled workers.
There is a lack of availability of programs that incorporate specific skills or knowledge (e.g.
LEAN, loss control measurement, communication skills) and the result is that graduates
from BC institutions applying to work in the manufacturing sector are not prepared to do so
'out of the gate'. In other words, regional manufacturing employers find that graduates do
have good general skills but not the ones that are specific to their industry. Employers
finding candidates who are a fit with the company are then tasked with having to internally
train these individuals so that they are ready to assume their roles on the shop floor or in
the front office. This results in reduced productivity while new employees are being trained
by existing employees or other parties who have been brought in to provide training.
Another major issue identified by companies was a lack of collaboration on the part of BC's
educational institutions with manufacturers. There is a strong feeling that institutions are
not working with industry to understand their needs and customize programs to address
these needs. For VI/Coastal region companies this is a particular challenge since a number
of the institutions that could address their skills training needs are not in the region. At the
same time, it is important to note that in this phase of the labour market partnership sector
partners did not raise these issues with representatives from post-secondary institutions
directly. Given the importance of this issue to the province and the region's post-secondary
institutions collaboration efforts will be initiated as a part of the work undertaken in Phase
3.
3. The Changing Nature of the Workforce
Companies involved in the research indicated that they employed workers across a range of
ages including those who are 65 or older. For some companies, this mix of generations
presents significant operational and training challenges. Younger workers have a strong
need for work-life balance and want to work for employers who are prepared to provide
them with working conditions that are compatible with their personal lifestyle choices.
This represents a significant cultural shift for many manufacturing companies that have
operated in more traditional ways. This shift affects the ability of companies to attract and
retain workers and although the workforce for the companies involved in this research is
generally quite stable (i.e. little turnover), going forward one can assume cultural workplace
changes will have an impact on companies in the region. Manufacturers will need to be
prepared to address these changes.
The data collected as a part of this LMI research study suggests that VI/Coastal region
manufacturers are not entirely satisfied with post-secondary programs in the region.
Manufacturers are concerning that available programs are not aligned with their priorities and
needs for skilled workers. At the same time, regional manufacturers acknowledge the importance
of defining their needs in a way which enables post-secondary institutions to respond to their

54 | P a g e
needs. Regional manufacturers have a strong desire to grow the sector but accessing training that
helps them increase their productivity is a barrier.
At the same time, regional manufacturers are very interested and willing to work with BC
institutions and involve them in the design of offerings that address specific high priority needs.
Companies recognize the importance of speaking with a single voice so that post-secondary
institutions are not trying to respond to individual company needs. It has been difficult for
institutions to adapt their programs to meet the needs of individual companies since typically the
volume that is necessary to justify the development of customized training solutions has not been
present.
4.2. Strategies to Address Issues
To overcome these obstacles and to help the manufacturing sector in the region grow and become
more productive, it is important for manufacturers, the region’s post-secondary institutions, and
government to collaborate to address the important skills gaps that have been identified.
Collaboration needs to look different than it might have in the past. Industry must be seen as an
equal partner with institutions. Government has (through initiatives such the Canada-BC Job Grant
Program) played an important role in providing support and removing barriers that inhibit the
creation of training programs that will address high priority skills issues identified by industry.
These efforts need to continue and expand.
Of critical importance to the individuals surveyed and interviewed is that the information gathered
through this LMI research project leads to positive action. As a result a number of strategies were
suggested that could be used to address the issues identified above. While these strategies will
have to be reviewed and 'fleshed out' in greater detail through Phase 3 of this Labour Market
Partnership project, the ideas they represent should be highlighted here:
1. Improve the Quality of Training
Areas that need to be addressed to deal with the skills gaps identified and the inability
of manufacturers in the region are:
Develop industry-specific training programs. Clearly, this would have to involve
a concerted effort on the part of government, BC institutions, and regional
manufacturers and while there are some mechanisms in place to address
aspects of training program development such as the ITA, these have not
resulted in the types of programs that are required by local manufacturers;
Improve the availability to industry-specific training locally. Again, addressing
the problem identified by regional manufacturers in terms of access to
appropriate training is one that needs to involve government, educational
institutions, and manufacturers; and
Develop initiatives to retain workers who are trained in the region to work
within the region.
Increase the amount of formal training available in the region provided by
external training providers

55 | P a g e
2. Support and Promote Regional Manufacturers
A number of possible ways to attract potential employees to the sector (and thereby
address current and anticipated skill shortages) were put forward. These included:
Working with government and industry in partnership to promote VI/Coastal
manufacturers (promotion could take a number of forms but would be intended
to profile the industry and make it more "visible" to prospective employees and
the general public);
Providing more opportunities for secondary students to participate in pre-
apprenticeship/apprenticeship training related to jobs in the sector; and
Providing financial incentives to employers to make investments in succession
planning.
3. Increase Collaboration Among Regional Manufacturers
Regional manufacturers expressed the desire for greater collaboration and cooperation
among companies to address common problems including skills shortages but
specifically in relation to skills training and development. This could be done through:
Developing and promoting a collaborative network of regional manufacturers
(while industry associations exist, none seem to be addressing the issues
commented on by those responding as a part of this research); and
Developing a regional manufacturing 'centre of excellence' which could serve as
a hub for sourcing and providing expertise for regional companies and provide
programs and training based on identified industry needs.
Structures, mechanisms and details concerning how to move forward on strategies will be
undertaken as a part of Phase 3 of the LMP with the VI/Coastal manufacturing sector.

Appendix 1: Vancouver Island/Coastal Region Manufacturing Company Database
Company Municipality/City Web Address NAICS Category
A&M Marine Nanaimo http://www.ammarine.ca/ 339
AAA Rebar Only Ltd Central Saanich http://www.aaarebar.com/home.html 332
Abeego Designs Victoria http://abeego.com/ 339
Accent Refrigeration Victoria http://www.accent-refrigeration.com/ 339
Access Panel Solutions Victoria http://www.accesspanelsolutions.com/ 321
Acoustics West Manufacturing Saanich http://www.acousti-trac.com/index.php 337
AGO Environmental Esquimalt http://www.agoenvironmental.com/home 339
Alliance Engineering Works Victoria http://www.alliance-works.com/ 332
AML Oceanographic Sidney http://www.amloceanographic.com/ 332
ASL Environmental Victoria http://www.aslenv.com/ 332
Associated Sheet Metal Central Saanich http://associatedsheetmetal.com/ 332
AXYS Technologies Victoria http://axystechnologies.com/ 333
B&F Manufacturing / Quadra Jet Nanaimo http://quadrajet.ca/ 333
Babcock Canada Victoria https://www.babcockinternational.com/Locations/Canada 336
Benson Industries Central Saanich http://www.bensonindustries.ca/index.php 321
CAMACC Victoria www.camacc.com 334
Campbell River Netloft Campbell River http://crnetloft.ca/ 339
Canoe Brew Pub Victoria http://www.canoebrewpub.com/ 312
Carmanah Technologies Victoria http://carmanah.com/ 335
Catalyst Paper Crofton / Powell River / Port Alberni
No web address
Category 12 Brewing Central Saanich http://category12beer.com/ 312
Cdn Bavarian Chemainus http://canbav.ca/ 321

57 | P a g e
Company Municipality/City Web Address NAICS Category
CMI Custom Machining Ltd Central Saanich http://cmimachining.com/ 332
Coastland Wood Industries Nanaimo http://coastlandwood.com/ 321
Codan Radio Communications Victoria http://www.codanradio.com/ 334
Coulson Group Port Alberni http://coulsoncedar.com/ 339
CR Metal Fabricators Campbell River http://www.crmf.bc.ca/ 332
Crest Sheet Metal Victoria http://www.crestsheetmetal.com/ 332
Daigle Welding & Marine (Eagle Craft Boats)
Campbell River http://eaglecraft.bc.ca/ 336
De Vine Wineyards Central Saanich www.devinevineyards.ca 312
Discovery Trekking Campbell River http://www.discoverytrekking.com/ 315
Duncan Iron Works Duncan http://www.diw.ca/ 332
ElectroWear Manufacturing Errington http://electrowear.ca/index.php 315
EMCS Industries Victoria http://emcsindustries.com/ 334
Epicure Victoria https://epicure.com/en 311
ESI Environmental Sensors Sidney http://www.esica.com/index.php 333
Express Custom Mfting Port Alberni http://www.expresscustom.ca/index.php 332
Fanny Bay Oysters Union Bay http://www.fannybayoysters.com/ 311
Fast Signs Victoria https://www.fastsigns.com/652-victoria-bc-canada/ 339
Firebozz Nanaimo http://www.firebozz.com/ 339
First Light Technologies Victoria http://www.firstlighttechnologies.com/Index.aspx 335
FTS Environmental Victoria http://ftsinc.com/ 334
Garside Signs & Displays Victoria http://www.garsidesigns.com/ 339
Geo Tech Crofton http://www.geotechindustries.com/ 332
Grant Signs Campbell River http://www.grantsigns.ca/ 339
Graphic FX Sign Works Victoria http://www.382sign.com/ 339
Great Little Box Company Victoria http://glbc.com/ 339
Green Mountain Aviation Sidney http://www.greenmountainaviation.com/ 336
Greg's Furniture & Upholstery Victoria http://www.greggsfurniture.com/ 321
Harbour City Kitchens Central Saanich http://harbourcitykitchens.com/ 321

58 | P a g e
Company Municipality/City Web Address NAICS Category
Heo Works Industries Langford http://heoworks.com/corporate/ 323
Hobson Woodworks Langford http://www.hobsonwoodworks.com/ 321
Holdfast Metalworks Nanaimo http://www.holdfastmetals.ca/ 332
Imperial Welding Chemainus http://www.imperialwelding.com/ 331
Industrial Plankton Victoria http://industrialplankton.com/
International Aeroproducts Courtenay http://www.intaero.net/ 336
Inuktun Nanaimo http://www.inuktun.com/ 333
Iris Dynamics Victoria https://vs3.irisdynamics.com/ 335
Island Farms (Agropur Division Natrel )
Victoria http://islandfarms.com/ 311
Island Overhead Doors Nanaimo http://www.islandoverheaddoors.com/ 337
Island Precision Manufacturing Central Saanich http://www.islandprecision.com/#home 321
Island Truss Courtenay http://islandtruss.ca/ 321
Islands West Saanich http://www.islandswest.com/ 311
JB Sheet Metal Ltd Victoria http://jbsheetmetal.com/ 331
Jemico Enterprises Chemainus http://www.paulcan.com/jemico-enterprises-ltd 321
Jespersen Boat Builders Sidney http://www.jespersenboats.com/ 336
JS Foster Central Saanich http://www.jsfoster.com/ 332
K& S Railings Nanaimo http://www.kandsrailings.ca/index.php 332
Keltic Seafoods Port Hardy http://www.kelticseafoods.com/index.html 311
Landmark Sign Victoria http://www.landmarksign.net/ 339
Lane Light Victoria http://www.itemltd.com/ 335
Latitude Tech Saanich http://latitudetech.com/ 336
Lifetimer Boats Duncan http://www.lifetimerboats.ca/ 336
Lighthouse Brewing Esquimalt http://www.lighthousebrewing.com/ 312
Live Edge Design Duncan https://www.liveedgedesign.com/ 337
Market Group Ventures Shawnigan Lake http://www.mgvinc.com/ 339
Merridale Estate Winery Cobble Hill http://www.merridalecider.com/ 312
Metal Tech Industries Chemainus http://www.metaltech.ca/ 332

59 | P a g e
Company Municipality/City Web Address NAICS Category
Modern Aluminium & Vinyl Products
Powell River http://www.modern.ca/ 339
Modern Windows Courtenay / Powell River http://www.modern.ca/ 339
Morinwood Victoria http://www.morinwood.ca/index.html 321
Nanaimo Forest Products (Harmac)
Nanaimo http://www.harmacpacific.com/ 321
Nanaimo Precast Nanaimo http://www.nanaimoprecast.ca/ 339
Natural Glacier Waters Fanny Bay http://www.naturalglacialwaters.com/ 312
Natural Pastures Cheese Courtenay http://www.naturalpastures.com/home/ 311
Nelson Roofing & Sheet Metal Cumberland / Powell River / Campbell River
http://www.nelsonroofing.com/ 332
NFE Manufacturing Chemainus http://www.nanaimofoundry.com/ 332
Nicholson Manufacturing Victoria http://www.debarking.com/index.html 333
Noboco Styro Containers Campbell River http://www.noboco.com/ 339
NorthWest FabWorks CNC Machining & Fabrication
Parksville http://www.northwestfab.com/ 332
NSM Metal Fabricators Nanaimo http://www.nanaimosheet.com/ 332
Oceanetic Measurement Sidney http://www.oceanetic.com/ 332510
Oceanus Reinforced Plastics Sidney http://oceanusplastics.com/ 326
Ooh La La Cupcakes Victoria http://www.oohlalacupcakes.ca/ 311
Oughtred Coffee Victoria http://www.oughtred.com/ 312
Pacific Energy Duncan http://www.pacificenergy.net/ 333
Paradise Island Foods Nanaimo http://www.paradise-foods.com/ 311
Peetz Manufacturing Victoria http://www.peetzoutdoors.com/ 339
Peninsula Signs Sidney http://www.peninsulasigns.ca/ 339
Philbrooks Boatyards Victoria http://www.philbrooks.com/ 336
Plastics Plus Fabricating Campbell River http://www.plasticsplusfabricating.com/ 326
Playsted Sheet Metal Victoria http://playsted.com/ 332
Point Hope Maritime / RalMax Victoria http://pointhopemaritime.com/ 332

60 | P a g e
Company Municipality/City Web Address NAICS Category
Pollen Sweaters Lund http://www.pollensweaters.com/ 315
Powell River Forest Products Powell River [email protected] 321
Pro Elvis Jumpsuits Nanaimo http://www.proelvisjumpsuits.com/ 315
Pro Mac Manufacturing Duncan http://www.promac.bc.ca/ 332
Profab Manufacturing Chemainus http://www.profabmanufacturing.net/ 336
Professional Components Sidney http://professionalcomponents.com/ 333
Prototype Equipment Victoria http://pedcan.com/ 332
Quality Box Duncan http://www.qualitybox.ca/ 339
Quester Tangent Victoria http://www.questertangent.com/ 336
Rack-A_Tiers Saanich http://www.rack-a-tiers.com/ 335
Red Arrow Brewing Duncan http://redarrowbeer.ca/ 312
Redlen Technologies Victoria http://redlen.ca/ 334
Reliable Controls Victoria http://reliablecontrols.com/ 334
Rockland Scientific Victoria http://rocklandscientific.com/ 334
Rocky Creek Winery Cowichan Bay http://www.rockycreekwinery.ca/ 311
Schneider Electric Victoria http://www.schneider-electric.ca/en/ 334
Scott Plastics Victoria http://www.scottplasticsltd.com/ 326
SCS Steel Container Systems Nanaimo https://scsinc.ca/ 332
Sea Flora Sooke http://www.sea-flora.com/ 339
Sealand Aviation Campbell River http://www.sealandaviation.com/ 336
Seamor Marine Nanaimo http://seamor.com/ 333
Seaspan Victoria Shipyards Victoria http://www.seaspan.com/victoria-shipyards 336611
Seastar Chemicals Victoria
Seaward Kayaks Chemainus http://www.seawardkayaks.com/ 339
Shelter Point Distillery Campbell River http://www.shelterpointdistillery.com/ 312
Sherwood Industries Central Saanich http://sherwoodindustries.ca/ 332
Sign Wace Designs North Saanich http://signwavedesigns.com/index.html 339
Southside Welding Campbell River http://www.southsideweldingcr.com/ 332
Specific Mechanical Systems Central Saanich http://specificmechanical.com/ 332

61 | P a g e
Company Municipality/City Web Address NAICS Category
Spinnaker's Brewpub Victoria http://www.spinnakers.com/ 312
Starfish Medical Saanich
Sure Grip Controls Victoria http://www.suregripcontrols.com/ 326
Surefloat Engineering - Engineered Concrete Docks &
Marinas
Duncan http://www.surefloat.com/ 339
Swans BrewPub Victoria http://swansbrewpub.com/ 312
Talon Signs Victoria http://talonsigns.com/index.html 339
Tara Precision Central Saanich http://taraprecision.com/ 337
Terra Remote Sensing Victoria http://www.terraremote.com/ 334
Thermoproof Windows Chemainus http://www.thermoproof.ca/ 337
Thrifty Foods Victoria www.thriftyfoods.com 311
Tilly's Gallery Campbell River http://www.tillysgalley.ca/default.asp 311
Tilray Nanaimo https://www.tilray.ca/ 311
Titan Boats Victoria http://www.titanboats.com/ 336
Tower Fence Victoria http://www.towerfence.ca/ 339
Tower Kitchen & Millwork Sidney http://tkmw.ca/ 321
Town Site Brewing Powell River http://townsitebrewing.com/ 312
Tran Sign Langford http://www.transign.com/traffic/index.php 339
UK Sailmakers Sidney http://www.uksails.ca/ 336
United Engineering Victoria http://unitedengineering.ca/ 332
Universal Sheet Metal Central Saanich http://www.universalsheetmetal.ca/index.htm 332
Unsworth Vineyards Mill Bay www.unsworthvineyards.com 312
Van Ilse Windows Victoria http://www.vanislewindows.com/ 339
Van Isle Millwork & Kitchens Courtenay http://van-isle.com/ 337
Vancouver Island Brewery Victoria http://vanislandbrewery.com/ 312
Viberg Boot Victoria http://workboot.com/ 315
VIH Aerospace Victoria http://www.vih.com/ 336
Viking Air Victoria http://www.vikingair.com/ 336

62 | P a g e
Company Municipality/City Web Address NAICS Category
VMAC Nanaimo http://vmacair.com/ 333
Walker Technologies Courtenay http://www.walkersys.com/index.html 334
Wescon Doors (Cedar) Duncan http://www.wescondoors.com/ 321
West Isle Industries Langford http://www.westisle.net/ 321
West Wind Hardwoods Sidney http://www.westwindhardwood.com/ 321
Western Forest Products Nanaimo (all Island) http://www.westernforest.com/ 321
White Sails Brewing Nanaimo http://whitesailsbrewing.com/ 312
Wolf Boats Courtenay http://www.wolfboats.com/index.php 336
Wolf Brewing Company Nanaimo http://www.wolfbrewingcompany.com/ 312
York Portable Machines Campbell River https://www.yorkmachine.com/index.php 332

Appendix 2: List of Companies Interviewed
Company Date of Interview CAMMAAC June 7, 2016
Coastland Wood Industries May 2, 2016 DeVine Vineyards May 31, 2016
FTS Environmental May 4, 2016 Morinwood April 26, 2016 Peetz Reels May 26, 2016
Peninsula Signs June 1, 2016 Pro-Mac May 2, 2016
Prototype Equipment Design June 6, 2016 Quester Tangent May 25, 2016 Reliable Controls May 27, 2016
Scott Plastics April 25, 2016 Suregrip Controls April 29, 2016
Titan Boats April 26, 2016 Viberg Boots April 20, 2016
Viking Air May 30, 2016

64 | P a g e
Bibliography American Society for Training and Development. (2012). Bridging the Skills Gap - Help Wanted,
Skills Lacking: Why the Mismatch in Today's Economy? Alexandria, VA: ASTD.
Australian Workforce and Productivity Agency. (2013). Human Capital and Productivity - Literature
Review. Canberra, AU: Australian Workforce and Productivity Agency.
Balakrishnan, J., Eliasson, J., & Sweet, T. (2007). Factors Affecting the Evolution of Manufacturing in
Canada: An Historical Perspective. Journal of Operations Management, 25(2), pp. 260-283.
Burt, M., & Poulin, V. (2008). Key Economic and Labour Force Issues Facing Canada's Manufacturing
Sector. Ottawa, ON: Conference Board of Canada.
Canadian Manufacturers and Exporters (CME). (2012). Labour Market Information Research for the
BC Manufacturing Sector. Vancouver, BC: CME.
Canadian Manufacturers and Exporters British Columbia. (2012). Labour Market Information
Research for the BC Manufacturing Sector. Vancouver BC: CME British Columbia.
Gosling, M. (2009). Positioning Paper - Business Performance and Skills. London, UK: City & Guilds
Centre for Skills Development.
Government of British Columbia - WorkBC. (2016). British Columbia 2025 Labour Market Outlook.
Victoria: Government of British Columbia. Retrieved July 26, 2016, from
https://www.workbc.ca/getmedia/00de3b15-0551-4f70-9e6b-
23ffb6c9cb86/LabourMarketOutlook.pdf.aspx
Government of British Columbia. (2011). British Columbia Trade Occupations Outlook. Victoria:
Government of British Columbia. Retrieved February 8, 2016, from
https://www.workbc.ca/WorkBC/media/WorkBC/Documents/Docs/BC_tradesoccupation
outlook.pdf
Government of British Columbia. (2015). Data BC. Retrieved February 10, 2016, from Data
Catalogue: http://catalogue.data.gov.bc.ca/dataset/labour-market-outlook
Government of British Columbia. (2015). Labour Market Statistics - Data Tables. Retrieved February
10, 2016, from BCStats:
http://www.bcstats.gov.bc.ca/statisticsbysubject/LabourIncome/EmploymentUnemploym
ent/LabourForceStatisticsAnnual.aspx
Government of British Columbia BC Stats. (2015). Manufacturing. Retrieved February 4, 2016, from
BC Stats:
http://www.bcstats.gov.bc.ca/StatisticsBySubject/BusinessIndustry/Manufacturing.aspx
Government of Canada. (2015). Statistics Canada. Retrieved February 4, 2016, from Government of
Canada: http://www5.statcan.gc.ca/cansim/a26?lang=eng&retrLang=eng&id=5510002

65 | P a g e
Harvey, O., & Harris, P. (2008). The Skills-Productivity Nexus: Connecting Industry Training and
Business Performance. Wellington, NZ: New Zealand Department of Labour & Industry
Training Federation.
International Labour Office. (2008). Skills for improved productivity, employment growth and
development. Geneva, Switzerland: International Labour Office.
International Labour Office. (2010). A Skilled Workforce for Strong, Sustainable and Balanced
Growth: A G20 Training Strategy. Geneva Switzerland: International Labour Office.
Kim, Y., & Ployhart, R. (2014). The Effects of Staffing and Training on Firm Productivity and Profit
Growth Before, During, and After the Great Recession. Journal of Applied Psychology, 99(3),
pp. 361-389.
Marshall, B., Cardon, P., Poddar, A., & Fontenot, R. (2013). Does sample size matter in qualitative
research?: A review of qualitative interviews in IS research. Journal of Computer Information
Systems, 11 - 22.
(No date). Table 281-0032 Survey of Employment, Payrolls and Hours (SEPH), average weekly hours
for employees paid by the hour, by overtime status and detailed North American Industry
Classification System (NAICS), unadjusted for seasonality. Retrieved from
http://www5.statcan.gc.ca/cansim/a26?lang=eng&retrLang=eng&id=2810032&&pattern=
&stByVal=1&p1=1&p2=31&tabMode=dataTable&csid=
Patrignani, P., & Conlon, G. (2012). Estimating the Impact of Training on Productivity using Firm-
level Data. London, UK: Department for Business, Innovation and Skills.
Presser, S., Couper, M., Lessler, J., Martin, E., J. Martin, J. R., & Singer, E. (2004). Methods for testing
and evaluating survey questions. Public Opinion Quarterly, 68(1), 109-130. Retrieved
February 4, 2016, from
http://isites.harvard.edu/fs/docs/icb.topic1352376.files/Presser%20et%20al%20Cognitiv
e%20Testing.pdf
Statistics Canada. (n.d.). Labour force survey estimates (LFS), employment by economic region based
on 2011 Census boundaries and North American Industry Classification System (NAICS),
annual (Persons), 2001 to 2015. Retrieved from
http://www5.statcan.gc.ca/cansim/a03?lang=eng&pattern=2820124..2820125
Statistics Canada. (No date). Table 282-0122 Labour force survey estimates (LFS) by provinces and
economic regions based on 2011 Census boundaries, 3-month moving average, unadjusted for
seasonality, monthly (Persons), Mar 2001 to Jan 2016. CANSIM (database). Retrieved from
http://www5.statcan.gc.ca/cansim/a26?lang=eng&retrLang=eng&id=2820122&pattern=2
820122..2820123&tabMode=dataTable&srchLan=-1&p1=-1&p2=-1
Statistics Canada. (No date). Table 282-0123 Labour force survey estimates (LFS), by provinces,
territories and economic regions base on 2011 Census boundaries. Retrieved from

66 | P a g e
http://www5.statcan.gc.ca/cansim/a26?lang=eng&retrLang=eng&id=2820123&pattern=2
820122..2820123&tabMode=dataTable&srchLan=-1&p1=-1&p2=-1
Statistics Canada. (No date). Table 282-0007 Labour force survey estimates (LFS), by North American
Industry Classification System (NAICS), sex and age group, unadjusted for seasonality, monthly
(Persons), Jan 1976 to Jan 2016. Retrieved from
http://www5.statcan.gc.ca/cansim/a03?lang=eng&pattern=2820007..2820008
Statistics Canada. (No date). Labour force survey estimates (LFS), employment by economic region
based on 2011 Census boundaries and North American Industry Classification System (NAICS),
3-month moving average, unadjusted for seasonality, monthly (Persons), Mar 2001 to Jan
2016. Retrieved from
http://www5.statcan.gc.ca/cansim/a03?lang=eng&pattern=2820124..2820125
Statistics Canada. (No date). Labour force survey estimates (LFS), employment by economic region
based on 2011 Census boundaries and National Occupational Classification for Statistics
(NOC-S), 3-month moving average, unadjusted for seasonality, monthly (Persons), Mar 2001 to
Dec 201. Retrieved from
http://www5.statcan.gc.ca/cansim/a03?lang=eng&pattern=2820126..2820127
Statistics Canada. (No date). Labour force survey estimates (LFS), by National Occupational
Classification for Statistics (NOC-S) and sex, unadjusted for seasonality, monthly (Persons), Jan
1987 to Dec 2015. Retrieved from
http://www5.statcan.gc.ca/cansim/a03?lang=eng&pattern=2820009..2820010
Statistics Canada. (No date). Labour force survey estimates (LFS), by National Occupational
Classification for Statistics (NOC-S) and sex, annual (Persons), 1987 to 2015. Retrieved from
http://www5.statcan.gc.ca/cansim/a03?lang=eng&pattern=2820009..2820010
Statistics Canada. (No date). Labour force survey estimates (LFS), employment by economic region
based on 2011 Census boundaries and National Occupational Classification for Statistics
(NOC-S), annual (Persons), 2001 to 2015. Retrieved from
http://www5.statcan.gc.ca/cansim/a03?lang=eng&pattern=2820126..2820127
Statistics Canada. (No date). Labour force survey estimates (LFS), employment by Aboriginal group,
North American Industry Classification System (NAICS) and age group, Canada and selected
regions, annual (Persons), 2007 to 2015. Retrieved from
http://www5.statcan.gc.ca/cansim/a03?lang=eng&pattern=2820226..2820233
Statistics Canada. (No date). Table 379-0030 Gross domestic product (GDP) at basic prices, by North
American Industry Classification System (NAICS), provinces and territories. Retrieved from
http://www5.statcan.gc.ca/cansim/a26?lang=eng&id=3790030